1
1 A Spreadsheet Model to Create Data-‐Driven Applications Using Online Data Kerry Shih-‐Ping Chang Ph.D. Thesis Proposal January 28th, 2015 Thesis Committee: Brad A. Myers (chair) (HCI, CMU) John Zimmerman (HCI and Design, CMU) Niki Kittur (HCI, CMU) Margaret M. Burnett (CS, Oregon State) 2 Abstract The Internet is full of all kinds of open data. Being able to easily use these data in custom ways could benefit many individuals. For example, a house buyer may want an application that takes a location and finds the average property price using a real-‐estate web service along with crime information in a CSV file downloaded from data.gov. Another example might be a restaurant manager who wants an application that regularly collects the restaurant’s reviews using Yelp’s web service and visualizes the correlations between the restaurant’s weekly sales and the average rating on Yelp. Creating such applications currently requires significant programming to retrieve data from web databases, manipulate the collected data into desired forms, and create interactive user interfaces to present the results. My dissertation presents a spreadsheet tool called Gneiss that makes contributions in significantly reducing the barriers to using online data and for creating data-‐
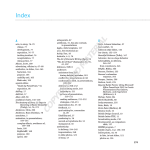
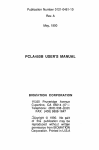
driven applications. Gneiss will include techniques to dynamically retrieve or stream data from a variety of data sources such as REST web services, web pages and mobile sensors, and to use the data in a spreadsheet without writing conventional code. It extends spreadsheets to handle structured data, streaming data and to facilitate data exploration in spreadsheets by introducing new spreadsheet functions and interaction techniques. Moreover, Gneiss allows the user to not only create visualizations of spreadsheet data but also to program interactive web applications that can dynamically present or modify spreadsheet data using only the spreadsheet language. With Gneiss, the user can create web applications that use data from multiple web sources or turn a spreadsheet into a database to store user input data from a web page. Gneiss targets end-‐users who are knowledgeable in spreadsheet programming. It supports all the above features using a consistent equation-‐based evaluation model familiar to spreadsheet users without the need for event-‐based programing. As with regular spreadsheets, Gneiss is a live programming tool and achieves a “programming-‐with-‐example” style as users develop programs with visible example values. This document discusses related work that motivates the design of Gneiss, presents the current Gneiss system and the proposed work, which includes several extensions to Gneiss to support spreadsheet data exploration and creating mobile web applications, and a plan for evaluation to refine and validate Gneiss’s features. 3 1. Introduction Much public and personal data now exist on the Internet. While some data are presented in the form of web pages, the increasing demand to make custom use of these data has led more and more data sources to publish their data as downloadable files or through web services. For example, the U.S. government publishes over 30,000 datasets of various topics such as climate, business and education on data.gov as XML, CSV, JSON and Excel files; Google provides web services for finance data, places and traffic information as well as personal calendars and social network feeds from Google+; and Fitbit provides web services of personal activity data collected from wearable devices. These sources provide many new opportunities for individuals who are interested in doing custom data analysis or creating custom applications that use data from online sources. Currently, to efficiently use online data often involves significant programming. First, to access data through web services usually requires writing a large amount of surprisingly intricate code that deals with asynchronous network calls which may fail to return, often requiring complex and sometimes nested call-‐backs. Second, much online data are in structured formats such as XML and JSON instead of table formats, making it difficult to process them using spreadsheets. As a result, using structured data often involves writing query languages such as XPath to extract the desired parts and then other imperative languages such as Python or JavaScript to manipulate the extracted data. Finally, to further build applications that can dynamically use online data sources requires even more programming skills than would be needed to create user interfaces that show static content. These barriers limit the ability to freely use the open data on the Internet to only developers who are familiar with web programming. My dissertation focuses on extending the familiar spreadsheet model for the Internet era to reduce the barriers of using online data for end-‐users. Conventional spreadsheets take local, static data and manipulate it to produce local, static graphs or charts. However, many data sources are no longer static files but dynamic data in web databases. Further, what many people want to create are also not static document files anymore but rather interactive websites or web applications that they want to enable others to use [43]. While conventional spreadsheets such as Google Sheets and Excel are being enhanced with some abilities to access web data and share content online, the spreadsheet model presented in my thesis will make new contributions in handling structured and real-‐time data from a variety of web data sources and allowing programming full-‐fledged interactive web applications. It will be a spreadsheet model that provides holistic support for interacting with data on the Internet, from collecting and manipulating data to publishing data-‐driven applications. 4 Figure 1. A screenshot of Gneiss. Gneiss bundles a spreadsheet editor (2) with a browser-like source pane for
loading online data (1), and a web interface builder where the user can create web pages using drag-anddrop (3)
This spreadsheet model is realized in an interactive programming environment called Gneiss1 (Figure 1). Like conventional spreadsheets, Gneiss is a live programming tool where new values are distributed throughout the program and reflected in the output as soon as the user makes an edit. It uses a “programming-‐
with-‐example” [26] style as it allows the user to develop programs using visible example values from real data sources. In summary, my research will make the following contributions: • It provides a unified model for utilizing data from a variety of sources such as REST web services, web pages, and mobile data sources such as sensor data, and allows the data to be retrieved or streamed to a spreadsheet and used without writing conventional code. Gneiss contributes ways to construct two-‐way data flows between arbitrary data sources and a spreadsheet: it supports interaction techniques to extract desired data from documents returned by these sources to a spreadsheet and provides easy ways to embed spreadsheet cells in web API requests to dynamically send spreadsheet data to these sources. • It provides new spreadsheet functions and interface elements that extend spreadsheets to handle structured data, live streaming data and which facilitate data explorations and transformations. Gneiss contributes the design of cell metadata which enables the user to view and manipulate spreadsheet data using provenance and temporal information. It also contributes the design for nested cells that not only allows the user to view and manipulate structured data in spreadsheets, but together with the new 1 Gneiss (pronounced the same as “nice”) is a kind of rock. Here it stands for Gathering Novel End-‐user Internet Services using Spreadsheets. 5 •
multi-‐output formulas for data transformations, will also assist users in exploring spreadsheet data and constructing hierarchical data visualizations. It unifies the access to web elements with the spreadsheet model, so the user can create web applications that dynamically use and present spreadsheet data using the familiar spreadsheet language. Gneiss extends the spreadsheet language syntax to let GUI element properties be referenced and used in spreadsheet formulas like spreadsheet cells, allowing the user to program two-‐way data bindings between the web application and the spreadsheet. Instead of using event-‐based (“push-‐based”) programming, Gneiss contributes a way to program interactivities in web applications using the spreadsheet’s equation-‐based (“pull-‐based”) evaluation model. This allows users to program interactive behaviors and data-‐related interactive visualizations in a web application including retrieving new data from sources, storing user data, and dynamically sorting, filtering and visualization data, all using spreadsheet formulas. Features of the current version of Gneiss are described by publications at VL/HCC’14 [8], UIST’14 [7] and CHI’15 [9]. Papers and demo videos can be found at http://www.cs.cmu.edu/~shihpinc/gneiss.html. This proposal will summarize the current work and the proposed work, which includes new features to support spreadsheet data exploration and creating mobile web applications, and a plan to conduct several lab studies and a field study to refine and validate Gneiss’s approach. My thesis statement is: A new spreadsheet model that supports working with data retrieved from various data sources, manipulating and exploring the collected data, and creating interactive, data-‐driven web applications that use the backend spreadsheet data can enable end-‐user programmers to create their own applications. In the rest of the proposal, I first discuss prior literature including use cases to motivate the design of Gneiss and systems to reiterate Gneiss’ contributions. I then present the current Gneiss system. Lastly, I describe the proposed work and a timeline. 2. Target users and use cases Gneiss is targeted at intermediate spreadsheet users (users who know how to use spreadsheet functions) who have experiences in using WYSIWIG web editors (like Dreamweaver). While Gneiss is designed to be an end-‐user tool, it could be useful to anyone who wants to quickly collect online data or create data-‐driven applications. I propose to conduct a field study as part of the evaluation to collect more use cases of Gneiss and present them in the final thesis (see Evaluation section). Here, I first 6 discuss three use cases described in prior literature to motivate the creation of Gneiss. Gathering and integrating online data -‐ Van Kleek et al. [20] found that people regularly use multiple information sources on the Internet to complete everyday tasks. For example, people would repeatedly gather information from multiple sources to validate the correctness or accuracy of the information, such as comparing product reviews on multiple shopping websites. Another use case was to reference multiple sources to help make a decision, such as Google, social network sites and dedicated reviews websites (like Yelp). Van Kleek et al. found that to integrate data from multiple web services was a challenge for end-‐users, as the same information from different sources was often named differently or recorded in different structures. Gneiss can help end-‐users easily create reusable spreadsheet programs that get data from multiple web services. As Gneiss provides solutions to use structured data in spreadsheets, it allows users to filter, transform, and integrate the collected data using the familiar spreadsheet mechanisms. Self-‐tracking and personal analytics – The Quantified Self [44] movement has motivated many people to track personal behavior data for reasons such as understanding and improving personal health. Choe et al. [10] interviewed Quantified-‐Selfers and found that many activities that people wanted to see were not supported by existing commercial applications, as 40% of the interviewees used general editing tools like spreadsheets to store their data, and 21% created their own applications for data collection. People also are not satisfied with the analytics provided by existing commercial applications, as many interviewees reported using spreadsheets (44%) and custom software (35%) to perform custom data analysis. Gneiss will support creating web applications that run on desktop or mobile devices and can log sensor data and the user’s manual data entries in a spreadsheet. The users can then perform custom analyses of the logged data using conventional spreadsheet functions, or even create a web application to visualize live analytic results. This type of custom tracking and visualization application is also widely used in citizen science literature for logging and analyzing environmental data. Gneiss provides a friendlier and more flexible programming environment for creating such applications compared with prior systems (such as [19,45]) as the user programs using the familiar spreadsheet language and has full control of what the web interface looks like and how the spreadsheet data is manipulated and used. End-‐user web programming and web prototyping – A survey by Rosson et al. [30] found that 49% of the web developers consider themselves as non-‐programmers. The study found that these “informal developers” valued data-‐related features (such as making forms, surveys and accessing online databases) as much as professional developers did but often were not able to implement them. Gneiss can be used by end-‐users to create custom web data applications for individual or small group usage, as it allows many common data operations required by web development 7 (such as using web services or saving user input data) to be programmed using spreadsheet languages. While Gneiss is capable of creating fully-‐functional applications, it can also be used as a rapid prototyping tool for web designers to create high-‐fidelity prototypes [37] that use real data from databases. Current web prototyping tools such as Adobe Fireworks and Balsamiq let designers create static user interfaces but do not support using data sources. For example, a prototype created in Adobe Fireworks can be saved as a HTML web page, but to further connect the web page to a database requires a person to write additional code. This limits many designers to only being able to create static prototypes using dummy data. Gneiss enables designers to quickly connect web elements to real data sources and present dynamic content using spreadsheet expressions. Gneiss exports an application as HTML and CSS files, which the designer can easily edit to adjust the styling as needed, along with the necessary JavaScript generated from the spreadsheet formulas. 3. Related work The related work comes from a number of areas, including mashups, spreadsheet tools and end-‐user programming. 3.1. End-‐user mashup tools Mashups are applications that make custom use of data from one or multiple sources, such as combining data from multiple websites or providing new ways to interact with the data [39]. Much research on end-‐user mashup tools focuses on helping users extract or combine data from multiple sources without writing conventional code. A few others focus on helping users use web service data. d.mix [15] lets users copy web service calls from pre-‐annotated web pages to use in personal mashups. Marmite [40] uses a data flow approach to let users create mashups and has several built-‐in web services with which users can interact using form widgets. DataPalette [20] also uses built-‐in web services and focuses on helping users merge similar data from multiple sources. An unsolved issue in all of these systems is that although they successfully hide the complexity of using web service data from end-‐users, adding a new web service to these systems requires writing a significant amount of conventional code that is almost impossible for end-‐
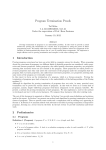
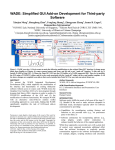
users to do. End-‐users also cannot select which data to extract from the entire return document because this is preselected by the developers when programming the web service into the tool. While there are tools that provide more general widgets to fetch data from a URL (such as OpenRefine [46] and Yahoo Pipes [47]), in these tools extracting the desired parts from the returned data still requires people to write code using query languages like XPath[48], which are not necessarily intuitive for end-‐users. In contrast, Gneiss supports using data from any REST web service that returns data in JSON format, and allows users to demonstrate how to extract the desired data through drag-‐and-‐drop (and proposed work expands the available sources, as 8 explained below). Furthermore, all the prior tools mentioned above omit structures in the extracted data and often show them as flattened strings. In contrast, Gneiss maintains the structure of the data using nested tables and provides new functions for manipulating and flattening the data structures to allow further manipulation using regular spreadsheet methods. Many prior tools focused on algorithms to extract data from web pages. Most of them use the structure of the web page and heuristics generated from the characteristics of the page. For example, Sifter [17] extracts search items on a web page using the HTML structure and scrapes subsequent web pages by examining hyperlinks (such as “Next page”) and URL parameters. Vispedia [5] extracts Wikipedia infoboxes using the table structure and uses the hyperlinks in an infobox to retrieve related topics. There are also commercial web scrapers, such as Scraper [51], a Chrome plugin for scraping similar items in web pages, and ScraperWiki [52], which specifically targets scraping Twitter and tabular data. Gneiss will also support retrieving data from web pages and will reuse the algorithms developed in these prior systems. Some other tools focus on interaction techniques for extracting web page data. They also use the page structure to identify related items, and determine the data to be extracted based on the user’s demonstration. Karma [33] lets users extract data from a web page by dragging the first item to a table and then the system populates the rest of the rows with related items, but it does not allow the table data to be entered back to the web browser. In contrast, Gneiss supports two-‐way data flow between the web data source and the spreadsheet editor, thus enabling users to create a more reusable data extraction program. Vegemite [22] lets users extract data by copying and pasting data from web pages to a table. It further records the user’s activities in the browser such as entering, copying and pasting text, and pressing buttons, to generate step-‐by-‐step scripts to reuse in the future. Different from Vegemite, Gneiss uses the spreadsheet metaphor instead of recording user scripts to support two-‐way data flow. Using the dependencies among spreadsheet cells, Gneiss is also able to generate parallel-‐running data extraction programs instead of generating sequential scripts. While most mashup tools provide tables (e.g., [22,33,40,46]) and visualizations such as charts and maps (e.g., [20,40]) to display the collected data, very few of them support building web applications that provide interactive use of the collected data. d.mix [15] lets users copy desired functionality from example applications and recompose them in a wiki page to create their own web applications. But as mentioned before, this approach is limited in the number of example applications because it requires each example to be manually annotated by professional programmers. Building a web application in a wiki page also does not support creating interactive behaviors. Data flow language tools such as Yahoo! Pipes [47] can let users create input objects and wire them to data manipulation modules to accept runtime values. However, studies have found that the data flow representation is often difficult for end-‐users to understand [4]. Our work here 9 extends the spreadsheet model, with which many end-‐users are already familiar [2]. Debugging is expected to be easier in our tool, as the data being manipulated are exposed in a spreadsheet and the user can see live changes in the data as she programs the application, in contrast to dataflow languages where the data are usually hidden unless the user specifically looks for them (see Evaluation section). 3.2. Spreadsheet tools Most conventional spreadsheet tools such as Google Spreadsheets and Microsoft Excel support one-‐way visualizations for spreadsheet data such as graphs and charts, but do not support building a web application where data flow between the web interface and the spreadsheet data is bi-‐directional. While some spreadsheets (like Excel) support functions or macros that access web services, they share the same drawback as described in prior mashup tools, that to use a new data source often requires a significant amount of coding in other languages such as XPath or Visual Basic to create a formula or macro that communicates with the source. They also provide very little support for using structured data, often flatting them to be strings before storing them into cells. Gneiss also supports streaming data from web services and web input elements (such as textboxes) in spreadsheets. Some research tools also explore the idea of handling streaming data in spreadsheets. Woo et al. [41] extend Excel to collect and process sensor data. Sensor values are stored on a server and streamed to a spreadsheet for use in formulas or visualizations. ActiveSheets [35] is another Excel extension for streaming data. It provides more controls of how and what data should be streamed, such as letting users pause a stream or create new streams using formulas. However, neither system supports manipulating streaming data using temporal information of when the data are retrieved. They also require data sources to be hard-‐coded in. Conventional spreadsheet tools have pre-‐programmed functions that pull real-‐time data from remote servers, such as the GoogleFinance function in Google Spreadsheets. Microsoft Excel’s PivotTable can fetch data from servers and be refreshed manually by the user or when reopened. These tools by default do not support creating data streams – they update individual cells with latest values from the sources but do not preserve past sequences of data. The idea of using the spreadsheet metaphor to support programming data-‐driven web applications was previously explored in FAR [3]. FAR uses a table to present an e-‐commerce database and allows users to link a web interface to the database using spreadsheet syntax. Gneiss makes several novel contributions over FAR. First, while FAR only supports creating applications that connect to a single database, Gneiss allows users to create applications that use data from multiple local or online sources. Second, FAR uses special “query cells” to enable querying a database but does not support other kinds of data actions such as sorting and filtering. In contrast, Gneiss enables all spreadsheet cells and GUI element properties to be used in formulas and by other common actions to perform searching, sorting, and filtering of the data, just like in regular spreadsheet tools. Finally, FAR uses a mix of 10 the spreadsheet “pull” model and conventional callback (“push”) mechanisms to handle events. While convenient sometimes, this approach could potentially lead to confusion and bugs when the push and pull rules have conflicts and try to modify the same cell. In contrast, Gneiss’s language uses solely the “pull” model and is able to support more types of interactive behaviors, such as animations and dynamic pages, than using the hybrid method in FAR. Quilt [1] is a recent system that uses HTML attributes to connect a web page to a spreadsheet that serves as a backend database to fetch and store data. Gneiss uses a different approach of letting users use the spreadsheet language to create two-‐way bindings between GUI element properties and spreadsheet cells. Gneiss also supports creating interactive behaviors, and has a focus on using web data sources. Another category of related work describes research tools that extend the spreadsheet metaphor to support other kinds of programming activities. While some of these support programming graphical or UI objects, none of them support creating applications that make interactive use of backend data. For example, C32 [27] uses a spreadsheet-‐like visualization for specifying user interface constraints, but did not address handling events and did not deal with data sources. NoPumpG [38] and Forms/3 [2] extend spreadsheet languages to help with building graphical interfaces and support animations and events. However, both NoPumpG and Forms/3 have unconventional spreadsheet designs that may not be intuitive for end-‐users. They also do not handle data sources and do not have the notion of a backend database. A1 [18] is a spreadsheet environment for programming system administrator tasks such as monitoring network usage. A1’s language is similar to conventional scripting languages and uses the callback mechanisms to handle events. It provides one-‐way graphical outputs such as graphs and charts, but does not support building arbitrary web interfaces with two-‐way connections to the spreadsheet editor. 3.3. End-‐user web programming tools Web interface builders and WYSIWYG web editors have been widely used in commercial products and research projects to help end-‐users make web interfaces. However, connecting a web page using a regular interface builder (like Adobe Dreamweaver or Microsoft Visual Studio) to a data source and presenting dynamic content still require writing extensive code. Some research tools help people use examples to create static styles [6,21] or interactive behaviors [29] of a web page. But they do not help users understand or reproduce how the example web pages use and interact with the backend data sources. 4. Current work The current Gneiss system makes contributions by introducing a generalizable design that enables data from arbitrary web sources to be retrieved or streamed in a spreadsheet without any preprogramming, new spreadsheet functions and interface elements to support working with structured and streaming data, and extending the spreadsheet language to support programming data bindings and interactive 11 Figure 2. The Gneiss interface. (1) is the source panel where the user can load a web API in the URL box and extract
desired fields from the return data to the spreadsheet editor through drag-and-drop. (2) is the spreadsheet editor
that stores and manipulates the data to be used in the web application. (3) is the web interface builder where the user
can create a web application by dragging-and-dropping GUI elements from the toolbar on the right (4) to the output
page. The user can select a GUI element in the output page (the selected element is highlighted with a dark blue
border, which currently is the textbox at the top of the page) and view its properties in (5). Property values are cells
that can contain formulas and can be referenced by other cells.
behaviors in a web application. In this section, I will describe the key features of Gneiss with respect to these three contributions. Figure 2 is screenshot of the Gneiss interface. Gneiss contains three panes: at the left (Figure 2 at 1) it is a browser-‐like source pane for loading external web data. At the center (Figure 2 at 2) it is a spreadsheet editor where the user puts the data she wants and manipulates them. At the right (Figure 2 at 3) it is a web interface builder where the user can create web pages through dragging-‐and-‐dropping GUI web elements. 4.1. Using data from web data sources Gneiss currently supports arbitrary REST web services that return JSON data, the most popular type of web services today according to ProgrammableWeb.com. While the final version of Gneiss will support more types of data sources such as web pages or mobile sensors, we expect most of the interactions described here to be generalizable to other sources with a few modifications to the source pane. To load data from a web service, the user enters an API in the URL bar in the source pane (Figure 2 at 1). The raw JSON data returned from web services are shown below the checkboxes in the source pane and are indented and color-‐coded for readability. 4.1.1. Selecting and extracting desired data returned by the source 12 When the user hovers the mouse over each field in the returned document, the field is highlighted with a light blue background, and its corresponding path [49] is shown (below the URL textbox in Figure 2 at 1, with a yellow background). The user can extract a desired field to the spreadsheet by first selecting the field by clicking it and then dragging-‐and-‐
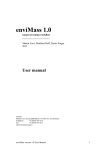
dropping it to any cell in the spreadsheet. Gneiss uses a programming-‐by-‐example approach to facilitate extracting similar items in the returned documents, such as the first field of all list items. When the “Extract similar fields to the spreadsheet” checkbox in the source pane (Figure 2 at 1, the first checkbox below the yellow rectangle) is checked, the system will let the user drag a field to the first cell of a spreadsheet column and then Gneiss automatically fills in the rest of the Figure 3. The column settings dialog box,
column with similar fields based on the opened by clicking the arrow button at the top
of a column. Data extracted from the same
document structure. For example, the user source (in neighboring columns) by default are
can select and drag a place name from a sorted and filtered together and are highlighted
list of place search results in the source with a purple background. The column from
which the dialog box is opened is highlighted
pane to cell B1, and the system will fill in with a purple border.
the rest of the column B with other place names in the search results (see Figure 2). Note that the user can select any field in a JSON document to extract to the spreadsheet, even a field that contains other fields such as a JSON object or array. The Gneiss spreadsheet will dynamically render nested tables (described in detail later) based on the field’s structure to display the extracted data. The user can also extract fields from multiple web services in a spreadsheet by entering a different web API in the URL bar and dragging a different field to the spreadsheet. 4.1.2. Creating a data stream The user can also stream data from a data source. An arbitrary data source can be turned into a streaming source if the checkbox “Stream this source” (Figure 2 at 1, the second checkbox below the yellow rectangle) is checked. The system then starts to send the web API request every 3 seconds (configurable) and updates the source pane with the latest return data. We use a roll-‐up text animation when replacing old values in the return data to show that they have been refreshed. The last updated time of the data is shown in a blue label next to the streaming checkbox. Unchecking the checkbox stops the streaming. 13 To create a data stream in the spreadsheet, the user checks the “Stream this source” checkbox and drags a desired field from the return data to the top cell of a spreadsheet column. The system then starts to stack the column with the latest values of the field pulled from the web service. By default the values are sorted descending by time, so the newest value appears at the top of the column. The user can set the sorting rule and the streaming frequency through the column setting dialog box (see Figure 3). She can also choose to pause a stream when a given condition is true (If the condition is not specified, the stream pauses immediately). For example, in Figure 3 the user selects the “Pause streaming when” checkbox and enters “E1=’Pausing streaming’” as the condition, then our tool will pause streaming from the source if cell E1 becomes “Pause streaming”, and restarts streaming when E1 becomes any other value. 4.1.3. Two-‐way data flow and parallel-‐running programs The user can also send spreadsheet data to a web service by replacing any part of the web API in the URL bar with the value of a cell in the spreadsheet, using the syntax {{cellName}} (the double brackets syntax is adopted from JavaScript template libraries such as Handlebar.js [50]). For example, in Figure 2 at 1, the user replaces the value of the query parameter of the API URL to be {{A1}}, causing the value of cell A1 (“Jazz bar New York City”) to be sent to the web service as the query string, and subsequently updating the source pane and any cell in the spreadsheet whose value comes from this web API with the latest returned data (search results of “Jazz bars New York City”). Moreover, as A1 is now linked to a web API, every time when A1’s value changes, the system will send a new API request with A1’s new value. This, in turn, will again refresh the spreadsheet columns. The features of extracting desired data to the spreadsheet by drag-‐and-‐drop and sending spreadsheet data to the web service by embedding cell names in an API request enable data to flow two-‐ways between Gneiss and the web data source. This makes the data extraction program created in Gneiss easily reusable, as the user can retrieve new data from a web service by simply editing spreadsheet cells. Moreover, while the user’s demonstration and manipulation of cells are always performed sequentially, the spreadsheet model allows Gneiss to construct a parallel-‐running program using the dependencies among the spreadsheet cells. Cells that do not have any dependencies on each other can be computed independently in parallel. This could make a big improvement on performance, especially when extracting a large amount of data or using multiple data sources. For example, if the user wants to collect data using 50 shopping web services to compare prices, she can easily create a spreadsheet that sends 50 web API requests in parallel, and get the data within seconds. This is in contrast to other PBD web scraping programs (ex. [22]) that can only execute sequentially in the same order as when the user demonstrated them, and generally further require adding explicit delays to wait for data to arrive. 4.1.4. Refining the collected data through dynamic sorting and filtering 14 The regular sorting and filtering in conventional spreadsheets such as Excel only sorts and filters the current data in a column and do not apply to future edits. For example, after sorting a column in alphabetical order, adding new values to the column does not reorder the cells. Because Gneiss has a focus on using dynamic data from remote sources in spreadsheets, it allows sorting and filtering rules to be run dynamically too to save the user’s time to reapply these rules when new data arrive. In Gneiss once sorting and filtering are applied to a column, they are executed every time when the data in the column change. This allows the user refine the collected web data and also enhances the reusability of the data extraction program created in Gneiss. For example, in Figure 2, column B-‐E in the spreadsheet contain search results from a place web service. The user can get the top-‐rated places by sorting the rating column (column C) in descending order and filtering to show the top three items. By default, columns extracted from the same source are sorted and filtered together. The sorting and filtering will execute every time to show the top-‐rated places when she makes a new query and a new list of places comes in. In the next version of Gneiss, the user will be able to specify the order of sorting and filtering using a similar mechanism as in Excel. To sort or filter data in a column, the user can click on the small arrow button at the top of the column to open a dialog box (Figure 3). In the dialog box, the user can choose to apply constant rules for sorting and filtering as in conventional spreadsheets through a drop-‐down menu, or to apply a dynamic rule by checking the “Use computed value” checkbox and entering the rule in the corresponding textbox. This rule can use conventional spreadsheet functions, with which the user would already be familiar. For example, for sorting, entering =IF(A1>5,
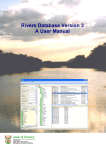
“Descending by value”, “None”) as the rule will sort the column in descending order only when A1 is bigger than 5. The ability to apply sorting and filtering rules based on live conditions further allows the user to create highly interactive programs in Gneiss. For example, the user is able to create a web application that lets people interactive sort and filter data using GUI controls such as checkboxes and sliders, which will be explained below. 4.2. Working with structured and streaming data 4.2.1. Nested tables for structured data As mentioned earlier, if the user selects a field that contains multiple fields (such as an object or an array) in the source panel and drag-‐and-‐drops the data onto the spreadsheet, the data will be shown in nested tables, rendered according to the structure of the data (see Figure 4). For example, in Figure 4 at the right, column B stores the abridged cast of each movie. The abridged cast for each movie is an array, and each item in the array has three fields: the actor name, his ID in the movie database, and an array that stores all characters he plays in the movie. The nested table is rendered to reflect this structure. We extend the common spreadsheet cell representation to let the user refer to any cell in the nested table, using the syntax cell.childCell. For example, to refer to the cell with value “Ewan McGregor” in 15 Figure 4. A JSON array (left) and its corresponding nested table (right, in the red box) in Gneiss.
Figure 3 at the right, the user enters B1.A2.A1. As in many other spreadsheet tools, instead of manually typing the cell name, the user can also click on the desired cell and let the system insert the appropriate cell name for her, so she does not have to count the columns and rows if the structure gets too complicated. To assist the user in further manipulating the data in the nested tables, our tool Figure 5. An example of the flatten formula.
provides a “flatten” function that flattens a nested table column and stores all values in a column. To use the flatten function the user can enter =flatten(columnName) in the top cell of a column, and then our tool will automatically fill the cells below with the appropriate data. The syntax for columnName is similar to referring to a cell in a nested table, which is column.childColumn. Using Figure 4 again for example, suppose the user wants to create a new column that stores all actors in all Star Wars movies returned from the web service. She picks an empty column C, and enters =flatten(B.A.A) into cell C1 (B.A.A is the column that stores the actor names in each abridged cast of each movie). The flatten function populates column C with a flattened list of actor names (see Figure 5). The user can then apply filtering to the column to remove duplicate names and get a clean list. The flatten function currently flattens only the first level items of the given column. It does not flatten children structures if the given column contains any. For example, in Figure 4 if the user enters =flatten(B.A) into cell C1, the system will fill in each cell in column C a nested table with three columns (name, id and character). My proposed work will introduce other new functions to let users 16 flatten or construct structured data in spreadsheets, such as a “deep flatten” function that flattens the structure all the way down and other functions that let users organize regular spreadsheet data into nested cells (see the Proposed Work section). 4.2.2. Cell metadata for manipulating streaming data using temporal information Another innovation in Gneiss is the introduction of “cell metadata” that describe other attributes of a cell’s value and allow users to manipulate spreadsheet data using these attributes. Unlike user comments in modern spreadsheets, Gneiss’ cell metadata are automatically maintained by the system. In Gneiss, each cell has metadata of its value’s provenance and fetched time. The design of metadata enables users to manipulate data using not only their values but also temporal information of when the value is retrieved. As streaming data are time-‐series data, supporting manipulating them by time would be useful in many situations. For example, to view the 5 highest values of the day, a streamed column can be filtered to show only the data retrieved today, sort them descending by value and filter to show only the top 5 rows. As mentioned earlier, sorting and filtering rules are controlled by the column setting dialog box (Figure 3) and are re-‐evaluated dynamically every time when new data are retrieved. So in the above example, the column will update continually to display the 5 highest values as new data arrive. Cell metadata are by default not visible but can be exposed through spreadsheet functions. A new function in Gneiss FETCHTIME(cellName)returns the retrieval time of a streamed cell. The return value is in standard ISO 8601 format and can be used with conventional spreadsheet date and time functions. Another function SELECTBYTIME(startTime, endTime, range) returns an array of values in range that are streamed between startTime and endTime (where the times can also have wildcards using date and time parsing libraries such as Moment.js). The SELECTBYTIME function can be used together with many conventional spreadsheet functions that process a set of values. For example, suppose column B in the spreadsheet holds latest news streamed from a news data source. The formula =COUNTIF(SELECTBYTIME(“2014-09-21 9:00”, “2014-09-21 10:00”,
B:B),“*White House*”)
returns the number of news articles fetched between 9-‐ 10am on September 21st, 2014 that contain the phrase “White House”. (These functions will be further refined and generalized in the proposed work.) 4.3. Creating interactive, data-‐driven web applications In Gneiss, the user can create a web application using the web interface builder (Figure 1 at 3). As in many commercial web interface builders, our tool lets users create UI elements in a web page by drag-‐and-‐drop. Gneiss supports text and image objects, input elements (such as text boxes and buttons), lists, and visualizations. In general, the properties of these elements include string properties (e.g., the text in a heading, the label of a button), styling properties (e.g., color and width), link 17 properties, and interactive properties that change values as the user interacts with the element. String and styling properties let users style GUI elements using conventional mechanisms. A Link property turns a GUI element into a hyperlink that goes to the value of the property, which can be a URL or the name of another page opened in the interface builder, allowing the user to create a multi-‐page application. The user can modify property values of a GUI element by selecting the element and editing the properties from a property sheet at the lower right corner (Figure 2 at 5). 4.3.1. Creating a dynamic UI using spreadsheet data Gneiss extends spreadsheet language to support programming web elements. In Gneiss, the user can edit a GUI element property just like editing a cell in the spreadsheet editor. A GUI element property can be a constant or a dynamic value computed from the spreadsheet data. Setting a property value to use spreadsheet cells will cause the property be recomputed every time when these cells change values. For example, if the user sets the “value” property of a text object to be =CONCATENATE("Rating: ", C1), then each time that cell C1 in the spreadsheet editor changes, the text object will also change to show the latest value. This feature allows the user to easily program web applications that dynamically generate content based on the backend data. To further facilitate presenting multiple rows of data in spreadsheets, UI list elements in Gneiss (such as vertical lists and grid lists) have a “Populate” property that if true will populate all items of the list with the corresponding elements based on the user’s edits to the first item. The number of items in a list can also be adjusted dynamically based on the associated spreadsheet data if the “NumberOfItems” property in the list object is set to “auto”. For example, the user can add a text label to all items in a grid list by simply dragging a text label to the first item and let the system populate the rest. If the user sets the text label in the first item of the grid list to be =B1, the system will automatically populate the text label in the second list to be =B2, and so on (see Figure 2). The number of items in the list will change dynamically according to how many rows there are in column B. Alternative, the user can set “NumberOfItems” to be a number and give the list a constant length or a length computed by a formula. The user can also set “Populate” to false. In this case, the list object becomes a pure layout object and the user can manually put different UI elements in different list items. 4.3.2. Using UI property values in spreadsheets In Gneiss, user inputs into the user interface can also affect the spreadsheet data, making the data flow two-‐way between the web application and the spreadsheet. The user can reference any property of a UI element using the syntax ElementID!PropertyName, using a syntax similar to how a cell in another worksheet is referenced in conventional spreadsheets. As mentioned earlier, since the data flow between Gneiss’ spreadsheet and a connected web service can also be two-‐way, the user is able to create web applications that interactively send data to web 18 services and show the return data. For example, in Figure 2, cell A1 is sent to a web service for places as the query string. The user can set A1 to =TextBox1!Value to make A1’s value come from the value of the search text box in the web application. Now, every time when the user enters something in the search text box (Figure 2 at 3), A1’s value will be refreshed to the value of the text box, causing the system to make a new web API request using this value as the query string. This, in turn, will update column B-‐E in the spreadsheet with the latest search results, and further update the text labels in the grid list in the web application that are linked to these columns. References like this can be used not only in the spreadsheet editor but also in the GUI property sheets in the web interface builder as well. For example, the user can set Text2’s value property to be =Text1!Value, making the two text objects display the same content. We further added a convenient keyword THIS to let a GUI element property reference other properties in the same element using THIS!PropertyName. A common feature in spreadsheet tools is “autofilling” where the user selects one or multiple cells and drags a box in the lower right corner of the selection to fill in additional cells with corresponding values. We extend this feature to facilitate referencing properties of populated GUI elements in a list object. The user only needs to enter a reference in a cell for the desired property of the UI element in the first list item, and then select that cell and autofill down. For example, in Figure 2 there is a checkbox in each item in the grid list in the web application. To use the value of the checkboxes in the spreadsheet, the user types =Checkbox1!Checked in cell F1, selects F1 and drags to F10. The system then fills in F2 to F10 with the “Checked” property of the checkboxes in the second to tenth items in the grid list. In the next version of Gneiss, the user will be able to fill in a large or variable number of cells by using a mechanism that is already available in Excel -‐ by entering the formula in one cell, selecting a range of cells using expressions (could be a fixed number of cells such as A1:A10 to select 10 cells, or a variable number of cells such as A:A to select the whole column A based on how long A is), and pressing Ctrl-‐D to fill in the range of cells. 4.3.3. Programming interactive behaviors One of the important innovations in Gneiss is the way that users can make their web applications interactive. Originally, I explored having Gneiss use a conventional event-‐based or callback architecture like Java and JavaScript, where UI elements would contain actions to be performed when operated. However, it is awkward to combine these “push” actions (where the action routine in a UI element would set other cells—pushing values to them) with the spreadsheet “pull” model (where cells compute their own values with formulas by pulling in the needed values). Therefore, I designed a novel way for the Gneiss user to define interactive behaviors without ever needing to write any callback or event procedures. 19 Instead, I designed interactive properties of GUI elements that change values at run time based on how the user interacts with them. Interactive properties can be used in the spreadsheet cells to compute different data based on the user’s action. Currently, all GUI elements have an interactive property called “State” that shows how the mouse cursor interacts with them. Possible values for “State” include “idle”, “hovered”, “pressed” and “clicked”. The “clicked” value stays for a few extra milliseconds after the click event so the user can notice that it happened. Other interactive properties are mostly for input elements, such as “Value” for text boxes and sliders, and “Checked” for radio buttons and checkboxes. For example, entering =IF(Text1!State=”hovered”, “red”, “black”) in cell A1 will make A1 be “red“ when Text1 is hovered and “black” otherwise. A1 can then be used as the color property of Text1 to create a simple hovering effect. Interactive properties are not editable from the property sheet since their values are controlled at runtime by the widgets, so their cells are shown using a grey background, such as the value property of TextBox1 in Figure 2 at 5 (in the next version of Gneiss, I will implement a way to let user set the initial value of a input widget—currently the initial value is always empty). In both the spreadsheet editor and the property sheet, values of interactive properties change dynamically in keeping with Gneiss’s “programming-‐with-‐example” style. To further enable more types of interactive effects to be created in our tool, we designed a timer function TIMER(ms, condition)that starts a timer ticking every “ms” milliseconds if “condition” is true, and turns off the timer if “condition” is false. The function returns true for one millisecond when the timer ticks, and false otherwise. The timer function was designed specifically to follow Gneiss’ “pull” programming paradigm and when used together with conventional spreadsheet functions such as IF would enable timed transitions and animations in the spreadsheet, as demonstrated below. Constraint Evaluation and Circular Constraints By default when a spreadsheet cell’s value changes, the cell will invalidate all other cells that directly depend on it. This causes the dependent cells to re-‐compute their values. If the value of that cell changes, then the cell continues to invalidate other cells that directly depend on it, and so on. Otherwise (if the value stays the same), the cell will not invalidate its dependent cells, and the propagation stops. This increases the system’s performance and also ensures that web API requests are not run when a parameter value is updated to the same value as before. This tends to happen with constraints that contain IFs or other control structures, where the constraint must be re-‐evaluated, but ends up calculating the same value. In rare cases, the user might want to re-‐evaluate the constraints that depend on a cell even if the cell’s value does not change. For example, if the spreadsheet data are extracted from a news web service, the user might want to re-‐run the same query to get the latest news. We provide a function REFRESH(exp)that when used in a cell will return the value of exp and invalidate all the children cells (causing them to be re-‐
20 evaluated) even if exp is the same as before. So for instance, the user can set a cell that stores the query parameter to be =IF(TIMER(600000, B1), REFRESH(“world
cup”),“world cup”)to get news about “world cup” every 10 minutes when B1 is set to true. Although the query cell’s value is always “world cup”, the REFRESH function invalidates all constraints that depend on the cell, causing the web service request to be triggered and refresh the spreadsheet columns in turn. Like some other one-‐way constraint solvers [24,25,28], our spreadsheet formula solver provides “once-‐around” semantics for circular constraints. We use an example to explain how this works. Suppose the user sets A1 to be 0 and A2 to be A1+1, which makes A2 be 1. The user then sets A1 to be A2-1, which creates a circular reference. Most spreadsheet tools will return errors in both A1 and A2. In contrast, our system allows circular references, and always evaluates any dependent cells exactly once when any cell in the cycle changes. Here, the system starts computing A1 by asking A2’s value. Since A2 is A1+1, it goes back to A1 and finds that it has reached the beginning of the cycle. The system then stops the circular reference here and returns A1’s old computed value, 0. That makes A2’s value 1 (0+1), and A1’s value stays 0 (1-‐1). Supporting “once-‐around” circular constraints in the spreadsheet makes more types of expressions possible. For example, a spreadsheet cell can now reference itself. The system will return the cell’s original value before it is recomputed. Combined with the IF statement, this allows the user to set a cell’s value to something if a condition is true, otherwise having the cell retain its original value. This expression is useful to handle interactive behaviors as it allows the user to set a cell’s value when a GUI element enters a certain state, but does not change the value back when the element enters another state. For example, suppose the user wants to change a hyperlink text to be another color once it is pressed. Even though the “State” of the text goes back to “idle” from “pressed” after the user releases the mouse button, using a self-‐reference, the text is able to stay the same color. Another use case of self-‐reference is that it allows a cell to compute its new value using its previous value. Used together with the TIMER function, the user can set a cell to steadily increase or decrease its value, and bind the cell to a GUI element property to create an animation, such as expanding or shrinking the size of an element, or binding to a color property to create a fade-‐ in/out effect. For example, suppose the width of an image object (Image1) is stored at cell C1. The user can set C1 to =IF(Image1!State="idle", IF(TIMER(15, C1>30), C1-1, C1),
IF(TIMER(15, C1<60), C1+1, C1))
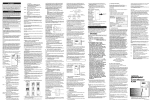
to create an animation where the image will gradually increase from 30 pixels to 60 pixels when the mouse enters, and to go back to 30 pixels when the mouse leaves. 4.3.4. Turning the spreadsheet to a database With Gneiss, the user is able to stream data from web input elements such as textboxes or forms and store them in the spreadsheet, thus turning the spreadsheet 21 into a kind of database. The user can set a column to pull data from a web input element by checking on the “Stream data from” checkbox in the column setting dialog box (Figure 3) and setting the input element to be the streaming source. For example, entering TextBox1!Value as the streaming source sets the column to stream the value of TextBox1. By default, the column pulls data from an input element when its value changes. The user can further use the “pause” mechanism described earlier to start streaming only when certain condition is true. For example, entering SubmitButton!State!=“clicked” as the pause condition makes the column stream data from TextBox1 only when SubmitButton is clicked. Like spreadsheet cells storing data streamed from web services, cells storing data streamed from web input elements also have the same metadata and can be manipulated by retrieval time with the features described earlier. This feature also allows our spreadsheet to be used as a database for a frontend web page, as it stores input values as streams in the spreadsheet. 5. Proposed work My proposed work will experiment with new ways to help users explore data collected in a spreadsheet by supporting quick data transformation and visualizations through formulas and creating automating scripts. I also propose to enhance the web interface builder in Gneiss to support programming mobile web applications, and several other extensions to improve the system’s usability. I close this section with a plan for evaluation. 5.1 Exploring spreadsheet data After the user collects the data she needs in a spreadsheet, she might want to explore the collected data in order to understand and gain insights from the data. For example, to discover the relationships among personal health factors retrieved from different web services such as exercise, weight, body fat and calorie intake [10]. This process usually involves doing multiple data transformations to experiment different combinations, selections and groupings of data and examine the results through graphs and charts. In the literature, this approach is sometimes called exploratory data analysis [34] where a data analyst examines a data set through rapid data visualizations and transformations to understand the distributions of data and the relationships among variables before forming hypotheses. Exploratory data analysis has been used by a broad range of users because expertise in mathematics or statistics is not a requirement [16]. Some special-‐purpose programming languages provide packages to support data exploration by helping users quickly manipulate and visualize data, such as R and MATLAB. However, these languages target people with programming background. End-‐user data visualization tools such as ManyEyes [36] and Tableau [32] focus on helping people create visualizations of data but lack the ability to do custom data manipulation such as creating a new column based on existing columns. Spreadsheet tools are popular among end-‐users and provide many functions for data manipulation. However, compared with professional programming languages, 22 spreadsheets are less efficient because many common data transformations cannot be done solely using formulas and have to be done manually or using special widgets. For example, given a dataset containing a list of students, their department, age and GPA, to see the average GPA by departments in Excel the user has to first use an advanced filter in a widget to get all distinct department names in a new column, enters an AVERAGEIF function to calculate the average GPA of the first department, and finally does a select-‐and-‐drag gesture (also called “autofill”) to apply the formula to other department names. Alternatively, the user has to build a PivotTable in a special widget. However, in professional languages this can often be done by a line of code (for example, “SELECT AVG(GPA) GROUP BY department” in SQL). Creating visualizations in spreadsheets also requires the user to fill in dialog boxes, whereas other languages such as R provide convenient functions to quickly plot multiple graphs at the same time. There are tools that allow users to run other languages in a spreadsheet to do data selection or transformation, such as the QUERY function in Google Spreadsheets that quires spreadsheet data using the Google Visualization API Query Language (similar to SQL), and RExcel that lets users run R statements in Excel. However, the user would still need to learn these languages in order to use them in spreadsheets. Another weakness of spreadsheets is that users often have to do a lot of repetitive data analysis and manipulation tasks because writing scripts that can automate these tasks involves programming in other languages such as Visual Basic for creating macros in Excel and is often too difficult for end-‐users [12]. Prior work has explored ways that go beyond the spreadsheet languages to automate data transformations in spreadsheets such as programming-‐by-‐examples [13,14] or natural languages [12]. To facilitate spreadsheet data exploration, I propose to design new features that make data transformations and visualizations more efficient in spreadsheets: • I will add support for multi-‐output formulas – spreadsheet formulas that modify multiple cells at the same time – which, coupled with Gneiss’s nested table representations, will let users do data transformations that previously required multiple manual steps or cannot be done in spreadsheets. While multi-‐output constraints have been used in prior systems [31,42] to program user interfaces, and modern spreadsheets such as Excel have “array formulas” that can output an array of values to multiple cells, Gneiss’s multi-‐output formulas will make new contributions as they can organize data into structured cells to provide intermediate visual feedback to the transformation results that cannot be represented well in plain table formats, such as grouping, joining and combining data. For example, suppose the user is working with a spreadsheet file whose columns A to D are respectively the university students’ name, department, age and GPA. Suppose the user wants to group the data by department and 23 Figure 6. A mockup of the result of a “grouping” formula that groups columns A to D by column B.
view the average GPA of each department. In Gneiss, she will be able to enter a multi-‐output formula such as =GROUPBY(B, A:D)to group column A-‐D by column B (department) without requiring the user to enter rules of how to collapse the data in columns A, B, and D. The GROUPBY function will be able to transform flat spreadsheet columns to something like Figure 6. Here, the data are grouped by column B while data in column A, C and D are not yet processed and are shown as nested cells. The user can then use another multi-‐output formulas to transform the nested cells in column D (GPA) to an average number of the cells’ values. In conventional spreadsheets and other languages such as SQL and R, grouping is an intermediate step that cannot be performed without being combined with other operations (such as sum and average) in order to output the result as a table. There is no intermediate feedback in a long query. Any error in the query could lead to an empty output that is difficult to debug. In contrast, Gneiss’s nested cell representations will enable these intermediate steps to be done one by one in spreadsheets and will provide visual feedback for each step. My hypothesis is that allowing data transformations to be performed using the familiar formula mechanism in incremental steps and providing visual feedback of the transformed results will be more learnable, more accessible and less error-‐prone to end-‐users than using special widgets (like PivotTable in Excel) or languages that can only construct long quires and do not provide intermediate visual feedback at all (like SQL). To support the features described above, I will design new functions to let users do common data transformations, such as those supported in SQL, and to manipulate structured data in various ways in addition to simply flattening the first level of nested cells (as the current FLATTEN function does), such as to transform flat tables into arbitrary nested tables, to merge 24 multiple nested cells into a single value, and to be able to specify how many levels of nested items to flatten. I will also design ways to represent data transformation results in nested tables and refine the design through multiple paper prototyping sessions with end-‐users. • I will investigate creating hierarchical visualizations and custom interactive behaviors in visualizations in Gneiss. As mentioned above, new functions in Gneiss will allow users to manipulate structured data represented by nested tables. The nested tables can be further used to create hierarchical visualizations such as trees to help users understand the data. In Gneiss, every web element created in the interface builder (Figure 1 at 3) has interactive properties that reflect how the user interacts with it in the web application. I will design new interactive properties for visualizations to show, for example, what data point was last clicked by the user. This property could then be used in a multi-‐output formula to transform the underlying data of the visualization, such as allowing a subset of the data to be selected using the mouse, thus creating a custom “zoom-‐in” effect in the visualization. With this feature, the user would be able to create a variety of web applications that support custom data explorations using interactive visualizations. Note that the features described here may run into performance problems when operating on large data sets, such as trying to provide visual feedback to a grouping operation for 1,000,000 rows of data. Much research by others has been done on improving query speed on large data sets [23] or incrementally querying large data to provide feedback in a reasonable time [11]. My thesis will not focus on handling such ultra-‐large datasets. 5.2 Mobile web applications I also propose to extend Gneiss’s support for creating mobile web applications. Currently, Gneiss is not able to create web applications with responsive layout to fit with various devices or window sizes. Its interface builder captures a few events – namely, hovering, clicking and pressing the enter key. I will integrate Gneiss with responsive CSS frameworks like Bootstrap so the created application can adjust its layout based on screen size. I will extend the interface builder to support more types of events such as common touch events like swiping and dragging. This may involve adding more interactive properties to the UI elements, or allowing users to define custom events by combining multiple events together. Sensor events will also be supported to allow users to stream sensor data such as GPS or accelerometer readings in the spreadsheet. I will also create a mechanism for people to test and deploy their applications on mobile devices. While the full Gneiss editor is designed to run on regular size computer screens, the user will be able connect a mobile device to the Gneiss’ server and mirror the content in the web interface builder to the mobile device. Events 25 captured at the mobile end will be sent to the server and reflected live in the Gneiss editor. 5.3 Other features I will expend Gneiss to support more types of data sources, such as allowing users to import CSV or Excel files to use in Gneiss’ spreadsheets, and to collect data from web pages in the source pane. I will work towards making Gneiss more usable, such as allowing multiple tabs in the source pane and spreadsheet editor, adding visual cues about cell dependencies as in conventional spreadsheets, and supporting more types of GUI elements in the interface builder. These features are not expected to be contributions of the Gneiss system and will use mechanisms from previous systems such as Excel. They are being added primarily to demonstrate the range of Gneiss’s innovations. 5.4 Evaluations I plan to conduct multiple user studies to evaluate and refine the design of Gneiss. Before the studies, I will create tutorial materials for Gneiss, such as tutorial videos. I will also write the online documentation for the new functions in Gneiss. I plan to run a number of lab studies. The first lab study will be a between-‐subjects A/B test that evaluates new features in Gneiss that help users explore spreadsheet data, namely the multi-‐output formulas and nested cell representations for doing data transformations (section 5.1). I will recruit spreadsheet users of different expertise and assign them in a balanced way into two groups. One group will use Gneiss and the other group will use Google Spreadsheets that has PivotTable and a QUERY function that lets users use SQL statements to select spreadsheet data. The participants are free to use any online resources they want. Both groups will be asked to complete the same tasks about exploring a given spreadsheet file to answer a few questions given by the experimenter. Before starting the task, all participants will receive a tutorial of the tool, using either the official Google tutorial for Google Spreadsheets or the tutorial I created for Gneiss. During the study, I will measure the task completion time and observe the data exploration process such as if the participant makes any errors or what online resources other than the given tutorial she uses. Through this study, I hope to answer the following questions: • Can participants learn to use Gneiss’s multi-‐output formulas? • Can participants understand Gneiss’s nested cell representations for data transformation results? • Compared with using conventional spreadsheet mechanisms, what are the strengths and weaknesses of using the new formulas in Gneiss to do data selection and transformation? • Will providing visual feedback of intermediate data transformation results help user understand spreadsheet data? After the first lab study, I will refine the multi-‐output formulas and the nested cell representations based on the user’s feedback. 26 For the second lab study, I will recruit both professional web programmers and end-‐
users who are knowledgeable about spreadsheets but are not proficient web programmers (i.e., do not program in JavaScript). I will ask the participants to complete one or several tasks about creating interactive web applications that make dynamic use of backend data, such as visualizing query results from an online database or making a simple discussion forum. The tasks will require the user to use most of the features in Gneiss, such as interacting with web services, manipulating and transforming data in spreadsheets, and creating interactive web pages and visualizations that use the spreadsheet data. Both studies with professional programmers and end-‐users will be between-‐subject A/B tests. For professional web programmers, half of the people will use Gneiss, and the other half will use any conventional programming languages and libraries they want. Participants using Gneiss will receive a tutorial of the tool before starting the programming task. All participants are free to use any online resources they want. I will measure the task completion time and observe the learning and coding process to look for breakdowns such as errors created. I will also do a short post-‐study interview to collect feedback on Gneiss or to clarify some questions I have while observing the participant. Through the study with professional programmers, I hope to answer the following questions: • Is Gneiss learnable by professional programmers? • Can Gneiss help programmers work more efficiently on the tasks compared with using conventional programming languages? • What are some features that professional programmers like or find useful? • What are some features that professional programmers do not like or find difficult to use? • Compared with conventional programming languages, what are the strengths and weaknesses of Gneiss? • What are some other features that professional programmers would want to have in Gneiss? • What are some scenarios that professional programmers would want to use Gneiss in real life? For end-‐users, half of the people will use Gneiss, and the other half will use Yahoo Pipes [47], an end-‐user tool that uses the data-‐flow model to allow people to program mashups. The study will follow similar procedures as described above. Participants using Yahoo Pipes will also receive a tutorial of the tool, using the official tutorial on Yahoo’s website. Through the study with end-‐users, I hope to answer the following questions: • Can end-‐users understand the new spreadsheets concepts introduced in Gneiss, such as the nested cells, the multi-‐output formulas, and the once-‐
around circular evaluation? • Can end-‐users successfully complete the tasks using Gneiss? • What are some challenges that end-‐users encounter when learning Gneiss? 27 •
•
•
•
•
Compared with Yahoo Pipes, what are the strengths and weaknesses of Gneiss? What are some features that end-‐users like or find useful? What are some features that end-‐users do not like or find difficult to use? What are some other features that end-‐users would want to have in Gneiss? What are some scenarios that end-‐users would want to use Gneiss in real life? Based on participants’ feedback from the lab studies, I will refine Gneiss, its documentation and the tutorial materials. After that, I plan to run a field study where I give Gneiss to a group of people to see what they will create with it. I will try to coordinate with the TAs of GUI PUI Lab and SUI Web Lab to introduce Gneiss to MHCI and BHCI students to recruit participants. Many MHCI and BHCI students are web designers and programmers. I expect to collect a variety of web applications created in Gneiss to be included in the final thesis to demonstrate the range of Gneiss. For all participants I will also send out a survey for their feedback on Gneiss. 6. Timeline February and March 2015: developing features for helping users explore spreadsheet data, including multi-‐output formulas and nested tables to enable data transformations; fixing bugs in the system. April 2015: submitting a UIST paper about data exploration features (April 16), releasing a beta version of Gneiss online before CHI (April 18), presenting Gneiss at CHI May and June 2015: developing the features to support mobile web applications, adding usability features, fixing bugs July 2015: Creating documentations and tutorials for Gneiss, designing the lab studies and running pilot tests August 2015: Running lab studies September 2015: Submitting a CHI paper about the new features and the lab study results October 2015: Refining Gneiss, its documentation and tutorial based on the lab study results, releasing another version of Gneiss online, designing the field study and recruiting participants November 2015: Running the field study December 2015 – February 2016: Writing the thesis April 2016: Defense! References 1. Benson, E., Zhang, A., and Karger, D.R. Spreadsheet-‐Driven Web Applications. ACM symposium on User interface software and technology, ACM (2014), To appear. 28 2. Burnett, M., Atwood, J., Walpole Djang, R., Reichwein, J., Gottfried, H., and Yang, S. Forms/3: A First-‐order Visual Language to Explore the Boundaries of the Spreadsheet Paradigm. J. Funct. Program. 11, 2 (2001), 155–206. 3. Burnett, M., Chekka, S.K., and Pandey, R. FAR: an end-‐user language to support cottage e-‐services. Human-‐Centric Computing Languages and Environments, 2001. Proceedings IEEE Symposia on, (2001), 195–202. 4. Cao, J., Rector, K., Park, T.H., Fleming, S.D., Burnett, M., and Wiedenbeck, S. A Debugging Perspective on End-‐User Mashup Programming. Visual Languages and Human-‐Centric Computing (VL/HCC), 2010 IEEE Symposium on, (2010), 149–156. 5. Chan, B., Wu, L., Talbot, J., Cammarano, M., and Hanrahan, P. Vispedia: Interactive Visual Exploration of Wikipedia Data via Search-‐Based Integration. IEEE Transactions on Visualization and Computer Graphics 14, 6 (2008), 1213–
1220. 6. Chang, K.S.-‐P. and Myers, B.A. WebCrystal: Understanding and Reusing Examples in Web Authoring. Proceedings of the SIGCHI Conference on Human Factors in Computing Systems, ACM (2012), 3205–3214. 7. Chang, K.S.-‐P. and Myers, B.A. Creating Interactive Web Data Applications with Spreadsheets. Proceedings of the 27th Annual ACM Symposium on User Interface Software and Technology, ACM (2014), 87–96. 8. Chang, K.S.-‐P. and Myers, B.A. A spreadsheet model for using web service data. Visual Languages and Human-‐Centric Computing (VL/HCC), 2014 IEEE Symposium on, (2014), 169–176. 9. Chang, K.S.-‐P. and Myers, B.A. A Spreadsheet Model for Handling Streaming Data. Proceedings of the SIGCHI Conference on Human Factors in Computing Systems, ACM (2015), To appear. 10. Choe, E.K., Lee, N.B., Lee, B., Pratt, W., and Kientz, J.A. Understanding Quantified-‐selfers’ Practices in Collecting and Exploring Personal Data. Proceedings of the SIGCHI Conference on Human Factors in Computing Systems, ACM (2014), 1143–1152. 11. Fisher, D., Popov, I., Drucker, S., and Schraefel, M. c. Trust Me, I’M Partially Right: Incremental Visualization Lets Analysts Explore Large Datasets Faster. Proceedings of the SIGCHI Conference on Human Factors in Computing Systems, ACM (2012), 1673–1682. 12. Gulwani, S. and Marron, M. NLyze: Interactive Programming by Natural Language for Spreadsheet Data Analysis and Manipulation. Proceedings of the 29 2014 ACM SIGMOD International Conference on Management of Data, ACM (2014), 803–814. 13. Guo, P.J., Kandel, S., Hellerstein, J.M., and Heer, J. Proactive Wrangling: Mixed-‐
initiative End-‐user Programming of Data Transformation Scripts. Proceedings of the 24th Annual ACM Symposium on User Interface Software and Technology, ACM (2011), 65–74. 14. Harris, W.R. and Gulwani, S. Spreadsheet Table Transformations from Examples. Proceedings of the 32Nd ACM SIGPLAN Conference on Programming Language Design and Implementation, ACM (2011), 317–328. 15. Hartmann, B., Wu, L., Collins, K., and Klemmer, S.R. Programming by a sample: rapidly creating web applications with d.mix. Proceedings of the 20th annual ACM symposium on User interface software and technology, ACM (2007), 241–
250. 16. Hartwig, F. and Dearing, B.E. Exploratory data analysis. Sage, 1979. 17. Huynh, D.F., Miller, R.C., and Karger, D.R. Enabling Web Browsers to Augment Web Sites’ Filtering and Sorting Functionalities. Proceedings of the 19th Annual ACM Symposium on User Interface Software and Technology, ACM (2006), 125–134. 18. Kandogan, E., Haber, E., Barrett, R., Cypher, A., Maglio, P., and Zhao, H. A1: End-‐user Programming for Web-‐based System Administration. Proceedings of the 18th Annual ACM Symposium on User Interface Software and Technology, ACM (2005), 211–220. 19. Kim, S., Mankoff, J., and Paulos, E. Sensr: evaluating a flexible framework for authoring mobile data-‐collection tools for citizen science. Proceedings of the 2013 conference on Computer supported cooperative work, ACM (2013), 1453–
1462. 20. Van Kleek, M., Smith, D.A., Packer, H.S., Skinner, J., and Shadbolt, N.R. Carpé Data: Supporting Serendipitous Data Integration in Personal Information Management. Proceedings of the SIGCHI Conference on Human Factors in Computing Systems, ACM (2013), 2339–2348. 21. Kumar, R., Talton, J.O., Ahmad, S., and Klemmer, S.R. Bricolage: Example-‐based Retargeting for Web Design. Proceedings of the SIGCHI Conference on Human Factors in Computing Systems, ACM (2011), 2197–2206. 22. Lin, J., Wong, J., Nichols, J., Cypher, A., and Lau, T.A. End-‐user programming of mashups with vegemite. Proceedings of the 14th international conference on Intelligent user interfaces, ACM (2009), 97–106. 30 23. Melnik, S., Gubarev, A., Long, J.J., et al. Dremel: Interactive Analysis of Web-‐
scale Datasets. Proc. VLDB Endow. 3, 1-‐2 (2010), 330–339. 24. Myers, B.A., Giuse, D.A., Dannenberg, R.B., et al. Garnet: Comprehensive Support for Graphical, Highly Interactive User Interfaces. Computer 23, 11 (1990), 71–85. 25. Myers, B.A., McDaniel, R.G., Miller, R.C., et al. The Amulet Environment: New Models for Effective User Interface Software Development. IEEE Trans. Softw. Eng. 23, 6 (1997), 347–365. 26. Myers, B.A. Visual Programming, Programming by Example, and Program Visualization: A Taxonomy. Proceedings of the SIGCHI Conference on Human Factors in Computing Systems, ACM (1986), 59–66. 27. Myers, B.A. Graphical Techniques in a Spreadsheet for Specifying User Interfaces. Proceedings of the SIGCHI Conference on Human Factors in Computing Systems, ACM (1991), 243–249. 28. Oney, S., Myers, B., and Brandt, J. ConstraintJS: Programming Interactive Behaviors for the Web by Integrating Constraints and States. Proceedings of the 25th Annual ACM Symposium on User Interface Software and Technology, ACM (2012), 229–238. 29. Oney, S. and Myers, B. FireCrystal: Understanding Interactive Behaviors in Dynamic Web Pages. Proceedings of the 2009 IEEE Symposium on Visual Languages and Human-‐Centric Computing (VL/HCC), IEEE Computer Society (2009), 105–108. 30. Rosson, M.B., Ballin, J., and Rode, J. Who, what, and how: a survey of informal and professional Web developers. Visual Languages and Human-‐Centric Computing, 2005 IEEE Symposium on, (2005), 199–206. 31. Sannella, M. Skyblue: A Multi-‐way Local Propagation Constraint Solver for User Interface Construction. Proceedings of the 7th Annual ACM Symposium on User Interface Software and Technology, ACM (1994), 137–146. 32. Tableau Software. Tableau. 2014. http://www.tableausoftware.com/. 33. Tuchinda, R., Szekely, P., and Knoblock, C.A. Building Mashups by example. Proceedings of the 13th international conference on Intelligent user interfaces, ACM (2008), 139–148. 34. Tukey, J.W. Exploratory Data Analysis. (1977). 31 35. Vaziri, M., Tardieu, O., Rabbah, R., Suter, P., and Hirzel, M. Stream Processing with a Spreadsheet. In R. Jones, ed., ECOOP 2014 – Object-‐Oriented Programming SE -‐ 15. Springer Berlin Heidelberg, 2014, 360–384. 36. Viegas, F.B., Wattenberg, M., van Ham, F., Kriss, J., and McKeon, M. ManyEyes: a Site for Visualization at Internet Scale. Visualization and Computer Graphics, IEEE Transactions on 13, 6 (2007), 1121–1128. 37. Walker, M., Takayama, L., and Landay, J.A. High-‐fidelity or low-‐fidelity, paper or computer? Choosing attributes when testing web prototypes. Proceedings of the Human Factors and Ergonomics Society Annual Meeting, (2002), 661–
665. 38. Wilde, N. and Lewis, C. Spreadsheet-‐based Interactive Graphics: From Prototype to Tool. Proceedings of the SIGCHI Conference on Human Factors in Computing Systems, ACM (1990), 153–160. 39. Wong, J. and Hong, J. What do we “mashup” when we make mashups? Proceedings of the 4th international workshop on End-‐user software engineering, ACM (2008), 35–39. 40. Wong, J. and Hong, J.I. Making mashups with marmite: towards end-‐user programming for the web. Proceedings of the SIGCHI Conference on Human Factors in Computing Systems, ACM (2007), 1435–1444. 41. Woo, A., Seth, S., Olson, T., Liu, J., and Zhao, F. A spreadsheet approach to programming and managing sensor networks. Information Processing in Sensor Networks, 2006. IPSN 2006. The Fifth International Conference on, (2006), 424–431. 42. Vander Zanden, B. An Incremental Algorithm for Satisfying Hierarchies of Multiway Dataflow Constraints. ACM Trans. Program. Lang. Syst. 18, 1 (1996), 30–72. 43. Zang, N., Rosson, M.B., and Nasser, V. Mashups: who? what? why? CHI ’08 Extended Abstracts on Human Factors in Computing Systems, ACM (2008), 3171–3176. 44. Quantified Self. http://quantifiedself.com/. 45. Open Data Kit. http://opendatakit.org/. 46. OpenRefine. http://openrefine.org/. 47. Yahoo Pipes. http://pipes.yahoo.com/. 32 48. XPath. http://www.w3.org/TR/xpath/. 49. JSONPath -‐ XPath for JSON. goessner.net/articles/JsonPath/. 50. Handlebar.js. http://handlebarsjs.com/. 51. Scraper. 2010. http://mnmldave.github.io/scraper/. 52. ScraperWiki. 2014. https://scraperwiki.com/.