1
Dealing with messy data
Cleaning data
A. The data cleaning process
It is mandatory for the overall quality of an
assessment to ensure that its primary and
secondary data be of sufficient quality. “Messy
data” refers to data that is riddled with
inconsistencies, because of human error, poorly
designed recording systems, or simply because
there is incomplete control over the format and
type of data imported from external data sources,
such as a database, text file, or a Web page. So,
a column that contains country names may
contain “Burma”, “Myanmar” or “Myanma”.
Data cleaning deals mainly with data problems
once they have occurred. Error-prevention
strategies (see data quality control procedures
later in the document) can reduce many problems
but cannot eliminate them. Many data errors are
detected incidentally during activities other than
data cleaning, i.e.:
When collecting or entering data
When transforming/extracting/transferring
data
When exploring or analysing data
When submitting the draft report to peer
review
Such inconsistencies will impede the data
processing. Care should be taken to ensure data
is as accurate and consistent (i.e. spellings, to
allow aggregation) as possible. Inconsistencies
can wreak havoc when trying to perform analysis
with the data, so they have to be addressed
before starting the analysis.
Used mainly when dealing with large volumes of
data stored in a database, the terms data
cleansing, data cleaning or data scrubbing refer
to the process of detecting, correcting, replacing,
modifying or removing incomplete, incorrect,
irrelevant, corrupt or inaccurate records from a
record set, table, or database.
This document provides guidance for data
analysts to find the right data cleaning strategy
when dealing with needs assessment data, either
primary or secondary. It covers situations where:
Raw data is being produced by assessment
teams using a questionnaire and is entered
into a centralized database.
Data is obtained from secondary sources
(displacement monitoring system, food
security data, census data, etc.) and is
integrated, compared or merged with the data
obtained
from
field
assessment
to
complement the final analysis.
This document complements the ACAPS
technical note on How to approach a dataset
which specifically details data cleaning
operations for primary data entered into an Excel
spreadsheet during rapid assessments.
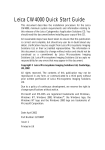
It is more efficient to detect errors by actively
searching for them in a planned way. Data
cleaning involves repeated cycles of screening,
diagnosing, and treatment.
• Lack of data
• Excess of data
• Outliers or
insconsistencies
• Strange patterns
• Suspect analysis results
Screening
Diagnosis
• Missing data
• Errors
• True extremes
• True normal
• No diagnosis, still
suspect
• Leave unchanged
• Correction
• Deletion
Treatment
Adapted from Van den Broeck J, Argeseanu Cunningham S,
Eeckels R, Herbst K (2005)
Screening involves systematically looking for
suspect features in assessment questionnaires,
databases, or analysis datasets (in small
assessments, with the analysts closely involved
at all stages, there may be little or no distinction
between a database and an analysis dataset).
The diagnostic (identifying the nature of the
defective data) and treatment (deleting, editing or
leaving the data as it is) phases of data cleaning
require insight into the sources and types of
errors at all stages of the assessment. After
measurement, data are the object of a sequence
of typical activities: they are entered into
databases, extracted, transferred to other tables,
edited, selected, transformed, summarized, and
presented. It is important to realize that errors can
occur at any stage of the data flow, including
during data cleaning itself.
1
Dealing with messy data
B. Sources of errors
Many of the sources of error in databases fall into
one or more of the following categories:
Measurement errors: Data is generally intended
to measure some physical process, subjects or
objects, i.e. the waiting time at the water point, the
size of a population, the incidence of diseases,
etc. In some cases these measurements are
undertaken by human processes that can have
systematic or random errors in their design (i.e.,
improper sampling strategies) and execution (i.e.,
misuse of instruments, bias, etc.). Identifying and
solving such inconsistencies goes beyond the
scope of this document. It is recommended to
refer to the ACAPS Technical Brief How sure are
you? To get an empirical understanding of how to
deal with measurement errors in general.
Data entry error: "Data entry" is the process of
transferring information from the medium that
records the response (traditionally answers
written on printed questionnaires) to a computer
application. Data entry is generally done by
humans, who typically extract information from
speech (i.e., key informant interviews) or by using
secondary data from written or printed sources
(i.e. health statistics from health centres). Under
time pressure, or for lack of proper supervision,
data is often corrupted at entry time. Main errors
type include:
Adapted from Kim et Al, 2003; Aldo Benini 2013
An erroneous entry happens if, e.g., age is
mistyped as 26 instead of 25.
Extraneous entries add correct, but unwanted
information, e.g. name and title in a name-only
field.
Incorrectly derived value occurs when a
function was incorrectly calculated for a
derived field (i.e. error in the age derived from
the date of birth).
Inconsistencies across tables or files occur
e.g. when the number of visited sites in the
province table and the number of visited sites
in the total sample table do not match.
Processing errors: In many settings, raw data are
pre-processed before they are entered into a
database. This data processing is done for a
variety of reasons: to reduce the complexity or
noise in the raw data, to emphasize aggregate
properties of the raw data (often with some
editorial bias), and in some cases simply to
reduce the volume of data being stored. All these
processes have the potential to produce errors.
Data integration errors: It is actually quite rare for
a database of significant size and age to contain
data from a single source, collected and entered
in the same way over time. Very often, a
database contains information collected from
multiple sources via multiple methods over time
(i.e. tracking of affected population numbers over
the crisis, where the definition of “affected” is
being refined or changed over time). Moreover, in
practice, many databases evolve by merging in
other pre-existing databases; this merging task
almost always requires some attempt to resolve
inconsistencies across the databases involving
different data units, measurement periods,
formats, and so on. Any procedure that integrates
data from multiple sources can lead to errors. The
merging of two or more databases will both
identify errors (where there are differences
between the two databases) and create new
errors (i.e. duplicate records).
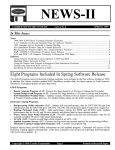
Table 1 below illustrates some of the possible
sources and types of errors in a large
assessment, at three basic levels: When filling
the questionnaire, when entering data into the
database and when performing the analysis.
2
Dealing with messy data
Table 1: Sources of data error
Stage
C. First things first
Sources of problems
Lack or excess of
Outliers and
data
inconsistencies
Questionnaire
Form missing
Form double,
collected repeatedly
Answering box or
options left blank
More than one
option selected
when not allowed
Correct value filled out
in the wrong box
Not readable
Writing error
Answer given is out of
expected (conditional)
range
Database
Lack or excess of
data transferred from
the questionnaire
Form of field not
entered
Value entered in
wrong field
Inadvertent deletion
and duplication
during database
handling
Outliers and
inconsistencies carried
over from
questionnaire
Value incorrectly
entered, misspelling
Value incorrectly
changed during
previous data cleaning
Transformation
(programming) error
Lack or excess of
data extracted from
the database
Data extraction,
coding or transfer
error
Deletions or
duplications by
analyst
Outliers and
inconsistencies carried
over from the
database
Data extraction, coding
or transfer error
Sorting errors
(spreadsheets)
Data-cleaning errors
Analysis
Adapted from Van den Broeck J, Argeseanu Cunningham S,
Eeckels R, Herbst K (2005)
Inaccuracy of a single measurement and data
point may be acceptable, and related to the
inherent technical error of the measurement
instrument. Hence, data cleaning should focus on
those errors that are beyond small technical
variations and that produce a major shift within or
beyond the analysis. Similarly and under time
pressure, consider the diminishing marginal utility
of cleaning more and more compared to other
demanding tasks such as analysis, visual display
and interpretation.
Understand when and how errors are
produced during the data flow.
Prioritization is essential if the assessment is
under time pressures. Resources for data
cleaning are limited. Errors related to
population number, geo location, affected
groups and date are particularly important
because they contaminate derived variables
and the final analysis. Know when to stop.
The following sections of this document offer a
step by step approach to data cleaning.
The first thing to do is to make a copy of the
original data in a separate workbook and name
the sheets appropriately, or save in a new file.
ALWAYS keep the source files in a separate
folder and change its attribute to READ-ONLY, to
avoid modifying any of those files, even if it is
opened for reference.
D. Screening data
No matter how data are collected (in face-to-face
interviews,
telephone
interviews,
selfadministered questionnaires, etc.), there will be
some level of error, including a number of
inconsistencies. While some of these will be
legitimate, reflecting variation in the context,
others will likely reflect a data collection error.
Examine data for the following possible errors:
Spelling and formatting irregularities: are they
categorical variables written incorrectly? Are
date format consistent? Etc.
Lack of data: Do some questions have far
fewer answers than surrounding questions?
Excess of data: Are there duplicate entries?
Are there more answers than originally
allowed?
Outliers/inconsistencies: Are there values that
are so far beyond the typical distribution that
they seem potentially erroneous?
Strange patterns: Are there patterns that
suggest cheating rather than honest answers
(i.e. several questionnaires with the exact
same answers)?
Suspect analysis results: Do the answers to
some questions seem counterintuitive or
extremely unlikely?
Screening methods are not only statistical:
Many outliers are detected by perceived nonconformity with prior expectations, based on
the analyst's experience, results from
secondary data review, numerical constraints
or common sense (weight can’t be negative,
people can’t have more than 2 parents,
women can’t bear 35 children, male can’t be
pregnant, etc.).
3
Dealing with messy data
Descriptive tools can be used to predefine
expectations, assumptions or criteria about
normal ranges, distribution shapes, and
strength of relationships. Comparison of the
data with the generated assumptions or
criteria can be partly automated (i.e.
conditional formatting) and lead to flagging of
dubious data, patterns, or results.
A particular problem is that of erroneous inliers,
i.e., data points generated by error but falling
within the expected range. Erroneous inliers will
often escape detection. Detection approaches
include:
Viewing data in relation to other variables,
using multivariate views, such as scatter plots
or heatmap. More advanced and resource
intensive techniques involves regression
analysis or consistency checks.
Examining the history of each data point or by
re-measurement, however such examination
is rarely feasible. Instead, one can examine
and/or re-measure a sample of inliers to
estimate an error rate (i.e. contacting
enumerators or key informants to ask
additional questions).
Useful screening methods are listed hereafter,
from simpler to more complex:
Browsing of data tables after sorting.
Summary statistics.
When time allows, validated data entry and
double data entry.
Printouts of variables not passing range
checks and of records not passing consistency
checks.
Frequency distributions and cross-tabulations.
Graphical exploration of distributions: box
plots, histograms, and scatter plots using
visual analysis software such as Tableau
desktop.
Plots of repeated measurements on the same
individual, i.e., growth curves.
Checking of questionnaires using fixed
algorithms.
Statistical outlier detection.
In many if not most instances, data can only
be cleaned effectively with some human
involvement. Know (and/or train data
cleaners) common mistakes and what errors
to look for.
Understanding properties of a dataset,
including the identification and possible
rectification of errors, is closely linked to
exploratory
data
analysis
and
data
visualization.
Choose the right error detection strategies
based on the type of data screened:
quantitative, categorical data, P-Codes, or
identifiers are subject to different errors type
(i.e. misspelling for categorical variable) that
calls for different detection approaches (spell
check for misspelled categorical variable).
E. Diagnosing data
From the screening phase, you have highlighted
data that needs investigation. To clarify suspect
data, you often must review all of a respondent’s
answers to determine if the data makes sense
taken in context. Sometimes you must review a
cross-section of different respondents’ answers,
to identify issues such as a skip pattern that was
specified incorrectly.
With this research complete, what is the true
nature of the data that has been highlighted?
Possible diagnoses for each data point are as
follows:
Missing data: Answers omitted by the
respondent (nonresponse), questions skipped
over by the enumerator / the data entry
operator or dropout (when research is
undertaken overtime such as school
attendance).
Errors: Typos or answers that indicate the
question was misunderstood.
True extreme: An answer that seems high but
can be justified by other answers (i.e., the
respondent working 60 hours a week because
they work a full-time job and a part-time job)
True normal: A valid record.
No diagnosis, still suspect: You may need to
make a judgment call on how to treat this data
during the treatment phase.
4
Dealing with messy data
Some data values are clearly logically or
biologically impossible (you cannot be 200 years
old or -176cm). Hence, one may pre-define cutoffs for immediate diagnosis of error. Sometimes
values fall in between acceptable ranges and the
diagnosis will be less straightforward. In these
cases, it is necessary to apply a combination of
diagnostic procedures:
Go back to previous stages of the data flow to
see whether a value is consistently the same.
This requires access to well-archived and
documented data with justifications for any
changes made at any stage.
Look for information that could confirm the true
extreme status of an outlying data point. For
example, a very low score for weight-for-age
(i.e., −6 Z-scores) might be due to errors in the
measurement of age or weight, or the subject
may be extremely malnourished, in which
case other nutritional variables should also
have extremely low values. This type of
procedure requires insight into the coherence
of variables in a biological or statistical sense.
Again, such insight is usually available from
experience or lessons learnt and can be used
to plan and program data cleaning.
Collect additional information, i.e., question
the enumerator about what may have
happened and, if possible or necessary,
repeat the measurement. Such procedures
can only happen if data cleaning starts soon
after data collection, and sometimes remeasuring is only valuable very shortly after
the initial measurement.
The diagnostic phase is labour intensive and the
budgetary, logistical, time and personnel
requirements are typically underestimated or
even neglected at the design stage. Costs may
be lower if the data-cleaning process is planned
and starts early in data collection.
Use common sense, experience, triangulation
and lessons learnt to diagnose the type of
error.
Design your questionnaire form carefully to
allow cross checks between questions.
F. Treatment of data
After identification of errors, missing values, and
true (extreme or normal) values, analysts must
decide what to do with problematic observations:
Leave it unchanged: The most conservative
course of action is to accept this data as a valid
response and make no change to it. The larger
your sample size, the less one suspect
response will affect the analysis; the smaller
your sample size, the more difficult the
decision.
Correct the data: If the respondent’s original
intent can be determined, then fix their answer
(i.e. after discussing with the enumerator, it is
clear that the ratings were reversed by
mistake; you can invert each of the answers to
correct the issue).
Delete the data: The data seems illogical and
the value is so far from the norm that it will
affect descriptive or inferential statistics. What
to do? Delete just this response or delete the
entire record? Remember that whenever you
begin to toss out data, it raises the possibility
that you are “cherry picking” the data to get the
answer you want. Alternatively, you can create
a binary variable, 1=suspicious record, 0=not
so and use this new variable as a record filter
in Pivot tables or in-table filtering to
understand the impact of potentially erroneous
data in your final results.
Re-measure the suspect or erroneous values,
if time and resources allows.
There are some general rules to support the
decision:
If the person doing the data entry has entered
values different from the ones in the
questionnaire, the value should be changed to
what was recorded in the questionnaire form.
(I.e. the value in the questionnaire was 40,000
and the data entry operator keyed in 4,000 – a
zero was left out).
When variable values do not make sense, if
there is no data entry error, and there are no
notes to help you determine where the error
comes from, you must leave the data AS IT IS.
The case should be listed as an outlier (i.e. by
using conditional formatting for instance), and
there is no justification for changing it. Extreme
values falling into this category must be
5
Dealing with messy data
handled by the person who is analysing the
data. If you change the value because you
think you know what is “reasonable”, you are
biasing the data.
When blank cases were inserted or the record
type was required even though key informants
may not have that type of data or duplicate
records were entered, then cases must be
deleted from the data file.
Impossible values are never left unchanged,
but should be corrected if a correct value can
be found, otherwise they should be deleted.
For biological continuous variables, some
within-subject variation or small measurement
variation will always be present. If a remeasurement is done very rapidly after the
initial one and the two values are close enough
to be explained by variation alone, take the
average of both as the final value.
With true extreme values and with values that are
still suspect after the diagnostic phase, the
analyst should examine the influence of such
data points, individually and as a group, on
analysis results before deciding whether or not to
leave the data unchanged.
Some authors have recommended that true
extreme values should always stay in the
analysis. In practice, many exceptions are made
to that rule. The investigator may not want to
consider the effect of true extreme values if they
result from an unanticipated extraneous process.
This becomes an “a posteriori” exclusion
criterion. The data points should be reported as
“excluded from analysis” in the methodology
chapter of the final report.
Missing values require particular attention. This is
not a data issue like skewness or outliers that you
can just ignore (whether you are right or not). The
first thing is to decide which blank cells need to
be filled with zeros (because they represent
genuine negative observations, such as ("no",
"not present", "option not taken", etc.) and which
to leave blank (if the convention is to use blanks
for missing or not applicable). Some analysts
replace blank cells with some explicit missing
value code (if we want all missing to be explicitly
coded).
What to do with those cells remaining blank?
Missing values can be classified as either random
or non-random:
Random missing values may occur because
the subject inadvertently did not answer some
questions. The assessment may be overly
complex and/or long, or the enumerator may
be tired and/or not paying attention, and miss
the question. Random missing values may
also occur through data entry mistakes. If
there are only a small number of missing
values in your dataset (typically, less than
5%), then it is extremely likely to be random.
Non-random missing values may occur
because the key informant purposefully did not
answer some questions (confusing or
sensitive question, no appropriate choices
such as “no opinion” or “not applicable”).
The default option for dealing with missing values
is filtering and excluding from analysis:
Listwise / casewise deletion: cases that have
missing values on the variable(s) under
analysis are excluded. If you are only
analysing one variable, then listwise deletion
is simply analysing the existing data. If you are
analysing multiple variables, then listwise
deletion removes cases if there is a missing
value on any of the variables. The
disadvantage is a loss of data because you
are removing all data from cases who may
have answered some of the questions, but not
others (e.g., the missing data).
Pairwise deletion: All available data is
included. Unlike listwise deletion which
removes cases (subjects) that have missing
values on any of the variables under analysis,
pairwise deletion only removes the specific
missing values from the analysis (not the
entire case). In other words, all available data
is included. If you are conducting a correlation
on multiple variables, this technique allow to
conduct the bivariate correlation between all
available data points, and ignore only those
missing values if they exist on some variables.
In this case, pairwise deletion will result in
different sample sizes for each correlation.
Pairwise deletion is useful when sample size
is small or missing values are large because
there are not many values to begin with, so
why omit even more with listwise deletion.
6
Dealing with messy data
Try conducting the same test using both deletion
methods to see how the outcome change. Note
that in these techniques, "deletion" means
exclusion within a statistical procedure, not
deletion (of variables or cases) from the dataset.
A second option is to delete all cases with missing
values. Thus, you are left with complete data for
all cases. The disadvantage to this approach is
you reduce the sample size of your data, resulting
in a loss of power and increased error in
estimation (wider confidence intervals). If you
have a large dataset, then it may not be a big
disadvantage because you have enough cases
even after the complete deletion. However, with
a small dataset, the sample can be decimated,
and results may be biased if missingness is nonrandom. Another disadvantage to this approach
is that the subjects with missing values may be
different than the subjects without missing values
(e.g., missing values that are non-random), so
you have a non-representative sample after
removing the cases with missing values.
Another option is to replace the missing values,
called imputation (single or multiple). This
technique preserves all cases by replacing
missing data with a probable value based on
other available information (i.e. the mean or
median of other similar observed values). Once
all missing values have been imputed, the data
set can then be analysed using standard
techniques for complete data. However this
method can also bias results and p-values.
Recently and under certain conditions, maximum
likelihood approaches have also proven efficient
to dealing with missing data.
Detailing technicalities, appropriateness and
validity of each techniques goes beyond the
scope of this document. Ultimately, choosing the
right technique depends on how much data are
missing (and why), patterns, randomness and
distribution of missing values, the effects of the
missing data and how you will use the data in
your analysis. It is strongly recommended to refer
to a statistician if you face a small dataset with
large quantities of missing values.
Pragmatically, for needs assessment with few
statistical resources, creating a copy of the
variable and replacing missing values with the
mean or median may often be enough and
preferable to losing cases in multivariate analysis
from small samples.
Also, answering somehow plausibly why data are
missing ("women could not be interviewed", “the
last questionnaire section could not be filled due
to lack of time”) may be much more informative to
end user’s than a plethora of statistical fixes. Look
for meaning in non-random missingness. Maybe
the respondents are telling you something
important by not answering one of the questions.
Set up a dummy variable with value 0 for those
who answered the question and value 1 for those
who did not. Use this dummy variable as one of
the predictors of the outcome variable.
G. Recoding variables
You may need to recode variables to create new
ones that fit your analytic needs. Recoding
variables is useful in multiple scenarios, such as:
Formatting: date (day, month, and year), prefixes to create better sorting in tables,
rounding (in continuous variables).
Syntax: Translation, language style and
simplification.
Recoding a categorical variable (e.g. ethnicity,
occupation, an “other” category, spelling
corrections, etc.).
Recoding a continuous variable (e.g. age) into
a categorical variable (e.g. age group).
Combining the values of a variables into fewer
categories (e.g. grouping all problems caused
by access issues).
Combining several variables to create a new
variable (e.g., building an index based on a set
of variables).
Defining a condition based on certain cut-off
values (e.g., population “at risk” vs. “at acute
risk”).
Changing a level of measurement (e.g. from
interval to ordinal scale).
7
Dealing with messy data
Conceptually, a distinction is needed between:
Activities related to recoding “messy data” (i.e.
an open question about interventions
preferred by the population) so they become
structured or formatted in a way that is useful
for primary analysis.
Activities that include deriving new values out
of others, such as creating calculation (i.e.
percentage), parsing, merging, etc. Here, the
analyst is re-expressing what the data have to
say in other terms (i.e. re-expressing deviation
as a % change, weighted or moving average,
etc.). However, the data has (normally)
already gone through a cleaning stage before
to be transformed.
Recoding variables or values can serve both the
purpose of cleaning dirty data and/or
transforming clean data. This section focuses
primarily on the cleaning objectives rather than
the re-expression of values which will be tackled
more extensively in another chapter of this
document.
Recoding categorical variables starts with a full
listing of all variants used in a variable, together
with their frequencies. The variant list can be
copied into a fresh sheet, to create a table of
variants and their desired replacements.
ALWAYS keep a copy of the original values, and
try out different recoding schemes before settling
on a final one.
There are three ways to recode categorical data:
collapse a categorical variable into fewer
categories, break a categorical variable up into
several variables with fewer categories or
combine several categorical variables into fewer
variables with more categories.
Collapsing is done to combine categories that
logically go together or to eliminate categories
that have small numbers of observations.
Guidelines for collapsing data are as follows:
Ordinal variables need to be collapsed in a
method that preserves the ordering of
categories.
Combine only categories that go together.
Don't combine two logically distinct categories
just to eliminate categories with small numbers
(e.g. lack of access due to lack of income and
lack of access due to insecurity) as
interpretation of data becomes difficult or
meaningless.
The way in which categories are collapsed can
easily affect the significance level of statistical
tests. Categories should be collapsed a priori
to avoid the criticism that the data were
manipulated just to get a certain result. This
does not mean you have to decide this before
you collect the data (if you did, you wouldn't
bother to collect separate categories).
Do not oversimplify the data. Unnecessary
reduction in the number of categories may
reduce statistical power and obscure
relationships in the data. As a general
guideline, you should keep intact any
categories that include 10% or more of your
data (or 5 cases, for very small samples).
Breaking: There are several reasons for breaking
a categorical variable into several smaller
variables:
Data was collected in a manner easy to collect
to ease the burden of data collection on the
subject. For example, it is easier for the key
informant to provide a list of issues than to
review a long list of problems.
A variable may contain more than one
"concept." For example, consider the ordinal
variable “severity” below:
1.
2.
3.
4.
There are no shortages
A few people are facing shortages
Many people are facing shortages
Shortages are affecting everyone
This variable contains two concepts, “shortages”
and “number of people affected”. It is
straightforward to code two new variables,
shortages (0 = no shortages, 1 = shortage) and
number of people (0 = no people, I= Few people,
2=Many people, 4= All of them).
Combining is the reverse process of breaking up,
such as combining “shortages” and “number of
people” back into the variable “severity”.
8
Dealing with messy data
Main techniques for transforming quantitative
data into another quantitative variable include:
Linear
transformation
(i.e.
converting
temperature from degrees Fahrenheit to
degrees Celsius, Z-score).
Non-linear
transformations
(logarithmic
transformation, square root).
Ranking: in a variable having N distinct values,
the lowest value is given a rank of 1, the next
lowest a rank of 2, continuing until the highest
value is given a rank of N (i.e. tests score).
Recoding variables can be tedious. The
conceptual effort needed in order to produce a
meaningfully recoded category set is often
underestimated. Care must be taken to evaluate
the combined category sets, to absorb excessive,
incoherent or rarely used categories into broader
ones, and to be clear about the rationale for the
final number and content of distinct categories.
Also, be aware that any recoding that reduces the
number of categories entails some information
loss. As in all stages of data analysis, analysts
must be alert for errors.
Basic tips for effective recoding include:
Use distinct and easy to remember variable
names. Never use the same variable name to
denote
both
the
transformed
and
untransformed variable. For large data sets, a
systematic way to name variables is desirable.
Pay attention to missing values. When
recoding is done, the number of cases with
missing data should be the same as before
recoding. A check that this is so will often be
the first clue that recoding was in error. A safe
procedure is to start the recoding process by
setting the new variable to missing for all
cases, and then changing missing values only
for those with data on the initial variables to be
recoded. For complicated recoding, check a
few individual values by hand to make sure
they were recoded properly, and check the
distribution of values.
Use graphs to check the accuracy of recoding.
Recoding is a systematic translation of data
values, so scatterplots of raw data v recoded
data should show highly organized patterns
reflecting the recoding system. Histograms
can show whether your data is now more
normally distributed.
Use variable codes consistently. For example,
with dichotomous "yes/no" variables, always
use 0 = no and 1 = yes. For polychotomous
variables, always make 0 the reference
category.
Keep a permanent record of your recoding.
For data entry errors, we recommend you
make your changes in your raw data file,
because you never want to see the data entry
errors again. With recoding, you may at some
point want to go back to your initial data, so
don't change your raw data file. Most statistical
programs save their data in a specially
formatted file, and this file is the one to
change. Your recoding commands should all
be put in one program (a do file) that you can
execute again, because inevitably you will
discover a data entry error you missed,
change your raw data and have to recode
again. The do file serves as a permanent
record as well.
H. Feedback
Once errors have been identified, diagnosed and
treated and if data collection/entry is still ongoing,
the person in charge of data cleaning should give
instructions to enumerators or data entry
operators to prevent further mistakes, especially
if they are identified as non-random.
Feedback will ensure frequent errors are not
repeated and will improve the assessment
validity and the precision of outcomes. Main
recommendations or corrections can include:
Programming of data capture, data
transformations, and data extractions may
need revision.
Corrections of questions in the questionnaire
form.
Amendment of the assessment protocol,
design, timing, enumerators training, data
collection, and quality control procedures.
In extreme cases, it may be necessary to reconduct some field assessment (few sites) or
contact again key informants or enumerators
to ask additional information or more details or
confirm some records.
9
Dealing with messy data
Data cleaning often leads to insight into the
nature and severity of error-generating
processes.
Identify basic causes of errors detected and
use that information to improve data collection
and the data entry process to prevent those
errors to re-occurring.
Reconsider prior expectations and/or review
or update quality control procedures.
STATA, etc.) to highlight rule violations (null
codes, conditional formatting, etc.) and prevent
mistakes (i.e. drop down menus). The decision to
include those rules in the database must be
pragmatic, weighing up the merits of having
errors detected and rectified by data entry staff,
versus the time required to set this up and to
quickly make necessary adjustments if the initial
setup does not work as expected. Five kind of
checks can be automated:
I.
Range checks ensure that every variable in the
survey contains only data within a limited domain
of valid values. Categorical variables can have
only one of the values predefined for them on the
questionnaire (for example, gender can be coded
only as “1” for males or “2” for females);
chronological variables should contain valid
dates, and numerical variables should lie within
prescribed minimum and maximum values (such
as 0 to 120 years for age and should always be
expressed as integer of years, with rules for
rounding up or down for infants).
Reference data check are used when the data
from two or more closely related fields can be
checked against external reference tables, i.e.
when the recorded values for height, weight and
age are checked against the World Health
Organization’s standard reference tables.
Quality control procedures
Error prevention is far superior to error detection
and cleaning, as it is cheaper and more efficient
to prevent errors than to try and find them and
correct them later.
When deciding upon an approach to data
cleaning, it is useful to consider the different types
of errors which can be made, and to plan at what
point in your data flow (Table 1) you will try to
prevent and/or identify them. Best practices
include:
Make sure the staff with responsibilities regarding
data quality are aware of the cleaning protocols
(see annex 1 for a complete checklist for needs
assessments). Roles and responsibilities related
to error detection and correction should be clearly
defined and communicated as part of the job
descriptions (see Annex 2), at each stage of the
data collection, entry and processing.
Ensure that a second pair of eyes review and
compare source data to data entered. Data
cleaning should starts in the field (field editing)
alongside data collection, as questionnaires are
reviewed by supervisors or field editors on a daily
basis. Similarly during data entry, double checks
should be mandatory, especially when:
There is a process of translation at data entry,
to ensure consistency/accuracy of translation.
Data entry is distributed across various field
locations and consolidation occurs in a
different location.
At the data entry stage, computer-assisted quality
control procedures should be used. Additional
functionality can be added in the data entry
software (i.e. Excel, SPHINX, Ethnos, SPSS,
Skip checks verify whether the skip patterns have
been followed appropriately. For example, a
simple check verifies that questions to be asked
only of schoolchildren are not recorded for a child
who answered "no" to an initial question on
school enrolment.
Consistency checks verify that values from one
question are consistent with values from another
question, for example, the date of birth and age
of a given individual.
Typographical checks limit, for instance, the
transposition of digits like entering “14” rather
than “41” in a numerical input. Such a mistake for
age might be caught by consistency checks with
marital status or family relation. Control totals, for
instance, can significantly reduce typographical
errors.
10
Dealing with messy data
Document the rules to follow, where focus
should be given, and how to solve
errors/issues. Plan double checks.
Communicate
clear
instructions
to
enumerators, team leaders, data entry clerk,
at all relevant stages of the data flow.
Ensure that data entry staff are familiar with
the questionnaire filling procedures, so that
mistakes can be identified early on and
verified/rectified (i.e. rules such as ‘pick only
three’ or ‘must add to 100 %’).
Design a data-cleaning plan, including:
a) Budget, timeframe and staff requirements.
b) Screening tools.
c) Diagnostic procedures used to discern errors
(on going periodic basis and towards the end
of the assessment).
d) Instructions or training to enumerators and
data entry staff in case of protocol violation
and consistency check.
e) Decision rules that will be applied in the editing
phase.
J. Data integration
Data sometimes is fine on its own, but becomes
problematic when you want to integrate or merge
it with other data.
Analysts don't always have control over the
format and type of data that they import from an
external data source, such as a database, text
file, or a Web page. Most common problems are
as follow:
Formats: Not everyone uses the same format.
Dates are especially problematic (26/02/1977,
26 February 1977, 26-02-1977, etc.). Analysts
also need to be aware that different
applications store dates internally in different
ways. Thus simple copy-paste from one
application to another will cause errors across
the board.
Units: litre, gallons, gourdes, etc.
Ranges: Age intervals might differ from one
survey to another. Sometimes it is possible to
bin it (i.e. if you have the birth date, you can
virtually create any age interval needed),
sometimes not (the age intervals available are
different from those you need).
Inconsistency: When merging different data
source, conflicting information can emerge.
Analysts must choose between using both,
using the most recently updated information,
the most trusted source, investigate further or
use neither. However, duplicate records
should be flagged on merging so that they can
be identified and excluded from analysis in
cases where duplicate records may bias an
analysis, etc., but should generally not be
deleted. While appearing to be duplicates, in
many cases the records in the two databases
may include some information that is unique to
each, so just deleting one of the duplicates
(“merge and purge”) is not always a good
option as it can lead to valuable data loss.
Spelling: Categorical variable, and specifically
place names, may have different spelling.
Loss of bits of data: Some pieces of data,
columns or rows are lost when extracted, i.e.
when web scrapping or extracting from a pdf
(good luck!).
Data is dirty. Live with it. Analysts assuming
that raw data comes clean and bypassing
basic checks live dangerously.
Check the dataset documentation available. If
not available (even after request), DO NOT
TRUST THE DATA, even if the source is
generally reliable. Start checking for quality.
Even under time pressure, take the time to
screen the data for 15-30mn, focusing first on
spelling and formatting, then on outliers (use
conditional formatting for quick visual
detection). If no mistakes are spotted during
this time interval, it is probably of good quality
and usable as it is. If mistakes are detected,
then proceed rigorously and methodically to
screening, diagnosing and treatment.
K. Documenting changes
Good practice for data management require
transparency and proper documentation of all
procedures. Data cleaning documentation should
not be an exception.
11
Dealing with messy data
Documentation of error, alterations, additions and
error checking is essential to:
Maintain data quality
Avoid duplication of error checking by different
data cleaners.
Recover data cleaning errors
Determine the fitness of the data for use.
Inform users who may have used the data
knowing what changes have been made since
they last accessed the data
Create a change log within your workbook, where
you will store all information related to modified
fields. This will serve as an audit trail showing any
modifications, and will allow a roll back to the
original value if required. Within the change log,
store the following fields:
Table (if multiple tables are implemented)
Column, Row
Date changed
Changed by
Old value
New value
Comments
Make sure to document in your database what
data cleaning steps and procedures were
implemented or followed, by whom, how many
responses were affected and for which
questions.
ALWAYS make this information available
when sharing the dataset internally or
externally (i.e. by enclosing the change log in
a separate worksheet)
L. Key principles for data cleaning
Key principles for cleaning data are as follows:
1. Create a backup copy of the original data in a
separate workbook.
2. Create a routine for back up, at successive
points of collating, cleaning and analysing
save documents with file names that combine
date and time (yymmdd-time prefixed allow for
files to be sorted by order of creation).
3. When integrating or merging data, ensure that
the data is in a tabular format of rows and
columns with: similar data in each column, all
columns and rows visible, and no blank rows
within the range. Check that there is no
subtotals, totals or other calculated records
down the columns. Calculated variables to the
right are no problem.
4. Format the database for readability and easy
navigation: Text left align, number right
aligned, variable title horizontal, text variables
fully visible, column separated by bold lines,
header with background colours, numbers
comma separated every 3 digits, etc.
5. Do tasks that don't require column
manipulation first, such as spell-checking or
using the Find and Replace function.
6. Next, do tasks that do require column
manipulation. The general steps for
manipulating a column are:
Insert a new column (B) next to the original
column (A) that needs cleaning.
Transform the data in the column (B).
Remove the original column (A), which
converts the new column from B to A.
Keep the questionnaire close. As each check is
done, a list of issues will be produced. The
questionnaires should be consulted to double
check or identify the problems.
When you are checking for one type of
problem for one site or key informant, verify
that the data for the other variables for that
case have been entered correctly.
Look at the values in all the variables and all
the cases for that site, key informant or
enumerator. Occasionally the data entry
person will skip a variable or a key in the
values from the previous variable or the
subsequent variable, and all the data that have
been entered after will not be correct. If you
can identify such a problem and fix all the
variables, that questionnaire will not show up
on subsequent checking.
Planning and budgeting for data cleaning is
essential.
Organizing data improves efficiency, i.e. by
sorting data on location or records by
enumerator.
Prevention is better than cure. It is far more
efficient to prevent an error than to have to find
it and correct it later.
12
Dealing with messy data
Responsibility
belongs
to
everyone,
enumerators, custodian and users.
Prioritisation reduces duplication. Concentrate
on those records where extensive data can be
cleaned at the lowest cost or that are of most
value to end users.
Feedback is a two way street: data users or
analyst will inevitably carry out error detection
and must feedback data custodians. Develop
feedback mechanisms and encourage users
to report back.
Education and training improve techniques:
Poor training of enumerators and data entry
operators is the cause of a large proportion of
the errors. Train them on quality requirements
(readability, etc.) and documentation,
Data cleaning processes need to be
transparent and well documented with a good
audit trail to reduce duplication and to ensure
that once corrected, errors never re-occur.
Documentation is the key to good data quality.
Without good documentation, it is difficult for
users to determine the fitness for use of the
data and difficult for custodians to know what
and by whom data quality checks have been
carried out.
M. Tools and tutorials for data cleaning
Spreadsheets like Excel offer the capability to
easily sort data, calculate new columns, move
and delete columns, and aggregate data. For
data cleaning of humanitarian assessment data,
ACAPS developed a specific technical note
providing a step by step approach in Excel and
detailing cleansing operations, supported by a
demo workbook.
For generic instructions about how to use excel
formulas, functionalities or options to clean data,
the following Microsoft office guidance are
available:
Spell checking
Removing duplicate rows
Finding and replacing text
Changing the case of text
Removing spaces and nonprinting characters
from text
Fixing numbers and number signs
Fixing dates and times
Merging and splitting columns
Transforming and rearranging columns and
rows
Reconciling table data by joining or matching
Third-party providers
Those tips have also been commented for their
usefulness for data mining Here.
Openrefine (ex-Google Refine) and LODRefine
are powerful tools for working with messy data,
cleaning it, or transforming it from one format into
another. Videos and tutorials are available to
learn about the different functionalities offered by
this software. Especially the facets function can
very efficiently and quickly gives a feel for the
range of variation contained within the dataset.
Detailed data cleansing tutorials and courses are
also available at the school of data:
http://schoolofdata.org/handbook/recipes/clea
ning-data-with-spreadsheets/
http://schoolofdata.org/handbook/courses/dat
a-cleaning/
Another tool to accomplish many of these tasks
is Data Wrangler by the Stanford Visualization
Group. Data Wrangler provides an interface that
can automatically find patterns in your data based
on things you select, and automatically makes
suggestions of what to do with those patterns.
N. References
Jan Van den Broeck, Solveig Argeseanu
Cunningham, Roger Eeckels, Kobus Herbst,
Data Cleaning: Detecting, Diagnosing, and
Editing Data Abnormalities, 2005.
Jason W. Osborne, Best Practices in Data
Cleaning: A Complete Guide to Everything You
Need to Do Before and After Collecting Your
Data, 2013.
Juan Munoz, A guide for data management of
household surveys, Household Sample Surveys
in Developing and Transition Countries, 2005.
http://unstats.un.org/unsd/hhsurveys/
Data cleansing, Wikipedia, retrieved 31 July
2013.
13
Dealing with messy data
http://en.wikipedia.org/wiki/Data_cleansing
Michael Kassoff, Data cleaning, 2003,
http://logic.stanford.edu/classes/cs246/lectures/l
ecture13.pdf
Dr. Nimita Limaye, Clinical data management –
Data cleaning, 2005.
Jeffrey Henning, Data cleaning, 2009,
http://blog.vovici.com/blog/bid/19211/DataCleaning
Joint IDP profiling Service, Manual Data Entry
Staff,
retrieved
July
2013,
http://jet.jips.org/pages/view/toolmap
Data cleaning Guidelines (SPSS and STATA),
1st edition, Michigan State University, 2012,
http://fsg.afre.msu.edu/survey/Data_Cleaning_G
uidelines_SPSS_Stata_1stVer.pdf
ACAPS, 2013, How to approach a dataset –
preparation, available at:
http://www.acaps.org/resourcescats/downloader/
how_to_approach_a_dataset_part_1_data_prep
aration/163/1375434553
And its auxiliary workbook, available at:
http://www.acaps.org/resourcescats/downloader/
how_to_approach_a_dataset_data_managemen
t/164
David M. Buchner, Research in Physical
Medicine
and
Rehabilitation,
http://c.ymcdn.com/sites/www.physiatry.org/reso
urce/resmgr/pdfs/pmr-viii.pdf
Benini, 2011, Friends in Village Development
Bangladesh (FIVDB), Efficient Survey Data
Entry.
http://aldobenini.org/Level2/HumanitData/FIVDB_Benini_E
fficientDataEntry_110314.pdf
ACAPS, 2012, Severity rating, a data
management note.
http://www.acaps.org/resourcescats/downloader/
severity_rating_data_management_note/87/137
6302232
http://www.psychwiki.com/wiki/Identifying_Missin
g_Data
http://www.psychwiki.com/wiki/Dealing_with_Mis
sing_Data
http://www.psychwiki.com/wiki/Missing_Values
The Analysis Institute, 2013, Effectively Dealing
with Missing Data without Biasing your Results,
http://theanalysisinstitute.com/missing-dataworkshop/
Kim et Al. A Taxonomy of Dirty Data, 2003,
http://sci2s.ugr.es/docencia/m1/KimTaxonomy03
.pdf
A.D: Chapman, Principles and Methods of Data
Cleaning,
2005,
http://www.gbif.org/orc/?doc_id=1262
Mariano Sana, Alexander A. Weinreb, Insiders,
Outsiders, and the Editing of Inconsistent Survey
Data, 2008.
http://www.academia.edu/1256179/Insiders_Out
siders_and_the_Editing_of_Inconsistent_Survey
_Data
14
Dealing with messy data
Annex 1 – Checklist for data cleaning
Prepare for data cleaning
Make sure you have the tools, material and
contacts for cleaning your data:
The questionnaire forms
The contacts of team leaders or enumerators,
in case you need to contact them for questions
The original database
A translator, if necessary
Visual analysis software (i.e. tableau public)
Spreadsheet (excel) or database (Access,
Stata, etc.) software.
Some would add coffee and music, and a
place without noise and disturbance.
Identify the data custodian. He/she will generally
be responsible for managing and storing the data,
as well as for the supervision of the data cleaning,
the consolidation of the changes and the update
and maintenance of the change log.
Establish, document and communicate
Train the data entry operators on the
questionnaire filling. Explain the instructions
given to enumerators. If possible include data
entry in the data collectors training so they get
to know each other’s.
Establish decision rules for when to change a
value and when NOT to change it.
Establish procedures to document data that
was modified or not collected, i.e. “missing”, or
“not collected”. Explain how to use the change
log file.
Communicate to data entry operators or
others colleague’s analysts the procedures to
be followed and who to inform of any error
identified.
Establish communication channels for
communicating detected errors. Written
communication are recommended.
For rapid assessments where data analysis,
mapping and visualization generally coincide
with data entry and cleaning, communicate
regularly to analysts, GIS officers and graphic
designers which parts of the datasets are
clean and usable. In case they identify errors,
let them know who to inform. Plan with them
on which variables are a priority for cleaning.
Review records
If a sampling strategy was used, the records
must be verified first. Verify all the sites have
been entered, including those where the
assessment was not completed (this is not
relevant if a purposive sampling has been
used). Compare to the assessment teams field
trip records or the spreadsheet where you
tracked the visited locations.
Check the uniqueness of each row in the
database (i.e. unique ID for each site or
household).
Check for duplicate cases as a regular routine
for each of the data rows. Remove any blank
cases where the key variables have been
entered but there are no data in any of the
variables. Verify first that the blank cases
should be removed and how this could affect
other data in the row.
Screen, diagnose and treat data
Clean first the filter questions, i.e. when the
population is asked if they did or had a
particular activity based on a response
(yes/no). In that case there should be data in
the following table in the questionnaire (or
column in the database) if the response is
“yes” or there should be no data if the
response is “no”.
Review the skip rules within the questionnaire
and run the checks in the database to look for
invalid or missing values in variables based on
the skip rules.
Clean questions with min or max response
values (“tick three options only”, what are the
top three priorities among the 5 following
choice”, etc.).
Inspect the remaining variables sequentially
and as they are recorded in the data file.
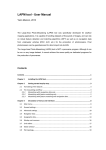
Create a general summary table of descriptive
statistics, where for each variable the min,
max, mean, median, sum and count are
available.
Screenshot of summary statistics table from Aldo Benini, ACAPS
Technical note on how to approach a dataset, preparation
15
Dealing with messy data
If the variable is a categorical/qualitative
variable, check spelling is consistent and run
a frequency count:
o Look at the counts to see if those are
reasonable for the sample – do you have
a complete set of data?
o All values should have labels if the
variable is categorical. Check for out of
range values.
If the variable is a continuous/quantitative
variable, run descriptive statistics such as min,
max, mode, mean and median.
o Look at minimum and maximum values.
Are they reasonable values? Look
especially if “0” are really “0” and not
missing values.
o Is the mean and median reasonable?
Inspect data for missing values (blanks,
explicit missing-value codes). Decide:
o Which blank cells need to be filled with
zeros (because they represent genuine
negative observations, such as ("no", "not
present", "option not taken", etc.)
o Which to leave blank (if the convention is
to use blanks for missing or not
applicable)
o Which to replace with some explicit
missing value code (if we want all missing
to be explicitly coded).
Verify that in binary variables (yes/no), the
positive value is coded as “1”, the negative as
“0”.
Check for the distribution of the values (use
box plots if available). Look at the extremes
and check them against the questionnaire
even if the value is possible and may seem
reasonable. If it is an extreme, other variables
may be incorrect as well. Look for the 5
smallest/largest values.
Compare the data between two or more
variables within the same case to check for
logical issues. I.e., can the head of the
household be less than 17 years old?
Compare age with marital status. Is the person
too young to have been married? Are the % of
destruction level summing up to 100%?
Where there are questions asking about a
“unit”, the data must standardized to a specific
unit, i.e. when a response is collected using
the unit specified by the respondent. For
instance, units for area can be acre, hectare
and square meters. To standardize the area
unit, a lookup table can be used to merge in
the conversion value to convert all areas to
hectares.
Check for consistencies within a set of cases:
If there is a spouse, it is expected the spouse
will be a different gender. The child of the head
of household is not expected to be older than
the head. The parent of the head cannot be
younger than the head.
Recode variables. Replace unhelpful entries
(e.g. mis-spellings, verbose descriptions,
category “others”, etc.) with more suitable
variants, in consistent manner. Reasons for
recoding are: spelling corrections, date (day,
month, year) formatting, translation, language
style and simplification, clustering, pre-fixes to
create better sorting in tables, combination (in
categorical variables), rounding (in continuous
variables), and possibly others.
Sort the file in various ways (by individual
variables or groups of variables) to see if you
can identify data errors that were not found
previously.
Final considerations
If the data are being cleaned by more than one
person, then the final step is to merge all the
spreadsheets together so that there is only
one database. The comments or change logs
that are made as the cleaning progresses
should be compiled into one document.
Problem data should be discussed in the
documentation file.
Update cleaning procedures, change log and
data documentation file as the cleaning
progress. Provide feedbacks to enumerators,
team leaders or data entry operators if the data
collection and entry process is still ongoing. If
one team or enumerator make consistently the
same mistake, make sure to inform him/them.
Be prepared. Data cleaning is a continued
process. Some problems cannot be identified
until analysis has begun. Errors are
discovered as the data is being manipulated
by analysts, and several stages of cleaning
are generally required as inconsistencies are
discovered. In rapid assessments, it is very
common that errors are detected even during
the peer review process.
16
Dealing with messy data
Annex 2 – Sample Job description
The following proposes three job description related to data entry and data cleaning: data cleaner, data entry controller and data entry operator.
The word formats are available at http://www.acaps.org/resourcescats/downloader/assessment_team_job_descriptions/97
Title of post: Data Cleaner
Reporting Line
Information Analyst
Requirements
Assessment and survey experience
Large scale data entry experience required
Education
Degree in statistics or demographics and/or a degree in IT
Experience
2-3 years of experience with statistics institute and/or relevant work experience
Proven experience with data cleansing and management of large volumes of quantitative and qualitative data.
Proven experience with management and operation of databases.
Language
Fluent in written and spoken English (or international language use).
Skills
Professionalism;
Excellent written and oral communication skills;
Good knowledge of word processing software (Word, Excel, PowerPoint, email);
Understanding of the principles of statistical and demographic analysis;
Understanding of survey techniques;
Excellent report drafting skills.
Strong typing skills
Strong proofreading skills
Excellent command of IT tools; High level of computer literacy.
Rigour and accuracy.
Proven ability to meet deadlines. Ability to work well under pressure;
Good interpersonal skills and ability work in a multi-cultural environment. Strong ability to work in teams;
Experience working with the international humanitarian community is an advantage.
Role description and responsibilities:
Under the supervision of the Information analyst, the Data Cleaner is responsible for:
Ensuring that procedures for checking, coding and entering data are followed;
Checking the quality of the work conducted by data entry staff during the data checking, coding and entry and providing
all assistance and feedback necessary to improve data entry and reduce or prevent mistakes;
Keeping a documented overview of the daily work; producing a daily report on data cleansing;
Making sure that raw data were accurately entered into a computer readable file;
Checking the character variables contain only valid values;
Checking that numeric values are within the predetermined ranges;
Checking for and eliminating duplicate data entries;
Checking if there are missing values for variables where complete data are necessary;
Checking for uniqueness of certain values, such as subject IDs;
Checking for invalid data values and invalid date sequences;
Follows procedures for data cleaning and editing. Document data problems. Update regularly the master database with
last changes;
Assessment Coordinator:
Name:
_______________________
Position:
_______________________
Signature: _______________________
Date:
_______________________
Data cleaner:
Name:
_________________________
Position: __________________________
Signature: __________________________
Date:
__________________________
17
Dealing with messy data
Title of post: Data Entry Operator
Reporting Line
Data Entry Controller
Information Analyst
Requirements
Assessment and survey experience
Large scale data entry experience required
Education
Secondary education, diploma in information/data management an asset
Experience
1-2 years of experience with statistics institute and/or relevant work experience
Proven experience with data entry and management of large volumes of quantitative and qualitative data.
Proven experience with management and operation of databases.
Language
Fluent in written and spoken English (or international language use).
Skills
Strong typing skills
Data entry skills
Strong proofreading skills
Analytical skills.
Excellent command of IT tools;
High level of computer literacy.
Rigour and accuracy.
Proven ability to meet deadlines.
Good interpersonal skills and ability work in a multi-cultural environment.
Experience working with the international humanitarian community is an advantage.
Role description and responsibilities:
Under the supervision of the Data Entry Controller or the information analyst, the Data Entry operator is responsible for:
Checking completed questionnaires before data entry;
Codifying open and semi-closed questions;
Identifying questionnaires with mistakes or error, where the identifier is incorrectly completed and ensuring they are
corrected; Identify and organize forms that needs re assessment
Conducting data entry of questionnaires according to the procedures set out during the training;
Support site staff to record and manage accurately the collected data
Data quality checks and data editing according to specified procedures
Feedback to Information analyst and assessment teams leaders about recurrent mistakes to avoid
Maintenance of a change log in case of data cleaning or editing
Archive and back up data, using the specified drive path
Maintain and operate database
Maintain office machines
Assessment Coordinator:
Name:
_______________________
Position: _______________________
Signature: _______________________
Date:
_______________________
Data entry operator:
Name:
_________________________
Position: __________________________
Signature: __________________________
Date:
__________________________
18
Dealing with messy data
Title of post: Data Entry Controller
Reporting Line
Information Analyst
Requirements
Assessment and survey experience
Large scale data entry experience required
Education
Degree in statistics or demographics and/or a degree in IT
Experience
3-5 years of experience with statistics institute and/or relevant work experience
Proven experience with data entry and management of large volumes of quantitative and qualitative data.
Proven experience with management and operation of databases.
Language
Fluent in written and spoken English (or international language use).
Skills for data entry clerk
Professionalism;
Strong ability to work in teams;
Excellent written and oral communication skills;
Ability to work well under pressure;
Good knowledge of word processing software (Word, Excel, PowerPoint, email);
Good command of data processing and analysis software, i.e. CsPro and SPSS;
Understanding of the principles of statistical and demographic analysis;
Understanding of survey techniques;
Excellent report drafting skills. Strong typing skills. Strong proofreading skills
Excellent command of IT tools; High level of computer literacy.
Rigour and accuracy.
Proven ability to meet deadlines.
Good interpersonal skills and ability work in a multi-cultural environment.
Experience working with the international humanitarian community is an advantage.
Role description and responsibilities:
Under the supervision of the Information analyst, the Data Entry Controller is responsible for:
Ensuring that procedures for checking, coding and entering data are followed;
Monitoring data entry staff;
Checking the quality of the work conducted by data entry staff during the data checking, coding and entry and
providing all assistance necessary;
Keeping a documented overview of the daily work; producing a daily report on data checking, coding, and entry.
Write procedures for data cleaning and editing. Supervise data cleaning. Consolidate the data change logs from
data entry operators. Document data problems. Update regularly the master database with last changes.
Ordering questionnaires and returning them to the archives after the data has been entered;
Ensuring technical documents are kept in a good condition;
Ensuring working hours are respected, as well as order and discipline in the workplace;
Assessment Coordinator:
Name:
_______________________
Position: _______________________
Signature: _______________________
Date:
_______________________
Data entry controller:
Name:
_________________________
Position: __________________________
Signature: __________________________
Date:
__________________________
19