1
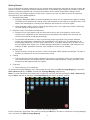
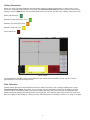
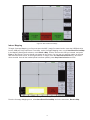
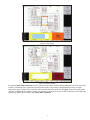
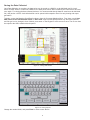
Application Note
Indoor Mapping
With the Anritsu E-Series Spectrum Master™, Cell Master™,
and Site Master™ (Option 431)
Introduction
Spectrum analyzers provide accurate RF power measurements over a wide frequency range. With an antenna
attached, RF power measurement becomes Received Signal Strength (RSSI). RSSI measurements can be
combined with on-screen map displays to become a very versatile solution for mapping the coverage of RF
transmitters.
The Anritsu E-Series Spectrum Master, Cell Master, and Site Master models with spectrum analysis capability can
include Option 431, Coverage Mapping. This option supports both indoor and outdoor mapping needs.
In this application note, you will learn how to fully operate the instrument with accordance to the indoor mapping
process. Indoor mapping does not require Option 31, GPS. Instead, the user must report the user’s location in
reference to the map to the instrument. The E-Series Anritsu Spectrum Master, Cell Master, and Site Master models
sport a touch screen user interface making it easy to report locations of indoor measurements by just touching the
on-screen map.
Anritsu Map Master
Note: A USB flash drive is required to transfer MAP (.map) files to the instrument.
For indoor mapping, a PC software program called “Map Master” must be used in order to convert map picture files
to a MAP file for the instrument to read. Map Master is located on the CD provided with the instrument, or can be
downloaded and installed from the Anritsu website. (www.anritsu.com)
First you must locate a map image of the indoor area to be measured in a common picture format.
(JPEG, GIF, TIFF, PNG).
The user can convert JPEG, GIF, TIFF, or PNG files to MAP (.map) files which can then be read by the instrument.
The ideal image size would be close to 666 pixels x 420 pixels (~1.6:1 ratio).
Download, install and run the Map Master application. Select File | Open. Browse through your folders, select the
indoor image file, and click Open. Once the file has been opened, a prompt asks whether to Geo Embed the map.
Select No, because we are going to be using this indoors. To save it to a USB flash drive, go to File and then click
Save/Save As. Set the destination to the USB, and press Save.
Figure 1: Loading a picture file
Use Anritsu Map Master to open the image of the compatible file types. (JPEG, GIF, TIFF, or PNG)
Figure 2: GeoEmbedded Map
Once opened, select No to save as indoor map, and save it to a USB flash drive.
2
Getting Started
Prior to conducting the indoor mapping survey, the analyzer itself must first be configured to properly measure the
signals of interest. Knowledge of various parametrics such as anticipated signal strength and variation, potential
presence of interfering signals, and noise sources should be used in determining analyzer settings. A brief
summary of the main analyzer setups is shown below. However, the user may want to refer to the instrument
user manual for more detailed guidance.
1. Bandwidth Parameters
a.Resolution Bandwidth (RBW): minimum bandwidth over which one can separate two signals for viewing.
The RBW can be decreased for viewing closely spaced signals at the expense of acquisition time. A low
RBW is also advantageous in limiting noise distortion and resolution of low-level signals.
b.Video Bandwidth (VBW): used for averaging and filtering noise. This is particularly useful in discerning
low-level signals in the presence of noise.
2. Reference Level, Pre-Amplifier and Attenuator
a.Reference Level: Input signal levels are referenced to the top line of the graticule, known as the
reference level. Depending on the amount of power anticipated in the signals to be measured, the
reference level should be adjusted accordingly.
b.Pre-Amplifier and Attenuator: In order to present the proper signal level to the analyzer detection
circuits, pre-amplification or attenuation can be adjusted on the signal input. The attenuator can be
automatically adjusted as a function of the reference level. In general, signals below -40 dBm can use
the pre-amplifier while signals over -30 dBm should be attenuated. For example, if the reference level
setting is 20 dBm, attenuation should be set to 50 dB for a mixer input of -30 dBm.
3. Detector Type
a.Various detection circuits can be utilized. These include Peak, RMS, Negative and Sample. The type of
detection is predicated on the user’s measurement needs.
4. Filtering
a.Filtering should be used to measure signals in the presence of interferers. Filters can be added to the
input of the analyzer to discriminate between wanted and unwanted signals, avoiding corruption of the
measurement with adjacent high level signals.
5. Frequency
a. Select frequency to be measured.
To access the Coverage Mapping menu, either press the main menu icon SPA Coverage Mapping, or press the
Shift + Measure (4) key, the More, and then the Coverage Mapping submenu key.
Note: For some instruments, this shortcut will not show up. Users can add it by pressing the Shift + Measure (4)
key, the More, and then by holding the Coverage Mapping soft key for at least 3 seconds.
Figure 3: SPA Coverage Mapping
From the instrument, access the main menu by pressing the Menu key, and then to access the Coverage Mapping
menu, touch the icon SPA Coverage Mapping
3
Setting Parameters
Before you begin Coverage Mapping, the parameters should be adjusted appropriately. In order to do so, first
access the coverage mapping menu. Once there, select Measurement Setup and then to edit the measurement
settings, touch the RSSI button. The threshold RSSI values provide the user with easy visibility of the power level.
Better than Excellent Between Excellent and Very Good Between Very Good and Good Between Good and Poor Worse than Poor Figure 4: RSSI
The thresholds for the dBm values can be altered so the measurement indications on the map are colored
appropriately for the expected signal levels.
Data Collection
Another setting that can be personalized is the way the data is recorded. In the coverage mapping menu, select
Point Distance/Time Setup. Once there, you can set the way it records data by either time or distance, and the
intervals of which it collects the data. If the collection setting was set to time, the instrument will interpolate data
points between the starting and ending position in a straight line. If the distance option was set, the user receives a
data point whenever the position is noted by the user, indicated by either touching the screen or by using the keypad.
4
Figure 5: Data Collection Settings
Indoor Mapping
To begin Coverage Mapping, you first must open the MAP (.map) file created earlier. Insert the USB flash drive
into the USB port of the instrument. From there, at the Coverage Mapping menu, touch Save/Recall Points/Map.
In the Mapping Save/Recall submenu, touch Recall a Map. Find the file from the USB you inserted, and press
Enter on the keypad. The map should now appear on the screen. You can set your position relative to the map
with either the touch screen, or the keypad arrows. To begin, touch the Start Data Collection key, and move
where needed. Once all the needed points have been plotted, press Stop Data Collection to finish.
Figure 6: Recalling a Map
From the Coverage Mapping menu, select Save/Recall Points/Map and in the next menu, Recall a Map
5
Figure 7: Selecting MAP file
Select the MAP (.map) file from the USB and press enter on the keypad.
Figure 8: Setting User Position
With the touch-screen or arrows on the keypad, the user’s position can be set.
6
Figure 9: Time Setting
Figure 10: Distance Setting
By pressing Start Data Collection, the user can move to the area needed, and by telling the instrument the user’s
location in reference to the map either with the touch-screen or by using the keypad and enter keys, multiple
data points can be created. The instrument will interpolate the points as shown in Figure 9 if the time setting was
selected. In Figure 10, the distance option was selected, and shows how you are able to effectively coverage map
specific key areas. When finished, press Stop Data Collection.
7
Saving the Data Collected
Once Data Collection is complete, the data points can be saved as a KML file, a tab delimited text file (.mtd),
and/or a JPEG. When it is saved as a KML file, the data points can be later recalled by the instrument to be used
once again. For viewing the data collected however, it is recommended that the data be saved as a tab delimited
file (.mtd) and/or a JPEG. A tab delimited file can be opened with notepad or Excel for easy viewing and report
generation.
To begin, access the Mapping Save/Recall submenu from the Coverage Mapping Menu. From there, touch Save
KML Points, Save Tab Delimited Points, or Save JPG. A pop-up save prompt comes up, where the filename
and file type can be changed. Once finished, press enter on the keypad or touch screen to save. The file can then
be copied to the USB, transferred and opened.
Figure 11: Saving Data Points
Figure 12: Saving the File
Change the needed fields, and press Enter in order to save the file.
8
Analyzing the Data
When saved as a tab delimited file (.mtd), the points recorded by the instrument can later be opened by a program
such as Excel, to be viewed and analyzed.
Once opened, looking at the file from top to bottom, the first things you see are the rows 1-16. It has basic
information, such as the file mode, model, serial number, and date the mapping was done. The actual data below
is divided into columns. Columns A-F is only relevant for outdoor mapping, but the columns G-AE pertain to both
coverage and indoor mapping.
Column G - the system date
Column H - the system time
Column I - the mode the instrument was in
Column J - what type of data was collected
Column K - the values recorded by the instrument
Columns L-AE corresponds to the setup of the instrument. The way that the setup is organized, columns N, P, R,
and T have the actual setting values, and the preceding columns indicate the user of what exactly the following
values mean.
Column N - the frequency
Column P - the RBW setting
Column R - the VBW setting
Column T - the detection type
The columns U-AC shows the threshold values designated by the user earlier. You can look at the value placed in
column K and refer to columns U-AC to determine the strength of the RF power measurement. At the very end, in
the column AE, errors, if any, are listed. There are three possible values: ADC over range; saturation; and none.
The colors shown by the instrument provide easy viewing for the user when determining signal strength, but by
viewing the file as a tab delimited file, the actual raw data can be seen.
9
Figure 13: Viewing the Data
The data can then be opened by other software programs for analysis and report generation.
Conclusion
Facility managers often need to verify Public Safety, Broadcast and Personal communications systems operate
throughout the facility. Point location measurements of spectrum analyzer displays are commonly used to
document signal levels.
The Anritsu E-Series Spectrum Master™, Cell Master™, and Site Master™ models are powerful battery operated
instruments that can support a wide range of signal types. With the addition of option 431, Coverage Mapping
users can easily make measurements and create detailed maps and reports of indoor coverage.
10
Notes
11
Anritsu Corporation
5-1-1 Onna, Atsugi-shi, Kanagawa, 243-8555 Japan
Phone: +81-46-223-1111
Fax: +81-46-296-1238
• U.S.A.
Anritsu Company
• Italy
Anritsu S.p.A.
Via Elio Vittorini, 129, 00144 Roma, Italy
Phone: +39-06-509-9711
Fax: +39-06-502-2425
• Sweden
Anritsu AB
1155 East Collins Boulevard, Suite 100,
Richardson, TX, 75081 U.S.A.
Toll Free: 1-800-ANRITSU (267-4878)
Phone: +1-972-644-1777
Fax: +1-972-671-1877
Borgafjordsgatan 13, 164 40 KISTA, Sweden
Phone: +46-8-534-707-00
Fax: +46-8-534-707-30
• Finland
Anritsu AB
• Canada
Anritsu Electronics Ltd.
700 Silver Seven Road, Suite 120, Kanata,
Ontario K2V 1C3, Canada
Phone: +1-613-591-2003
Fax: +1-613-591-1006
• Brazil
Anritsu Electrônica Ltda.
Praça Amadeu Amaral, 27 - 1 Andar
01327-010 - Bela Vista - São Paulo - SP - Brasil
Phone: +55-11-3283-2511
Fax: +55-11-3288-6940
• Mexico
Anritsu Company, S.A. de C.V.
Av. Ejército Nacional No. 579 Piso 9, Col. Granada
11520 México, D.F., México
Phone: +52-55-1101-2370
Fax: +52-55-5254-3147
• U.K.
Anritsu EMEA Ltd.
200 Capability Green, Luton, Bedfordshire LU1 3LU, U.K.
Phone: +44-1582-433280
Fax: +44-1582-731303
• France
Anritsu S.A.
12 Avenue du Québec,
Bâtiment Iris 1-Silic 638,
91140 VILLEBON SUR YVETTE, France
Phone: +33-1-60-92-15-50
Fax: +33-1-64-46-10-65
• Germany
Anritsu GmbH
Teknobulevardi 3-5, FI-01530 VANTAA, Finland
Phone: +358-20-741-8100
Fax: +358-20-741-8111
• Denmark
Anritsu A/S (for Service Assurance)
Anritsu AB (for Test & Measurement)
Kirkebjerg Allé 90 DK-2605 Brøndby, Denmark
Phone: +45-7211-2200
Fax: +45-7211-2210
• Russia
Anritsu EMEA Ltd.
Representation Office in Russia
Tverskaya str. 16/2, bld. 1, 7th floor.
Russia, 125009, Moscow
Phone: +7-495-363-1694
Fax: +7-495-935-8962
• United Arab Emirates
Anritsu EMEA Ltd.
Dubai Liaison Office
P O Box 500413 - Dubai Internet City
Al Thuraya Building, Tower 1, Suite 701, 7th Floor
Dubai, United Arab Emirates
Phone: +971-4-3670352
Fax: +971-4-3688460
• Singapore
Anritsu Pte. Ltd.
• India
Anritsu Pte. Ltd.
India Branch Office
3rd Floor, Shri Lakshminarayan Niwas, #2726, 80 ft Road,
HAL 3rd Stage, Bangalore - 560 075, India
Phone: +91-80-4058-1300
Fax: +91-80-4058-1301
• P. R. China (Hong Kong)
Anritsu Company Ltd.
Units 4 & 5, 28th Floor, Greenfield Tower, Concordia Plaza,
No. 1 Science Museum Road, Tsim Sha Tsui East,
Kowloon, Hong Kong, P.R. China
Phone: +852-2301-4980
Fax: +852-2301-3545
• P. R. China (Beijing)
Anritsu Company Ltd.
Beijing Representative Office
Room 2008, Beijing Fortune Building,
No. 5 , Dong-San-Huan Bei Road,
Chao-Yang District, Beijing 100004, P.R. China
Phone: +86-10-6590-9230
Fax: +86-10-6590-9235
• Korea
Anritsu Corporation, Ltd.
8F Hyunjuk Bldg. 832-41, Yeoksam-Dong,
Kangnam-ku, Seoul, 135-080, Korea
Phone: +82-2-553-6603
Fax: +82-2-553-6604
• Australia
Anritsu Pty Ltd.
Unit 21/270 Ferntree Gully Road, Notting Hill
Victoria, 3168, Australia
Phone: +61-3-9558-8177
Fax: +61-3-9558-8255
• Taiwan
Anritsu Company Inc.
7F, No. 316, Sec. 1, Neihu Rd., Taipei 114, Taiwan
Phone: +886-2-8751-1816
Fax: +886-2-8751-1817
60 Alexandra Terrace, #02-08, The Comtech (Lobby A)
Singapore 118502
Phone: +65-6282-2400
Fax: +65-6282-2533
Nemetschek Haus, Konrad-Zuse-Platz 1
81829 München, Germany
Phone: +49 (0) 89 442308-0
Fax: +49 (0) 89 442308-55
®Anritsu All trademarks are registered trademarks of
their respective companies. Data subject to change
without notice. For the most recent specifications visit:
www.anritsu.com
11410-00579, Rev. A Printed in United States 2010-07
©2010 Anritsu Company. All Rights Reserved.