1
NetGuardian 216T
USER MANUAL
Visit our website at www.dpstelecom.com for the latest PDF manual and FAQs.
July 28, 2010
D-OC-UM107.28100
Firmware Version 1.0E
Revision History
July 28, 2010
Misc, minor edits.
August 5, 2009
Removed obsolete items from shipping list.
December 5, 2008
Added notes indicating changes if T1 is enabled/disabled.
November 19, 2008 Added note on expanding discrete inputs and control outputs
with NetGuardian DX.
July 26, 2007
NetGuardian 216T User Manual (D-OC-UM077.26100) released.
September 11, 2006 NetGuardian 216T User Manual (D-OC-UM069.11100)
released.
June 26, 2006
NetGuardian 216T User Manual (D-OC-UM066.26100)
released. Supports Firmware Version 1.0B.
This document contains proprietary information which is protected by copyright. All rights are reserved. No part of this
document may be photocopied without prior written consent of DPS Telecom.
All software and manuals are copyrighted by DPS Telecom. Said software and manuals may not be reproduced, copied,
transmitted or used to make a derivative work, by either mechanical, electronic or any other means in whole or in part,
without prior written consent from DPS Telecom, except as required by United States copyright laws.
© 2010 DPS Telecom
Notice
The material in this manual is for information purposes and is subject to change without notice. DPS Telecom shall not be
liable for errors contained herein or consequential damages in connection with the furnishing, performance, or use of this
manual.
Contents
Visit our website at www.dpstelecom.com for the latest PDF manual and FAQs
1 NetGuardian 216T Overview
1
2 About This Manual
2
3 Shipping List
2
4 Optional Accessories
4
5 Specifications
4
6 Hardware Installation
6
6.1 Tools Needed
6
6.2 Mounting
6
6.3 Power Connection
7
6.4 LAN Connection
8
6.5 Alarm and Control Relay Connections
9
6.5.1
Alarm and Control Relay Connector Pinout Table
9
6.5.2
Discretes 1–16 Connector Pinout Diagram
10
6.5.3
Optional 66 Block Connector
11
6.5.4
Integrated Temperature and Battery Sensor
12
6.5.5
Analog Dipswitches
13
6.6 Data Port
14
6.6.1
14
Connecting NetGuardian Accessories
6.7 Optional Wire-Wrap Back Panel
14
6.8 Integrated 10BaseT Ethernet Hub
15
7 Front Panel LEDs
15
8 Back Panel LEDs
16
9 Configuring the NetGuardian
16
10 Connecting to the NetGuardian
17
10.1 ... via Craft Port
17
10.2 ... via LAN
17
10.3 ...via WAN
18
11 TTY Interface
19
11.1 Menu Shortcut Keys
19
11.2 Unit Configuration
20
11.2.1 Ethernet Port Setup
20
11.2.2 T1 WAN Setup
21
11.2.2.1 Network Address Translation with T1 WAN
11.2.2.1.1 Gateway Mode
11.2.2.1.2 Router Mode
11.3 Monitoring
22
22
22
23
11.3.1 Monitoring the NetGuardian
23
11.3.1.1 Monitoring WAN
11.3.1.2 Monitoring Base Alarms
11.3.1.3 Monitoring Ping Targets
24
11.3.1.4 Monitoring and Operating Relays (Controls)
11.3.1.5 Monitoring Analogs
26
11.3.1.6 Monitoring System Alarms
11.3.1.7 Monitoring Data Port Activity
27
11.3.1.8 Monitoring the Accumulation Timer
28
25
25
26
28
11.3.2 Viewing Live Target Pings
29
11.3.3 Proxy Menu
29
11.3.4 Event Logging
29
11.3.5 Backing Up NetGuardian Configuration Data via FTP
30
11.3.5.1 Reloading NetGuardian Configuration Data
11.3.6 Debug Input and Filter Options
12 Reference Section
12.1 Display Mapping
12.1.1 System Alarms Display Map
31
32
33
33
35
12.2 SNMP Manager Functions
37
12.3 SNMP Granular Trap Packets
40
12.4 ASCII Conversion
41
13 Frequently Asked Questions
42
13.1 General FAQs
42
13.2 SNMP FAQs
44
14 Technical Support
45
15 RMA Policy
46
1
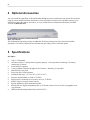
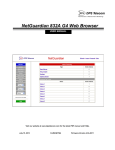
1 NetGuardian 216T Overview
Fig. 1.1. The NetGuardian has all the tools you need to manage your remote site
The NetGuardian 216T — The Intelligent RTU for Complete Site Management
The NetGuardian 216T is a wide temperature range, T1 and Ethernet-based, SNMP/DCPx remote telemetry unit.
The NetGuardian has all the tools you need to manage your remote sites, including a T1 WAN and 7 port
10-BaseT Ethernet hub interface, built-in alarm monitoring, paging, and e-mail capabilities that can eliminate the
need for an alarm master. The NetGuardian is the ideal solution for collecting equipment and environmental
alarms from your outdoor enclosures and reporting these alarm conditions via Frame Relay/T1. The 7 port
Ethernet hub can also be utilized to provide connectivity to other far-end devices from the T1 WAN.
Some of the benefits of the NetGuardian 216T include:
· Frame Relay/T1 interface–At 1 RU, saves space and allows you to use your preferred interface.
· Integrated 7 port hub–Saves space, provides Ethernet connectivity for other equipment
· Web Browser support for monitoring and configuring the units–Convenient access
· Remote Firmware download ability–Easy initial deployment, and avoids costly trips to the sites for
routine upgrades. Firmware upgradable via Ethernet or T1 WAN.
· Unique wire-wrap termination–Quick and easy installation and enables the unit to be removed without
rewiring.
· Multiple master support–Disaster recovery scenarios.
· Alarm qualification times–Reduce nuisance alarm, avoids alarm desensitization.
· Extreme temperature rating– -22°F to 158°F (-30°C to 70°C)–A must in harsh environments.
· Multi-level password access–Control who accesses your units and to what level.
· Ping IP network devices and verify that they're online and operating.
· Optional build would include 4 additional data ports. Contact DPS Sales for more information at (800)
622-3314
· Expandable up to 160 discrete alarm inputs and 26 control outputs with the NetGuardian DX chassis.
The NetGuardian 216T is a 1 rack unit alarm remote that supports 16 discrete alarms that are "software
reversible" to support both N/O and N/C alarm wiring, 7 analog inputs (4 general purpose, 1 for monitoring
internal temperature, adfcznd 2 for monitoring battery feeds) as well as a digital temperature sensor. The sensor
probe has 10-ft long leads, so once connected to the NetGuardian 216T, it may be placed in the most appropriate
location within the cabinet. The NetGuardian 216T also allows you to remotely control external devices via its 2
internal relays. These controls are a convenient and time efficient way of remotely switching equipment in the
field. The Web browser interface allows you to have quick and convenient access for programming or simply to
spot-check the alarm status for any given site.
The NetGuardian 216T's operational temperature range of -22°F to 158°F (-30°C to 70°C) makes it ideal for
deployment in very harsh environments. It's hardened design means it will continue to deliver real time
telemetry when the weather is at its worst.
The NetGuardian can be configured many different ways including TTY for the initial IP settings through the
front craft port, standard Web browser software, and a Windows-based utility called Edit216T, included at no
additional cost. This software will allow you to create a NetGuardian 216T configuration file without being
connected to the NetGuardian 216T, then download that database remotely from a WAN, Ethernet, or serial
connection.
2
2 About This Manual
There are three separate user manuals for the NetGuardian 216T: the Hardware Manual (which you're reading
now), the Edit216T User Manual, and the NetGuardian 216T Web Interface User Manual.
This Hardware Manual provides instructions for hardware installation and using the TTY interface. The
Edit216T and Web Interface User Manuals, included on the NetGuardian Resource CD, provide instructions for
configuring the NetGuardian using the Windows-based Edit216T utility software or the Web Interface.
3 Shipping List
While unpacking the NetGuardian, please make sure that all of the following items are included. If some parts
are missing, or if you ever need to order new parts, please refer to the part numbers listed and call DPS Telecom
at (800) 622-3314.
NetGuardian 216T
D-PK-NETGT
NetGuardian 216T Hardware
Manual D-OC-UM107.28100
NetGuardian 216T Resource CD
(includes manuals, MIBs, and software)
DB9M-DB9F Download Cable 6 ft.
D-PR-045-10-A-04
Ethernet Cable 14 ft
D-PR-923-10A-14
Pads
2-015-00030-00
23" Rack Ears
D-CS-325-10A-01
19" Rack Ears
D-CS-325-10A-00
Eight 3/8" Ear Screws
1-000-60375-05
Four Standard Rack Screws
1-000-12500-06
3
x4
Four Metric Rack Screws
2-000-80750-03
Four 3/4-Amp GMT Main Power Fuses
2-741-00750-00
Two Large Power Connector Plugs for Main Power
2-820-00852-02
Two 4 Pin Analog Connectors
2-820-00804-02
Optional Items
(Standard in Build D-PK-NETGT-12004.0001)
Wire-Wrap Back Panel
D-PA-00242-10A
(The NetGuardian 216T's Wire-Wrap back panel allows for wire-wrap connections for the discrete alarms,
analog alarms, and control relays)
(Standard in Build D-PK-NETGT-12004.0001)
Temperature Sensor
D-PR-984-10A-10
(The NetGuardian 216T's external temperature sensor cable for manual hook-up. Note: The NetGuadian 216T
also has an internal temperature sensor)
Pluggable Back Panel
D-PK-16PAN
The NetGuardian 216's pluggable back panel allows for screw-in barrier plug connections for the
NetGuardian's alarms and control relays.
4
4 Optional Accessories
You can extend the capabilities of the NetGuardian through accessory units that provide greater discrete alarm
capacity, remote audiovisual alarm notification, visual surveillance of remote sites, and other options. If you
would like to order any of these accessories, or if you would like more information about them, call DPS
Telecom at (800) 622-3314.
NetGuardian Expansion (NetGuardian DX)
D-PC-293-10A-04
The NetGuardian Expansion provides an additional 48 discrete alarm points. Up to three NetGuardian
Expansions can be daisy-chained off one NetGuardian, providing a total of 160 alarm points.
5 Specifications
Key Specs:
·
·
·
·
·
·
·
·
·
·
·
·
·
1 RU, 19" Mountable
16 Discrete alarms, 7 analog alarms (4 general purpose, 1 for temperature monitoring, 2 for battery
monitoring), 2 controls
Frame Relay/T1 interface
7 ports of 10BaseT Ethernet brought out for client use. Internally, an 8 port hub.
Dual -48VDC power feed
Front Craft port, LEDs & buttons
Extended temp range, -22°F to 158°F (-30°C to 70°C)
Firmware downloadable via LAN or T1 WAN
Web browser!! (with multi-level security access or T1 WAN)
SNMP–Traps to at least 2 masters natively
Special amphenol to WW termination module
Includes our new digital temperature probe on 10-ft lead, connects to rear of unit via pluggable screw
lug connector.
Windows-based configuration utility (serial/LAN/T1)
5
Analog Input Range:
(–94 to 94 VDC or 4 to 20 mA)
Control Relays:
Maximum Voltage:
Maximum Current:
Form A or Form C
60 VDC/120 VAC
3/4 Amp, AC/DC
Discrete Alarms:
16
Ping Alarms:
32
Protocols:
SNMP, DCPx, DCPf, TRIP
SMTP, TAP
Interfaces:
1 RJ45 for T1 WAN
1 T1 WAN access jack panel
7 RJ45 10BaseT Ethernet ports
1 DB9 RS-232 Craft port
1 RJ45 Yost RS-232 port
4 RJ45 Yost RS-232 ports (optional build)
1 50-pin female amphenol connector (discretes, controls, and analogs)
1 4-pin screw connector (external temp sensor)
1 4-pin screw connector (analogs)
Dimensions:
1.75"H x 17"W x 12"D (4.5 cm x 43.2 cm x 30.5 cm)
Weight:
4 lbs. 3 oz. (1.9 kg)
Mounting:
19" or 23" rack
Power Input:
–48VDC (–40 to –70 VDC)
Current Draw:
200 mA
Fuse:
3/4 amp GMT for power inputs
Visual Interface:
12 bicolor LEDs
11 unicolor LEDs
Operating Temperature:
-22°–158° F (-30°–70° C)
Operating Humidity:
0%–95% noncondensing
6
6 Hardware Installation
6.1 Tools Needed
To install the NetGuardian, you'll need the following tools:
Phillips No. 2 Screwdriver
Small Standard No. 2 Screwdriver
Wire Strippers/Cutter
Punch Down Tool (if 66 blocks are used)
PC with Edit216T software
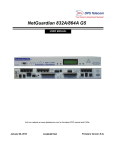
6.2 Mounting
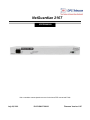
Fig. 6.2.1. The NetGuardian can be flush or rear-mounted
The NetGuardian mounts in a 19" rack or a 23" rack using the provided rack ears for each size. Two rack ear
locations are provided. Attach the appropriate rack ears in the flush-mount or rear-mount locations shown in
Figure 6.2.1.
Note: Rack ears can be rotated 90° for wall mounting or 180º for other mounting options (not shown).
7
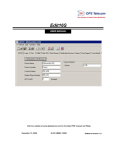
6.3 Power Connection
Fig. 6.3.1. Power connectors and fuses
The NetGuardian has two screw terminal barrier plug power connectors, located on the left side of the back
panel. (See Figure 6.3.1.)
Before you connect a power supply to the NetGuardian, test the voltage of your power supply:
·
Connect the black common lead of a voltmeter to the ground terminal of the battery, and connect the red
lead of the voltmeter to the battery's –48 VDC terminal. The voltmeter should read between –43 and –
53 VDC. If the reading is outside this range, test the power supply.
To connect the NetGuardian to a power supply, follow these steps:
1. Remove Fuse A and Fuse B from the back panel of the NetGuardian. Do not reinsert the fuse until all
connections to the unit have been made.
2. Remove the power connector plug from Power Connector A. Note that the plug can be inserted into the
power connector only one way — this ensures that the barrier plug can only be reinserted with the
correct polarity. Note that the –48V terminal is on the left and the GND terminal is on the right.
3. Use the grounding lug to properly ground the unit.
4. Insert a battery ground into the power connector plug's right terminal and tighten the screw; then
insert a –48 VDC line to the plug's left terminal and tighten its screw.
5. Push the power connector plug firmly back into the power connector. If the power feed is connected
correctly, the LED by the connector will light GREEN. The LED by the power connector will be off if
the power feed is reversed.
6. Repeat Steps 2–5 for Power Connector B.
7. Reinsert Fuse A and Fuse B to power the NetGuardian. The front panel LEDs will flash RED and
GREEN.
8
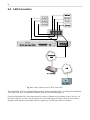
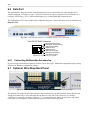
6.4 LAN Connection
Fig. 6.4.1. Chart of Ethernet and T1 WAN Connections
The NetGuardian 216T has a 10-BaseT Ethernet hub for connecting through LAN. To connect the NetGuardian
216T to the LAN, insert a standard RJ45 Ethernet cable into one of the Ethernet ports.
From the NetGuardian 216T, the connection can be routed via Ethernet to a local subnet of up to 7 devices. Or,
as shown in Figure 6.4.1 above, the connection can be routed through the T1 WAN connector, which sends it
through a router and then on to multiple other PCs (gateways) via LAN in the wider area network.
9
RJ45 T1 Connection
RJ45 Ethernet Connection
8
7
6
5
4
3
2
1
8
7
6
5
4
3
2
1
Transmit Out - (Tx-)
Transmit Out + (Tx+)
Receive In - (Rx-)
Receive In + (Rx+)
Transmit Out + (Tx+)
Transmit Out - (Tx-)
Receive In + (Rx+)
Receive In - (Rx-)
Fig. 6.4.2 Ethernet ports and T1 WAN port pinouts
The pinouts for the Ethernet hub ports and the T1 WAN port are shown in Figure 6.4.2, above.
6.5 Alarm and Control Relay Connections
Fig. 6.5.1. Alarm and control relay connectors
The NetGuardian's discrete alarm inputs, control relay outputs, and analog alarm inputs are connected through
the 50-pin connectors labeled "Discretes 1–16, Analogs 1-4, and Relays 1-2" on the back panel. (See Figure
6.5.1.)
6.5.1 Alarm and Control Relay Connector Pinout Table
Discretes 1–16
RTN
ALM
RTN
ALM
ALM 1
1
26
ALM 9
9
34
ALM 2
2
27 ALM 10 10
35
ALM 3
3
28 ALM 11 11
36
ALM 4
4
29 ALM 12 12
37
ALM 5
5
30 ALM 13 13
38
ALM 6
6
31 ALM 14 14
39
ALM 7
7
32 ALM 15 15
40
ALM 8
8
33 ALM 16 16
41
Table 6.5.1.A. Alarm, amphenol connector, and control relay pinout (continued on next page)
ANA 1
ANA 2
ANA 3
ANA 4
GND
Analogs 1–4
+
21
22
23
24
25
–
46
47
48
49
50
10
Control Relatys 1–2
NO/NC
CO
CTRL 1
17/42
43
CTRL 2
19/44
18
FUSE
20/NA
45
Table 6.5.1.A. (continued) Alarm, amphenol connector, and control relay pinout
Table 6.5.1.A shows the pinouts for the 50-pin connectors "Discretes 1-16," and "Analogs 1-4" and "Control
Relays 1-2."
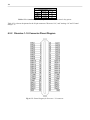
6.5.2 Discretes 1–16 Connector Pinout Diagram
Fig. 6.5.2.. Pinout Diagram for Discretes 1-16 connector
11
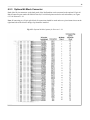
6.5.3 Optional 66 Block Connector
Both of the 50-pin connectors on the back panel of the NetGuardian can be connected to the optional 25-pair 66
Block Connector (part number D-PR-966-10A-00). For 66 block pinout and color code information, see Figure
6.5.3 for Discretes 1–16.
Note: If connecting to a 50-pair split block, all connections should be made on the two pin columns closest to the
right-hand side of the block or bridge clips should be installed.
Fig 6.5.3. Optional 66 block pinout for Discretes 1–16
12
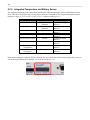
6.5.4 Integrated Temperature and Battery Sensor
The integrated temperature and battery sensor monitors the ambient temperature and the NetGuardian's current
draw. This option is available only if it was ordered with your NetGuardian. The integrated temperature sensor
measures a range of -22° F to 158° F (-30° C to 70° C) within an accuracy of ± 1°.
Analog Function
User Channel 1
Location
Amphenol or 4-pin
connector
Amphenol or 4-pin
connector
Amphenol only
Channel Mapping
Reported as analog
channel 1
User Channel 2
Reported as analog
channel 2
User Channel 3
Reported as analog
channel 3
User Channel 4
Amphenol only
Reported as analog
channel 4
Monitor Power Feed A
Internal
Reported as analog
channel 5
Monitor Power Feed B
Internal
Reported as analog
channel 6
Monitor Internal
Internal
Reported as analog
Temperature
channel 7
Monitor External
4-pin connector
Reported as analog
Temperature
channel 8
Table 6.5.4.A. Integrated sensor connection options
Between the Amphenol connector and Fuse B resides the 4-pin connection for the external temperature sensor, as
well as the 4-pin connection for Analogs 1-2, as shown in Figure 6.5.4.1.
Fig. 6.5.4.1. Temperature Sensor and Analog Connectors
13
6.5.5 Analog Dipswitches
Ü
Û
Off for Voltage monitoring
On for Current monitoring
Fig. 6.5.5. Dipswitch and layout
The analogs are controlled by the dipswitches to the left of the Amphenol connector (located at the back of the
unit). For milliamp sensor operation, turn the dipswitch on by placing it in the on position. For normal
operation, place the dipswitch in the off position. Note that the dipswitch is internal, and requires the case to be
opened in order to change the setting.
!
Hot Tip!
WARNING
WARNING: Do not put the dipswitches in the on position unless you are sure of the analog setting.
Having the dipswitchs on will put a 250 ohm resistor across the input lines. Any voltage beyond 5V or
20 mA will damage components.
14
6.6 Data Port
The NetGuardian's data port provides reach-through terminal server functionality for connecting the user to
external equipment via Telnet over LAN. The port can function as a proxy connection to an external device, a
craft port, a DCPx port, a TCP, a UDP reach-through port, or a NetGuardian DX (Expansion) port.
The NetGuardian 216T is also available with 4 additional data ports. Contact DPS Sales for more information at
(800) 622-3314
Fig. 6.6.1. 216T data ports (Serial 1 is standard, Serials 2-5 are optional)
Yost RS-232 RJ45 Connector
8 RTS (Request to Send)
7 DTR (Data Terminal Ready)
6 TXD (Transmit Data)
5 GND (Ground)
4 GND (Ground)
3 RXD (Receive Data)
2 DSR (Data Set Ready)
1 CTS (Clear to Send)
Fig. 6.6.2. Serial (Yost) port pinout
6.6.1 Connecting NetGuardian Accessories
If you are using a NetGuardian Expansion, connect it to the Serial port. Additional configuration requires using
Edit216T for Windows configuration software.
6.7 Optional Wire-Wrap Back Panel
Fig. 6.7.1. The wire-wrap back panel (arrows indicate screw locations for mounting)
The optional wire-wrap back panel provides wire-wrap connections for the NetGuardian's alarms (discrete and
analog) and control relays. Screw the board into the holes on either side of the "Discretes 1-16/Analogs
1-4/Relays 1-2 connector" (as shown in Figure 6.7.1). To connect discrete alarms, analog alarms, and control
relays to the wire-wrap panel, connect them to the pin block on the front of the panel.
15
6.8 Integrated 10BaseT Ethernet Hub
Hub LEDs Reg. Ethernet Ports T1 Uplink Port
Fig. 6.8.1. NetGuardian integrated Ethernet Hub
The NetGuardian 216T comes equipped with an integrated 10-BaseT Ethernet hub, which provides seven regular
Ethernet ports (see Figure 6.8.1). The integrated Ethernet hub is powered by the same –48 VDC power as the
NetGuardian, which provides more secure, more robust operation than hubs that run off commercial power. The
integrated hub also frees valuable rack space by eliminated an unnecessary extra unit.
7 Front Panel LEDs
Fig. 7.1. Front panel LEDs
The NetGuardian's front panel LEDs indicate communication and alarm reporting status. LED status messages
are described below in Table 7.A.
LED
Status
WAN Link
Solid Green
Solid Red
Blink Green
Blink Red
Blink Green
Blink Red
Blink Green
Blink Red
Blink Green
Blink Red
Blink Red
Solid Green
Off
Blink Red
Solid Red
Blink Green
Blink Red
T1 signal detected
No T1 signal detected
LMI (Link Management Interface) is synchronized)
LMI is not synchronized (Link is down)
Transmit over T1
Receive over T1
Transmit over Ethernet
Receive over Ethernet
Transmit over Serial
Receive over Serial
Packet lost in WAN/LAN mediation
CSU Loopback mode active
CSU Loopback mode inactive (normal operation)
New COS alarm*
One or more standing alarms*
Valid Configuration
Invalid Configuration
Blink Green
Blink Red
Transmit over Craft serial port
Receive over Craft serial port
WAN Status
T1
LAN
Serial
Drop
Loop
Alarm
Config
Craft
Description
*NOTE: Alarm must be configured for notification to be reflected in LED
Table 7.A. Front panel LED Status message descriptions
16
8 Back Panel LEDs
Fig. 8.1. Back panel LEDs for Power and Ethernet connections
The back panel LEDs indicate the status of power and Ethernet connections. LED status messages are described
below in Table 8.A.
LED
Power A
Power
Power B
FA
Serial
10BaseT
Hub
2,3,4,5
Col
1-7
Link
T1
Status
Status
Solid Green
Off
Solid Green
Off
Solid Red
Blink Green
Blink Red
Blink Green
Blink Green
Solid Green
Solid Red
Blink Green
Blink Red
Description
Polarity is correct on power feed A
No power or polarity is reversed on power feed A
Polarity is correct on power feed B
No power or polarity is reversed on power feed B
Fuse failure on either Power feed A, B, or both
Transmit over Serial
Receive over Serial
One or more of the Ethernet hub ports are active
Transmit or Receive over indicated integrated
Ethernet hub port
T1 Signal detected
No T1 Signal detected
LMI (Link Management Interface) is synchronized
LMI is not synchronized (Link is down)
Table 8.A. Back panel LED Status message descriptions
9 Configuring the NetGuardian
The NetGuardian must be provisioned with log-on passwords, alarm descriptions, port parameters, ping targets,
control descriptions, and other system information. You can provision the NetGuardian using either the Edit216T
software or the Web interface. The NetGuardian also supports a limited TTY interface for configuring some
basic options. (For full instructions on configuring the NetGuardian, see the software configuration guides on the
NetGuardian Resource CD.)
You can provision the NetGuardian either locally through the craft port or remotely through a LAN connection.
However, to access the NetGuardian via LAN you must first make a temporary connection to the NetGuardian
and assign it an IP address on your network. For more information, see Section 10, "Connecting to the
NetGuardian."
17
10 Connecting to the NetGuardian
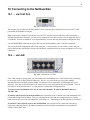
10.1 ... via Craft Port
Fig. 10.1 NetGuardian Craft Port
The simplest way to connect to the NetGuardian is over a physical cable connection between your PC's COM
port and the NetGuardian's craft port.
Note: You must be connected via craft port to use the TTY interface, but you don't have to be connected to a
NetGuardian unit to use Edit216T. You only need a connection to the unit to read or write configuration files to
its NVRAM. You can use Edit216T on an unconnected PC to create and store NetGuardian configuration files.
Use the DB9M-DB9F download cable provided with your NetGuardian to make a craft port connection.
You can perform all configuration tasks via the craft port — but if you like, you can connect via the craft port
just to configure the NetGuardian's Private LAN IP address, and then do the rest of your configuration via a LAN
connection.
10.2 ... via LAN
Fig. 10.2. NetGuardian LAN Link
Once LAN settings are provisioned, you can connect to the NetGuardian over a LAN connection by connecting
to one of the seven 10-BaseT Ethernet Hub ports. This is a very convenient way to provision multiple
NetGuardian units at multiple locations. Note: You don't have to be connected to a NetGuardian unit to use
Edit216T. You only need a connection to the unit to read or write configuration files to its NVRAM. You can
use Edit216T on an unconnected PC to create and store NetGuardian configuration files.
To connect to the NetGuardian via LAN, all you need is the unit's IP address (Default IP address is
192.168.1.100).
If you have physical access to the NetGuardian, the easiest thing to do is connect to the unit through the craft
port and then assign it an IP address. Then you can complete the rest of the unit configuration over a remote
LAN connection, if you want. For instructions, see Section 10.1, "Connecting to the NetGuardian via Craft Port."
If you DON'T have physical access to the NetGuardian, you can make a LAN connection to the unit by
temporarily changing your PC's IP address and subnet mask to match the NetGuardian's factory default IP
settings. Follow these steps:
18
1. Look up your PC's current IP address and subnet mask, and write this information down.
2. Reset your PC's IP address to 192.168.1.200.
3. Reset your PC's subnet mask to 255.255.0.0. You may have to reboot your PC to apply your changes.
4. Once the IP address and subnet mask of your computer coincide with the NetGuardian's, you can access
the NetGuardian via a Telnet session or via Web browser by using the NetGuardian's default IP address
of 192.168.1.100.
5. Provision the NetGuardian with the appropriate information, then change your computer's IP address and
subnet mask back to their original settings.
Note: You can ping the NetGuardian to confirm connectivity through the Ethernet hub ports.
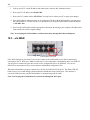
10.3 ...via WAN
Fig. 10.3. NetGuardian WAN Link
Once WAN settings are provisioned, you can also connect to the NetGuardian over a WAN connection by
connecting to the T1 WAN port. Note: You don't have to be connected to a NetGuardian unit to use Edit216T.
You only need a connection to the unit to read or write configuration files to its NVRAM. You can use
Edit216T on an unconnected PC to create and store NetGuardian configuration files.
When the NetGuardian is properly connected over WAN, the Link LED will be green. The Status LED will
blink red for a few seconds during synchronization but should then always blink green. This indicates a
successful LMI connection, and the NetGuardian is communicating with the router.
Note: You can ping the NetGuardian for connectivity through the WAN port.
19
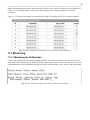
11 TTY Interface
Fig. 11.1. The TTY interface initial configuration screen
The TTY interface is the NetGuardian's built-in provision controls for basic configuration of the NetGuardian.
Configure the NetGuardian's Ethernet port settings, monitor the status of base and system alarms, operate control
relays, view live ping targets , view debug or create proxy connections to other ports. For more advanced
configuration tools, please use the Web browser interface or the Edit216T utility.
To use the TTY interface with the NetGuardian, all you need is any PC with terminal emulation software and a
connection to the NetGuardian. This connection can be a direct connection to the NetGuardian's front panel craft
port or a remote connection via Telnet. Some initial software configuration must be performed before you can
use a remote connection to the NetGuardian.
The TTY interface is primarily used for configuring and provisioning the NetGuardian, but you can also use it to
ping IP targets, view system statistics, and data port activity.
NOTE: The TTY default password is "dpstelecom".
11.1 Menu Shortcut Keys
The letters before or enclosed in parentheses ( ) are menu shortcut keys. Press the shortcut key to access that
option. Pressing the ESC key will always bring you back to the previous level. Entries are not case sensitive.
20
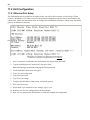
11.2 Unit Configuration
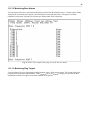
11.2.1 Ethernet Port Setup
The NetGuardian must be assigned an IP address before you will be able to connect via LAN using a Telnet
client or a Web browser. To connect via LAN, the minimum configuration requires setup of the IP address and
subnet mask. Follow the instructions below to configure the NetGuardian's IP address, subnet mask, and default
gateway for Ethernet connectivity.
Fig. 11.2.1.1. Configure the Ethernet port parameters
** Gateway will not be configurable if T1 is enabled
1. Once a connection is established, the NetGuardian will respond with "Password."
2. Type the default password, "dpstelecom," then press Enter.
Note: DPS strongly recommends changing the default password.
3. The NetGuardian's main menu will appear.
4. Type C for the C)onfig menu.
5. Type E for E)dit menu.
6. Type E for port settings.
7. Configure the unit address, subnet mask, and default gateway.
8. ESC to the main menu.
9. When asked if you would like to save changes, type Y (yes).
10. Reboot to save the new configuration to the NetGuardian.
11. Now you can connect to the NetGuardian via LAN and complete the configuration.
21
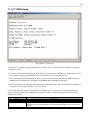
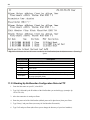
11.2.2 T1 WAN Setup
Fig. 11.2.2.1. TTY interface
Verify that T1 is enabled, if using WAN interface. (Config > Edit > T1 WAN) Go to the Web browser page to
configure T1 WAN.
1. To connect to the NetGuardian from the Web browser, you must know its IP address or domain name if it has
been registered with your internal DNS. Enter it in the address bar of your Web browser.
2. After connecting to the NetGuardian's IP address, enter your password and click Submit. Note: The factory
default password is dpstelecom. It's highly recommended that you change this password.
3. In the left frame there is a Monitor menu button and an Edit menu button. Most of the software configuration
will occur in the Edit menu, and this is true for T1WAN.
Click on Edit, then click on the T1 WAN button on the Edit screen. A screen for T1 WAN port parameters
appears on the right, and you can configure the settings from there. The following table briefly explains the
configuration options:
Field
Unit Address
Subnet Mask
Description
WAN address of the NetGuardian
The Subnet mask is a road sign to the NetGuardian telling it whether your packets
should stay on your local network or be forwarded somewhere else on a wide area
network.
22
DS0 Start
The default DS0 value is 1 (64 kbps), but the NetGuardian supports up to 24 DS0
channels (24 DS0s=1.536 mbps). Note: The value entered here must match the DS0
end value.
DS0 End
The default DS0 value is 1 (64 kbps), but the NetGuardian supports up to 24 DS0
channels (24 DS0s=1.536 mbps).
WAN and IP Routing The Enable box should be checked if you want to route packets between T1 WAN
and Ethernet hub.
B8ZS Line Mode
The Enable box should be checked here for B8ZS line mode operation.
Frame Mode
Default frame mode is ESF, but you have the option of switching to D4.
Clock Source
Default clock is Network, but you have the option of switching to an internal clock
source.
Protocol
The NetGuardian's T1 protocol is Frame Relay
DLCI
DLCI (Data Link Connection Identifier) is a channel number attached to the Frame
Relay that tells the network how to route the data. The NetGuardian default is 16.
LMI
LMI (Link Management Interface) is a signaling standard used between routers and
Frame Relay switches. The default mode is ANSI, but can be changed to ITU.
Table 11.2.2.A. T1 WAN configuration options and descriptions
11.2.2.1 Network Address Translation with T1 WAN
11.2.2.1.1 Gateway Mode
Gateway mode tells the NetGuardian to automatically pass all inbound Ethernet traffic not destined for an IP
address on the Ethernet subnet to the T1 WAN channel. Similarly, inbound IP packets encapsulated within
Frame Relay on the T1 WAN channel are forwarded out the Ethernet Hub*.
To enable Gateway mode of operation, all entries in the Static Network Address Translation (NAT) table must
have the "Enable" box unchecked. Addresses are not translated in Gateway mode.
*Exception: IP packets will not forward to the Hub if the destination address is the NetGuardian's Ethernet
address.
Fig. 11.2.2.1.1. Configuration for Ethernet gateway traffic
11.2.2.1.2 Router Mode
The wide area network (WAN) connects two separate, private networks, allowing for mutual communication.
Before this can happen, the IP address of the local computer must be translated so that it will be recognized and
passed through to another network. This is where Network Address Translation (NAT) is used. NAT translates
the IP address for traffic coming into and leaving the local network.
From the Web browser T1 WAN menu, you can configure network computers for NAT translation in the Static
Network Address Translation fields. Be sure to select (check) the "Enable" column box.
23
Note: The submask number must be the same for the first three octets, which are followed by the computer's ID
number. If your submask number is outside the subnet range, then use the gateway address to route the
connection.
Figure 11.2.2.1.2 shows an example of a static Network Address Translation (NAT) for 3 network computers.
Fig. 11.2.2.1.2. Example NAT translations of several local network computers
11.3 Monitoring
11.3.1 Monitoring the NetGuardian
Connect a PC running VT100 terminal emulation software to the craft port or connect via LAN using a Telnet
client with VT100 emulation to port 2002 to reach the monitor menu selection. This section allows you to do full
system monitoring of the NetGuardian including: all alarms, ping information, relays, analogs, and system status.
Fig. 11.3.1.1. The monitor menu allows status checking on all elements
24
11.3.1.1 Monitoring WAN
Fig. 11.3.1.1.1. T1 WAN Statistics screen
Select W)an and the T1 WAN statistics screen comes up. This lets you know the status of your WAN
connection.
The three stats at the top; WAN Link, LMI Link, and Far Link; indicate connectivity based on LED signals and
router connection. For WAN Link status, the number following "ups" indicates how many times the Link LED
flashed red after a WAN link is established. Once is normal, so a "1" would appear in that case. LMI Link status
indicates how many times the Status LED flashed red. Again, one time is normal. Far Link status indicates
router connectivity. A "1" will appear after "ups" if the router is connected to the unit. The "downs" fields
indicate the number of times a link was broken after being established.
The next bunch of data is High-level Data Link Control (HDLC), which shows T1 WAN channel protocol
activity in the form of packets sent and received, and the errors registered in both receiving and sending. CRC
(Cyclic Redundancy Checking) contains an error checking number that the destination can use to verify that the
packet is error free. The Abort field shows the number of error frames aborted (discarded). The Over field
indicates a data overflow condition during packet reception.
WAN Tx and Rx Que indicates how well the system is keeping up mediating packets between the LAN and
WAN interfaces.
The "Wan2Eth Pkts" field shows the number of WAN packets routed and dropped, the first number being a
combination of the two. "Eth2WAN Pkts" shows the number of Ethernet packets routed and dropped, the first
number being a combination of the two.
The last three T1 queries show the T1's interrupt request line (IRQ) status, the bandwidth size in kbps (based on
the DS0 number used), and the clock line being used (network is the default).
25
11.3.1.2 Monitoring Base Alarms
View the status of the device connected to the discrete alarms from the M)onitor menu > A)larms option. Under
Status, the word Alarm will appear if an alarm has been activated and Clear will appear if an alarm
condition is not present. If groups are used the user defined status will be displayed.
Fig. 11.3.1.2.1. This example shows page two of the discrete alarms
11.3.1.3 Monitoring Ping Targets
View the status of all your ping targets from the M)onitor menu > P)ing targets option. This screen displays the
ping target ID, description, and IP address. Under Status the word Alarm will appear if an alarm has been
activated and Clear will appear if an alarm condition is not present.
26
Fig. 11.3.1.3.1. The Ping info submenu allows you to change ping targets
11.3.1.4 Monitoring and Operating Relays (Controls)
The NetGuardian comes equipped with 2 relays that can be used to control external devices. Monitor the status
of your relays from the M)onitor menu > R)elays option.
Relays are set to normally open (N/O) as the factory default, but each or all of them can be changed to normally
closed (N/C) by changing their respective jumper.
Fig. 11.3.1.4.1 The relays can be operated from this screen
11.3.1.5 Monitoring Analogs
View the current reading and the alarm status of your analog devices from the M)onitor menu > a(N)logs option.
The value shown is a snapshot of the channels measurement, not a real-time reading. Refresh the readings by
re-selecting the analogs option. Alarm status indicates that a preset threshold has been crossed and is designated
by an x.
27
The four analog measuring inputs are set to measure voltage as the factory default. If your sensors output is
current, change the appropriate analog dipswitch, to the current measuring position. The scaling worksheet in the
provisioning section converts all readings shown here into native units, such as degrees Celsius.
Note that channels 5 and 6 are reserved for Power Feed A and Power Feed B, respectively; and that channel 7 is
reserved for internal temperature monitoring ("iF"=internal Fahrenheit) while channel 8 is for external
temperature monitoring ("eF"=external Fahrenheit).
Fig. 11.3.1.5.1. This display allows you to monitor your eight analog inputs
11.3.1.6 Monitoring System Alarms
View the status of the NetGuardian's system alarms from the M)onitor menu > S)ystem option. Under Status,
the word Alarm will appear if an alarm has been activated and Clear will appear if an alarm condition is not
present. See Section 12.1.1, "System Alarms Display Map," for more information. If groups are used, the user
defined status will be displayed.
Fig. 11.3.1.6.1. System Alarms can be viewed from the M)onitor menu > S)ystem option
** System Alarm 38 will not be used if T1 is disabled.
28
11.3.1.7 Monitoring Data Port Activity
View the status of the NetGuardian's data port from the M)onitor menu > p(O)rts option.
The NetGuardian provides an ASCII description under Transmit and Receive. Choose a) Transmit to view
data transmitted to another device. Choose b) Receive to view data received from another device. See Section
12.4, "ASCII Conversion," for specific ASCII symbol conversion.
Fig. 11.3.1.7.1. Data port activity can be viewed from the M)onitor menu > p(O)rts option
11.3.1.8 Monitoring the Accumulation Timer
The Accumulation Timer keeps a running total of the amount of time a point is in an alarm state. An alarm point
that exceeds a user defined threshold will trigger an Accumulation Event system alarm. Refer to Figure
11.3.1.8.1. and Table 11.3.1.8.A to define the accumulation timer.
Fig. 11.3.1.8.1. Monitor and reset the Accumulator Timer
Field
Description
Display and Point Reference
Indicates which alarm point is to be monitored.
Point Description
The user-defined description of the monitored alarm point.
Point Status
The current status of the monitored point.
Event Threshold
Amount of time allowed to accumulate before the system alarm,
“Accumulation Event” is triggered. Note: Maximum is 45 days.
Accumulated Time
The total time the monitored point has been in an ALARM state.
Accumulated Since
Indicates the last time the accumulation timer was reset.
Reset Accumulation Timer
Placing a check mark here will reset the timer when the user
presses the Submit button.
Table 11.3.1.8.A. Field descriptions in the Accumulator Timer Settings
29
11.3.2 Viewing Live Target Pings
Choose P)ing to ping any of the NetGuardian's user defined IP addresses. Then enter the ID number (1-32) of the
IP address or enter any IP address to ping.
Fig. 11.3.2.1. Continuously ping an IP address that has been defined in the NetGuardian's ping table
11.3.3 Proxy Menu
You can create proxy connections to reach-through to the craft port or serial port from the P)roxy menu. You'll
be able to monitor and control additional devices via proxy connection to the NetGuardian. Data presented and
handshaking will be specified by the connected device.
To cancel the proxy connection wait a half second, then quickly type @@@ and press ENTER.
Fig. 11.3.3.1. Access devices connected to the eight data ports on the back panel through M)onitor menu >
P)roxy option
11.3.4 Event Logging
Choose E)vent log to view the up to 100 events posted to the NetGuardian; including unit reset, base and system
alarms, ping alarms, analog alarms, and controls. Posted events for the various alarms include both alarm and
clear status. Refer to Table 11.3.4.A for event log field descriptions.
Note: All information in the event log will be erased upon reboot or a power failure.
30
Fig. 11.3.4.1. Monitor the last 100 events recorded by the NetGuardian from the M)onitor menu > E)vent log
option
Event Log Field
Evt
Date
Time
Grp
State
PRef
Description
Description
Event number (1–100)
Date the event occurred
Time the event occurred
Alarm Group
State of the event (A=alarm, C=clear)
Point reference (See Appendix A for display descriptions).
User defined description of the event as entered in the alarm point
and relay description fields.
Table 11.3.4.A. Event Log field descriptions
11.3.5 Backing Up NetGuardian Configuration Data via FTP
1. From the Start menu on your PC, select RUN.
2. Type "ftp" followed by the IP address of the NetGuardian you are backing up (example: ftp
126.10.120.199).
3. After the connection is made press Enter.
4. Enter the password of the NetGuardian (default password is dpstelecom), then press Enter.
5. Type "binary" and press Enter (necessary for NetGuardian file transfer).
6. Type "lcd" and press Enter (this allows you to change the directory of your local machine).
31
7. Type "get" followed by the name you wish to define for the NetGuardian backup file. Add the extension
".ngd" to the file name (example: get ngdbkup.ngd) and press Enter.
8. After reloading, type "bye" and press Enter to exit.
Note: The backup file name can have a maximum of eight characters before the file extension.
11.3.5.1 Reloading NetGuardian Configuration Data
1. From the Start menu on your PC, select RUN.
2. Type "ftp" followed by the IP address of the NetGuardian you are backing up (example: ftp
126.10.120.199).
3. After the connection is made press Enter.
4. Enter the password of the NetGuardian (default password is dpstelecom), then press ENTER.
5. Type "binary" and press Enter (necessary for NetGuardian file transfer).
6. Type "lcd" and press Enter (this allows you to change the directory of your local machine).
7. Type "put" followed by the name you defined for the NetGuardian backup file and press Enter (example:
put ngdbkup.ngd).
8. Type "literal REBT" to reboot the NetGuardian.
9. After reloading, type "bye" and press Enter to exit.
32
11.3.6 Debug Input and Filter Options
Debug Input Options
ESC
B
T
U
R
X
?
a
A
c
C
d
D
e
E
f
F
G
h
H
i
k
l
L
m
M
o
b
p
P
q
Q
r
s
S
t
T
w
W
Exit Debug
Show BAC status points
Show task status
Show DUART information
Show network routing table
Clear debug enable bitmap. Turn all debug filters OFF
Display Options
Debug Filter Options:
(1) Alarm toggle switch. Shows posting of alarm data
(2) Analog toggle switch. Shows TTY interface debug
(3) Config toggle switch. Shows TTY interface debug
(4) Control relay toggle switch. Shows relay operation
(5) DCP responder toggle switch. Shows DCP protocol
(6) Device toggle switch. Shows telnet and proxy information and NGEdit4 serial
communication.
(7) Expansion poller toggle switch. Shows NGDdx polling
(8) ECU Interrogator toggle switch. Shows BAC processing
(9) FTP Command toggle switch. Shows command string parsing
(10) FTP Data toggle switch. Shows FTP Read / Write
(11) GLD poller toggle switch. Shows GLD polling
(12) HTML debug switch. Shows Web Browser processing
(13) HDLC debug switch. Shows T1 WAN channel protocol activity
(14) PING toggle switch
(15) Socket toggle switch. Shows current dcu resources
(16) LED toggle switch. Shows current LED state
(17) LCD display toggle switch. Shows LCD control and text
(18) Modem toggle switch. Shows modem vectored initialization
(19) Undefined
(20) Osstart toggle switch. Miscellaneous application debug, including NVRAM
read and write operation, and event posting
(21) IP broadcasting block. Shows IPA
(22) SPORT toggle switch. Port init debug and channeled port debug
(23) PPP toggle switch. Shows PPP functioning
(24) QAccess toggle switch. Reserved for future use
(25) Proxy base. Connects craft port to the hub
(26) Report toggle switch. Shows reporting event activity, including SNMP,
pagers, email, etc. Also shows PPP negotiation for NG client PPP mode.
(27) SNMP toggle switch. Reserved for future use
(28) STAK toggle switch. Shows network processing and IPA of arp requests.
Also shows packets discarded by Filter IPA.
(29) TERM toggle switch. Shows UDP/TCP port handling. The camera and
network time (NTP) jobs also use the TERM toggle switch
(30) T1 toggle switch. Shows UDP/TCP port handling. The camera and network
time (NTP) jobs also use the TERM toggle switch
(31) HTTP toggle switch. Shows handling of web browser packets
(32) WEB toggle switch 2. Dump HTML text from web browser
33
Table. 11.3.6.A. Debug Input and Filter Options (previous page)
12 Reference Section
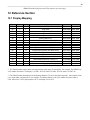
12.1 Display Mapping
Port
Address Display
Description
Set
Clear
Discrete Alarms 1-16
Ping Table
Analog Channel 1**
Analog Channel 2**
Analog Channel 3**
Analog Channel 4**
9001-9032
9065-9096
9129-9132
9193-9196
9257-9260
9321-9324
9385-9388
99
99
99
99
99
99
99
1
1
1
1
1
1
1
1
2
3
4
5
6
7
Analog Channel 5–Power Feed A**
8001-8032
8065-8096
8129-8132
8193-8196
8257-8260
8321-8324
8385-8388
99
1
8
Analog Channel 6–Power Feed B**
8449-8452
9449-9452
99
1
9
Analog Channel 7–Internal Temp Sensor**
8513-8516
9513-9516
99
1
10
Analog Channel 8–External Temp Sensor**
8577-8580
9577-9580
99
99
99
99
99
99
99
1
1
1
1
1
1
1
11
12
13
14
15
16
17
Relays/System Alarms (See table below)
NetGuardian Expansion 1 Alarms 1-48
NetGuardian Expansion 1 Relays 1-8
NetGuardian Expansion 2 Alarms 1-48
NetGuardian Expansion 2 Relays 1-8
NetGuardian Expansion 3 Alarms 1-48
NetGuardian Expansion 3 Relays 1-8
8641-8674
6001-6064
6065-6072
6129-6177
6193-6200
6257-6305
6321-6328
9641-9674
7001-7064
7065-7072
7129-7177
7193-7200
7257-7305
7321-7328
Table 12.1.A. Display descriptions and SNMP Trap numbers for the NetGuardian
* The TRAP number ranges shown correspond to the point range of each display. For example, the SNMP Trap
"Set" number for alarm 1 (in Display 1) is 8001, "Set" for alarm 2 is 8002, "Set" for alarm 3 is 8003, etc.
** The TRAP number descriptions for the Analog channels (1-8) are in the following order: minor under, minor
over, major under, and major over. For example, for Analog channel 1, the "Set" number for minor under is
8129, minor over is 8130, major under is 8131, and major over is 8132.
34
SNMP Trap #s
Points
Description
Set
Clear
1
2
17
19
21
22
33
36
37
38
39
43
44
45
46
48
49
50
51
52
56
57
58
63
64
Relays
Relays
Timed Tick
Network Time Server
Duplicate IP Address
External Sensor Down
Unit Reset
Lost Provisioning
DCP Poller Inactive
T1 WAN Inactive**
LAN Inactive
SNMP Trap not Sent
Pager Que Overflow
Notification failed
Craft RcvQ full
Data 1 RcvQ full
Data 2 RcvQ full*
Data 3 RcvQ full*
Data 4 RcvQ full*
Data 5 RcvQ full*
NetGuardian DX 1 fail
NetGuardian DX 2 fail
NetGuardian DX 3 fail
Craft Timeout
Event Que Full
8641
8642
8657
8659
8661
8662
8673
8676
8677
8678
8679
8683
8684
8685
8686
8688
8689
8690
8691
8692
8696
8697
8698
8703
8704
9641
9642
9657
9659
9661
9662
9673
9676
9677
9678
9679
9683
9684
9685
9686
9688
9689
9690
9691
9692
9696
9697
9698
9703
9704
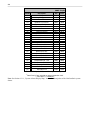
Table 12.1.B Display 11 System Alarms point descriptions
* Data Ports 2-5 are included on optional expansion card.
** Not used if T1 is disabled.
Note: See Section 12.1.1, "System Alarms Display Map," for detailed descriptions of the NetGuardian's system
alarms.
35
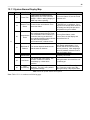
12.1.1 System Alarms Display Map
Display Points
17
19
20
11
21
22
33
36
Alarm Point
Timed Tick
Description
Toggles state at constant rate as
configured by the Timed Tick timer
variable. Useful in testing integrity of
SNMP trap alarm reporting.
Network Time Communication with Network Time
Server
Server has failed.
Solution
To turn the feature off, set the Timed
Tick timer to 0.
Try pinging the Network Time Server’s
IP address as it is configured. If the
ping test is successful, then check the
port setting and verify the port is not
being blocked on your network.
An alarm has been standing for the
time configured under Accum. Timer.
The Accumulation timer enables you To turn off the feature, under
Accumulation
Accum.Timer, set the display and
to monitor how long an alarm has
Event
been standing despite system reboots. point reference to 0.
Only the user may reset the
accumulated time; a reboot will not.
Unplug the LAN cable and contact
your network administrator. Your
Duplicate IP The unit has detected another node
network and the unit will most likely
Address
with the same IP Address.
behave incorrectly. After assigning a
correct IP address, reboot the unit to
clear the System alarm.
External
External Sensor is not active
Check to see if External Sensor cable
Sensor Down
is properly connected.
The unit has just come online. The
Seeing this alarm is normal if the unit
set alarm condition is followed
Unit Reset
is powering up.
immediately by a clear alarm
condition.
The internal NVRAM may be
Use Web or Edit216T to configure the
Lost
damaged. The unit is using default
unit. Power the cycle to see if the
Provisioning
configuration settings.
alarm goes away. May require RMA.
Table 12.1.1.A. System Alarms Descriptions
Note: Table 12.1.1.A. continues on following page.
36
Display Points
Alarm Point
37
DCP Poller
Inactive
38
** T1 WAN not
active
39
Ethernet not
active
40
LNK Alarm
43
Description
Solution
The unit has not seen a poll from the
Master for the time specified by the DCP
Timer setting.
If DCP responder is not being used, then
set the DCP Unit ID to 0. Otherwise, try
increasing the DCP timer setting under
Timers, or check how long it takes to cycle
through the current polling chain on the
Master system.
T1 WAN port is down.
Check LAN/WAN cable. Ping to and from
the unit.
Ethernet LAN ports are down.
Hardware failure between integrated
Ethernet Hub and the unit.
SNMP Trap not SNMP trap address is not defined and an
Sent
SNMP trap event occurred.
Define the IP address where you would
like to send SNMP trap events, or
configure the event not to trap.
44
Pager Que
Overflow
Check for failed notification events that
Over 250 events are currently qued in the may be filling up the pager queue. There
pager que and are still trying to report.
may be a configuration or communication
problem with the notification events.
45
Notification
failed
A notification event, like a page or email,
was unsuccessful.
Use RPT filter debug to help diagnose
notification problems.
46
Craft RcvQ full
The Craft port received more data than it
was able to process.
Disconnect whatever device is connected
to the craft serial port. This alarm should
not occur.
48
11
Check proxy connection. The serial port
Data 1 RcvQ full Data port 1 receiver filled with 1 K of data. data may not be getting collected as
expected.
49
*Data 2 RcvQ
full
Check proxy connection. The serial port
Data port 1 receiver filled with 1 K of data. data may not be getting collected as
expected.
50
*Data 3 RcvQ
full
Check proxy connection. The serial port
Data port 1 receiver filled with 1 K of data. data may not be getting collected as
expected.
51
*Data 4 RcvQ
full
Check proxy connection. The serial port
Data port 1 receiver filled with 1 K of data. data may not be getting collected as
expected.
52
*Data 5 RcvQ
full
Check proxy connection. The serial port
Data port 1 receiver filled with 1 K of data. data may not be getting collected as
expected.
56
NetGuardian DX NGDdx 1 Fail (Expansion shelf 1
1 fail
communication link failure)
57
NetGuardian DX NGDdx 2 Fail (Expansion shelf 2
2 fail
communication link failure)
58
NetGuardian DX NGDdx 3 Fail (Expansion shelf 3
3 fail
communication link failure)
Under Ports>Options, verify the number of
configured NGDdx units. Use EXP filter
debug and port LEDs to help diagnose the
problem. Use of DB9M to DB9M will null
crossover for cabling. Verify the DIP
addressing on the back of the NGDdx unit.
63
Craft Timeout
The Craft Timeout Timer has not been
reset to the specified time. This feature is
designed so other machines may keep the Change the Craft Timeout Timer to 0 to
disable the feature.
TTY link active. If the TTY interface
becomes unavailable to the machine, then
the Craft Timeout alarm is set.
64
Event Que Full
Enable DCP timestamp polling on the
The Event Que is filled with more than 500
master so events are collected, or reboot
uncollected events.
the system to clear the alarm.
Table 12.1.1.A System Alarms Descriptions (continued)
*Data Ports 2-5 are included on optional expansion card.
** Not used if T1 is disabled.
37
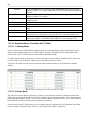
12.2 SNMP Manager Functions
The SNMP Manager allows the user to view alarm status, set date/time, issue controls, and perform a resync. The
display and tables below outline the MIB object identifiers. Table B.1 begins with dpsRTU; however, the MIB
object identifier tree has several levels above it. The full English name is as follows:
root.iso.org.dod.internet.private.enterprises.dps-Inc.dpsAlarmControl.dpsRTU. Therefore, dpsRTU's full object
identifier is 1.3.6.1.4.1.2682.1.2. Each level beyond dpsRTU adds another object identifying number. For
example, the object identifier of the Display portion of the Control Grid is 1.3.6.1.4.1.2682.1.2.3.3 because the
object identifier of dpsRTU is 1.3.6.1.4.1.2682.1.2 + the Control Grid (.3) + the Display (.3).
Tbl. B1 (O.)_OV_Traps
points
_OV_vTraps
(1.3.6.1.4.1.2682.1.2.0)
Tbl. B2 (.1) Identity points
Tbl. B3 (.2) DisplayGrid points
Ident
(1.3.6.1.4.1.2682.1.2.1)
DisplayEntry
(1.3.6.1.4.1.2682.1.2.2.1)
Manufacturer (.1)
Port (.1)
PointSet (.20)
Model (.2)
Address (.2)
PointClr (.21)
Firmware Version (.3)
Display (.3)
SumPSet (.101)
DateTime (.4)
DispDesc (.4)*
SumPClr (.102)
ResyncReq (.5)*
PntMap (.5)*
ComFailed (.103)
ComRestored (.014)
P0001Set (.10001) through
P0064Set (.10064)
* Must be set to "1" to perform the resync
request which will resend TRAPs for any
standing alarm.
P0001Clr (.20001) through
P0064Clr (.20064)
Tbl. B3 (.3) ControlGrid
points
ControlGrid
(1.3.6.1.4.1.2682.1.2.3)
Tbl. B5 (.5) AlarmEntry points
AlarmEntry
(1.3.6.4.1.2682.1.2.5.1)
Aport (.1)
Port (.1)
AAddress (.2)
Address (.2)
ADisplay (.3)
Display (.3)
APoint (.4)
Point (.4)
APntDesc (.5)*
Action (.5)
AState (.6)
* For specific alarm points, see
Table B6
!
Hot
The NetGuardian 216T OID has changed from 1.3.6.1.4.1.2682.1.4 to
Tip!1.3.6.1.4.1.2682.1.2 Updated MIB files are available on the Resource CD or upon request.
38
Description
Disp 1
Disp 2
Disp 3
Disp 4
Disp 5
Disp 6
Disp 7
Disp 8
Disp 9
Disp 10
Base Discrete Alarms
Undefined**
Ping Target Alarms
Undefined**
Analog 1
Undefined**
Analog 2
Undefined**
Analog 3
Undefined**
Analog 4
Undefined**
Analog 5
Power Feed A
Undefined**
Analog 6
Power Feed B
Undefined**
Analog 7
Internal Temp Sensor
Undefined**
Analog 8
External Temp Sensor
Undefined**
Po Add Dis Points
rt ress play
99 1
1
1-16
99 1
1 17-64
99 1
2
1-32
99 1
2 33-64
99 1
3
1-4
99 1
3
5-64
99 1
4
1-4
99 1
4
5-64
99 1
5
1-4
99 1
5
5-64
99 1
6
1-4
99 1
6
5-64
99
1
7
1-4
99
1
7
5-64
99
1
8
1-4
99
1
8
5-64
99
1
9
1-4
99
1
9
5-64
99
1
10
1-4
99
1
10
5-64
Table 12.2.A. Alarm point descriptions (continued on next page)
39
Disp 11
No Data*
Undefined**
Timed Tick
Undefined**
Network Time Server
Accumulation Event
Duplicate IP Address
External Sensor down
Undefined**
Unit Reset
Undefined**
Lost Provisioning
DCP poller inactive
T1 WAN inactive
LAN inactive
LAN Link down
Undefined**
SNMP trap not
Pager Que
Notification
Craft RCVQ full
Undefined**
Data 1 RCVQ
Data 2 RCVQ^
Data 3 RCVQ^
Data 4 RCVQ^
Data 5 RCVQ^
Undefined**
NGDdx 1-3 fail
Undefined**
CRFT timeout
Event Que full
99
99
99
99
99
99
99
99
99
99
99
99
99
99
99
99
99
99
99
99
99
99
99
99
99
99
99
99
99
99
99
99
1
1
1
1
1
1
1
1
1
1
1
1
1
1
1
1
1
1
1
1
1
1
1
1
1
1
1
1
1
1
1
1
11
11
11
11
11
11
11
11
11
11
11
11
11
11
11
11
11
11
11
11
11
11
11
11
11
11
11
11
11
11
11
11
1-8
9-16
17
18
19
20
21
22
23-32
33
34-35
36
37
38
39
40
41-42
43
44
45
46
47
48
49
50
51
52
53-55
56-58
59-62
63
64
Table 12.2.A (continued). Alarm Point Descriptions
* "No data" indicates that the alarm point is defined but there is no description entered.
** "Undefined" indicates that the alarm point is not used.
^ Data Ports 2-5 are included on optional expansion card.
40
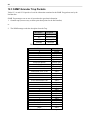
12.3 SNMP Granular Trap Packets
Tables 12.3.A and 12.3.B provide a list of the information contained in the SNMP Trap packets sent by the
NetGuardian.
SNMP Trap managers can use one of two methods to get alarm information:
1. Granular traps (not necessary to define point descriptions for the NetGuardian)
or
2. The SNMP manager reads the description from the Trap.
UDP Header
Description
1238
Source port
162
Destination port
303
Length
0xBAB0
Checksum
Table 12.3.A UDP Headers and descriptions
SNMP Header
Description
0
Version
Public
Request
Trap
Request
1.3.6.1.4.1.2682.1.2
Enterprise
126.10.230.181
Agent address
Enterprise Specific
Generic Trap
8001
Specific Trap
617077
Time stamp
1.3.7.1.2.1.1.1.0
Object
NetGuardian 216T v1.0B
Value
1.3.6.1.2.1.1.6.0
Object
1-800-622-3314
Value
1.3.6.1.4.1.2682.1.2.4.1.0
Object
01-02-1995 05:08:27.760
Value
1.3.6.1.4.1.2682.1.2.5.1.1.99.1.1.1
Object
99
Value
1.3.6.1.4.1.2682.1.2.5.1.4.99.1.1.1
Object
1
Value
1.3.6.1.4.1.2682.1.2.5.1.3.99.1.1.1
Object
1
Value
1.3.6.1.4.1.2682.1.2.5.1.2.99.1.1.1
Object
1
Value
1.3.6.1.4.1.2682.1.2.5.1.5.99.1.1.1
Object
Rectifier Failure
Value
1.3.6.1.4.1.2682.1.2.5.1.6.99.1.1.1
Object
Alarm
Value
Table 12.3.B. SNMP Headers and descriptions
41
12.4 ASCII Conversion
The information contained in Table 12.4.A is a list of ASCII symbols and their meanings. Refer to the bulleted
list below to interpret the ASCII data transmitted or received through the data port. Port transmit and receive
activity can be viewed from the Web browser interface.
• Printable ASCII characters will appear as ASCII.
• Non-printable ASCII characters will appear as labels surrounded by { } brackets (e.g. {NUL}).
• Non-ASCII characters will appear as hexadecimal surrounded by [ ] brackets (e.g. [IF]).
• A received BREAK will appear as <BRK>.
Abbreviation
Description
Abbreviation
Description
NUL
SOH
STX
ETX
EOT
ENQ
ACK
BEL
BS
HT
LF
VT
FF
CR
SO
SI
Null
Start of Heading
Start of Text
End of Text
End of Transmission
Enquiry
Acknowledge
Bell
Backspace
Horizontal Tabulation
Line Feed
Vertical Tabulation
Form Feed
Carriage Return
Shift Out
Shift In
DLE
DC
NAK
SYN
ETB
CAN
EM
SUB
ESC
FS
GS
RS
US
SP
DEL
BRK
Data Link Escape
Device Control
Negative Acknowledge
Synchronous Idle
End of Transmission Block
Cancel
End of Medium
Substitute
Escape
File Separator
Group Separator
Record Separator
Unit Separator
Space (blank)
Delete
Break Received
Table 12.4.A. ASCII symbols
42
13 Frequently Asked Questions
Here are answers to some common questions from NetGuardian users. The latest FAQs can be found on the
NetGuardian support web page, http://www.dpstelecom.com.
If you have a question about the NetGuardian, please call us at (559) 454-1600 or e-mail us at
[email protected]
13.1 General FAQs
Q. How do I telnet to the NetGuardian?
A. You must use Port 2002 to connect to the NetGuardian. Configure your Telnet client to connect using
TCP/IP (not "Telnet," or any other port options). For connection information, enter the IP address of the
NetGuardian and Port 2002. For example, to connect to the NetGuardian using the standard Windows Telnet
client, click Start, click Run, and type "telnet <NetGuardian IP address> 2002."
Q. How do I connect my NetGuardian to the LAN?
A. To connect your NetGuardian to your LAN, you need to configure the unit IP address, the subnet mask and
the default gateway. A sample configuration could look like this:
Unit Address: 192.168.1.100
subnet mask: 255.255.255.0
Default Gateway: 192.168.1.1
Save your changes by writing to NVRAM and reboot. Any change to the NetGuardian's IP configuration
requires a reboot.
Q. How do I connect my NetGuardian to the WAN?
A. To connect the NetGuardian to the WAN, configure T1 WAN settings in the Web browser's T1 WAN menu.
You need to know the NetGuardian's IP address or domain name if it has been registered with your internal
DNS and the subnet mask (see LAN example above). After T1 WAN settings are provisioned, make sure
you're connected to the NetGuardian's T1 WAN port. If using a router, you will need to use Static Network
Address Translation (NAT) to enable WAN communication (see Section 11.2.2.1.2 for NAT information).
Q. I'm connected to the WAN port, but the LINK and STATUS LEDs are off.
A. If the power is on, no LED illumination means that the T1 port has not been enabled. Go to the Web
browser, click on Edit, click on T1 WAN, and enable the WAN and IP Routing and B8ZS Line Mode.
Configure the remainder of the settings as needed.
Q. When I connect to the NetGuardian through the craft port on the front panel it either doesn't work
right or it doesn't work at all. What's going on?
A. Make sure your using the right COM port settings. Your COM port settings should read:
Bits per second: 9600 (9600 baud)
Data bits: 8
Parity: None
Stop bits: 1
Flow control: None
Important! Flow control must be set to none. Flow control normally defaults to hardware in most terminal
programs, and this will not work correctly with the NetGuardian.
Q. I can't change the craft port baud rate.
A. If you select a higher baud rate, you must set your terminal emulator program to the new baud rate and then
43
type DPSCFG and press Enter. If your terminal emulator is set to a slower baud rate than the craft port,
normal keys can appear as a break key — and the craft port interprets a break key as an override that resets
the baud rate to the standard 9600 baud.
Q. How do I use the NetGuardian to access TTY interfaces on remote site equipment?
A. If your remote site device supports RS-232, you can connect it to one of the eight data ports located on the
NetGuardian back panel. To make the data port accessible via LAN, configure the port for TCP/IP operation.
You now have a LAN-based proxy port connection that lets you access your device's TTY interface through
a Telnet session.
Q. How do I telnet to the NetGuardian?
A. Configure your Telnet client with these options:
· Connect using TCP/IP (not "Telnet," or any other port options)
· Enter the IP address of the NetGuardian
· Enter Port 2002
Example:
To connect using the Windows Telnet client, click Start, click Run, and type telnet 126.12.220.8
2002.
Telnet is connected through the 10BaseT Hub. Make sure you're connected to one of the Hub's 7 connectors.
Q. I just changed the port settings for one of my data ports, but the changes did not seem to take effect
even after I wrote the NVRAM.
A. In order for data port and craft port changes (including changes to the baud rate and word format) to take
effect, the NetGuardian must be rebooted. Whenever you make changes, remember to write them to the
NetGuardian's NVRAM so they will be saved when the unit is rebooted.
Q. The LAN link LED is green on my NetGuardian, but I can't poll it from my T/Mon.
A. Some routers will not forward packets to an IP address until the MAC address of the destination device has
been registered on the router's Address Resolution Protocol (ARP) table. Enter the IP address of your
gateway and your T/Mon system to the ARP table.
Q. What do the terms "port," "address," "display" and "alarm point" mean?
A. These terms refer to numbers that designate the location of a network alarm, from the most general (a port to
which several devices are connected) to the most specific (an individual alarm sensor).
Port: A number designating a serial port through which a monitoring device collects data.
Address: A number designating a device connected to a port.
Display: A number designating a logical group of 64 alarm points.
Alarm Point: A number designating a contact closure that is activated when an alarm condition occurs. For
example, an alarm point might represent a low oil sensor in a generator or an open/close sensor in a door.
These terms originally referred only to physical things: actual ports, devices, and contact closures. For the
sake of consistency, port-address-display-alarm point terminology has been extended to include purely
logical elements: for example, the NetGuardian reports internal alarms on Port 99, Address 1.
Q. What characteristics of an alarm point can be configured through software? For instance, can point 4
be used to sense an active-low signal, or point 5 to sense a level or a edge?
A. The NetGuardian's standard configuration is for all alarm points to be level-sensed. You cannot use
configuration software to convert alarm points to TTL (edge-sensed) operation. TTL alarm points are a
hardware option that must be specified when you order your NetGuardian. Ordering TTL points for your
NetGuardian does not add to the cost of the unit What you can do with the configuration software is change
any alarm point from "Normal" to "Reversed" operation. Switching to Reversed operation has different
effects, depending on the kind of input connected to the alarm point:
· If the alarm input generates an active-high signal, switching to Reversed operation means the
NetGuardian will declare an alarm in the absence of the active-high signal, creating the practical equivalent
44
of an active-low alarm.
· If the alarm input generates an active-low signal, switching to Reversed operation means the
NetGuardian will declare an alarm in the absence of the active-low signal, creating the practical equivalent of
an active-high alarm.
· If the alarm input is normally open, switching to Reversed operation converts it to a normally closed
alarm point.
· If the alarm input is normally closed, switching to Reversed operation converts it to a normally open
alarm point.
Q. Every time my NetGuardian starts up, I have to reenter the date and time. How can I get the
NetGuardian to automatically maintain the date and time setting?
A. You have three options for keeping the correct time on your NetGuardian:
Real Time Clock Option: You can order your NetGuardian with the Real Time Clock hardware option.
Once it's set, the Real Time Clock will keep the correct date and time, regardless of reboots.
Network Time Protocol Synchronization: If your NetGuardian has Firmware Version 2.9F or later, you
can configure the unit to automatically synchronize to a Network Time Protocol (NTP) server.
· To get the latest NetGuardian firmware, sign in to MyDPS at www.dpstelecom.com/mydps.
· For instructions on configuring your NetGuardian to use NTP synchronization, see your Edit216T or
NetGuardian Web Browser Interface user manual.
T/Mon RTU Time Sync Signal: You can configure your T/Mon NOC to send an RTU Time Sync signal at
a regular interval, which you can set to any time period between 10 and 10,080 minutes. The Time Sync will
automatically synchronize the NetGuardian's clock to the T/Mon's clock. And if you set your T/Mon to NTP
synchronization, you'll make sure you have consistent, accurate time stamps throughout your monitoring
network.
Q. How do I back up my NetGuardian configuration?
A. There are two ways to back up NetGuardian configuration files:
Use Edit216T
NGEdit4 can read the configuration of a NetGuardian unit connected to your PC via LAN, modem or COM
port. You can then use NGEdit4 to save a NetGuardian configuration file on your PC's hard disk or on a
floppy disk. With Edit216T you can also make changes to the configuration file and write the changed
configuration to the NetGuardian's NVRAM.
Use FTP
You can use File Transfer Protocol (FTP) to read and write configuration files to the NetGuardian's
NVRAM, but you can't use FTP to edit configuration files.
13.2 SNMP FAQs
Q. Which version of SNMP is supported by the SNMP agent on the NetGuardian?
A. SNMP v1 and v2.0c.
Q. How do I configure the NetGuardian to send traps to an SNMP manager? Is there a separate MIB for
the NetGuardian? How many SNMP managers can the agent send traps to? And how do I set the IP
address of the SNMP manager and the community string to be used when sending traps?
A. The NetGuardian begins sending traps as soon as the SNMP managers are defined. The NetGuardian MIB is
included on the NetGuardian Resource CD. The MIB should be compiled on your SNMP manager. (Note:
MIB versions may change in the future.) The unit supports a main SNMP manager, which is configured by
entering its IP address in the Trap Address field of Ethernet Port Setup. You can also configure up to eight
secondary SNMP managers, which is configured by selecting the secondary SNMP managers as pager
recipients. Community strings are configured globally for all SNMP managers. To configure the community
strings, choose System from the Edit menu, and enter appropriate values in the Get, Set, and Trap fields.
Q. Does the NetGuardian support MIB-2 and/or any other standard MIBs?
45
A. The NetGuardian supports the bulk of MIB-2.
Q. Does the NetGuardian SNMP agent support both NetGuardian and T/MonXM variables?
A. The NetGuardian SNMP agent manages an embedded MIB that supports only the NetGuardian's RTU
variables. The T/MonXM variables are included in the distributed MIB only to provide SNMP managers
with a single MIB for all DPS Telecom products.
Q. How many traps are triggered when a single point is set or cleared? The MIB defines traps like
"major alarm set/cleared," "RTU point set," and a lot of granular traps, which could imply that more
than one trap is sent when a change of state occurs on one point.
A. Generally, a single change of state generates a single trap, but there are two exception to this rule. Exception
1: the first alarm in an "all clear" condition generates an additional "summary point set" trap. Exception 2:
the final clear alarm that triggers an "all clear" condition generates an additional "summary point clear" trap.
Q. What does "point map" mean?
A. A point map is a single MIB leaf that presents the current status of a 64-alarm-point display in an
ASCII-readable form, where a "." represents a clear and an "x" represents an alarm.
Q. The NetGuardian manual talks about two control relay outputs. How do I control these from my
SNMP manager?
A. The control relays are operated by issuing the appropriate set commands, which are contained in the DPS
Telecom MIB. For more information about the set commands, see Appendix, "Display Mapping," in any of
the NetGuardian software configuration guides.
Q. How can I associate descriptive information with a point for the RTU granular traps?
A. The NetGuardian alarm point descriptions are individually defined using the Web Browser, TTY, or
Edit216T configuration interfaces.
Q. My SNMP traps aren't getting through. What should I try?
A. Try these three steps:
1. Make sure that the Trap Address (IP address of the SNMP manager) is defined. (If you changed the
Trap Address, make sure you saved the change to NVRAM and rebooted.)
2. Make sure all alarm points are configured to send SNMP traps.
3. Make sure the NetGuardian and the SNMP manager are both on the network. Use the NetGuardian's
ping command to ping the SNMP manager.
14 Technical Support
DPS Telecom products are backed by our courteous, friendly Technical Support representatives, who will give
you the best in fast and accurate customer service. To help us help you better, please take the following steps
before calling Technical Support:
1. Check the DPS Telecom website.
You will find answers to many common questions on the DPS Telecom website, at
http://www.dpstelecom.com/support/. Look here first for a fast solution to your problem.
2. Prepare relevant information.
Having important information about your DPS Telecom product in hand when you call will greatly reduce the
time it takes to answer your questions. If you do not have all of the information when you call, our Technical
Support representatives can assist you in gathering it. Please write the information down for easy access.
Please have your user manual and hardware serial number ready.
3. Have access to troubled equipment.
46
Please be at or near your equipment when you call DPS Telecom Technical Support. This will help us solve
your problem more efficiently.
4. Call during Customer Support hours.
Customer support hours are Monday through Friday, from 7 A.M. to 6 P.M., Pacific time. The DPS Telecom
Technical Support phone number is (559) 454-1600.
Emergency Assistance: Emergency assistance is available 24 hours a day, 7 days a week. For emergency
assistance after hours, allow the phone to ring until it is answered with a voicemail message(the only time DPS
allows voicemail!!). You will be asked to enter your phone number. An on-call technical support representative
will return your call as soon as possible. If the on-call staff is unable to resolve the problem, they will be able to
escalate the call to the appropriate DPS personnel.
Technical support features have been built into many of our products. In many cases, our technicians, in
conjunction with customer permission, can dial directly into our units to correct problems first-hand.
15 RMA Policy
DPS Telecom guarantees all products for two years. We will repair any deficiency in workmanship during this
warranty period free of charge. DPS Telecom products not under warranty can still be repaired with a service
charge.
In the event that a DPS Telecom product needs repaired, contact Technical Support and a technician can help
solidify the field diagnosis, and issue and RMA number if needed. An RMA will be issued if the product has a
failed feature or component, if the technicians are unable to resolve the issue remotely, or if the wrong product is
ordered or shipped.
DPA Telecom, on average, returns RMA units within 4 weeks and will email the RMA submitter on the return
shipment with a tracking number.
Under urgent circumstances, DPS Telecom will issue an advanced replacement. DPS Telecom will send a
replacement unit in advance if the problem affects service or if technicians can better troubleshoot an issue. In
both cases the advance replacement depends on DPS Telecom stock on hand.
47
48
Index
accumlation timer, 28
accumulation event, 28
alarm detection speed, 4
analog alarm inputs,
current range, 4
voltage range, 4
ASCII Conversion, 41
backup NetGuardian Configuration, 30
cables, 2
download cable, 2
Ethernet cable, 2
serial cable (RJ45 to DB9), 2
T1 crossover cable, 2
control relays, 1
maximum current, 4
maximum voltage, 4
operating from SNMP manager, 44
craft port,
making a craft port connection, 17
serial format, 42
current draw, 4
debug filter, 32
debug input, 32
dimensions, 4
discrete alarm inputs,
capacity, 4
display mapping, 33
Edit216T,
connecting to the NetGuardian 216T, 17
Ethernet port, 8
event logging, 29
firmware updates, 1
frequently asked questions (FAQs), 42
general, 42
SNMP, 44
fuse, 2
installation,
LAN/WAN connection, 8
installation,
mounting, 6
power connection, 7
tools needed, 6
interfaces, 4
LAN, 1, 8
LAN connections,
making a LAN connection, 17
MIB object identifiers, 37
NetGuardian 216T,
accessories, 4
accessory part numbers, 4
configuration interfaces, 2
connecting via craft port, 17
connecting via LAN, 17
connecting via WAN, 18
MIB, 44
provisioning, 2
resource CD, 2
software configuration, 2
software configuration guides, 2
specifications, 4
TTY interface, 1, 2
user manual, 2
Web Browser interface, 1, 2
NetGuardian Expansion, 4
NVRAM, 42
parts,
numbers, 2
ordering, 2
power input, 4, 7
poxy menu, 29
proxy server, 42
rack ears, 2, 6
reach-through ports, 1
reload NetGaurdian configurations, 31
serial ports, 1
shipping list, 2
SNMP, 1, 44
Granualr Trap Packets, 40
SNMP manager functions, 37
SNMP, 1, 44
SNMP traps, 44
specifications, 4
system alarm descriptions, 35
system alarm point descriptions, 33
T1 WAN, 1
configuration, 21, 42
crossover cable, 2
monitoring, 24
Network Address Translation - gateway mode, 22
Network Address Translation - router mode, 22
target pings, 29
technical support,
e-mail address, 42
phone number, 42, 45
web page, 45
Telnet, 42
temperature,
external temperature sensor, 2, 12
integrated temperature and battery sensor, 1, 12
specifications, 4
TTY,
Analogs, 26
Base Alarms, 25
Controls, 26
Data Port Activity, 28
Ethernet Port, 20
menu keys, 19
Monitoring, 23
Ping Targets, 25
System Alarms, 27
TTY interface, 19
wire-wrap back panel, 4, 14
“Dependable, Powerful Solutions
that allow users to monitor larger,
more complicated networks with a
smaller, less trained staff”
“Your Partners in Network Alarm Management”
www.dpstelecom.com
4955 E Yale • Fresno, CA 93727
559-454-1600 • 800-622-3314 • 559-454-1688 fax