1
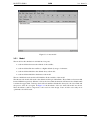
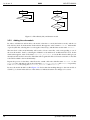
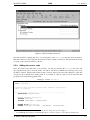
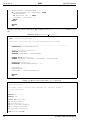
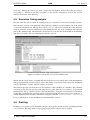
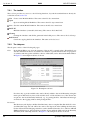
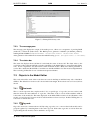
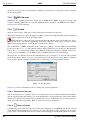
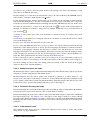
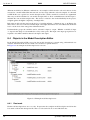
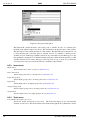
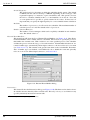
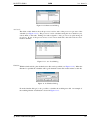
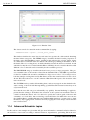
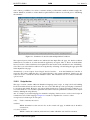
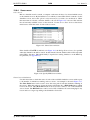
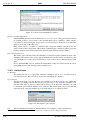
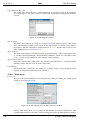
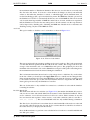
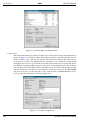
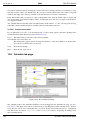
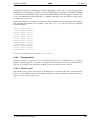
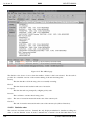
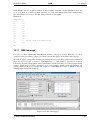
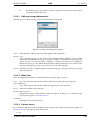
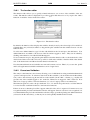
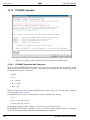
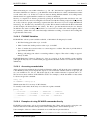
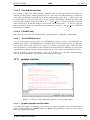
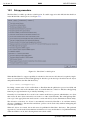
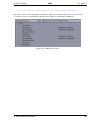
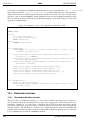
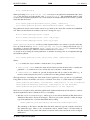
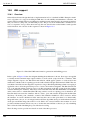
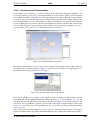
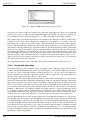
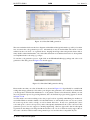
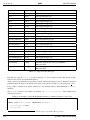
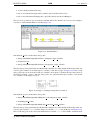
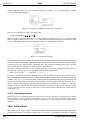
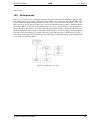
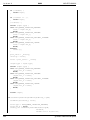
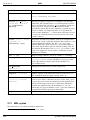
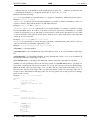
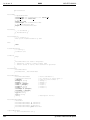
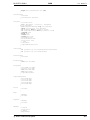
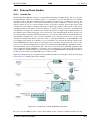
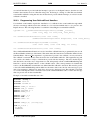
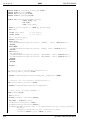
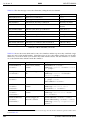
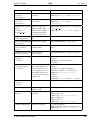
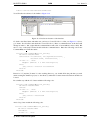
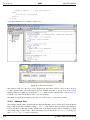
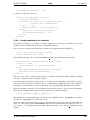
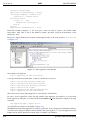
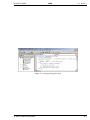
SUM
iss: 6 rev: 3
12.8.2.6
NLR-EFO-SUM-2
Color coding
The tasks are color coded:
blue
indicates the selected task.
green
indicates the currently executing task/breakpoint.
12.8.3
Menu items
The following Debug menu item is available in the scenario tab page:
Item Debug Settings. . .
Open the Debug Settings window to set and clear breakpoints and traces for the selected task.
Clear All Breakpoints
Clear all breakpoints in the schedule.
Clear All Traces
Clear all traces in the schedule.
Toggle Task Activity
Enable or disable the task.
Continue
Let the simulator run until a breakpoint is encountered. Note that the Go button on the main
Simulation Controller window cannot be used for this purpose. If Continue is requested after
all breakpoints have been cleared, then this puts the simulation run back into a normal, nondebugging mode. You can use the function key F8 to quickly access this menu item.
Step
12.8.4
Advance the simulation to the next entry point to be executed. This button should not be confused with the Step button on the Simulation Controller window itself. You can use the function
key F10 to quickly access this menu item.
External debugging facilities
There are two options for debugging model code within EuroSim. The first option is to use the debug
control window in the Simulation Controller (see Section 12.8.1). This is useful for tracing which tasks
and entrypoints get executed. It also offers an integrated interface with EuroSim itself.
However, when the model code is not behaving as expected, a symbolic debugger may become more
practical. In these cases, it is possible to attach an external (symbolic) debugger. The only precaution to
be taken is to set the usual -g flag in the Build Options of the simulator to include the symbols required by
the debugger in the exectutable code. Because EuroSim uses the GNU compilers, the usage of the GNU
Debugger (gdb) or graphical front-ends for it such as ddd or eclipse are advised. Of course symbolic
debugging is not usefull with a real-time executing simulator as the timing will no longer be correct.
The Simulation Controller supports symbolic debugging by launching the debugger when pressing F5 or
selecting Start Debugger from the Debug menu.3 . Which debugger is to be launched can be configured
in the Preferences menu item of the Simulation Controller. When the debugger is launched by the Simulation Controller it will automatically load the correct symbols and attach to the simulator executable.
The execution of the simulator will come to a halt, the time displayed at the bottom of the Simulation
Controller will no longer increase. At this point the user can type the where command to see the stack
trace, set breakpoints, step or continue with the execution.
The use of symbolic debugging can be combined with the scheduler debugger capabilities in the Simulation Controller. First use the scheduler debugger capabilities to stop at the entrypoint that you want
to start debugging. Then attach the symbolic debugger, set your breakpoint in the code and allow the
scheduler debugger and symbolic debugger to continue.
3
In EuroSim for Windows the debugger currently may not attach, but does get started. You can find the process id (pid) via
the Task Manager’s Performance Monitor after clicking Resource. Type attach <pid> to connect to the running simulator
128
c Airbus Defence and Space