1
October 2014
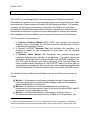
Using the NVCA Phosphorus Loading Development Tool
The “NVCA Tool for Managing New Urban Development in Phosphorus-Sensitive
Watersheds” is a generic tool for estimating how phosphorus loads will change as lands
are developed in Ontario watersheds located off the Precambrian Shield. It is intended
for use by the development community, municipalities, the MOE and Conservation
Authorities as a scientifically-sound method to assess if phosphorus loading from new
development is maintained or reduced over pre-development conditions by modelling
Best management Practices (BMPs) and Low Impact Development (LID) techniques.
The Tool consists of three elements:
1. A Technical Guidance Manual (HESL 20141) that provides the reference
materials used in developing the Tool and documents the derivation of export
coefficients and estimation routines.
2. A Microsoft ACCESS© Database Tool that facilitates the calculation of a
phosphorus budget for new development in accordance with the technical
guidance, and
3. A Database User’s Manual (this document) that provides step-by-step
instructions explaining the operation of the database. The user’s manual was
prepared by Stoneleigh Data for use with the Microsoft ACCESS© Database Tool.
The NVCA has developed a web based application of the Tool that follows the
same procedures and calculations as the ACCESS© version but which differs in
some features and operations. This manual may not be completely compatible with
the NVCA web-based Tool and is intended only for use with the ACCESS© version.
The Technical Guidance Manual and Database Tool are divided into four modules as
follows:
Module 1 – Estimates pre-development phosphorus loads for representative
land uses (categorized in separate Natural Heritage, Urban and Cropland subtypes) contained within the study site,
Module 2 – Estimates post-development phosphorus loads that are
representative of the proposed land uses for the study site without BMPs and LID
techniques to reduce phosphorus loads,
Module 3 – Estimates the reduction in phosphorus loads from the postdevelopment scenario with implementation of BMPs and LID techniques, and
1
Hutchinson Environmental Sciences Ltd. 2014. Managing New Urban Development in PhosphorusSensitive Watersheds. Prepared for Nottawasaga Valley Conservation Authority. October 2014. 65pp.
1|Page
October 2014
Module 4 – Provides a checklist for users to guide selection and implementation
of BMPs for the construction phase of development to minimize sediment loss
and resultant phosphorus export.
The following User’s Manual is not intended as a “stand alone” description of the Tool or
the estimation process, but as a set of instructions on operating the Microsoft
ACCESS© Database Tool. The user must always rely on the Technical Guidance
Manual as the primary technical source.
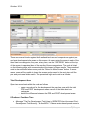
To start:
Save the database file to any folder – all support reference data tables are
warehoused within this single file.
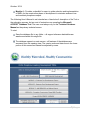
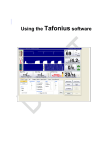
The database opens to a main screen – all features of the database are
accessed from this opening view. The version code and date show in the lower
portion of this screen and cannot be adjusted by users.
2|Page
October 2014
STEP 1: For a new development you will need to enter information about the
development first– a unique development name and date combination are required.
Other optional information includes the developer or agent name and a description of
the development (e.g., location, size, development type).
The following 3 MODULES are entered in sequence as you enter the information about
pre-development conditions, expected post-development conditions (including the
development/transformation of existing land uses and the application of BMPs/LIDs).
The last MODULE contains a checklist of construction phase BMP’s and is not part of
the derivative phosphorus modeling.
The landuse options are contained in a drop-down list reference table along with
phosphorus export coefficients for all land uses except Cropland and Urban Lands,
which are calculated based on site characteristics. With this release version, these
values may NOT be adjusted by the user. These values are not watershed dependent
and are considered valid for all areas off the Canadian Shield.
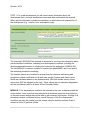
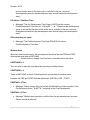
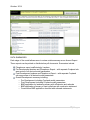
MODULE 1: Pre-development conditions are entered by the user as displayed with the
screen below. Users must first have selected a development using the drop-down box
on the main screen before they will be able to gain access to this screen. A listing of all
phosphorus export coefficients and an overall summary of the Pre-development
conditions can also be viewed from this screen using the buttons provided. Data is
entered in three (3) parts as follows:
3|Page
October 2014
Part 1 – Enter the Natural Heritage Landuses – as selected from the drop-down
list. Enter the area of each land use and the corresponding phosphorus export
coefficient (P coeff) will automatically populate and be used to derive the
phosphorus load.
Part 2 – Enter the total annual precipitation and the fraction that produces runoff
in the boxes provided above the Part 2 data form (“Part 2 Urban Land Use” as
shown below). Enter the Urban Landuses – as selected from the drop-down list
along with both the total area and the portion that is impervious. The phosphorus
export coefficient and load will be derived automatically.
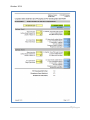
Part 3 - Click on the button beside the Part 3 label (“Part 3: Cropland Landuse”)
to open the Cropland Landuse screen. Enter the values shaded in yellow. Values
in green will be entered as either constants or filled in automatically from
reference lookup tables in the database using the values you enter. Fields
shaded in blue are derived by the database using the formulae described in the
Guidance Manual. After users enter the necessary input values and press the tab
to advance to the notes field, the phosphorus load in kg/year is derived
automatically. For Cropland, areas must be divided into blocks with similar slope
and slope length and phosphorus export calculated separately for each block.
There is no limit to the number of blocks for Cropland. The total area of the
4|Page
October 2014
development site is also derived automatically along with a total P load. A
summary of the pre-development conditions can be viewed using the button
provided.
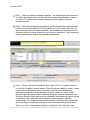
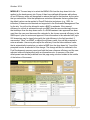
MODULE 2: Post-development conditions can be added only after pre-development
conditions have been entered (a blank screen will display if this is not the case). You
must also have selected a development using the drop-down box on the main screen to
display the information screen for post-development conditions. The screen illustration
following shows the development and pre- and post-development areas (along with any
wetland area) at the top of the screen. This upper information may not be adjusted and
displays and updates automatically.
Select the land use and enter the required input data as done for Module 1 using the
lower part of the screen. Area values can be entered to hundredths. If the area of
wetland is altered from the Pre-Development scenario, a warning flag will be posted on
the screen and in the report, as a reminder that wetland areas should be protected in
the course of development and a recognition that changes may occur if approved. The
default phosphorus export coefficient is automatically entered from the lookup table or
based on calculations for Cropland and Urban Land Uses, and may not be adjusted.
The Cropland Landuse screen is identical to that of Module 1. Enter the cropland
landuse in blocks as provided earlier.
5|Page
October 2014
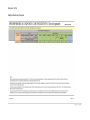
There are several checks against both wetland land use and comparisons against pre
and post development site areas on this screen. As users enter the areas in each of the
three land use categories, they can, at any time, use the “REFRESH” button at the top
of the screen to appraise them of the results of these comparisons. The code is listed
on the following page, with comments about the impact of these results. The procedural
code is also executed when users push the “Return to Main Screen” button. In some
cases, users will be unable to leave the screen and proceed to the next step until the
pre- and post-areal totals match. The procedural logic and code is as follows:
Total Development Area
Open two record-sets within the code as follows
o open a record-set for the development the user has open with the total
PRE and POST development areas over all of the three land use
categories
o derive the difference between the PRE and POST development areas
If PreArea > PostArea Then
Message "The Pre-Development Total Area is GREATER than the current PostDevelopment Total Area by " & AreaDiff & ". Please review development areas to
6|Page
October 2014
ensure that the area of the entire site is included in the pre- and postdevelopment scenarios (pre-development area should equal post-development
area).”
If PreArea < PostArea Then
Message "The Pre-Development Total Area is LESS than the current
PostDevelopment Total Area by " & AreaDiff * -1 & ". Please review development
areas to ensure that the area of the entire site is included in the pre- and postdevelopment scenarios (pre-development area should equal post-development
area)."
Otherwise they are equal
Message "The PreDevelopment Total Area EQUALS the current
PostDevelopment Total Area."
Wetland Area
Open two other record-sets for the development that show the total PRE and POST
development area that is WETLAND
o If there is none, display it as 0 hectares, otherwise return the value
If WETLAND = 0
Then no need to warn the user about encroaching on wetland areas
If WETLAND > 0
There is WETLAND so check if development is encroaching on wetland areas
Evaluate the PRE and POST Wetland differences (WETdiff = PRE – POST)
If WETdiff > 0 Then
Message "Please ensure that you include the Wetland Land Use specified in the
Pre-Developed Area (" & WET & " hectares) in the Post-Development”
If WETdiff < 0 Then
Message "Wetland area has been modified from the pre-development scenario.
Please provide a rationale"
.
7|Page
October 2014
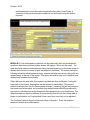
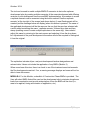
MODULE 3: The next step is to select the BMPs/LIDs from the drop-down list to be
applied on the development site. Some of them have defined efficiencies while others
do not. Efficiency values will be applied to reduce the load for that landuse by the value
that you select/enter. Note that phosphorus reduction efficiencies that are greater than
the default values can be applied to Runoff Reduction techniques (e.g. 100% for
infiltration) if these are documented and supported in the Stormwater Management Plan
for the site. You will not be allowed to enter a BMP for wetlands. If the removal
efficiency for a block is achieved through one BMP then the user would simply choose
that technique from the drop down menu. If a SWM treatment train approach has been
used then the user must document the rationale for the chosen removal efficiency in the
SWM report / plan for review and approval. Enter information to the rationale field (up to
255 characters may be typed) along with the total efficiency in the field provided. If
users select “Other” as a BMP, or adjust the efficiency value, they will be prompted to
enter a rationale. Users may also adjust the efficiency from the base reference value
that is automatically inserted as you select a BMP from the drop-down list. You will be
prompted to enter a rationale for this change. The change will also be reflected in the
Post Development summary report and both the base reference efficiency and the user
adjusted value will display along with an information note. A summary of the total
development can also be produced from this page using a button located at the middle
of the bottom of the screen.
8|Page
October 2014
The tool can be used to model multiple BMP/LID scenarios to derive the optimum
development plan by creating multiple scenarios of the same development with differing
versions of post-development land use and BMP implementation. A procedure to create
a replicate scenario can be executed using the button marked ‘Create a replicate
scenario’ at the top right of the screen (and shown below). A new Development will be
created (and the message below will display) when this button is pressed. The name of
the replicated development will be the same as the one that the user has selected with
a suffix added containing the name ‘-replicate scenario’ followed by a data and time
stamp (enabling users to create multiple replicates on the same day). Users should
adjust this name by returning to the main screen and selecting it from the drop-down
list. Adjustments to the post-development information will also be required to distinguish
it from the original.
The replication includes all pre- and post-development landuse designations and
relevant data. It does not include the application of any BMPs (Module 3).
When users leave this view, there is a check to see if the treatment area total exceeds
the Pre-development area total. If so, a warning message displays and users will not be
able to leave this screen.
MODULE 4: For this Module, a checklist of Construction Phase BMPs is provided. The
User will select BMPs that will be used on the development site to minimize phosphorus
loads from construction and provide a description of how the BMPs will be used (i.e.,
area to be applied, timing and duration of application, etc.).
9|Page
October 2014
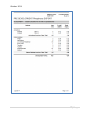
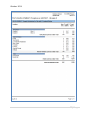
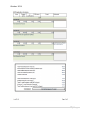
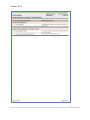
DATA SUMMARIES:
Each stage of the model allows users to review a data summary as an Access Report.
These reports can be printed or distributed as pdf documents. Summaries include:
Phosphorus export coefficients by Landuse
Pre-Development landuse and Phosphorus Export – with separate Cropland subarea review of all derived model parameters
Post-Development landuse and Phosphorus Export – with separate Cropland
sub-area review of all derived model parameters
Overall Development summary including:
o Pre-Development including Cropland model parameters
o Post-Development including Cropland model parameters
o BMP application by landuse summary with efficiencies and rationale
o BMP application summary of load reductions with conclusion statement
o Construction BMP application checklist with rationale statements
10 | P a g e
October 2014
Sample Summary Reports
11 | P a g e
October 2014
12 | P a g e
October 2014
13 | P a g e
October 2014
14 | P a g e
October 2014
15 | P a g e
October 2014
16 | P a g e