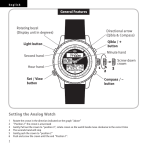
1
Panasis User Manual Index 1. Help ................................................................................................................................................................................................... 8 2. System Specification .................................................................................................................................................................. 9 3. File Menu ..................................................................................................................................................................................... 10 3.1. New Image(Ctrl+N) .......................................................................................................................................... 10 3.2. Open (Ctrl+O) ................................................................................................................................................... 11 3.3. Close (Ctrl+F4) .................................................................................................................................................. 12 3.4. Save (Ctrl+S) ...................................................................................................................................................... 13 3.5. Save As .................................................................................................................................................................. 14 3.6. Crop ........................................................................................................................................................................ 15 3.7. Environmental Option .................................................................................................................................. 16 3.7.1. General .................................................................................................................................................... 17 3.7.2. Camera..................................................................................................................................................... 18 3.7.3. Shortcut .................................................................................................................................................. 19 3.7.4. Layout ...................................................................................................................................................... 20 3.7.5. HUVITZ Upright Microscope(Option) .................................................................................... 21 3.7.6. Measurement ....................................................................................................................................... 25 3.7.7. Management Service ....................................................................................................................... 26 3.8. Exit (Alt+F4) ....................................................................................................................................................... 27 4. Edit Menu ................................................................................................................................................................................... 28 4.1. Undo (Ctrl+Z) .................................................................................................................................................... 28 4.2. Redo (Ctrl+Y) ..................................................................................................................................................... 29 4.3. Copy (Ctrl+C) ..................................................................................................................................................... 30 4.4. Cut (Ctrl+X) ........................................................................................................................................................ 30 4.5. Paste (Ctrl+V) .................................................................................................................................................... 31 4.6. Delete (Del) ......................................................................................................................................................... 31 4.7. Select All (Ctrl+A) ........................................................................................................................................... 32 4.8. Select mode (F1) .............................................................................................................................................. 32 4.9. Pan Mode (F2) .................................................................................................................................................. 33 4.10. ROI Mode (F3) .............................................................................................................................................. 33 5. View Menu ................................................................................................................................................................................. 34 5.1. Zoom in ................................................................................................................................................................ 35 5.2. Zoom out ............................................................................................................................................................. 36 5.3. Normal View(1:1) (F7) .................................................................................................................................. 37 5.4. Auto Zoom (F8) ................................................................................................................................................ 38 5.5. Gallery .................................................................................................................................................................... 38 5.6. Histogram ............................................................................................................................................................ 40 5.7. Navigator ............................................................................................................................................................. 42 5.8. Tab ........................................................................................................................................................................... 44 5.9. Surface Viewer .................................................................................................................................................. 45 5.9.1. 3D Open.................................................................................................................................................. 46 5.9.2. 2D Open .................................................................................................................................................. 48 5.9.3. 3D Save ................................................................................................................................................... 50 5.9.4. 2D Capture ............................................................................................................................................ 51 5.9.5. Option ...................................................................................................................................................... 52 5.10. 3D Measurement(option)....................................................................................................................... 54 5.10.1. 3D File ...................................................................................................................................................... 55 5.10.2. 3D Measurement ............................................................................................................................... 63 5.10.3. Image Option ....................................................................................................................................... 84 5.10.4. Toolbar .................................................................................................................................................... 86 6. Acquire Menu ........................................................................................................................................................................... 87 6.1. Camera Properties .......................................................................................................................................... 88 6.1.1. Camera Setting ................................................................................................................................... 91 6.2. Preview (F5) ........................................................................................................................................................ 96 6.3. Snap (Space) ...................................................................................................................................................... 97 6.4. HDR Capture ...................................................................................................................................................... 97 6.5. Time Lapse .......................................................................................................................................................... 99 6.6. Record video ...................................................................................................................................................... 99 6.7. Overlay ................................................................................................................................................................ 101 6.8. Focus Indicator ............................................................................................................................................... 106 6.9. Live multi-focus.............................................................................................................................................. 108 6.10. Live Tiling ...................................................................................................................................................... 111 6.11. Select TWAIN device .............................................................................................................................. 115 6.12. Import TWAIN image ............................................................................................................................. 115 7. Image Menu ............................................................................................................................................................................. 117 7.1. Resize ................................................................................................................................................................... 117 7.2. Rotate................................................................................................................................................................... 118 7.3. Grayscale ............................................................................................................................................................ 119 7.4. Flatten .................................................................................................................................................................. 120 8. Process Menu ........................................................................................................................................................................... 121 8.1. Filter ...................................................................................................................................................................... 121 8.2. Brightness/Contrast ..................................................................................................................................... 124 8.3. Hue/Saturation ............................................................................................................................................... 126 8.4. Histogram Equalization.............................................................................................................................. 127 8.5. Split ....................................................................................................................................................................... 127 8.6. Merge ................................................................................................................................................................... 129 8.7. Manual multi-focus ...................................................................................................................................... 132 8.8. Manual Tiling ................................................................................................................................................... 137 9. Measurement Menu .............................................................................................................................................................. 141 9.1. Calibration ......................................................................................................................................................... 141 9.1.1. New Calibration................................................................................................................................ 142 9.1.2. Add to calibration list ................................................................................................................... 145 9.1.3. Apply calibration ............................................................................................................................. 145 9.2. Basic Measurement ...................................................................................................................................... 146 9.3. Combination measurement ..................................................................................................................... 158 9.4. Live Measurement (F6) .............................................................................................................................. 165 9.5. Measure result ................................................................................................................................................ 166 9.6. Data Collector.................................................................................................................................................. 168 9.6.1. Data Collector Settings ................................................................................................................ 169 9.7. Line Profile ........................................................................................................................................................ 170 9.8. Scale bar ............................................................................................................................................................. 173 10. Annotation menu ................................................................................................................................................................... 175 10.1. Annotation tools ....................................................................................................................................... 175 10.1.1. Annotation properties .................................................................................................................. 176 11. Microscope(Option) ............................................................................................................................................................... 179 11.1. Device control(Option) .......................................................................................................................... 179 11.2. Z-Axis Motor Control (Option) ......................................................................................................... 182 11.2.1. Z Controller ......................................................................................................................................... 183 11.2.2. EDF ........................................................................................................................................................... 185 11.2.3. AF ............................................................................................................................................................. 187 11.2.4. AH ............................................................................................................................................................ 189 12. Report menu............................................................................................................................................................................. 192 12.1. Export to Excel ........................................................................................................................................... 192 12.2. Export csv data .......................................................................................................................................... 195 13. Window Menu ........................................................................................................................................................................ 196 13.1. Cascade(F9) .................................................................................................................................................. 196 13.2. Tile Horizontally(F10) ............................................................................................................................. 197 13.3. Tile Vertically(F11) .................................................................................................................................... 198 13.4. Close All (Shift+F4) .................................................................................................................................. 199 14. About Menu .............................................................................................................................................................................. 201 14.1. About ............................................................................................................................................................... 201 15. Toolbar 202 15.1. File Toolbar .................................................................................................................................................. 202 15.2. Edit Toolbar ................................................................................................................................................. 202 15.3. Mouse Mode Toolbar ............................................................................................................................. 203 15.4. Zoom Toolbar ............................................................................................................................................. 204 15.5. Acquire Toolbar ......................................................................................................................................... 204 15.6. Calibration Toolbar .................................................................................................................................. 205 15.7. View Toolbar ................................................................................................................................................ 206 1. Help This help manual explains the overall functions of Panasis. Each items are arranged according to Graphic User Interface(GUI), the order of menu or tool bar. Panasis could be distributed as different versions and different Plug-In modules. Therefore, the help manual could explain the functions your software does not have. Vice versa, the module you purchased could not be explained in this manual. In that case, please refer to the manual served with the module. 2. System Specification The system specifications for running Panasis is the following. IBM PC Compatible Minimum Pentium 4 - 2G Hz 512MB or more RAM Pentium 4 Dual core Recommended 1GB or more RAM NVIDIA GeForce8400 OS Microsoft Windows ( 2000, XP, Vista, 7 ) 3. File Menu ■ New Image (Ctrl+N) ■ Open (Ctrl+O) ■ Close (Ctrl+F4) ■ Save (Ctrl+S) ■ Save as ■ Crop ■ Environmental Option ■ Exit (Alt+F4) 3.1. New Image(Ctrl+N) "New Image" generates a new empty image window. The default file format is set to Bitmap . Before generating a window, it is possible to fix the size and color model of the image. The size of the image is set to 640x480, but the size of the image is set to the size of ROI when executing "New" function after copying an image holding ROI. Color model : select the color model of the image width : set the width of the image height : set the height of the image : This button generates a new image as setted : This button cancels "New Image". 3.2. Open (Ctrl+O) "Open" loads image files from data storages. The default path of "Open" is \\MyDocument\Huvits Panasis\Images. Panasis can read the following types of images. TIF, BMP, PNG, JPG Note : Panasis memorizes the last used directory. 3.3. Close (Ctrl+F4) "Close" closes the activated window. When needed to save the image, it appears the dialog asking whether you save the image or not . : This button saves the image : This button does not save the image : This button cancels "Close" Note : To close all the windows, press Shift+F4. 3.4. Save (Ctrl+S) "Save" saves the activated image. when "saving", the current file format is conserved. For the case of the images not carrying file formats such as captured images, this function acts like "Save as" Note : Scale bar, Measuring objects or Annotation objects are saved for the TIF images. Otherwise they are not saved. 3.5. Save As "Save As" saves the activated image with the name changed. It is possible to select the file format to save from the save dialog. Panasis can save the following file formats TIF, BMP, PNG, JPG Note : Scale bar, Measuring objects or Annotation objects are saved for the TIF images. Otherwise they are not saved. 3.6. Crop "Crop" saves the selected ROI and generates a new window with the ROI image. If ROI is not created, the function is deactivated. Panasis supports the following file formats. TIF, BMP, PNG, JPG Note : Scale bar, Measuring objects or Annotation objects are saved for the TIF images. Otherwise they are not saved 3.7. Environmental Option "Environmental Option" sets the configurations of Panasis. If you run the [File][Environmental Option], the following password dialog appears. The initial password is set to 0000. You could change the password in [Environmental Option] Management Service . 3.7.1. General "General" creates the general configuration of Panasis. 3.7.2. Camera You can register cameras from a camera list. Unregistered camera does not appear in [Acquire][Camera Properties]. 3.7.3. Shortcut "Shortcut" shows the shortcut menu of Panasis. You can change the listed shortcut keys from ver. 2.0 3.7.4. Layout "Layout" manages the layout of Panasis. Fixed Layout : If this button is checked, Panasis fixes the layout to prevent layout change. Toolbar text: If this button is checked, Panasis shows texts in a toolbar menu. Load layout : If this button is checked, Panasis loads a saved screen layout from files. Save layout : If this button is checked, Panasis save the current layout to a file. Default layout : If this button is checked, Panasis changes the screen layout into the default layout. 3.7.5. HUVITZ Upright Microscope(Option) In "HUVITZ Upright Microscope", a user could initialize COM port to control a Huvitz upright microscope and registrate objective lens and a calibration set to apply AMS(Auto Magnification Sensor) [1] COM Port Initialization To control a Huvitz upright microscope, the microscope must be connected to pc by COM port. 1. Combine an RS232 cable and USB converter which are involved in Panasis PKG. 2. Connect the RS232 cable to an RS232 port backside of the microscope and USB converter to user's pc. In case of 3D Profiler, connect RS232 cable to the RS232 port backside of a 3D Profiler control box. 3. open File-Environemntal Option-HUVITZ Upright Microscope page. 4. In , select available port. If there is no problem to the step 3, the number of available ports should be upto two . Otherwise, please check the cable connections . If there is no problem in the cable connection, please install usb converter driver in the CD involved in the usb converter package. 5. Intialize COM Port by pushing button. If COM Port is initialized, the following dialog window appears. If not, the following dialog windows appear. If COM port could not be initialized when there is no problem to the step 4, please check the power switch of the microscope. If power switch is OK but COM Port is still not initialized, turn off the microscope and 3D profiler control box and shut down user's pc. Then, turn on the microscope and 3D Profiler control box. Restart Panasis. Try COM Port initialization several times. 6. If is checked, Panasis initialize COM Port automatically whenever Panasis starts. [2] Registration of objective lens and calibration set. decides the order of objective lenses in Device Control . To register ojbective lenses, push or buttons. Then the the following dialog window appears. After selecting the magnification of an objective lens, push the "Select" button. If there is no lens in the above list, please push "New" button to add a new lens to the list. Input the magnification of the lens and Push the "Append" button. Register a Calibration set for applying to AMS When no calibration datum is registered, button(calibration button) appears. When a calibration datum is registered, the calibration datum name appears as button(calibration button). To generate new calibration data or edit the data, push a calibration button. To create a new calibration datum, push button. Note : This function is provided in Panasis Upright and Panasis 3D Profiler. 3.7.6. Measurement You can change the measurement configurations. Display option : option for displaying labels and measurement data of measurement objects. Label and value both : shows labels and measurement values all. Label only : shows labels only. Value only : shows values only. None : does not show labels neither values. Decimal places : decides to what decimal places to show. Note : decimal places determined in measurement configuration 3.7.7. Management Service You can change crash error reporting set up and password. Crash error report : This box sets up whether you will automatically report the error to developers when Panasis ended abnormally before. Change password : This box changes the password for Environmental option and backup. Initial password is 0000. 3.8. Exit (Alt+F4) "Exit" quits Panasis. If there are unsaved images, Panasis asks whether you will save the images or not. 4. Edit Menu ■ Redo (Ctrl+Y) ■ Copy (Ctrl+C) ■ Cut (Ctrl+X) ■ Paste (Ctrl+V) ■ Delete (Del) ■ Select All (Ctrl+A) ■ Select Mode(F1) ■ Pan Mode(F2) ■ ROI Mode(F3) 4.1. Undo (Ctrl+Z) This function restores an activated image to the image before the last executed function was applied. The functions which Undo could be applied to are the followings : Addition/Edition/Delete of measuring objects and annotation objects ROI Copy/Cut/Paste/Delete of measuring objects, annotation objects, and images Image processing, image rotation Note : Multiple Undo applications are allowed. 4.2. Redo (Ctrl+Y) To the activated image, this command does an action which undo was last applied to. The functions which Redo could be applied to are the followings : Addition/Edition/Delete of measuring objects and annotation objects ROI Copy/Cut/Paste/Delete of measuring objects, annotation objects, and images Image processing, image rotation Note : Multiple Redo applications are allowed. 4.3. Copy (Ctrl+C) This function copies image data or selected measurement objects and annotation objects of the activated image. When mouse mode is Select mode, "Copy" copies selected measurement objects and annotation objects to Clip board. When mouse mode is ROI mode, "Copy" copies the image data in ROI to Clip board. The data copied to Clip board could be attached to an image by Paste function. Note : Only for the image data(not measurement objects and annotation objects), it is possible to copy the data to Window programs. 4.4. Cut (Ctrl+X) This function cuts image data or selected measurement objects and annotation objects from the activated image. When mouse mode is Select mode, "Cut" copies selected measurement objects and annotation objects to Clip board and delete them. When mouse mode is ROI mode, "Cut" copies image data of ROI to Clip board and delete them. The data copied to Clip board could be attached to an image by Paste function. Note : Only for the image data(not measurement objects and annotation objects), it is possible to copy the data to Window programs. 4.5. Paste (Ctrl+V) This function attaches the data in Clip board brought by Copy and Cut to the activated window. Since the data still remains after pasting, it is possible to paste the same data several times. Note : It is possible to paste the data in the Window Clip board brought by Windows system to images. 4.6. Delete (Del) This function deletes the selected measurement objects and annotation objects in the activaed window. 4.7. Select All (Ctrl+A) This function selects the selected measurement objects, annotation objects, and scale bar or image data in the activated window. When mouse mode is Select mode, "Select All" makes all measurement objects and annotation objects selected state. When mouse mode is ROI mode, "Select All" sets the ROI region to the whole image. 4.8. Select mode (F1) "Select Mode" is the default mouse mode. In this mode, mouse could select measurement objects and annotation objects. Click, Ctrl + Click, Dragging(the last two are used for multi-selection) are used to select objects. Their operations are same as they are in Windows system. 4.9. Pan Mode (F2) In this mode, mouse dragging(panning) moves the view region of the activated image. Panning works when the activated image is larger than the window size. 4.10. ROI Mode (F3) In this mode, user could set the Region Of Interest(ROI) by mouse dragging. If ROI is set, the image processing works on the area. 5. View Menu ■ Zoom in ■ Zoom out ■ Normal View(1:1) (F7) ■ Auto zoom (F8) ■ Gallery ■ Histogram ■ Navigator ■ Tab ■ Surface Viewer 5.1. Zoom in User could zoom in the activated image step by step with this function. Maximal magnification is 2500%. Mouse wheel up also zooms in the image by one step. If the zoomed image is larger than the image window, vertical and horizontal scroll bar are automatically created. 5.2. Zoom out User could zoom out the activated image step by step with this function. Minimal magnification is 1%. Mouse wheel down also zooms out the image by one step. 5.3. Normal View(1:1) (F7) This function returns the activated image to the image of its original size. 5.4. Auto Zoom (F8) This function fits the size of the activated image to that of the image window. 5.5. Gallery Gallery shows the opened images as thumbnail images. User could activate an image in Gallery by clicking the image. If mouse right button is clicked, it shows up the pop up menu where user could change the name of the image and save the image or close the window. If mouse left button is clicked once more while the image is already selected, user could change the name of the image as in Windows. However, this operation does not change file formats and filename extension. Gallery image Changing a name in the Gallery Note : It is possible the image multi-selection in Gallery by clicking images while pushing the Shift key or the Ctrl key. Also, it is possible to save or close the multi-selected images. Since the Gallery window is DockingPane, the window could be attached anywhere. When the window is overlapped to other DockingPane, each DockingPane is distinguished by Tab. 5.6. Histogram Histogram window shows the RGB, Intensity and HSV histogram of the activated image. RGBI : This check box turns on/off R, G, B and I histograms. R : This check box turns on/off R histogram. G : This check box turns on/off G histogram. B : This check box turns on/off B histogram I : This check box turns on/off I histogram H : This check box turns on/off H,S, and V histograms H : This check box turns on/off H histogram S : This check box turns on/off S histogram V : This check box turns on/off V histogram Exclude saturated points : This check box turns on/off the exclusion option which decides whether Panasis discards the data whose intensities are bigger than 255 or not. Use ROI : This check box turns on/off the ROI option which decides whether Panasis applies histogram to ROI region or to the whole image region. Save Data : This button saves the data as a csv file. Save image : This button saves the image of the histogram as a bmp file. Note : Intensity = 03R + 0.59G + 0.11B Note : Histogram is useful to control White Balance(WB). If the image of a white paper sample is correctly white balanced, the histogram curves of R, G, B are almost same. Note : Since the Histogram window is DockingPane, the window could be attached anywhere. When the window is overlapped to other DockingPane, each DockingPane is distinguished by Tab. 5.7. Navigator Navigator shows the thumbnail image of the activated image and the view region displayed now as a red rectangle. With the white rectangle in the bottom right corner of the red rectangle, it is possible to zoom in or zoom out the image. Also, it is possible to change the view region by dragging the red rectangle. Note : Since the Navigator window is DockingPane, the window could be attached anywhere. When the window is overlapped to other DockingPane, each DockingPane is distinguished by Tab. 5.8. Tab "Tab" shows the names of opened images as tabs. If a tab is selected, the corresponding image is activated. If mouse right button is clicked on a tab, the save/close menu would appear. 5.9. Surface Viewer This command shows a 3 dimensional image and saves it loaded from 2 dimensional images or a 3 dimensional image. 3D Open 2D Open 3D Save 2D Capture Option 5.9.1. 3D Open This command loads a 3 dimensional image which has a Panasis own file extension, p3d. These images does not need to set the height/width/height information which are needed when Panasis opens them as 2D Open needs . Note : 3D files are generated by 3D Save. 5.9.2. 2D Open This function shows a 3D image from 2D images. Load Height map : This button loads an image as a height information. Panasis recognizes the gray scaled image as a height information. Height map could be generated by checking the topographic map check box in Manualmultifocus. Load Color map : This button selects a image as a texture image. Max.Min/Height : User inputs the maximum height and the minimum height in the image. Start X pos./X Range : User inputs the minimum x-position of the image and the x-range of the image. Start Y pos./Y Range : User inputs the minimum y-position of the image and the y-range of the image. Scale unit : User selects the scale unit used in the image. Smooth : This button decides how to generate 3D image. If this button is checked, the quality of 3D image is enhanced but it takes long. Open : This button creates 3D image as set above. Cancel : This button cancels Surface Viewer. 5.9.3. 3D Save This command saves the current 3D image as Panasis' own 3D file format(.p3d). 5.9.4. 2D Capture This command captures the image shown in the Surface Viewer window as a 2D image. 5.9.5. Option Surface Viewer provides several options to help sample investigation. 2D pseudocolor contour : Panasis paints the 3D image with specified colors which are defined differently according to the height. Use Light : Panasis gives lighting effect to generate shadows of the 3D image. The shadows are useful to surface analysis of the sample. Pitch : This bar controls the latitude of the lighting. Yaw : This bar controls the longitude of the lighting. 5.10. 3D Measurement(option) "3D Measurement" measures heights, lengths, area, volume and et al on a 3D image synthesized by EDF . This function is provided in Panasis 3D Profiler. If "3D Measurement" is run, Panasis view changes into the following. 5.10.1. 3D File 3D File involves file open, image save, data save functions. 5.10.1.1. Load File "Load File" opens a 3D image file of .h3d extenstion. When more than five images are opened, the warning message appears. Then, please close files by "Close File " . Note : The image generated by EDF is automatically added to the opened file list. 5.10.1.2. Save File "Save File" saves an image as a 3D image file of .h3d extension. The profile lines, measuring tools on the image are saved together. 5.10.1.3. Close File Close a image file which is displayed now. 5.10.1.4. Capture 2D Image "Capture 2D Image" saves the 2D view of the activatd image. Profile tools are flattend to the saved image. 2D captured image of a sample applied by Volume/Surface by Profile. 5.10.1.5. Capture 3D Image "Capture 3D Image" saves the 3D view of the activated image as a 2D image file. 3D captured image of a sample applied by Volume/Surface by Profile. 5.10.1.6. Capture Profile Image "Capture Profile Image" saves the image on the profile window. 5.10.1.7. Save Measured Data[csv] "Save Measured Data[csv]" saves the measured data and statistics of the activated Measure Theme in the activated image as a csv file. 5.10.1.8. Save Collected Data[csv] "Save Measured Data[csv]" saves the data and statistics in the Collected Data window as a csv file. 5.10.1.9. Load from 2D Files "Load from 2D Files" opens a 3D image by opening 2D height map image and 2D texture image. Open a 2D image file for a height map. . Open a 2D image file for a texture image. Note : Even though the size of a heigt map image and that of a texture image are different, a 3D image could be generated. 5.10.1.10. Reset Layout "Reset Layout" makes the screen layout back to the initial state. 5.10.2. 3D Measurement Panasis provides the follwoing measurement themes . 1. Profile Measurement 2. Height Measurement 3. Volume/Surfcae Measurement 5.10.2.1. Profile Measurement "Profile Measurement" measures lengths, areas, angles and curvatures on a profile graph, a curved line that describes the surface of a sample. 1. Profile Measurement 2. Profile Option 5.10.2.1.1. Profile Measurement When a user draws a featue on an image using profile tools, a profile line, the cross section line cut by the feature appears in the profile window. "Profile measurement" measures lengths, areas, angles, curvatures and auto widthes on the profile line. 1. Select "Profile Measurement" on Measurement Theme. 2. Select a profile tool and draw a feature to create a profile line. Profile tool Horizontal line Vertical line Line Description Place a horizontal line on a specified position to get a profile line Place a vertical line on a specified position to get a profile line Click two points to generate a line for a profile line. Whenever a profile tool button is pushed, Panasis generates a new feature corresponding to the button. When delete button is pushed, activated objects including profile lines and measurement tools are deleted. The activated profile lines are red colored. The other profile lines are blue. Only activated profile lines are displayed in the profile window. Multiple object selection is possilbe. (select objects holding a control key pressed) 3. Select a measurement tool in the measurement tool box and measure a profile. Measurement tool Description This measures width, height, length and angle between x-axis. Length (2 vertical), (1 Vertical) : The intersections between a profile line and a measurement line are used as measurement points. (2 vertical 2 horizontal ), (line) : Measurements are excuted regardless of a profile line. This measures an area of the region defined by the relations between a profile line and the user define rectangle . Area (# peak) : This measures the area defined by the intersection between a profile line and a rectangle drawn by a user. (# valley) : This measures the area of the region which is inside of a rectangle drawn by a user and outside of a profile line. This measures an angle between intersection points of measurement lines and a profile line. Angle (3 point angle) : This measures an angle between three intersection points of measurement lines and a profile line. Curvature This measures a curvature of the profile line using three intersection points of measurement lines and a profile line. This measures the width between two intersection points of a horizontal threshold line and a profile line. Auto Width 1. Set the threshold by dragging the horizontal threshold line. 2. Measure the width using vertical measurement lines. Panasis automatically finds out the nearest intersection point of the threshold line and the profile line from the point where left button was clicked. * When there seems to be only one measurement line, that means two line are overlaped. Drag and set the measurement line to seperate the lines. * Even after measurement lines are both generated, user could change the threshold. Please push right button to exit the measurement tool mode. The measured results are listed on the Data window. < Profile measurement - length(2 vertical) > < Profile measurement - area(# peak) > 5.10.2.1.2. Profile option User could set the configurations of axis interval and range in "Profile option". Max Y : this sets the maximum Y(height) value of the profile graph to show. Min Y : this sets the minimum Y(height) value of the profile graph to show. Interval of Y : this sets the Y(height) axis interval on the profile graph. Auto : Panasis automatically sets the Y axis interval. 1:1 :this sets the ratio of X axis to Y axis to 1:1. : this button resets the configurations of axises back to the default setting. : this button applies the configurations to the profile graph. : this button closes the "Axis Config" dialog without applying the configurations. Note : In the default setting, the maximum value of a profile line is same as the Max Y and the minimum value of a profile line is same as the Min Y. 5.10.2.2. Height Measurement "Height measurement" measures the height differences between specified two points or several points. Panasis provides the following three measurement themes for height measurement. 1. Height Measurement(image) 2. Height Measurement(Profile) 3. Height Measurement(Histogram) 5.10.2.2.1. Height Measurement (Image) Height Measurement(Image) measures the height difference between points which are specified on an image. 1. Select Height Measurement(Image) from Measurement theme. 2. Select an option in the compare option. Compare Option Description 2 Points The height difference between two specified points is measured. Reference A reference point is specified first. The height differences between the point and newly added points are measured. 3. Select the method to specify points on an image in the measurement tool. Measurement Tool Description The clicked point on the image Point defines the input point. The center point of a rectangle Rectangle created by a user defines the input point. 4. Specify the points to measure height differences. Height Difference works in 2D View . The points used in the measurement are linked by lines. The result data is displayed in the Data window . The reference point does not have a height data. Please push right button to end a measurement. 5.10.2.2.2. Height by Profile "Height by Profile" measures heights on the profile line. 1. Select Height by Profile from Measurement Theme. 2. Choose an option among the Compare option. Compare Option Description 2 Points The height difference between two specified points is measured. A reference point is specified Reference first. The height differences between the point and newly added points are measured. 3. Push buttons to specify measurement position. A measurement ends when right button is clicked. The result data is listed on the Data window . The reference point does not have the height data. The reference line is green. The selected measurement line is red. When a reference line is chosen, the other measurement lines using the referenece line are green. 5.10.2.2.3. Height by Histogram "Height by Histogram" creates a height histogram on specified region and measures height differences on the histogram. 1. Select "Height by Histogram" from Measurement Theme. 2. Select the method to specify a region to create a histogram. 3. Specify a region to create a histogram. (Only whole image is possible for the region specifying, now ) 4. Choose an option among the Compare option. Compare option Description The height difference between 2 Points two specified points is measured . A reference point is specified Reference first. The height differences between the point and newly added points are measured. 5. Push buttons to specify measurement position. A measurement ends when right button is clicked. The result data is listed on the Data window . The reference point does not have the height data. The reference line is green. The selected measurement line is red. When a reference line is chosen, the other measurement lines using the referenece line are green. 5.10.2.3. Volume/Surface Measurement This measures volume and surface area of a sample. The followings are detailed themes. 1. Volume/Surface by Profile 2. Volume/Surface by Histogram 5.10.2.3.1. Volume/Surface by Profile "Volume/Surface by Profile" measures the volume and surface area of the specified region with a threshold applied on the profile line. 1. Select Volume/Surface by Profile from measurement theme. 2. Select a profile tool and specify the profile line. Profile tool Horizontal line Vertical line Line Description Place a horizontal line on a specified position to get a profile line. Place a vertical line on a specified position to get a profile line. Click two points to generate a line for a profile line. Only one profile line is allowed in Volume/Surface by Profile. 3. Choose a threshold option. Threshold option Description Only the region whose Beyond the threshold profile value is beyond the threshold is measured. Only the region whose Below the threshold profile value is below the threshold is measured. 4. Choose a measurement option. Measurement option Description The inner region of the profile line Peak satisfying threhold condition is measured. The outter region of the profile line Valley satisfying threhold condition is measured. 5. Specify the region with the region tool to measure volume and surface area . When a region tool buttion is clicked, a region could be specified. When a region is specified, the result data is listed on Data window .. Whenever a region button is clicked, a region is created. < Volume/Surface by Profile - 2D View > < Volume/Surface by Profile - 3D View > Note : In 2D view, the region satisfying threshold option and measurement both is diplayed as a texture image and the other region is displayed as a pseudo-colored image. In 3D view, when beyond threshold option is chosen, the threshold plane is bright colored. When below threshold option is chosen, the threshold plane becomes transparent. 5.10.2.3.2. Volume/Surface by Histogram "Volume/Surface by Histogram" measures volume and surface area of the specified region with a threshold applied on the histogram. 1. Select Volume/Surface by Histogram from measurement theme. 2. Specify the region with region tool to measure volume and surface area . When a region tool buttion is clicked, a region could be specified. The histogram is based on the data in the specified region. When a region is specified, the result data is listed on Data window .. Whenever a region button is clicked, a region is created. 3.Choose a threshold option. Threshold option Description Only the region whose height is Beyond threshold beyond the threshold is measured. Below threshold Only the region whose height is below the threshold is measured. Note : In 2D view, the region satisfying threshold option is diplayed as a texture image and the other region is displayed as a pseudo-colored image. In 3D view, when beyond threshold option is chosen, the threshold plane is bright colored. When below threshold option is chosen, the threshold plane becomes transparent. 5.10.2.4. Measurement Data The measured data are listed on the data table . [ Measurement ] Each sample image has own measurement tables, which consist of different tables according to the measurement themes. If an item is selected in the table, the corresponding measuring object is selected, too. Vice versa, if a measuring object is selected in an image, the corresponding data are selected, too. Push "delete" key to delete the activated objects. : This button collects seleceted data to data collector. : This button deletes all measured data. [ Statistics ] This table shows statistics of the measurement data selected now . Note : When measurement theme changes, measurement data table changes, too. 5.10.2.5. Data Collector This function collects the measured data and shows the data and the statistics of that. [ How to use Data Collector ] Select data in the Measurement data table and push "Collect" button. [ Collected Data ] : This button deletes the selected data. [ Statistics ] This table shows statistics of the collected data . Note : Data collector could get together all data regardless of measurement themes. 5.10.3. Image Option Panasis provides various image options to enhance the observation. 5.10.3.1. When 2D View button is clicked, image window converts into 2D view. 5.10.3.2. When 3D View button is clicked, image window converts into 3D view. In 3D view, zoom in and zoom out interface are same as in 2D, mouse wheel controling . Drag mouse on the image to rotate the image. 5.10.3.3. When mapping. Color button is clicked, Panasis uses an EDF image for the surface 5.10.3.4. When Mesh button is clicked, Panasis uses a wireframe image for the surface mapping. The image on the wireframe is a pseudo-color image which reflects the height information. ( The wire intervals are set to one pixel, now ) 5.10.3.5. Pseudo Control the slide bar of Pseudo to decide the blending ratio of a pseudo-color image and a color image for the surface mapping. On the right hand side of the slide bar, there shows the percentage of a pseudo color image in the texture image. 5.10.3.6. Z scale Control the slide bar of Z scale to decide the zoom ratio of Z axis with the other axises' fixed. On the right hand side of the slide bar, there shows the current zoom ratio of Z axis. 5.10.3.7. Lighting Panasis gives lighting effect to generate shadows of the 3D image. The shadows are useful to surface analysis of the sample. Push "Light" button to turn on or turn off the lighting effect. <on> <off> Picth : This bar controls the latitude of the lighting. Yaw : This bar controls the longitude of the lighting. 5.10.4. Toolbar : Select and run a 3D File function. : Select and run a measurement theme. : All image files are listed as a file name list. If a file name is chosen, then the file is activated. 6. Acquire Menu ■ Camera Properties ■ Preview (F5) ■ Snap (Space) ■ HDR Capture ■ Time Lapse ■ Record Video ■ Overlay ■ Focus Indicator ■ Live Multi-focus ■ Live Tiling ■ Select TWAIN device ■ Import TWAIN image 6.1. Camera Properties You could choose the camera from the registered camera list and the resolution of the camera. For even one camera, two items could be listed. Cameras with names including WDM are controlled by DirectShow drivers. If the camera used last is still connected, then the camera is automatically selected when Panasis starts. [How to select a camera] 1. If [Camera Properties] from [Acquire] is run, the following device property window shows up. device : This box selects the camera from the list of cameras which are accessible now. Format : This box selects the resolution from the resolution list of the selected device FPS : This button selects frames per second for the corresponding format from the FPS list. Preview :This button opens and closes the preview window. Camera setting Open/Close : This button opens and closes the camera setting window. 2. The available cameras are listed in the device box. Please select the camera you want to use. 3. The available resolutions are listed in the resolution box. The changed resolution is immediately applied to Preview window and Live measurement window. 4. The available FPS(Frames Per Second) are listed in the FPS box. The changed FPS is immediately applied to Preview window and Live measurement window. Note : If the connectted camera is not shown in the list, please check whether the camera driver is installed properly. FPS function could not work for some cameras. 6.1.1. Camera Setting The camera configurations of white balance, exposure and so on are set. When the Advanced button is clicked, Advanced mode is turned on and all configurations supported by the camera are shown. In the case of DirectShow camera, please set the camera configurations in the Advanced mode because all items in the camera setting are in deactivated states. Open : this button opens a saved camera set up. Save : this button saves the current camera set up. Default : this button returns the current setup to the default camera set up. Advanced : this button turn on the advanced mode where all camera controls are accessible. 6.1.1.1. How to execute white balance for Panasis supporting cameras [ How to execute white balance for Panasis supporting cameras] 1. When [Camera Setting Open] is clicked in the Camera Properties window, the following camera controllers are shown. 2.put it on the focal position of camera a piece of white paper or a sample for the white balance set up. 3. Adjust shutter control or turn on auto shutter mode to make a camera image have the proper brightness. 4. Push the One Push button. Note : It is recommended to set the camera shutter mode on Auto mode when focus ratio or lighting condition changes. 6.1.1.2. How to execute white balance for DirectShow cameras [How to execute white balance for DirectShow cameras] 1. When [Camera Setting Open] is clicked in the Camera Properties window, the following camera controllers are shown. 2. Push the Advanced button. The components of advanced camera set up could differ for each camera. 3. Put it on the focal position of camera a piece of white paper or a sample for the white balance set up. 4. Adjust shutter control or turn on auto shutter mode to make a camera image have the proper brightness. 5. Push the One Push button. 6. Push the OK button. Note : It is recommended to set the camera shutter mode on Auto mode when focus ratio or lighting condition changes. 6.2. Preview (F5) "Preview" shows a live image of the camera. Preview window has the following properties Its image is not listed in the image gallery. Its image is not shown in the image navigator. Overlay, Focus Indicator, and snap are available. It has the same calibration data that Live measurement window has. 6.3. Snap (Space) "Snap" captures an image from preview window or Live measurement window and generates a new window of the image. 6.4. HDR Capture "HDR Capture" creates a new image from a bright image to a dark image of a sample to show all regions of the sample well in spite of that each region has own brightness. It could take several minutes according to the size of an image or the system specification. [ The result of HDR Capture] Note : HDR Capture is not available for some cameras. 6.5. Time Lapse "Time Lapse" snaps images from a camera with the assigned time interval. This function is available only when Preview window is activated. Total : type the total number of images to snap Start : Push Start button to starts to snap. Stop : Push Stop button to stop snapping. 6.6. Record video "Record video" records video from Preview window. It is available when Preview window is activated. Panasis uses Video Codec supported by user's PC, so the maximum recording time depends on the Codec. But, the maximum size of the video file is limited up to 2 GB. Start : This button starts a video recording. When a video recording starts, Start button changes into Restart button. Pause : This button pauses a video recording. Restart : This button restarts a video recording. Stop : This button Stops a video recording. Options : This button shows an option window which contains a time interval controller, an image encoding selector, and the play speed controller. When the Change button pushed in the option window, the Encoding selection window shows up. (The Encoding list in the window is different for user's configurations) Push the Start button. Then set the name of a file and the directory to save the file. After that, the current recording status is shown in a progress bar. If the file size goes to the maximum limit, 2GB, the recording automatically ends. Note : Panasis does not support a record player. You should run another player to see a video. 6.7. Overlay "Overlay" draws a cross hair, grids(including squares and concentric circles) and a clock on Preview window or Live measurement window. It is available when Preview window is activated. [Cross line] It draws a cross line. The crossing point is assigned by a user. Reset : This button sets the crossing point at the center of the image. [ Grid ] It draws square grid or concentric circles with the assigned interval. The grid interval and the total area of the image are shown. [ Clock ] It shows stopwatch or current time since the camera is connect to the PC. Stopwatch shows the time since the camera is connected to the PC, which is reset to zero when Panasis is newly run. Current time shows the total past time since the camera is connected to the PC. The position of the clock is determined by a user. Overlay Flatten : If this button is checked, then the overlay is flatten to the image when snapping an image. 6.8. Focus Indicator It show the focus value of the activated image, which estimate how much the image is focused. If Apply ROI button is not check, it shows the focus value of whole image region. Otherwise, it shows that of ROI. If you push the Reset button , then Max value is set to the current focus value. After that, if there comes a focus value larger than the Max value, the Max value changes into the new focus value. [ Examples of Focus Indicator ] The following three cases show the focus values for the different focus states of a same sample. [out Focused : below the focal plane(FP)] [On Focus : on the FP ] [out focused : upper the FP] Note : Focus Indicator is for the cases to investigate the focus changes for a specific region. It is not for comparing focus values of different regions of an image. 6.9. Live multi-focus "Live multi-focus" synthesizes a focus enhanced image(an image of extended depth of field) from live images whose focus regions are different from each other. It is available only when Preview window is activated. [ Start Live multi-focus ] [ During Live multi-focus ] When Live multi-focus starts, the green spot is shown on the upper right corner of Preview window. Green spot means multi-focus works well. When the spot changes red, you should move back the sample to the last position where green spot was because the red spot means Live multi-focus has a problem. If the spot is back to green, Live multi-focus works well. [ Live multi-focus stop ] If the Stop button is pushed, Panasis synthesized a multi-focus image from images collected by that time. Panasis might create a height map if "Create Height Map" box is checked. If the Cancel button is pushed, Live multi-focus process is canceled. [ The result image of Live multi-focus ] At the end of Live multi-focus process, the following two images are created in new windows. [ Multi-focus image] [Height map] When you do not change the moving direction of microscope tube, an height map image is more accurate. 6.10. Live Tiling "Live Tiling" generates a tiled image from live images of Preview window, in real time. The overlapped region of images is seamless by the Panasis image processing. Live Tiling is available when Preview window or Live measurement window is activated. [ Live Tiling Starts ] Auto Tiling : Under the following conditions are satisfied, Panasis automatically tiles an image. 1. When the small rectangle in Preview window approaches to the end of Preview window. 2. When Panasis succeeds to find the last tracked image position after the image tracking failed. 3. When the specific points of an image for image tracking moves a lot. Add : When auto tiling is unchecked, user manually tiles images pushing Add button. Undo : "Undo" undoes the last tiling process. User can continue to do undo processes. After undo is applied, auto tiling is deactivated. [ During Live Tiling] When image tracking process succeeds, the larger and smaller rectangle in Preview window is yellow colored. When image tracking process fails, the larger and smaller rectangle in Preview window is red colored. [ Success] [Failure] [Result Window] When Panasis fails to track the Live image, Panasis could restart tracking if you align Live image with the image of the rectangle region of the result window. [Preview Window] Window] [Result [ End of Live Tiling ] When Live tiling, if you push the End button, Live Tiling ends creating the result image with the images collected by that time. Note : Panasis could miss the image tracking because of the system overload. When image tiling processing(the rectangle is orange) , please do not move the sample. 6.11. Select TWAIN device It shows the TWAIN device list. Please select the TWAIN camera which you want to use. 6.12. Import TWAIN image It runs the camera control program supported by the TWAIN camera chosen in "Select TWAIN device" menu. If you execute the image acquire command in the TWAIN program, Panasis generates a new window with the image from the TWAIN program. 7. Image Menu ■ Resize ■ Rotate ■ Grayscale ■ Flatten 7.1. Resize Resize creates a new window with the dimension changed image of the selected image. This button is not activated when an image is not open. Reset : This button restores the default setting(original size). OK : This button executes the Resize. Cancel : This button cancels the Resize and closed the dialog. 1. Image size : Please input the size of image you want. Panasis provides two units, pixels and the ratio to the original size. 2. Distortion Permit : This check box decides whether the ratio of the width to the height are kept after resizing. 3. Interpolation : This combo box selects the interpolation method in the followings. nearest neighbor : nearest neighbor interpolation bilinear : bilinear interpolation area : area interpolation cubic : cubic function interpolation The lower method goes, the better the image quality is and the longer time the process takes. Note : Resize keeps the original image. 7.2. Rotate This menu provides image rotations and image flips. Vertical Flip : This button flips an image vertically. Horizontal Flip : This button flips an image horizontally. 90 degree Clockwise : This button rotate an image clockwise by 90° 90 degree Counterclockwise : This button rotate an image counterclockwise by 90° Note : Rotate does not concern ROI. After Rotate is applied, zoom magnification is set to 100%. 7.3. Grayscale This command changes the activated image into a gray scaled image. 7.4. Flatten If there are measurement objects or annotation objects in the activated image, this command creates a new window with an image flattened with the objects. The flattened objects cannot be edited no longer. 8. Process Menu ■ Filter ■ Brightness/Contrast ■ Hue/Saturation ■ Histogram Equalization ■ Split ■ Merge ■ Manual Multi-focus ■ Manual Tiling 8.1. Filter The following image processes are provided. If ROI is set, then the image processing is applied to ROI. All image process in Panasis support Undo/Redo. Filters consist of spatial filters and morphology filters. Spatial Filters Gaussian Blur : this command uses a gaussian kernel. User sets the sigma value and the size of the kernel. Median Filter : this command uses a median filter. User sets the shape and the size of the kernel. Sharpen : this command uses a sharpening filter. User sets the size of the kernel. Sobel : this command used a Sobel filter and applies it to x,y directions both. User sets the size of the kernel. Laplacian : this command used DOG filter which is similar to laplacian filter. User sets the size of the kernel. Low pass : this command is a low pass filter where only low frequency components in the spatial frequencies of an image pass. High pass : this command is a high pass filter where only high frequency components in the spatial frequencies of an image pass. Sculpt : this command uses Emboss filer. User sets the size of the filter. Morphology Filter Open : this command performs Open Morphology operation. Close : this command performs Close Morphology operation. Erode : this command performs Erode Morphology operation. Dilate : this command performs Dilate Morphology operation. Tophat : this command performs Tophat Morphology operation. Blackhat : this command performs Blackhat Morphology operation. Morphology Gradient : this command performs morphology gradient Morphology operation. Apply : this command applies the chosen operation to the activated image region. Note : Slide bar controls the zoom in/out ratio of the Pre-result image which shows the result of the chosen operation. 8.2. Brightness/Contrast The following image processes are provided. If ROI is set, then the image processing is applied to ROI. All image process in Panasis support Undo/Redo. Brightness : this command changes the average brightness value of the image from -100 to 100. Contrast : this command changes the contrast of the image from -100 to 100. Gamma : this command changes the Gamma value of the image from 0.0 to 3.0. Inversion : this command inverts the RGB values of an image . Best Fit : this command makes the bright region of the image brighter and the dark region of the image darker. Reset : this command resets Brightness/Contrast command status. + : this command zooms in the preview image in the window. - : this command zooms out the preview image in the window. Apply : this command applies the chosen commands to an image region. 8.3. Hue/Saturation The following image processes are provided. If ROI is set, then the image processing is applied to ROI. All image process in Panasis support Undo/Redo. Hue : this command changes the average Hue value of the image from -180 to 180. Saturation : this command changes the average Saturation value of the image from -100 to 100. Lightness : this command changes the average Lightness value of the image from -100 to 100. Reset : this command resets Brightness/Contrast command status. + : this command zooms in the preview image in the window. - : this command zooms out the preview image in the window. Apply : this command applies the chosen commands to an image region. 8.4. Histogram Equalization This command performs the linear histogram equalization to make the image uniformly distribute the pixel values over the dynamic range 8.5. Split This command splits a 3Channel image(24 bit) into three one channel images(8bit). Panasis provides RGB, HSV channel splits. After Split, three new windows with 8 bit images are generated. [ RGB Split ] When this option is selected, Panasis splits a image into three gray scaled images (8 bit, each are corresponding to R(red), G (green), B(blue) channel images. ) If Maintain Channel Color is checked, Panasis gives colors to the result images. This does not mean the result images have real colors. They are just shown colored. [ HSV Split ] When this option is selected, Panasis splits a image into three gray scaled images (8 bit, each are corresponding to H(hue), S (saturation), V(value) channel images. ) If Maintain Channel Color is checked, Panasis gives colors to the result images. This does not mean the result images have real colors. They are just shown colored. 8.6. Merge This command merges three one channel images(8bit) to create one thee channel image(24bit). Panasis supports RGB, HSV color models for merging. Available Images : this list shows all opened 8bit images. If there is an image in the Selected Frame, the Available Images list is filtered by the image size of the image. Selected Frame : this list shows all selected images for merging. Up to three images, the list could contain. If three images are selected, then OK button is activated. Element shows the specific channels. : Add All This button moves all images in Available Images into Selected Frame. This button is always activated. If there are three images in the Selected Frame, this button is deactivated. : Add This button moves images chosen in the Available Images into the Selected Frame. This button is activated when an image in Available Images is chosen. You could move multiple images with Ctrl key, Shift key, or mouse drag. If there are three images in the Selected Frame, this button is deactivated. : Remove This button moves images chosen in Selected Frame into Available Images. This button is activated when an image in Selected Frames chosen. You could move multiple images with Ctrl key, Shift key, or mouse drag. : Remove All : this button moves all images chosen in Selected Frame into Available Images. This button is activated when there is at least one image in Selected Frame. Topdown : if this button is shown, Panasis treats the first image in Selected Frame list as the first channel element. Bottom up : if this button is shown, Panasis treats the first image in Selected Frame list as the last channel element. : UP/DN movement This button moves the selected image up and down in the Selected Frame list. This button is activated when an image in Selected Frame is chosen. [ Image merging result ] - RGB merge [ RGB 8bit image ] [ merged image ] - HSV merge [ HSV 8bit image ] [ Merged image ] 8.7. Manual multi-focus "Manual multi-focus" synthesizes a focus enhanced image(an image of extended depth of field) from images whose focus regions are different each other. Available Images : shows all opened images. If there is an image in the Selected Frame, the Available Images list is filtered by the image size of the image. Selected Frame : shows all selected images for multi-focusing. : Add All This button moves all images in Available Images into Selected Frame. This button is always activated. : Add This button moves images chosen in the Available Images into the Selected Frame. This button is activated when an image in Available Images is chosen. You could move multiple images with Ctrl key, Shift key, or mouse drag. : Remove This button moves images chosen in Selected Frame into Available Images. This button is activated when an image in Selected Frames chosen. You could move multiple images with Ctrl key, Shift key, or mouse drag. : Remove All This button moves all images chosen in Selected Frame into Available Images. This button is activated when there is at least one image in Selected Frame. Topdown : if this button is shown, Panasis treats the first image in Selected Frame list as the first image. Bottom up : if this button is shown, Panasis treats the first image in Selected Frame list as the last image. UP/DN movement : This button moves the selected image up and down in the Selected Frame list. This button is activated when an image in Selected Frame is chosen. Start : Execute Manual Multi-focus During multi-focusing, the following progress bar shows up. If you push the cancel button ,the process will stop. There are the option list for multi-focusing. Focus analysis options : Max Local Contrast : This method considers areas with high/maximum contrast to be in focus. Pixels are analyzed in the area around the current pixel location. The pixel from the plane with the largest variance or local contrast is selected. Max Stack Contrast : The mean-value of the pixels is calculated. The pixel from the plane with the largest variance from the mean is selected. Max Intensity : This method is used for samples that are more intense than the background such as light emitting flourescent dyes. The pixel from the plane having the highest intensity at the current pixel location is selected. Min Intensity : This method is used for regions that are darker than the surrounding area to be in focus. The pixel from the plane having the lowest intensity at the current pixel location is selected. Generates topographic map : Clicking this button creates a topographic map from the focused image. Displacement correction : When this button checked, Panasis calculates the displacements between input images and compensates them. [ The result of Manual multi-focus ] [ input images ] [ the result image and the topographic map ] 8.8. Manual Tiling "Manual Tiling" manually generates a tiled image from images of Preview window or saved files. The overlapped region of images is seamless by the Panasis image processing. Also, Panasis provides the position compensation function which finds and compensates the displacement between images when moving or attaching an image. Open : This button opens images from files. The opened images are listed in the gallery. Capture : This button captures images from a camera. The captured images are not listed in the gallery. They are added into the workspace. Attach : This button attaches a newly added image into the result image. Fix position when moving : when moving a newly added image, Panasis compensates the position of the image to make the overlapped region natural. Fix position when attaching : when attaching a newly added image, Panasis compensates the position of the image to make the overlapped region natural. Undo : "Undo" can cancel the image attachment process step by step. If the last attached image is from a camera, then the image disappears. If not, the image goes back to the gallery. Gallery : The images from files are listed here. By double clicking or dragging an image, you could add the image into the workspace. Workspace : Workspace is where the tiling process is working. The image added here could be moved to the proper position by dragging. Double click(or enter) attaches an image into the result image. Zoom In/Out : Moving a mouse wheel or clicking the zoom ration button makes the workspace 1/1, 1/2, 1/4, 1/8 scaled size. Cancel : This button cancels the current manual tiling process and Panasis goes back to the main screen. Complete : This button ends the current manual tiling process. Then the following crop window appears. When the complete button is clicked, the final image is generated in a new window. Note : Only one image could be added into the workspace at once. Therefore, if there is already an image added into the workspace, then no image is added until the attachment is executed. 9. Measurement Menu ■ Calibration ■ Basic Measurement ■ Combination Measurement ■ Live Measurement ■ Measure Result ■ Data Collector ■ Line Profile ■ Scale Bar 9.1. Calibration Calibration wizard shows an applicable calibration list, creates new calibration data and applies the selected calibration data to images. Manual : This button creates a manual calibration generator. Auto : This button creates a automatic calibration generator. Load : This button loads a calibration set from saved files. Save : This button saves the current calibration set to a file. Delete : This button deletes a selected calibration datum. UP : This button moves up a selected calibration datum in the calibration list. DN : This button moves down a selected calibration datum in the calibration list. Apply : This button applies the selected calibration datum to images. 9.1.1. New Calibration This function is used for generating a new calibration. [ Manual ] 1. When new Calibration dialog shows up, the activated image is drawn in the main screen. If "Open" button is clicked, a saved image is loaded. 2. Draw the calibration line. Vertical, horizontal or 45 degree inclined lines are drawn when drawing lines with pushing a shift key. 3. After inserting calibration information (name, length, unit), please click OK button. 4. You could set the calibration ratio of x-y, if you check the X-Y ratio box. 5. Newly created calibration datum is now listed in the calibration set. [ Auto ] 1. When new Calibration dialog shows up, the activated image is drawn in the main screen. If "Open" button is clicked, a saved image is loaded. 2. Panasis automatically finds the calibration bars. 2. After inserting calibration information (name, length, unit), please click OK button. 3. You could set the calibration ratio of x-y, if you check the X-Y ratio box. 4. Newly created calibration datum is now listed in the calibration set. Note : If the show guide line box is checked, the mouse guide line is shown. After Clicking the magnifier icon, if mouse button is clicked, the image is magnified. 9.1.2. Add to calibration list This menu( [Measurement][Calibration][Add to calibration list]) is activated when the calibration datum of a loaded image does not exit in the calibration list. This menu is clicked, the calibration datum is added to calibration list. 9.1.3. Apply calibration To apply calibration to images, please use the calibration combo box in the tool bar. If there is no calibration data in the list, the box shows a default datum(pixel). To create calibration data, please see the New Calibration page. If you select a calibration value in the calibration combo box, the value is applied to an activated image. The calibration combo box shows the calibration datum applied to the activated image. If calibration list does not include the calibration data of loaded images, the data are listed in the calibration combo box, but they are gray letters which are not applicable to other images. In this case, "Add to calibration list" function adds them to the applicable calibration list. Calibration units could be selected 9.2. Basic Measurement Mouse cursor is different for each measurement item. Measurement objects are created by left click and they could be created in succession after the end of an object creation. In the case of that it is fixed the number of points which consist of an object, right click cancels the creation of the object and Panasis gets back to selection mode where the shape of the mouse cursor is an arrow. Otherwise ( e.g. counting ), right click complete the object creation and Panasis continues object creation mode. All procedures of creating, deleting and editing for measurement objects supports Undo/Redo function. Also You can copy and paste them. The followings are basic measurement tools. point : This object measures the position of a chosen pixel. By one click, a point object is created. The datum of a point consists of the positions of x and y. Distance between vertical lines : this object measures the distance between two vertical lines which are created by one click for each line. The result datum is the distance between two vertical lines. Distance between horizontal lines : this object measures the distance between two horizontal lines which are created by one click for each line. The result datum is the distance between two horizontal lines. line : This object measures the length of a line which are created by specifying two points, start point and end point by mouse clicking. If you keep pushing a shift key when drawing a line, then the line is allowed to have the following degrees of inclinations only : 0, 45, 90, 135, 180, 225, 270, 315. The result data are the length, the position of the middle point, x-y position of the start point and the end point, the angle between the line and x-axis. Polyline : The number of point to create a polyline is not fixed. Dragging during creating a polyline adds them to the polyline all points where mouse moves. A polyline has total length and the x-y position of the middle point as data. Rectangle : This object measures the area of a rectangle which are generated by specifying two points, upper left and bottom right. Keep pushing a shift key when drawing a rectangle generate a square. The result data are the area, circumference length, x-y position of the middle point. Polygon : The number of point to create a polygon is not fixed. Dragging during creating a polygon adds them to the polygon all points where mouse moves. A polygon has the area, circumference length and the x-y position of the middle point as data. 2 point circle : This object is created by specifying two points, a center point and a point on the circumference. It has a label with a radius or a diameter. The result data are the radius, diameter, area, circumference length, x-y position of the center point. . 3 point circle : This object is created by specifying three points on the circumference. It has a label with a radius or a diameter. The result data are the radius, diameter, area, circumference length, x-y position of the center point. Ellipse : This object is created by specifying three points on the circumference. It has a label with the length of major axis or minor axis. The result data are the length of the major axis, the length of the minor axis, area, circumference length, x-y position of the center point. Arc : This object measures the length of an arc which are created by specifying three points on the arc. The result data are the length, the radius, the diameter, x-y position of the center point. Angle : This object measures the angle between two lines which are created by specifying three points, an intersection point and two other points for defining two lines. The result datum is an angle. X-Y width : This object measures the width and the height between two vertical lines and two horizontal lines which are created by specifying two points of two opposite corners, which is same as specifying a rectangle. The result data are width and height. Count : This object measures the number of points created by clicks. The number of counting points are not fixed. The result datum is the number of counted points. Properties(general) : The properties of basic measurement objects are set here. When an image is loaded or captured, this page works. If no object is selected, the property is applied to all objects created after the property changes. If any objects are selected, then the property is applied to the ones. If the Apply button is clicked, the property is applied without closing property dialog. Properties(Angle) : The properties of angles are set here. When an image is loaded or captured, this page works. The application policy is same as that of general properties. Properties(Circle) : The properties of circles are set here. When an image is loaded or captured, this page works. The application policy is same as that of general properties. Properties(Relation object ) : The properties of combination measurement objects are set here. When an image is loaded or captured, this page works. The application policy is same as that of general properties. Distance between 2 circles : This button measures the distance between two circles which are created by 6 clicks to define two 3 point circles. This function belongs to macro measurement. The result data are same as that of line. Distance between line and points : This button measures the distance between a line and points. The number of points are not fixed. This function belongs to macro measurement. The result data are same as that of line. Angle between 2 lines : This button measures the angle between none intersecting two lines. The result data are same as that of line. Auto Trace : This command measures the length of auto-detected polyline. The number of points to create an Auto Trace is not fixed. When the mouse is double clicked, at the point, Panasis starts automatically trace a circumference to the right hand side of the point or the direction connecting two points, the double clicked point and the starting point. Panasis recognizes points having the largest contrast edge points. The result data are same as that of polyline. Note : To save an image and measurement objects without flattening, file format should be tif format. To save a flattened image, set the Save as a flattened image in the Environmental Option on or flatten the image using Flatten in the Image menu. Note : Since the basic measurement window is DockingPane, the window could be attached anywhere. When the window is overlapped to other DockingPane, each DockingPane is distinguished by Tab. 9.3. Combination measurement Combination measurements measure geometric relations between objects( basic measurement objects and combination measurement objects both). When objects are selected and they could compose combination measurements, then the corresponding combination measurement buttons are activated. In general, combination measurements are completed by clicking the buttons. Users cannot deform the combination measurement objects, but the objects automatically change when the element objects are changed. If a user copies a combination measurement object only, then the copied object pretends to be a basic measurement object. If a user copies a combination measurement object with its element objects, then their links are still maintained in the copied objects. Combination measurement provides the following methods. Combination Position : There are three options : center position, division position, node position This button is activated when at least one of above options is available. It has data the same as Point has. Center position : This button is activated when only objects having center points are selected. ( In the case of point, the button is activated when more than two points are selected. ) This button measures the centroid of selected objects. Division point : This button is activated when only one object having length (such as line, polyline, rectangle) is selected. The number under the button means the number of division. User could assign the starting division point for rectangle, circle and ellipse. Node position : This button is activated when a line and a line or a line and a polyline or a line and a polygon or a line and a circle or a line and a arc are selected. This finds a point where a line meets the other selected object. Combination distance : There are four options : center to center, Max, Min, Perpendicular distances. This button is activated when at least one of above options is available. It has data the same as line has. Center to Center Distance : This button is activated when two objects having centers are selected. It measures the distance between two centers of the objects. Max distance, Min distance : These button measures the maximum/minimum distance between two objects. These buttons are activated when the following objects are selected; point and rectangle, point and polygon, line and line, point and circle, point and arc, circle and circle, line and ellipse, point and line, line and circle, line and rectangle, line and polygon Perpendicular distance : This button measures the perpendicular distance between two objects. This button is activated when the following objects are selected; line and ellipse, point and line, line and circle, line and rectangle, line and polygon, line and arc. Combination line : There are three options : line segment, tangent line, division line. This button is activated when at least one of above options is available. It has data the same as line has. line segment : This button is activated when two points are selected. It measures the distance between two points. Tangent line : This button is activated when two circles or a point and a circle are selected. It measures the length of tangent lines between two objects. Division line : This button is activated when an angle is selected. The number of the divided parts is the same as the number below the button. Combination angle : This button is activated when two lines are selected. It measures the angle between the lines. It has data the same as angle has. Combination circle : This button is activated when a point or a circle is selected. The operation of the object is the same as that of 2 point circle. It has data the same as circle has. Parallel line : This button is activated when a line is selected. It creates lines parallel to the selected line by clicking their positions. The creation stops when mouse right button is clicked. It has the data the same as line has. Note : To save an image and measuring objects, user should set the file format as tif. To save an image flattened with measuring objects, user should set Save as a flattened image on or save an image after applying Flatten in Image menu. Note : Since the combination measurement window is DockingPane, the window could be attached anywhere. When the window is overlapped to other DockingPane, each DockingPane is distinguished by Tab. 9.4. Live Measurement (F6) It is possible to measure objects in the Live measurement window as in sill images. The Live measurement window has the following features. It is shown as a black rectangle written by Live in the gallery The image of Live measurement window is not shown in Navigator. Live Measurement window provides zoom in/out, overlay, focus indicator, snap, measurement, and annotation. The snapped image has the calibration of that of Live Measurement window. Also measurement objects, annotations and scale are snapped too. 9.5. Measure result Measured data are listed in Measure result table. [ Measurements ] This table show all measurement data of the activated window. If an item is selected in the table, the corresponding measuring object is selected, too. Vice versa, if a measuring object is selected in an image, the corresponding data are selected, too. : This button collect all measurement data of the activated window to data collector. [ Statistics ] This table shows statistics of the measurement data in the activated window. Note : Measurement result window is a DockingPane so that it could be located anywhere. When the window is overlapped to other DockingPane, each DockingPane is distinguished by Tab. 9.6. Data Collector This function collects the measured data and shows the data and the statistics of that. [ How to collect data ] 1. Push "Settings" button, and select the measurement items to gather. 2. Do measurement. 3. Push "Collect" button in Measurement result window. [ Collect Result ] Data collector gathers only data chosen in settings. If there is no chosen item in the setting, Data collector collects nothing. : This button delete all data in the last gathered block. : This button sets what measurement items will be collected. [ Statistics ] This table shows the statistics of gathered data. Note : Data Collector window is a DockingPane so that it could be located anywhere. When the window is overlapped to other DockingPane, each DockingPane is distinguished by Tab. 9.6.1. Data Collector Settings This function decides what measurement items to collect. The items include not only the measurement values but also statistical values(minimum, maximum, average, standard deviation, sum, number of samples) . : Add This button adds the selected items in the left box to the right box. Double click does same thing. : Add all This button adds all items in the left box to the right box. : Remove This button removes the selected items from the right box. Double click does same thing. : Remove all This button removes all items from the right box. 9.7. Line Profile This command analyzes the color intensities of the specified line. Line profile window is generated for each image. If an image is closed, the corresponding line profile window is closed too. [ How to use line Profile] 1. Open Live measurement window or still images 2. Run [Measurement][Line Profile] 3. Locate and resize the profile line for the use [ How to move profile line] Profile line means a line which appears in the activated image when user run Line Profile If mouse cursor hits the ends of the line, mouse cursor changed into an arrow. Then, user could change the size of profile line by mouse dragging. If you keep pushing shift key when dragging mouse, the line becomes horizontal line, vertical line or 45 degree inclined line according to the inclination of the line. If the mouse hits the profile line, then the mouse cursor changes into a four directional arrow. Then, user could move the profile line without resizing. [ How to move Analysis guide line] Analysis guide lines are cyan and pink lines in the lie profile window. If the mouse hits the guide lines, mouse cursor changes into a horizontal arrow. Then, user could move the guide line by mouse dragging. Color : This check box turns on/off channel profile graphs. R : This check box turns on/off the red channel profile graph. G : This check box turns on/off the green channel profile graph. B : This check box turns on/off the blue channel profile graph. I : This check box turns on/off the gray channel profile graph. Info : This box shows the profile information of the selected channel between cyan and pink lines. X1 : the X position of cyan line Y1 : the Y position of cyan line X2 : the X position of pink line Y2 : the Y position of pink line CM : |Y1-Y2|/Y1+Y2 (Y1, Y2 : Gray channel value) Save Data : This button saves the profile data as a csv file. Save Image : This button saves the current line profile image as a bmp file. 9.8. Scale bar Scale bar changes when calibration data or calibration unit changes. Scale bar could be moved by dragging. Also, the length of scale bar changes when user drags the end of the scale bar. Horizontal : If this box is checked, Panasis shows a horizontal scale bar. Vertical : If this box is checked, Panasis shows a vertical scale bar. Text size : This box sets the text size of the scale bar. Color : This box sets the color of the scale bar. Thickness : This box sets the thickness of the scale bar. Division : This box sets the number of divided parts in the scale bar. Position : This box decides the position (and the shape when Horizontal and Vertical boxes both are checked)of the scale bar. [ Default calibration (pixel), Horizontal ] [ Calibration applied, Horizontal and Vertical all checked, Upper Left ] 10. Annotation menu ■ Annotation tools 10.1. Annotation tools Mouse cursor is different for each Annotation item. Annotation objects are created by left click and they could be created in succession after the end of an object creation. In the case of that it is fixed the number of points which consist of an object, right click cancels the creation of the object and Panasis gets back to selection mode where the shape of the mouse cursor is an arrow. Otherwise ( e.g. point), right click complete the object creation and Panasis continues object creation mode. All procedures of creating, deleting and editing for measurement objects supports Undo/Redo function. Also You can copy and paste them. Panasis provides the following annotation tools Line : This button creates a line connecting two points. Arrow : This button creates an arrow pointing to the starting point. Freehand : This button creates a free line by mouse dragging. Polyline : This button creates a polyline. If mouse is double clicked, the creation ends. Rectangle : This button creates a rectangle. Polygon : This button creates a polygon. If mouse is double clicked, the creation ends. Ellipse : This button creates an ellipse using two points. Point : This button creates points. Text : This button creates a text box where user could write Annotation Properties : This button creates a window where user sets the annotation properties such as colors, transparency. Note : To save a flattened image, set the Save as a flattened image in the Environmental Option on or flatten the image using Flatten in the Image menu. If you do not use these command, annotation objects are not saved. The saved objects could be edited. Note : Since the Annotation tools window is DockingPane, the window could be attached anywhere. When the window is overlapped to other DockingPane, each DockingPane is distinguished by Tab. 10.1.1. Annotation properties If the Annotation properties button is clicked, the following window appears. If no object is selected, the property is applied to all objects created after the property changes. If any objects are selected, then the property is applied to the ones. Style : This box determines the style of the line ( solid line, dashed line, etc. ) Thickness: This box determines the thickness of the line (1~5pt). Line Color : This box determines the color of the line. Line Transparency : This box determines the transparency of the line(0%, 25%, 50%, 100%). Fill Color : This box determines the color to fill the inside of the figures. Fill Transparency : This box determines the transparency of the figures' insides. Start Style : This box determines the style of a starting point of a line (arrow, big arrow, bar, etc.). End Style : This box determines the style of a end point of a line (arrow, big arrow, bar, etc.). Font : This box determines the font of texts. Size : This box determines the size of texts. Color : This box determines the color of texts. Transparency : This box determines the transparency of text boxes. Effect : This box gives the effects on texts. Bold, Oblique, Underline Note : The activated properties depends on annotation tools. 11. Microscope(Option) Device Control Z-Axis Motor Control 11.1. Device control(Option) "Device control" controls the Huvitz Upright Microscope. This function is provided in Panasis UPRIGHT and Panasis 3D Profiler Package. Before starting Device control, connect Panasis to the microscope and register objective lenses and calibarion data as explained in HUVITZ Upright Microscope. The objective lens filled with blue shows the lens used now in the microscope. Little squares below lens images show those lenses have IL values. Check the AMS check box to apply AMS. If AMS works, the calibration data registered in HUVITZ Upright Microscope are applied on Live window and Preview. Push button to expand the control dialog in order to control a lighting of the microcsope. Push button to go back to the compact dialog. Check IL check box to use IL function in HUVITZ microscope. button saves the current light value to the IL memory in the microscope with the selected objective lens information . UP and DN button decide the lighting type, whether reflective light or transmitted light to use . controls a light. Check ECO check box to use ECO function of HUVITZ microscope. controls the ECO waiting time. button changes the microscope mode into the ECO mode. Note : IL is a function which memorized the lighting values for each objective lens. ECO is a function which changes the miscroscope mode into the ECO mode where all lighting powers are off when a user has disappeard in front of the microscope for the ECO waiting time. When a user is back in front of the microscope, ECO mode is off. 11.2. Z-Axis Motor Control (Option) "Z-Axis Motor Control" controls a Huvitz 3D Profiler. This function is provided in Panasis 3D Profiler. Before starting Z-Axis Motor control, connect Panasis to the microscope and register objective lenses and calibarion data as explained in HUVITZ Upright Microscope. The left controller is for COM port is intialized, and the right one is for COM port is not initialized. < COM port is initialized> < COM port is not initialized> 11.2.1. Z Controller 1. z -Navigator The blue circle in the center means the current position of the microscope head(the head). The position tags indicate the positions of origin(for 0), Bottom Limit (for BL), Top (for T) and Bottom(for B). When the position tag is clicked, the head moves to the position. 2. Movement button button moves the head up. button moves the head down. The bigger arrows, the large movements. 3. current position This shows the curruent position of the head. This could change the value when 0 position is newly set or absolute postion box is checked. 4. Set Memory Push botton to memorize the current postion, then the tag of "M" appears in the Navigator. 5. Set BL (Bottom Limit) Push button to set the current position as the BL, then the tag of "BL" appears in the Navigator. Push button to clear the BL, then the tag of "BL" disappears. When BL is set, the head could not move down below the BL. 11.2.2. EDF "EDF" captures images scanning along z range set by a user and synthesizes a 3 dimensional image. When button is clicked, EDF menu appears under the z-controller. 1. Move the microscope head(head) to the top position of the sample using z-controller. 2. Push button of Top to set the current position as the upper limit of the head movement. This position is shown as "T" in the Navigator. 3. Move the microscope head(head) to the lowest position of the sample using z-controller. 4. Push button of Bottom to set the current position as the low limit of the head movement. This position is shown as "B" in the Navigator. 5. Set the number of capture images in the Step box. The more capture image is , the more accurate image is but the more time it takes. Panasis recommends 20~30 images. 6. Push button to start EDF. Push button to stop the process. If "Show Surface Viewer" is checked, Panasis screen changes into 3D Measurement after the EDF process. Note : If "Top" position to set is below the "Bottom" position set before, this position could not be set as "Top". Set the position as "Top" after setting the lower position as "Bottom". If "Bottom" position to set is beyond the "Top" position set before, this position could not be set as "Bottom". Set the position as "Bottom" after setting the higher position as "Top". 11.2.3. AF "AF" is short for Auto Focus, which automatically adjust the focus of the specified region. When button is clicked, the AF menu appears under the z-controller and live window shows up with a rectangle. 1. Specify the region to apply AF by using the rectangle. Adjust the size and the position of the rectangle on the Live window to specifiy AF region. button in the ROI changes the color of the rectangle. 2. Choose the scanning process. When button is clicked, the head moves from the current position to BL for AF. When button is clicked, the head moves around the current position with the range set by a user. Also, the AF control menu changes as the following. A user could manually input the scanning range in the Range box. Also, buttons could be used to set the scanning range. 3. Set the scanning speed. Panasis has a five level of scanning speed. However, Panasis recommends "auto mode" where the speed is automatically set according to the scanning range. 4. Push button to start AF. Push button to stop the process. 11.2.4. AH AH is short for Auto Height, which measures the height difference between two specified regions. When button is clicked, the AH menu appears under the z-controller and live window shows up with two rectangles. If the proper scanning range is already set , skip 1~ 4 1. Move the microscope head(head) to the top position of the sample using z-controller. 2. Push button of Top to set the current position as the upper limit of the head movement. This position is shown as "T" in the Navigator. 3. Move the microscope head(head) to the lowest position of the sample using z-controller. 4. Push button of Bottom to set the current position as the low limit of the head movement. This position is shown as "B" in the Navigator. 5. Specifiy AH regions by adjust the size and the position of the rectangle on the Live window . If or button is clicked, the corresponding rectangle is editted. button in the ROI changes the color of the rectangle. 5. Set the scanning speed. Panasis has a five level of scanning speed. However, Panasis recommends "auto mode" where the speed is automatically set according to the scanning range. 6. Push button to start AH. Push button to stop the process. 7. The measured data is listed in Data collector . Note : To add the height data to the Data collector, 3D Profiler-Height item should be added in the collector setting . If "Top" position to set is below the "Bottom" position set before, this position could not be set as "Top". Set the position as "Top" after setting the lower position as "Bottom". If "Bottom" position to set is beyond the "Top" position set before, this position could not be set as "Bottom". Set the position as "Bottom" after setting the higher position as "Top". 12. Report menu ■ Export to Excel ■ Export csv data 12.1. Export to Excel Panasis saves data from the measurement result and data collector and images as an Excel file format. When [Report]-[Export to Excel] is clicked, the following dialog shows up. Original Image : Report includes the original image. Overlay Image : Report includes the flattened image. Crop Image : Report includes cropped images. After OK button is clicked with Crop Image button checked, the following Crop windows appears. Measurement result : Report includes the measurement data. Measurement statistics : Report includes the statistics data. Collect result : Report includes collected measurement data. Collect statistics : Report includes the statistics data of collected data. When [OK] button is clicked, the following Excel exporting window shows up. Open : This button opens the already saved file. New : This button creates a new Excel file. Document : This box selects an Excel file among the opened Excel files. Sheet : This box selects a sheet in the sheets of the selected document. New Sheet : This button creates a new sheet. Export : This button starts to export data to an Excel file. Note : If a name is written in the blank next to New Sheet button, then a sheet the the name is created. 12.2. Export csv data This function saves data from the measurement result and data collector as a csv file. Measurement result : Report includes the measurement data. Measurement statistics : Report includes the statistics data. Collect result : Report includes collected measurement data. Collect statistics : Report includes the statistics data of collected data. OK : This button exports the selected data to a csv file. 13. Window Menu ■ Cascade ■ Tile Horizontally ■ Tile Vertically ■ Close All 13.1. Cascade(F9) Cascade command arranges opened image windows so that they are roughly equal sized and laid, leaving only their title bar and left border visible. Minimized windows remains still minimized. 13.2. Tile Horizontally(F10) Tile Horizontally arranges the opened image windows horizontally. Minimized windows remains still minimized. 13.3. Tile Vertically(F11) Tile Vertically arranges the opened image windows vertically. Minimized windows remains still minimized. 13.4. Close All (Shift+F4) This function closes all image windows. If an image window is not saved when the image changes, the following dialog shows up and ask whether user would save it or not. : This button saves the current image and closes it. : This button saves all unsaved image and closes them. : This button does not save the image and closes it. : This button does not save all unsaved image and closes them. : This button cancels window closing. 14. About Menu ■ About 14.1. About This command shows the information of Panasis and the PC System. 15. Toolbar 15.1. File Toolbar Open This button opens saved files. Save This button saves images as files. 15.2. Udno Edit Toolbar This command restores an activated image to the state before the last executed function was applied. Redo This command does an action which undo was last applied to the activated image. 15.3. Mouse Mode Toolbar Selection Mode In this mode, mouse could select measurement objects and annotation objects. Pan Mode In this mode, mouse dragging(panning) moves the view area of the activated image. ROI Mode In this mode, user could set the Region Of Interest(ROI) by mouse dragging. 15.4. Zoom Toolbar Zoom In : User could zoom in the activated image step by step with this function Zoom Out: User could zoom out the activated image step by step with this function Normal View : This function returns the activated image to the image with the original size. Auto Zoom : This function fits the size of the activated image to that of the image window. 15.5. Acquire Toolbar Preview : "Preview" shows a live image of the camera. Snap : "Snap" captures an image from preview window or Live measurement window and generates a new window of the image. 15.6. Calibration Toolbar Calibration combo box This box selects the calibration. Unit combo box This box selects the calibration unit. Calibration This button opens the calibration window where user could create new calibrations. Scale bar This button shows scale bar Live Measurement This button shows the live measurement window. 15.7. View Toolbar Navigator this button shows the navigator window Gallery this button shows the image gallery - The End -