1
Development of a Perfusion Based
Decellularization System for
Cardiovascular Research
A Major Qualifying Project Report
Submitted to the Faculty of the
WORCESTER POLYTECHNIC INSTITUTE
In partial fulfillment of the requirements for the Degree of Bachelor of Science, by:
Mei Lee Amend
_________________________
Azarmeedokht Azizi
_________________________
Kaitlyn Marengo
_________________________
Luke Perreault
_________________________
Date: 30 April, 2015
Approved:
_________________________
Prof. Glenn R. Gaudette
This report represents the work of WPI
undergraduate students submitted to the faculty as
evidence of completion of a degree requirement. WPI
routinely publishes these reports on its website
without editorial or peer review. For more
information about the projects program at WPI,
please see
http://www.wpi.edu/academics/ugradstudies/projectlearning.html
AUTHORSHIP
Section
Main Author
Editing
Introduction
Group
Group
Literature Review
Group
MLA/KM
Client Statement
Group
MLA/KM
Objectives
Group
Group
Constraints
Group
Group
Project Approach
LRP
AA/KM
Alternative Designs
Needs Analysis
Group
Monitoring & Automation Software
LRP
AA/KM
Bioreactor Design System
KM
AA/KM
Final Design
LRP
AA/KM
Custom Built Semi-Automated Sys. for C. D.
KM
AA/KM
Photosensor-based Monitoring/Auto. Cap.
LRP
KM/AA
Histological Evidence
KM
KM
Visual Confirmation
KM
KM
Discussion
AA/MLA
KM
Final Design & Validation
LRP
KM
Conclusion & Recommendations
AA/MLA/KM
KM
References
KM
KM
Design Verification & Testing
ii
Appendix A
LRP
LRP
Appendix B
LRP
LRP
Appendix C
LRP
LRP
iii
Table of Contents
List of Tables ............................................................................................................................................. viii
Abstract ......................................................................................................................................................... 0
Acknowledgements ....................................................................................................................................... 1
I.
Introduction ........................................................................................................................................... 2
II.
Literature Review.................................................................................................................................. 6
1.
Heart Failure ..................................................................................................................................... 6
2.
Organ Transplant Timeline ............................................................................................................... 7
3.
Organ Transplants ............................................................................................................................. 7
4.
Organ Rejection ................................................................................................................................ 8
5.
Regenerative and Tissue Engineering ............................................................................................... 8
6.
Solution to Rejection and the Lack of Organs .................................................................................. 9
7.
Decellularization Protocol and Usage ............................................................................................. 10
8.
The Gold Standard .......................................................................................................................... 11
9.
Gaudette Laboratory at WPI ........................................................................................................... 12
10.
Customized System for Gaudette Lab......................................................................................... 14
Project Strategy ............................................................................................................................... 15
III.
1.
Client Statement .............................................................................................................................. 15
2.
Objectives ....................................................................................................................................... 17
1.
User Friendly ............................................................................................................................... 18
2.
Safety .......................................................................................................................................... 18
3.
Decellularize and Perfuse Small Organs...................................................................................... 19
4.
Versatile ...................................................................................................................................... 19
5.
Marketable .................................................................................................................................. 19
3.
Constraints ...................................................................................................................................... 21
4.
Project Approach ............................................................................................................................ 22
1.
Technical Approach .................................................................................................................... 22
2.
Management Approach ............................................................................................................... 24
3.
Financial Approach ..................................................................................................................... 24
Alternative Designs ......................................................................................................................... 25
IV.
1.
Needs Analysis................................................................................................................................ 25
2.
Monitoring and Automation Software System ............................................................................... 26
1.
Functions and Specifications – Sensors & Process Automation ................................................. 26
iv
2.
Conceptual and Preliminary Designs of Monitoring and Automation System ........................... 28
3.
Software Design Evaluation........................................................................................................ 32
4.
Preliminary Software Designs .................................................................................................... 32
5.
Preliminary Testing Data ............................................................................................................ 35
6.
Final Automation/Monitoring System Design Selections........................................................... 40
Bioreactor Design System............................................................................................................... 43
3.
1.
Conceptual Design Ideas............................................................................................................. 43
2.
Preliminary Designs .................................................................................................................... 45
3.
Final Design ................................................................................................................................ 50
4.
Custom Built Semi-Automated System for Cardiac Decellularization....................................... 51
Design Verification & Testing ............................................................................................................ 52
V.
1.
Photosensor-based Monitoring & Automation Capability .......................................................... 52
2.
Histological Evidence of Cardiac Decellularization ................................................................... 56
3.
Visual Confirmation of Decellularization ................................................................................... 61
Discussion ....................................................................................................................................... 62
VI.
1.
Economics ................................................................................................................................... 62
2.
Environmental Impact ................................................................................................................. 62
3.
Societal Influence........................................................................................................................ 63
4.
Political Ramifications ................................................................................................................ 63
5.
Ethical Concerns ......................................................................................................................... 63
6.
Health and Safety ........................................................................................................................ 64
7.
Manufacturability ........................................................................................................................ 64
8.
Sustainability............................................................................................................................... 64
9.
Conclusion .................................................................................................................................. 65
Final Design and Validation ........................................................................................................... 66
VII.
1.
Final Design Description ............................................................................................................ 66
2.
Custom Decellularization Bioreactor .......................................................................................... 67
3.
Automation & Monitoring System Components ........................................................................ 68
4.
Cardiac Decellularization............................................................................................................ 69
VIII.
Conclusions and Recommendations ............................................................................................... 70
IX.
References ....................................................................................................................................... 72
X.
Appendix ............................................................................................................................................. 76
Appendix A: Preliminary Prototyping Arduino Uno Code..................................................................... 76
v
Appendix B: Decellularization System MATLAB Software Code ........................................................ 82
Appendix C: Decellularization System User Manual ............................................................................. 99
vi
List of Figures:
Figure 1 - (A) Hoescht stain of decellularized rat cardiac tissue processed with the current Gaudette lab
system and protocol. Scale bar = 0.1 mm. (B) Representative images of decellularized cardiac tissue
versus cadaveric cardiac tissue from the Ott laboratory. ......................................................................... 13
Figure 2 - Primary, secondary, and tertiary objectives tree. .................................................................... 17
Figure 3 - Camera-Monitoring Decellularization System .......................................................................... 28
Figure 4 - Plate Reader-Based Monitoring System Schematic.................................................................. 29
Figure 5 -Schematic of Photosensor .......................................................................................................... 31
Figure 6 - Arduino UNO 24........................................................................................................................... 34
Figure 7: Decellularization System Visual Interface .................................................................................. 35
Figure 8 -Light Sensor Validation test, first trial. Graph shows voltage output of sensor system due to
direct LED exposure, exposure through decellularizing cardiac tissue, and ambient light, over an 80+
hour period. ................................................................................................................................................ 37
Figure 9 - Light Sensor Validation test, first trial. Graph shows voltage output of sensor system due to
direct LED exposure, exposure through decellularizing cardiac tissue, and ambient light, over an 80+
hour period. ................................................................................................................................................ 37
Figure 10 - Hoescht fluorescence in decellularization fluid, over 42 hours. Fluorescence was stimulated
at 490nm. Shown are the averages for trials 1 and 2 compared against the pure SDS control. ............. 39
Figure 11: MATLAB GUI for Decellularization System Operation ............................................................. 42
Figure 12: Nalgene Container used in Bioreactor Design27 ....................................................................... 44
Figure 13: T-75 Tissue Culture Flask28 ........................................................................................................ 45
Figure 14: CAD Model of Nalgene Bioreactor ........................................................................................... 46
Figure 15: "Divided Section" Bioreactor Model ........................................................................................ 47
Figure 16: Four-Heart Bioreactor Model ................................................................................................... 48
Figure 17: Tissue Culture Flask Design Model ........................................................................................... 49
Figure 18: Full Scale, Final CAD Design Model .......................................................................................... 51
Figure 19: Process Complete Notification and accompanying MATLAB graph of light sensor data. ...... 53
Figure 20: “Problem Detected” notification and accompanying MATLAB graph of light sensor readings
that initiated the system response. ........................................................................................................... 54
Figure 21: Photosensor Test, 6 hours, no ambient light interference ...................................................... 55
Figure 22: Photosensor Test, 20 hours, ambient light interference due to day/night cycle and
laboratory automatic lights ....................................................................................................................... 55
Figure 23: Results of H&E (A), Trichrome Blue (B), and Hoescht (C) histological stain assays on
decellularized and control heart tissues from hearts decellularized in the prototype system............... 57
Figure 24: Decellularized Heart - Double Decellularization Experiment Results. Before = Top, After =
Bottom. ....................................................................................................................................................... 61
Figure 25: Final Decellularization System Prototype ................................................................................ 68
Figure 26: Photosensor circuit schematic .................................................................................................. 69
vii
List of Tables
Table 1 – Ranked primary, secondary and tertiary objectives from client’s PCC and discussion ........... 20
Table 2 -Weighted Objectives Table .......................................................................................................... 25
Table 3 - Monitoring and Automation System Functions and Specifications .......................................... 26
Table 4 - Numerical Design Evaluation Matrix .......................................................................................... 32
Table 5 - Fluorescence output of Hoescht dye decellularization fluid assay. Duplicates of the weeks 1
and 2 studies, along with averages, are shown below and compared against a control of pure SDS
treated with Hoescht dye. Data was sample every 6 hours for 42 hours. ............................................... 39
viii
Abstract
Heart failure is one of the leading causes of death worldwide. Currently, heart
transplantation is the treatment of choice for end-stage heart failure, but lack of donor hearts and
risk of rejection remain a challenge. Research has shown that decellularized hearts, in which
cells are removed from the cardiac extracellular matrix (ECM), can provide a scaffold for use in
engineering patient-specific heart transplants. This project presents a low-cost, semi-automated,
small-organ (ie. rat heart) decellularization bioreactor designed for cardiac research, Testing has
shown that this device can successfully decellularize rat hearts, and offers functionality similar to
commercial devices.
Acknowledgements
All authors would like to thank the personnel of the Gaudette Laboratory, to Dr. John
Favreau, Emily Abbate, Spencer Coffin, and Katrina Hansen for their advice and feedback on this
project, and to Jordan Jones for his continuous assistance and support over the past year.
The authors off their sincere thanks to graduate student Joshua Gershlak and our advisor,
Prof. Glenn Gaudette, for their advice and support during the past year. Without their help, the
successes achieved in completing this project and developing this device would not have been
possible.
1
I.
Introduction
Heart failure, one of the leading causes of death, affects approximately 26 million people
worldwide, with a 50% mortality rate after four years.1 In the United States alone, heart failure
affects approximately 5.1 million people.2 There are many ways in order to treat the symptoms
of heart failure but a complete heart transplantation is the only cure for the most severe cases of
heart failure.
However, transplantation inherently has many drawbacks. The odds of a heart being
available for transplant is 3.5 in every 1000 deaths, or approximately 2000 hearts available each
year. This poses a problem as the number of patients on the heart transplant waitlist is above or
equal to 3,000 on any given day. The list changes every day, with people constantly being added
and removed from the list. In 2012, 3,007 patients were added to the heart transplant waiting list
and 2,784 were taken off. Of the 2,784 patients taken off the list, 2,008 received transplants, 117
became too ill to be considered for transplant, 142 became healthier, and 372 passed away while
waiting. Even for those lucky enough to receive a transplant, they run a major risk, as with any
type of organ transplant is rejection. While the first year survival rate of heart transplants is 88%,
the main cause of death is infection due to the rejection of the donor heart. The percentage of
patients developing acute rejection increases from 23% in the first year to 45% in the fifth year.3
The challenge in transplant procedures is identifying tissue matches between a recipient
and a donor, in order to avoid rejection. To overcome this limitation, researchers have developed
methods to decellularize tissue and whole organs, leaving the native extracellular matrix of
connective tissue and proteins, to create tissue and whole-organ scaffolds to be reseeded with
host cells. Ultimately, the end goal of this research is to use these decellularized organ scaffolds
to generate patient specific organs or tissue, including the heart, for transplantation. Ideally, a
2
perfusion-based decellularizing system will assist in supplementing the shortage of available
transplants. Currently, decellularization technology is beginning to be implemented in the WPI
Myocardial Regeneration Laboratory, led by Principal Investigator Prof. Glenn Gaudette, PhD.
An important part of the project scope is that it will focus primarily on use in early research,
rather than pre-clinical studies.
The goal of this project was to create a perfusion-based, low-cost, sterilizable
decellularization bioreactor that can decellularize small mammalian hearts, specifically the rat,
for use in the Gaudette Lab. Ideally, this system would be user friendly and simple to assemble,
with an easy-learning curve, permitting laboratory students and volunteers to use the system
quickly and efficiently. The system should have the ability to monitor and acquire data on the
decellularization process, an advantageous feature as it presents another option to quantify the
amount of decellularization instead of relying upon visual observations of the technician
moderating the process. Automation and monitoring would also reduce the hours associated with
working the decellularization protocol: the organ being decellularized would be able to be left
unattended. The technician, if anything went wrong, could be notified electronically by the
machine, or the machine could self-abort the process.
Ultimately, this project aimed to draw from, and improve upon the previously developed
decellularization system. This system gave a basis for the initial design and from there the team
made adjustments. Our design is meant to be utilized in the Gaudette Laboratory to further their
involvement in decellularization research.
The current market gold standard for decellularization technology is the ORCA (Organ
Regenerative Control Acquisition) bioreactor and system developed and produced by Harvard
Apparatus. The ORCA system features a built-in controller which “controls all critical elements
3
involved in 3D organ bioreactors” and records and displays real-time data collected from the
bioreactor chamber, effectively automating and monitoring many aspects of the decellularization
process.4 Preliminary studies by independent researchers have shown the ORCA system to
effectively reduce the length of time needed to decellularize cardiac tissue.5 It also monitors the
pressure, temperature, and pH by means of pumps and sensors.
Despite the ORCA system’s reliability and wide range of versatile, customizable features
(including bioreactors for both small and large mammalian organs), the ORCA is a considerable
expense, costing more than $30,000 to purchase the control system, which by itself the
bioreactor costs $13,000, and all associated parts. Additionally, the system – including the
controller, the pump, bioreactor chambers, and medium reservoir – is essentially a table-top
device and is not easily portable.6
Ideally, an improved, easy-to-use system would reduce the time involved in
decellularization research at the laboratory: graduate students and undergraduate volunteers
typically must commit to a training period of about 2-3 days to learning the decellularization
process, and then devote well over 8 hours a week in the care and monitoring of the
decellularization process as it currently stands. Because the design was specific to the needs of
the Gaudette Laboratory, the size and cost of this decellularization bioreactor could be reduced
significantly. The goal of the project was to keep the cost within the Worcester Polytechnic
Institute MQP budget, of approximately $125 dollars per student member – for this project,
approximately $500.
Still, decellularization is a relatively new technology, and many research laboratories
specially build and employ different apparatus designs and different decellularization protocols
to meet the specific needs of their research.7, 8 These systems are customized to meet the needs of
4
their laboratories, and have both benefits and drawbacks depending on the features and
functionality incorporated into each bioreactor design and decellularization protocol. Some
features our bioreactor and system have are a sensor to determine when the heart is
decellularized and a monitoring program that analyzes the raw data from the sensor into a realtime correlation graph. The system is relatively easy to use, as well as easy to attach the heart to
the designated ports for decellularization fluid to perfuse through them. The features and
functionality were based off of the golden standard, as well as the needs of the client.
By studying and drawing inspiration from relevant design aspects of these protocols and
apparatus, this project produced a streamlined, easy-to-use, and easy-to-train system that
incorporates features relevant to cardiac decellularization and study, while still having the
versatility for use in the decellularization of similarly sized mammalian organs.
Our perfusion based decellularizing system design was easily useable and replicable,
enabling the Gaudette Lab and its collaborators to use the system design and conduct their own
research to further the development of cardiac decellularization and myocardial regeneration,
having consistency in the results. The hope was that advancements in perfusion-based
decellularization will eventually lead to the process being conducted on human hearts for future
implantation.
What this project ultimately sought to achieve was to create a low-cost and user-friendly
bioreactor specifically designed towards the cardiovascular research being conducted in the
Gaudette Lab. The research done at WPI could potentially aid the research for decellularizing
human hearts, which would benefit many patients around the world who are on the waitlist for a
donor.
5
II.
Literature Review
1. Heart Failure
Heart failure is a condition that affects almost 5.1 million people in the United States with
a 50% mortality rate after four years.1 Heart failure is not a condition that means that the heart
has stopped or is about to stop working. It develops over time as the heart pumping action
decreases in force. Heart failure can affect the heart in two ways: either in the right side only or
in both sides. The majority of heart failure cases are affected in both sides of the heart. This
failure means that the heart is unable to pump the correct amount of blood to meet an individual
body’s needs. There are two cases of heart failure. The first is where the heart cannot fill with
enough blood due to weakened pumping force. The second case of heart failure is where the
heart cannot pump blood to the extremities and other parts of the body with a strong enough
force. People with heart failure can have one or both of these cases.9
There are many diseases that cause heart failure to develop. The main being coronary
heart disease, high blood pressure, and diabetes. Although there is no cure for the heart failure
that these diseases cause, medicine regimens, and lifestyle changes can improve the condition of
a patient to enable them to live longer and more actively. In cases that cannot be treated with
medicine and diet and exercise changes, doctors may implant a cardiac resynchronization
therapy (CRT) devices such as a pacemaker. These devices help correct heart rhythms when
there is an abnormality. When all medical implants and treatments are not advanced enough to
help correct heart failure, a transplant becomes necessary. Heart transplant procedures for heart
failure are performed only as a life-saving measure for the most severe end-stage heart failure
cases.9
6
2. Organ Transplant Timeline
The history of organ transplant dates back to 1869 when the first every organ transplant
was performed. This transplant was of skin and as performed by Jacques-Louis Reverdin.10, 11 In
the 150 years following 1869 many milestones have been made regarding the medical practices
of organ transplantation. In 1963, the first ever organ was transplanted from a brain dead donor.1
Practices today are based off of this “brain dead donor” as most all organ donations come from
donors who have been medically declared brain dead. This does not include live organ donations
where living donors can donate a partial lung, liver, intestine or one of their two kidneys. One of
the biggest post-operation regimens that every patient must follow is taking an
immunosuppressant drug every day for the rest of their life. In 1983, the very first
immunosuppressant drug, cyclosporine, was approved by the FDA. Cyclosporine is still widely
used today to treat transplant patients.10
Moving along in the timeline, in 1984 the Organ Procurement and Transplantation
Network was founded. This network ensures that organs are allocated fairly and equally in the
United States. This network today has an online database that has up to the minute data on the
number of patients on the transplant waiting list for any organ. Finally, one of the most recent
milestones happened in 2006. In this year the organization Donate Life America was founded.
This organization has raised the number of registered organ donors in the country to almost 120
million people.10,12
3. Organ Transplants
Out of the 120 million registered donors in the United States, only a few thousand donate
for transplants each year. Organs are turned away from transplants for a multitude of reasons, the
main being disease or infection. If an organ donor has any severe diseases or infections, HIV or
metastasized brain cancer, their organs are no longer eligible for donation. Organs from donors
7
are also turned away from transplantation because of any human error. Medical institutions have
started education programs for their staff to learn how to harvest organs for transplantation more
accurately. These programs will allow for the number of possible organ transplants to increase
over time.13
4. Organ Rejection
For any type of transplant, there is a risk of rejection of the foreign organ. This rejection
can vary from either acute or severe depending on the individual. According to the OPTN
Annual Report from 2012, acute rejection after one year ranged from 14% of patients to 39%.
The amount of rejection depends on the type of organ. For the heart in particular, the amount of
acute rejection was 23% in the first year. Over time the risk of rejection increases for patients. At
year five, rejection of transplanted organs ranged from 17% of patients to 53% of patients.
Patients with a heart transplant have a 45% chance of acute rejection after five years.14
5. Regenerative and Tissue Engineering
In an attempt to keep up with the high demand for organ donations. The field of tissue
engineering and regenerative medicine have been trying to fill those gaps with an alternative to
donated organs. The goal of tissue engineering is to repair damaged tissue and organs through
creating tissue scaffolds or implants that can be integrated into the host organ system. The three
main methods currently used are: 1.) The implantation of cultured cells directly into the body 2.)
The generation of cells in situ. 3.) The congregation of cells and scaffolds in vitro.15 This section
will focus more on the last method since it is the most relevant to this project.
To create a scaffold in tissue engineering it can be synthetic polymers or naturally
derived polymers. Polymers most often used are PGA, PLA and PCL. These products are easily
reproduced and customizable to experimental needs. The degradation rate and compatibility
with the cells can be a challenge to control. Natural polymers on the other hand have cell
8
compatibility but tend to have weak mechanical properties. To overcome these challenges
research into decellularization, a process that takes the cells from a tissue or organ and leaves
behind the ECM, began. Decellularized organs can serve as a natural polymer template that has
the innate strength as well as biocompatibility of the original. It also maintains the original
mechanical integrity and structure of the organ necessary to maintain normal function.15
6. Solution to Rejection and the Lack of Organs
In 1995, Badylak was the first to decellularize a small intestine mucosa with a chemical
detergent. This paved the way for later on the Ott Lab at Harvard Medical School to be the first
to successfully decellularize a rat heart and still retain its original functioning structure.15
Decellularized organs could become the solution to the lack of whole organs and reduce
risk of donor rejections. This technique would allow previously unusable organs to be potentially
transplanted into patients in need. When an organ is decellularized a template of ECM is left
behind that has the potential to be re-seeded with a patient’s cells. This re-population could be
with stem cells.16 There are many different methods to decellularize which include chemical,
enzymatic, physical and a combination of the three that are used. The main idea behind all three
methods is to create a disruption in the cell membrane so the cellular components will become
detached and rinsed away.15 Through decellularizing all cellular components and antigens are
removed which essentially wipes away the donor’s DNA. This reduces the chances of donor
rejection by reducing foreign body reaction, inflammation, and immune rejection.15
In 2008, the world’s first tissue engineered whole organ transplant occurred in Spain. The
woman needed a left bronchus after being damaged by tuberculosis. The research team of Paolo
Macchiarini received a donor trachea and decellularized the organ with a mixture of chemical
and enzymes. Then, re-seeded the decellularized organ with epithelial cells and mesenchymal
stem cells derived from the patient. The recellularized trachea was transplanted into the patient
9
and after four months the biopsy showed that the transplanted organ was fully integrated with its
own blood supply as well as being mechanically sound. Most importantly the patient did not
show symptoms of transplant rejection although she was not taking immunosuppressant drugs.16
This a prime example of the ECM being used as a template. At the moment it is critical
for organ regeneration to have a good scaffold. Scaffolds control the growth of cells and prevents
the seeded cells from migrating away from targeted area. This is important for the anchorage
dependent cardiac cells which will die without a substrate to proliferate and differentiate onto.17
In the future this research has the potential to allow researchers to better understand the
architecture of heart and for the future be able to completely create a synthetic heart made of
natural materials.15 At the moment decellularization hopes to utilize previously wasted organs to
be implanted into and this project hopes to contribute to this endeavor.
7. Decellularization Protocol and Usage
The process of decellularization is to disrupt the homeostasis of cells, by means of lysing.
After all the cell material has been removed from the tissue, the end product of decellularization
is the extracellular matrix, also called the ECM. There is research being conducted in many
laboratories which experiment with the ECM and using it as a scaffold to seeding stem cells
onto, in the hopes of regenerating tissue. This can be used clinically for patients who are in need
of an organ; instead of using donor organs in junction with the patient taking immunosuppressant
drugs, the patient can use their own cells to seed decellularized organs from allogeneic or
xenogeneic sources and create a genetically identical organ.
There are many ways to decellularize tissue, which are organized into two categories:
physical agents and chemical agents. “Physical agents include temperature freeze, force and
pressure, and non-thermal irreversible electroporation. For chemical agents, scientists place
10
tissue in a bioreactor, a sterile chamber which holds the tissue in place while detergents are
pumped through to remove cell residues.”18 Each have their advantages and disadvantages.
Temperature freeze involves freezing the tissue, which kills the cells in the process. It
does minimal damage to the ECM, however it does not remove the remnants of the cells. Force
and pressure uses chemicals and mechanical abrasion to lyse cells; although it does remove the
cells from the ECM, the ECM is not like its original state and not kept intact. Non-thermal
irreversible electroporation uses small electrical pulses to create micropores to cause cell lysis;
however this method has some limitations, such as it not being able to decellularize large tissue
sizes. Although the physical agents are valid candidates for decellularization, this project will
mainly focus on the chemical agents, such as Triton-X 100 and sodium dodecyl sulfate to
decellularize tissue. By perfusing and immersing the tissue in the chemical solutions, the cells
can be lysed and removed from the scaffold. A common way to chemically decellularize tissue
is using sodium dodecyl sulfate followed by Triton-X 100, and finally a PBS rinse to remove all
chemicals from the ECM scaffold. The Gaudette Lab from Worcester Polytechnic Institute
(WPI) follows a similar protocol.
8. The Gold Standard
Currently the gold standard is the Harvard Apparatus. This bioreactor is controlled by a
specialized system called the ORCA controller (Organ Regeneration Control and Acquisition).
This system “is the most advanced system offered in the market for organ decellularization and
recellularization. Advanced analytics and sensor technology is combined with a controller
designed specifically for controlling all the critical elements involved in 3D organ bioreactors.”4
This system includes small and large chambers for different organs. It has a built in software to
monitor acidity, flow rate, and pressure of the decellularizing tissue and the status of the
bioreactor itself.
11
Some advantages of this bioreactor is that it has multiple chambers, it can collect
different protocols that the scientists use, it can acquire data from the decellularization process in
forms of pictures and video, and it controls the flow and pressure of the gases such as oxygen
and carbon dioxide. The ORCA controller uses various sensors that can take temperature and
pressure readings throughout key points in the system. Also there are microscope cameras that
will monitor and document the decellularization process by taking photographs and video. These
cameras have the capability to monitor visual, UV, and IR spectrum”4
One main limitation of this bioreactor is the cost. The system cost $13,000, however the
chamber and all the components together cost over $36,000. Another limitation is that the system
does not notify the user when the organ is decellularized. It has real time data output but there is
no indication that the machine has fully completed the decellularization system.4
9. Gaudette Laboratory at WPI
The Myocardial Regeneration Laboratory, run by Prof. Glenn R. Gaudette, PhD, focuses
primarily on research into methodologies for regenerating mammalian hearts after a myocardial
infarction. In particular, this group evaluates methods to improve mechanical function of an
infarcted region of the myocardium through regenerative engineering.
In pursuit of this goal, the Gaudette Lab collaborates extensively with other groups,
including the Ott Lab, in the hope of advancing research and cardiovascular medicine.
Consequently, the lab has recently begun working with decellularization technology to evaluate
its efficacy for research in cardiac regeneration, and potential uses in regenerative therapies.19
The Gaudette Lab has already conducted initial studies into the decellularization of rat
hearts, using a prototype system built on-site with at-hand materials, including sterilizable bottles
(for use as a small bioreactor and fluid reservoir), available tubing, and a peristaltic pump. The
protocol used by the Gaudette Laboratory to decellularize rat hearts is summarized as follows:
12
1. Cannulation of aorta and connection of heart to bioreactor.
2. Perfusion with heparinized PBS for 1 hour to flush residual blood and loose tissue.
Heparin is added to combat potential coagulation and facilitate removal of blood.
3. Perfusion with 1% SDS for 48 hours to chemically decellularize cardiac tissue, followed
by a wash with dH20 for 12 hours to remove SDS and residual intracellular materials.
4. Perfusion with Triton-X 100 for 12 hours, which further decellularized the heart and aids
in the removal of SDS by solubilizing the detergent.
5. Perfusion with antibiotic-infused PBS for 48 hours to remove any pathogens that may
have accumulated during the process, and flush the decellularized tissue.20, 8
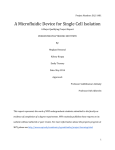
Following this protocol through initial decellularization trials on the prototype system
have shown promising results, showing extensive removal of intracellular proteins and DNA
when evaluated histologically. However, the system and process needs improvement: some
residual cellular material remains in the tissue. This residual intracellular tissue is shown in
Figure 1a. Figure 1b is presented as a comparison done by the Ott lab, which presents tissue
absent of cellular nuclear material, the primary goal in organ decellularization. 19
Figure 1 - (A) Hoescht stain of decellularized rat cardiac tissue processed with the current Gaudette lab system and protocol.
Scale bar = 0.1 mm. (B) Representative images of decellularized cardiac tissue versus cadaveric cardiac tissue from the Ott
laboratory.
13
The system itself is prone to flooding within the bioreactor and accumulation of foam
when the peristaltic flow agitates the SDS detergent. This can hinder the decellularization
process and reduce consistency and reliability between runs, a challenge our client desires to
overcome.21
10.Customized System for Gaudette Lab
In an effort to optimize the protocol already in use in the Gaudette Lab, and advance their
progress in developing cardiac decellularization methods for their purposes, the Gaudette Lab
has commissioned this project to develop a custom decellularization system optimized for their
use, with features and applications geared toward their research.19 This system must address the
current challenges faced in their decellularization process. Specifically, reducing the amount of
time involved in running the decellularization process by building in a monitoring system to
detect failure conditions such as fluid overflow or disconnection of the decellularized organ from
the bioreactor.
Additionally, the lab desires some level of automation to increase consistency of
decellularization runs and further reduce time involved in the process. Supplementary features,
such as sensors to monitor and record the decellularization procedure, inspired from systems
used in other labs and current marketed decellularization bioreactors, will assist in data collection
and study of the cardiac decellularization process.
The overall goals for an improved decellularization system provided by the client helped
establish the start of a general project strategy. This strategy built off of the client’s initial project
statement, and establishes and ranks objectives and constraints for the project based off of the
client’s requirements for the system.
14
III.
Project Strategy
1. Client Statement
Our client, the Gaudette Lab focuses primarily in research involving methods for
regeneration of infarcted mammalian heart tissue and investigating new methodologies for
improving cardiovascular medicine. In its collaborations with other laboratories, including the
group led by Harald Ott, MD, which pioneered methodologies for decellularization as a tool to
develop scaffolds for regenerative engineering of whole organs, the lab has begun working
extensively with decellularization technology to evaluate its efficacy for myocardial
regeneration.
The Gaudette Lab has already conducted pilot studies into decellularization of rat hearts,
using a prototype system built in lab, which follows previously developed perfusion-based
decellularization protocols by the Ott Lab and other groups. Initial trials have proved promising,
but our client desires a customized system designed for the type of research done by the Gaudette
Lab, with relevant features and applications. The desire for a customized system was the initial
motivator for this project, and our client, Prof. Gaudette, provided us with this initial client
statement:
“Develop a closed system to decellularize mammalian hearts, which will monitor the
decellularization process, maintain sterility of the heart, and incorporate user-friendly
construction and interface.”
Additional communication with Prof. Gaudette and research yielded more information
about what features the lab desired in a customized decellularization system:
•
Minimization of tubes and clutter to open up bench space and increase ease of use.
15
•
The option to perfuse multiple rat hearts or other small organs simultaneously
•
One or more sensors that monitor the decellularization process and collect data the
system and organ undergoing perfusion. These sensors could detect failure situations
within the system and issue a remote warning to notify the user of a problem.
•
A program developed in conjunction with the device that would take video digital
footage of the decellularizing organ in real-time to track the color change as intracellular
materials are purged from the extracellular matrix of the organ and potentially permitting
remote monitoring of the decellularization process.
•
Automation of the decellularization process to facilitate easy training and use, potentially
using a customizable application like LabView to generate the operating program.
•
The bioreactor should facilitate easy viewing of the perfusing organ to permit visual
confirmation of the decellularization process.
•
The system must be easily sterilizable with equipment available in the Gaudette
laboratory and maintain the sterility of the perfusing organ.
Revisiting the initial client statement, and incorporating these specific needs and wants,
the project goals were laid out in further detail and the following revised client statement was
established:
“Develop a low-cost perfusion based bioreactor, customized for use in cardiac regeneration
research, to decellularize small mammalian hearts and similarly sized organs. The design
must maintain sterility of the organ and system, facilitate easy usage through a user-
16
friendly setup and interface, and monitor and acquire data on decellularization process
parameters and the status of the decellularizing organ.”
This client statement highlights what was identified as the client’s key specifications for
the system, from evaluation of their statement of wants and needs. The client statement was used
as a tool to define the design space for the project and determine project objectives and
constraints.
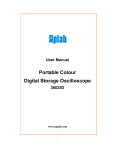
2. Objectives
Using the revised client statement as a starting point, objectives for the project were
identified and defined. These objectives were organized into primary, secondary, and tertiary
objectives, as seen below in Figure 2.
Figure 2 - Primary, secondary, and tertiary objectives tree.
17
The primary objectives for the system were specifically for it to be user-friendly, be safe,
decellularize and perfuse small organs, be versatile and be marketable.
1. User Friendly
The first objective, user friendliness, breaks down into two secondary objectives and
further some tertiary objectives. Firstly the system components should have the ability to monitor
the process of decellularization. This objective includes being able to have a remote warning
system in the event of failure, remote real-time monitoring of the process to allow researchers to
view progress when outside of lab, and a visual monitoring system to track the color change
associated with the decellularization. These will help the system be more user friendly by
reducing the time and effort associated with running a decellularization protocol and showing
how far along in the decellularization process that the heart has gone.
Secondly, the system and the monitoring components should be automated to permit an
easy learning curve so users will be able to assimilate into the use of the system quickly.
Specifically, the system could accept programmed, custom protocols for different organs and run
those protocols automatically with limited outside interference. Additionally, it would be
beneficial if the bioreactor system automatically switches decellularization fluids. For example,
after perfusing the heart with Triton-X 100, the bioreactor would be programmed to switch to
SDS after a preprogrammed amount of time.
2. Safety
Safety was one of the key objectives for this device. The design should enable as much
stability as possible, limiting the risk of breakage or failure in any component of the bioreactor
which will reduce the risk of the decellularization fluids and organs used in testing to be exposed
to outside elements, or a failed decellularization protocol. Simple design choices for the safety of
18
the user were also put into consideration, specifically reducing the number of sharp edges or
uncovered moving parts in the apparatus.
3. Decellularize and Perfuse Small Organs
The third primary objective of our project was to create a bioreactor system which has the
ability to decellularize organs by means of perfusion. Chemical solutions will be pumped
through a native heart and will lyse the cells of the organ. This will result in an extracellular
matrix scaffold made mostly of collagen. In the future, this scaffold will hopefully be used for
recellularization research to eliminate the need for exact tissue matching donor hearts.
4. Versatile
The team also wanted the bioreactor to be versatile. To achieve this objective it was
broken down into secondary objectives. The first was the ability to decellularize more than one
heart. The current system on the market has only one chamber that can be used to decellularize
the heart. Creating a modular design where multiple decellularization chambers could be added
as needed, would set the team’s bioreactor apart from current market bioreactors. Secondly, the
team hoped to design the bioreactor so it could be scaled to different sized organs. This design
characteristic would be helpful in the future if the system proved to work well. This would allow
for the system to be adapted for other larger sized organs.
5. Marketable
To be marketable, the bioreactor should be replicable, inexpensive, and aesthetically
pleasing. Systems that already exist in laboratories around the world have complicated and
expensive bioreactors and components. The goal was to make our bioreactor inexpensive so that
it is more appealing to research laboratories. Simple construction of the bioreactor was more
desirable, instead of having a complicated system. Including aesthetically pleasing design
components into the design helped motivate researchers in the Gaudette Lab to use our
bioreactor system. These design features could also encourage outside researchers to consider
19
our system for use and study. These components could have included transparent surfaces to
watch the process and using “sterile” colors and materials such as white or stainless steel.
After evaluating objectives for the project we presented a pairwise comparison chart
(PCC) to our client and discussed the importance of our selected secondary and tertiary
objectives. The ranked primary, secondary and tertiary objectives from our client’s PCC are
listed in Table 1.
Table 1 – Ranked primary, secondary and tertiary objectives from client’s PCC and discussion
1
Safe
1 Stable
2 Minimize Sharp Edges
2
Decellularize & Perfuses Small Organs
1 Easy to connect organ to system
2 Settings for different organs
3
User Friendly
1 Monitors Process
1 Track color change
2 Remote warning system
3 Remote monitoring of process
2 Automates Process
1 Programmable protocols for different organs
2 Automatically Switches Fluid
4
Versatile
1 Can decellularize more than one organ at a time
2 Able to be scaled for different sized organs
5
Marketable
1 Inexpensive
2 Replicable
3 Aesthetically Pleasing
Going forward, this ranking was used to assist in the development of conceptual designs
and evaluation of a working prototype. Assuring that the decellularization system met these
20
objectives was a significant goal of the project: the level to which these objectives were met was
a key metric of the success of the system.
3. Constraints
The constraints of our project were established by our client by defining the needs for the
decellularization system and identifying key aspects of the design that must be implemented or
met to produce a successful decellularization bioreactor. Our constraints as defined by our client
were:
•
Portable
•
Fitted for rat hearts/small mammalian hearts
•
Bioreactor must be large enough to manipulate organs manually
•
System design must allow for visual confirmation
•
Must be compatible with on-the-market fluid pumps
•
Must not exceed $500
The first of our constraints was for the bioreactor and system to be portable. The system
must be portable so that the user could have the option to take the system from a laboratory
bench top to a laminar flow hood. This meant that the dimensions of the bioreactor must be
compatible with the maximum height that the hood hatch can be opened which is around 10
inches.
Our next constraint that we defined with our client was that the system must be fitted for
rat hearts or similarly sized mammalian organs. The main purpose of our project was to
decellularize rat hearts, and so the system we design must be tailored to meet the space
requirements of rat hearts. Additionally, the bioreactor had to be large enough so that the user
can adjust and manipulate the organ with their hands. This meant that although the bioreactor has
21
to be compact to fit inside a laminar flow hood, it must also allow for the user to easily use their
hands to adjust the heart and any components in the system.
In addition to complex sensors that we would incorporate into our design to make it
unique and specific to the needs of the Gaudette Lab, the bioreactor must have components that
allow for visual confirmation of the decellularization process. Having a transparent material for
the bioreactor would allow any user or spectator to visually monitor the heart during the
decellularization process and also see if complications occurred in the bioreactor.
The next constraint that the bioreactor and system needed to follow was that it must be
compatible with any fluid pumps that are on today’s market. This was so that the Gaudette Lab
and any other lab looking to clone the system can use a pump that they already have on hand.
The final constraint of our project was that the cost of the system and the components designed
must not exceed the set budget for our team. Our client wanted to see the expenses of designing
our prototype to not exceed the $500 that had been established. If in the future our client decided
to add components to the prototype, the expenses are not required to remain under the $500
budget.
4. Project Approach
1. Technical Approach
Having established a revised client statement, and analyzed and ranked specific
objectives and constraints for the project, a technical approach to design and construction was
implemented. The team spent time in the Gaudette Laboratory learning techniques used to carry
out general cardiac decellularization research to develop a better understanding of both the
challenges associated with the current approach used in the laboratory, and the skills necessary to
carry out design, development, and testing of the project device.
22
Initially, we observed the preparation of a rat heart specimen for decellularization by the
Gaudette Lab, a process that involves the removal of a rat heart post-mortem, tying off of major
veins and arteries (except the aorta) to occlude fluid flow through the heart, and the cannulation
of the aorta to permit retrograde perfusion of decellularization fluids through the heart.
Additional observation and independent research into appropriate protocols provided us with the
necessary training to carry out this preparation independently.
Additional training involved the observation of the decellularization cycle itself,
including the perfusion of the heart with SDS and other detergent-based solutions to purge the
tissue of cellular material, and the general set up: this included proper tubing set up,
understanding of the path of fluid flow through the device and heart, pump control, and failure
conditions that could arise, such as the detachment of the heart from the cannula or inhibition of
fluid flow due to clotting in the vessels of the heart.
With a sufficient understanding of the decellularization process, and the advantages and
disadvantages of the system currently used in the Gaudette Lab, the development of alternative
designs commenced. Software to run sensor systems and a pumping apparatus was researched
and designed separately of the decellularization bioreactor itself, to permit a more open design
space and assist in the generation of a wide variety of ideas and solutions. After group
deliberation and a presentation of design specifications to our client, we selected a preliminary
design jointly with the client, and merged software selections with the hardware and bioreactor
to generate a preliminary design. This was consequently drafted in SolidWorks, while a working
software prototype was developed separately for later integration into a full prototype used for
testing and validation.
23
2. Management Approach
Management was broken down into a hierarchy, with our advisor and sponsor, Prof.
Glenn Gaudette, making final decisions on purchases and project direction, and our graduate
advisor, Joshua Gershlak, guiding our work. To maintain dialogue between the project team and
the client, weekly meetings were established to update Prof. Gaudette on progress and review
work from the previous week. The group established eight different milestones for project
management, including understanding of client requirements, analysis of functional
requirements, generation of alterative designs, design evaluation, selection of best alternative,
prototype development, documentation, and testing and validation.
To work more efficiently as a team, the project was broken up into two sub-projects: (1)
the design and development of the bioreactor with software design, (2) sensor development and
testing and validation. This work breakdown and management structure permitted easy
communication and optimized team efficiency to successfully complete the project.
3. Financial Approach
Material costs were the main source of spending. In particular, the pumps and required
hardware were the largest investments made in the project. In order to develop an easily
reproducible and low-cost design, the team made use of readily available materials in the
Gaudette Lab, including solution containers, conical tubes, and syringes to construct various
components necessary for the bioreactor container. Rat hearts were provided by the Gaudette
Lab for prototype testing free of charge. There was no cost associated for labor in production, as
production assistance was provided by the WPI Machine Shop as a school service. A primary
goal of the project was to keep costs as low as possible to permit revisions and design
improvements for a final design prototype at the conclusion of the project.
24
IV. Alternative Designs
1. Needs Analysis
Given the list of established and ranked objectives laid out in Chapter 3 (Table 1), we
established the relative importance of each objective by ranking them based on 1-10 scores, 1
indicating an objective of little importance and 10 indicating an objective vital to project success.
These scores are displayed in Table 2.
Table 2 -Weighted Objectives Table
Objective
Score
Decellularizes & Perfuses Small Organs
10
User-Friendly
8
Safe
8
Versatile
6
Marketable
3
Decellularization and perfusion of small organs was established as the most vital
objective, as the bioreactor would ultimately have to meet this objective with full success in
order for the device goals to be met completely. Although we had previously established safety
as our most important objective, it was tied with a score of 8/10 with the user-friendliness
objective. It was considered that a successful, user-friendly design would implicitly integrate safe
construction and interface, and that consideration of these two objectives would be done
concurrently as the device went through the design and construction process.
Versatility was given a score of 6; the ability to adapt the decellularization device to
different research objectives, although not necessarily vital to the success of the device, was a
desirable feature worth consideration during design. Marketability was ranked at 3; the device
was being custom-built for the Gaudette lab, and while aesthetic design and adaptability to other
25
users was desirable, the primary goal of the project was to produce a device specific for use in
the Gaudette Lab and not a device to enter the market.
This 10-point scale enabled us to consider the overall importance of each objective to
generate conceptual designs that adequately reflected the needs of the client and users of the
bioreactor device.
2. Monitoring and Automation Software System
1. Functions and Specifications – Sensors & Process Automation
Through discussions with the client and via group discussion of project constraints and
objectives, we identified the following design functions and specifications for the automation
and monitoring system that would be connected to the decellularization bioreactor,
corresponding to the project functions, shown in Table 3.
Table 3 - Monitoring and Automation System Functions and Specifications
Functions
Specifications
Monitor the decellularization process, including
Software must transmit warnings via a readily
providing remote warnings of failure conditions.
available communication mode (internet or
email)
Track and record decellularization status and
Record at minimum every 10 minutes.
data.
Enable remote viewing of data outside of the lab.
Software must output data to data format readily
usable for analysis in the lab (ie, .csv, .xls)
Monitor process parameters including bioreactor
Sensors must be sterile, and fit into system.
temperature, flow pressure, flow rate.
Ideally, fit into a 3/16” outer diameter tubing.
Permit user programming input and automation
Pumps must be independently controlled, accept
of pump function on bioreactor.
manual flow adjustments, pre-programmed
protocols, and automatic shut-offs.
26
Some of the initial requirements of the software component to the project were to monitor
the decellularization process, including remote warnings of failure conditions, tracking and
recording of decellularization status and data, and the monitoring of system parameters including
flow pressure and rate, and bioreactor temperature. Our device should record and output this data
in a tabular format easily usable by researchers that does not require a significant amount of data
processing, such as .csv or .xls. To provide consistent and continuous data of the
decellularization process, the data should be recorded at a minimum of once every ten minutes,
and the software should automatically upload this data to a storage apparatus or cloud service.
Additionally, the system should be able to detect failure modes within the system and transmit
warnings via a readily usable communication mode, such as internet or email, to maximize ease
of use and reduce the amount of time necessary for researchers to spend tending to the system.
That being said, data should ideally be viewable outside of the lab, via remote upload of data
collected by the system to a cloud server or other method.
Any sensors used within the bioreactor must be sterile or contained in such a way to
maintain system sterility. The sensors should also be able to withstand conditions inside the
bioreactor such as humidity and moisture build-up. Ideally, these sensors will be small enough to
fit within the system without disrupting the decellularization process.
The device should permit easy programming and automation of the pumping system
employed by the bioreactor, allowing users to pre-program pump rates and durations. These
pumps must be independently controlled to facilitate adjustments if multiple hearts are
decellularized at once, and include failsafe modes to automatically shut off the pumping system
in the event of a failure in the system.
27
2. Conceptual and Preliminary Designs of Monitoring and Automation System
We established several conceptual designs for system software and monitoring systems
that could effectively track the decellularization process and automate the pumping system
employed by the decellularization bioreactor. Each design incorporates different monitoring
methodologies and software types. Sketches (where applicable), descriptions, advantages, and
limitations of each design is provided in the following sections.
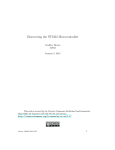
Camera-Monitoring Decellularization System
The camera-based monitoring design uses an optical camera fixated to the outside of the
decellularization bioreactor to monitor the decellularization process and record its progress
drawn in Figure 3.
Figure 3 - Camera-Monitoring Decellularization System
This system would employ data analysis software available in the lab to process and
analyze the color change of a decellularizing heart as it becomes more transparent and loses
color over time. This could be quantified via the software and used to track the process until
completion. The pump system would be controlled via separate controller software (ie.
LABVIEW or a related program). Additional sensors recording pressure and temperature within
28
the bioreactor would consequently be output to the data analysis software for monitoring and
recording.
While intuitive and able to track and record the decellularization process in real time, the
system is hindered by the various software modes it must employ to fully monitor and automate
the system, rather than having one integrated program. Additionally, camera equipment may
present a higher cost consideration if a higher quality camera is to be used.
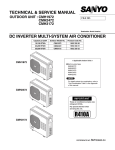
Plate Reader-Based Monitoring System
The plate reader-based monitoring system design, shown conceptually in Figure 4, makes
use of established research into detecting the DNA content of fluids with a fluorescent dye
assay.22 Conventional temperature and pressure sensors would monitor the decellularization
process and output this data to a computer. Samples of the decellularization waste fluid would be
manually extracted from the system via syringe.
Figure 4 - Plate Reader-Based Monitoring System Schematic
29
These samples could then be treated with a fluorescent dye, such as Hoescht 33342, that
binds to DNA. The samples could then be placed into a 96 well plate and read via a plate reader.
Using specific wavelengths to analyze the samples, the plate reader data would provide a method
to track the progress of the decellularization. Less DNA bound would theoretically indicate the
process is close to completion. Pumping automation would be handled by external software,
either on-board the pump, or through controller software such as LABVIEW.
While a potentially very accurate method to monitor the decellularization process, as it
provides a quantifiable way to track the DNA content of the decellularizing organ, this method is
hindered by its inability to monitor and output decellularization data remotely. Additionally, it
relies on the functionality of external equipment, such as a plate reader, which reduces its ease of
use. The necessity of extracting a sample manually to acquire data is also a hindrance.
Photosensor-Monitored Decellularization System
The photosensor decellularization monitoring system design operates under the
hypothesis (based on observations made in the Gaudette lab) that a decellularizing organ
becomes more translucent as it decellularizes and loses cellular material. This design would
employ a small light, aimed directly at the organ as seen in Figure 5.
30
Figure 5 -Schematic of Photosensor
As the organ decellularizes, more light would be able to pass through the tissue, and be
detected by a photosensor on the opposite side of the heart, which would output changes in light
intensity over time, permitting real-time monitoring of the decellularization process. This sensor
would be controlled with custom-built hardware and software that would simultaneously operate
pressure and temperature sensors built into the bioreactor, and control/automate the pumping
system.
The use of custom-built hardware and software to operate the system’s automation and
monitoring components allows for more freedom of design and would allow all components of
the project to be run off of a single interface, for a lower cost than the employment of external
hardware would offer. Additionally, the use of a light sensor to track the decellularization
process offers a low cost, but effective, way to monitor the decellularization status in real time
and output data on its progress.
31
3. Software Design Evaluation
After evaluating conceptual designs for the software and hardware devices, the group and
client evaluated each software design by employing a design evaluation matrix that assessed the
relevant (omitting “decellularizes and perfuses small organs”) objectives each design met, on a
1-10 scale. This table is shown in Table 4.
Table 4 - Numerical Design Evaluation Matrix
Objective
Camera Monitoring
Plate Reader
Photosensor
User Friendly
7
4
8
Safe
8
7
8
Versatile
3
3
7
Marketable
4
4
6
Total
22
18
29
As determined in the design evaluation matrix above, the photosensor design ranked
highest, suggesting that this design would best meet the needs of the overall system. The
customized hardware and software, coupled with the low-cost, but effective monitoring methods,
showed significant progress. However, further consideration of the plate reader-based detection
system merited its re-evaluation. The DNA content assay offered a secondary mechanism to
monitor the decellularization process in a low-cost way that could be easily implemented in any
biomedical laboratory. Thus, it was decided to incorporate this testing method into future design
iterations.
4. Preliminary Software Designs
The establishment of a ranked conceptual design warranted the evaluation of preliminary
designs incorporating these features into an integrated software system for monitoring and
32
automation. In addition to system design, the software that would be employed to construct the
system was taken into consideration.
LabVIEW- Based Operating System
Initially, LabVIEW, a graphical-programming software development environment by
National Instruments, was evaluated as a stand-alone operating system to both automate the
bioreactor and monitor sensor input.23 The considerations for using this program were that it was
licensed by the Worcester Polytechnic Institute campus and could be employed at no-cost, is
integrated into the WPI curriculum and would be easy to use for any incoming volunteers to the
Gaudette lab, and employed a highly-customizable, integrated interface.
This software design would center around a single user interface, that would allow
control of pump flow time, rate, and allow easy visualization of sensor data as it was generated.
The drawback to this system was the necessity of purchasing sensors and pumps, and data
acquisition devices to permit communication of the software with sensor and pump hardware.
While a versatile and reliable system, the functionality of it would consequently be dependent on
several different components, yielding a complex system that would require extensive training to
employ and use.
Arduino Microcontroller-Based Decellularization System
The desire to reduce the overall cost of the design and enable more customization options
motivated the development of a stand-alone system that would operate independently of external
software, and both automate the bioreactor pumps, while processing and outputting sensor data
to enable real-time monitoring of the decellularization process. Research into pre-existing
methodologies to do so led to the Arduino Uno (Figure 6), a microcontroller built by the Arduino
company, based on the ATmega328. The Arduino has 14 digital input/output pins, 6 analog
inputs, a USB connection for direct computer interface, a power jack for operation while not
33
connected to a computer, and is licensed under the Creative Commons and can be customized
and used freely.24 The Arduino is programmed in an easy-to-use software environment free-todownload from the Arduino company website.24
Figure 6 - Arduino UNO 24
This microcontroller-based software design would employ a custom user interface
programmed within the Arduino, which would run photosensors, temperature, and pressure
sensors necessary to fully monitor decellularization parameters. The Arduino Uno can be
adapted with a motor shield, a secondary board that sits on top of the microcontroller and enables
the board to drive DC motors or stepper motors, permitting it to automate the pump system used
by the bioreactor.25
A preliminary prototype of this system employing a DHT11 temperature and humidity
sensor, from Virtuabotix, and standard CdS photoresistors (used as photosensors) from
Radioshack, built into a voltage divider circuit with a 10kOhm resistor, was developed to assess
the validity of the idea. These sensors are processed by the Arduino and output to a Sainsmart
34
1.8 ST7735R TFT LCD screen, which displays the current decellularization system parameters.
The design effectively conveyed all the parameters that were desirous to monitor in the system,
but did not offer a way to interface with the system (Figure 7).
Figure 7: Decellularization System Visual Interface
5. Preliminary Testing Data
Before selection and development of a final design could be undertaken, it was necessary
to validate the usage of the methodologies developed in preliminary designing to monitor the
decellularization process. Two separate experiments were conducted to assess the designs of the
light sensor decellularization progress tracking and the fluorescent DNA assay of
decellularization waste fluid.
Light Sensor Validation
It was initially hypothesized, based on general observations of the increasing
transparency of the decellularizing heart as it underwent the perfusion process that tracking the
light that penetrated through decellularizing tissue with a photosensor would indicate that light
intensity detected by the sensor increased over time. In order to test this hypothesis, a
35
rudimentary CdS photoresistor light sensor, wired into a voltage divider circuit with a 10kOhm
resistor, was programed into an Arduino Uno microcontroller, which output voltage across the
light sensor to a personal computer. The code used to program this design is shown in Appendix
A. Increased light exposure yielded increased resistance, and consequently less voltage was read
across the graph. Decreased light exposure increased the amount of voltage going across the
circuit.
Two trials were performed during two decellularization runs. Data on the photosensor
output of the ambient light in the room, the photosensor output when the testing LED was shined
directly across the photoresistor, and the light intensity of the LED through the bioreactor and
cardiac tissue, was obtained every 6 hours for an 80+ hour period. The data regarding the
ambient light in the room was a negative control as the light did not change significantly over
time. At the conclusion of the experiments, the light intensity data, based on the voltage across
the sensor, was graphed. The graphs from both trials are shown below in Figures 8 and 9.
36
Figure 8 -Light Sensor Validation test, first trial. Graph shows voltage output of sensor system due to direct LED exposure,
exposure through decellularizing cardiac tissue, and ambient light, over an 80+ hour period.
Figure 9 - Light Sensor Validation test, first trial. Graph shows voltage output of sensor system due to direct LED exposure,
exposure through decellularizing cardiac tissue, and ambient light, over an 80+ hour period.
As seen in Figure 8, ambient light stays relatively consistent over time, as expected,
while the LED exposure similarly shows consistent values, with the exception of a drop in
37
voltage at 10 hours, which may have been due to experimental error. Figure 9 shows more erratic
data, with both LED and ambient light sensor readings showing inconsistent values over time.
This may be attributable to changing light levels in the laboratory over the 80 hour period, but is
more likely due to experimental error while collecting results, and interfering light sources while
collecting data. In both trials, light intensity through the heart shows a noticeable decrease over
time, supporting the initial hypothesis. However, the readings are erratic and suggest that future
design iterations should seek to reduce exposure of the light sensor to ambient light and
background noise, to increase accuracy of readings.
Hoescht Dye Decellularization Waste Fluid Assay
The objective of this study was to assess the validity of the secondary decellularization
monitoring method for use in future device tests. In this study, decellularization fluid collected
via syringe injected directly into the fluid line of the decellularization waste fluid was treated
with a Hoescht dye solution, and run through a plate reader assay to determine the fluorescence
at 490 nm, and consequently the DNA content, of the waste fluid over time. Based on previous
research into the use of Hoescht solutions to quantify DNA content in solution, it was
hypothesized that sample absorbency would decrease over time, in correlation with the
increasing decellularization of the tissue.22, 26
Samples of 1mL were collected from the SDS decellularization residue fluid every 6
hours simultaneously with the light sensor trials detailed on pages 35-37 of this report. Samples
were labeled with time extracted, and frozen for later evaluation. Hoescht solution was prepared
per a ThermoScientific protocol.26 A working solution was added to samples in 200uL
solution/200uL sample ratio in a 96 well plate. Samples from 0 hours to 42 hours from both
decellularization trials were added, in duplicate, to the 96 well plate from both light sensor trials.
The absorbancy of these are compared against 8 pure SDS samples treated with Hoescht
38
solution, as a control. Samples were evaluated for absorbancy at 490nm, which is indicative of
DNA concentration in the residue. The plate reader fluorescence results are shown in Table 5 and
graphically represented in Figure 10, below.
Table 5 - Fluorescence output of Hoescht dye decellularization fluid assay. Duplicates of the weeks 1 and 2 studies, along with
averages, are shown below and compared against a control of pure SDS treated with Hoescht dye. Data was sample every 6
hours for 42 hours.
Time
(Hours)
0
6
12
18
24
30
36
42
CTRL
0.032
0.033
0.033
0.032
0.031
0.032
0.031
0.037
Week1
0.165
0.133
0.128
0.042
0.035
0.035
0.038
0.037
Week1
0.200
0.177
0.153
0.046
0.036
0.038
0.035
0.037
Week2
0.344
0.164
0.094
0.076
0.055
0.052
0.037
0.039
Week2
0.384
0.158
0.090
0.076
0.056
0.059
0.035
0.037
Week1
Avg
0.182
0.155
0.141
0.044
0.036
0.037
0.036
0.037
Week2
Avg
0.364
0.161
0.092
0.076
0.055
0.055
0.036
0.038
Figure 10 - Hoescht fluorescence in decellularization fluid, over 42 hours. Fluorescence was stimulated at 490nm. Shown are
the averages for trials 1 and 2 compared against the pure SDS control.
As shown in Table 4, above, both trials showed a decrease in Hoescht absorbancy over
time, and approached the absorbancy values of the control SDS samples. This correlated with the
visual observation of the decellularizing fluid. The rapid decrease in fluorescence seen between
39
0-10 hours in both trials (Figure 10) correlated with an observation that the decellularizing tissue
was rapidly losing color and cellular material during the same time span.
This method may provide a viable counter assessment against which to validate the
decellularization system effectiveness in future tests, and also provide a test against which to
compare the validity of decellularization monitoring methods, such as the light sensor design, as
the design goes through further testing and iterations.
6. Final Automation/Monitoring System Design Selections
Several decisions and developments were made to determine the final automation and
monitoring system design for the decellularization bioreactor. While a LabVIEW based
operating system was initially envisioned for the project, a desire to reduce costs and have full
control over how the user would interface with the system and combine all elements of the
system into one integrated software environment warranted the decision to begin the prototyping
process using the Arduino Uno interfaced with MATLAB (Mathworks, Natick, MA).
Similarly, while the Hoescht dye assay provided an accurate assessment of the progress
of the decellularization process over time, it did not provide real-time data. To effectively
monitor the decellularization process, real-time data that a system program could respond to
immediately, providing the user with instantaneous process data whenever applicable was
essential. With this consideration in mind, the decision to implement the light sensor as a process
monitor was selected over the Hoescht assay. Additionally, because the system would be in a
laboratory environment that is climate-controlled, a temperature sensor was eliminated as an
unnecessary expense.
The system was comprised of an Arduino Uno microcontroller modified with an Adafruit
Motor Shield V2 (Adafruit Industries, New York). This shield connects to an 8-AA battery 12V
40
power pack, and permits the control of two small peristaltic pumps (Adafruit Industries, New
York). The Arduino additionally controls the photosensors, comprised of two standard CdS
photoresistors, built into separate voltage divider circuits with a 10kOhm resistor; these detect
the light from an LED positioned outside the bioreactor, as the light penetrates through heart
tissue. As the heart decellularizes, more light can penetrate through the gradually more
translucent tissue. This automation and monitoring hardware interfaces with MATLAB
(Mathworks, Natick, MA) via the MATLAB add-on “Arduino Support from MATLAB,” which
offers a suite of functions to generate programs that both relay commands to the Adafruit Motor
Shield and peristaltic pumps, and can collect and analyze data collected from the Arduino-based
photosensors.
In order to operate the entire system as a functional whole, a program was developed in
MATLAB to control the pump system and photosensor monitoring apparatus. This system is
programmed to accept specific inputs from the user to specify how the decellularization will
function and for how long. Specifically, the user can input the amount of time the pumps and
monitors will run, the speed and direction-of-flow for both pumps (which can be activated or
deactivated via this system as well), specify the USB port the Arduino is connected to, begin
communication with the system, and specify a phone number or email address for the system to
send system notifications to.
These notifications represent a major component of the monitoring system. The program
is designed such that, if the photosensors detect a light level above a specified threshold (denoted
by a value of ~4.5V on the photoresistor circuit), the pumps and monitoring system deactivate
automatically and a message is sent to the specified user. The program sends messages by
remotely interfacing with a Google Gmail account, and sending a preprogrammed message via
41
the account. In this way, early completion of a decellularization process, or process errors (i.e., a
heart falling off a cannula and no longer blocking the light source detected by the photosensor)
are detected in real-time and an immediate notification is sent to the user. The data from the light
sensor is plotted by MATLAB in real-time and saved in an excel file for later analysis if
required.
This system operates off of a MATLAB graphical user interface (GUI), via which the
user can readily input desired parameters with ease and specify the runtime and conditions the
decellularization system will run in for a particular cycle. The GUI itself is shown below in
Figure 11.
Figure 11: MATLAB GUI for Decellularization System Operation
The GUI, as shown above, presents a streamlined interface to allow input of process
parameters and system settings. Clockwise from the top of the figure, the two “P1” and “P2”
buttons act as on/off switches for the two peristaltic pumps. Pump speed and direction is
42
controlled by denoting a value between -1 (100% reverse) and 1 (100% forward), with 100%
speed being approximately 100 mL/min. The Set Text/Email allows input of a user’s contact
information to receive notifications. Select Port allows the user to specify the port the Arduino is
connected to, and Run Protocol activates the system monitoring and pump automation for the
specified runtime, input in the Protocol Run Time input above the port selection dropdown box.
The two yellow buttons in the center left of the interface send text message notifications to
laboratory volunteers primarily responsible for running the system, if immediate help is needed.
The full MATLAB code for this decellularization system and GUI can be found in the Appendix.
3. Bioreactor Design System
1. Conceptual Design Ideas
When we began our bioreactor design process, we referenced our original objectives in
order to draft conceptual ideas. Our design, as stated previously, needed to remain low cost and
so, as a team we chose to create a bioreactor utilizing common laboratory materials. These
materials also needed to be sterilizable whether it be by means of an autoclave or EtOH process.
Because of this, common plastics and materials such as acrylic would not be able to be used as
the materials deform and degrade over time from such processes. An important characteristic that
we wanted our bioreactor to have was to be able to decellularize more than one heart at a time.
This aspect would allow us to make our design stand out from other bioreactors on the market as
well as allow for double the amount of research to be conducted in the normal time for one
decellularization. This characteristic also meant that the materials and components that we
decided to use must have the ability to undergo machining techniques in order to create holes and
other modifications to build our custom system and create ports for multiple organ
decellularization.
43
These conceptual ideas then led us to search for laboratory materials that allowed us to
accomplish the set goals. The first material that we found to be a candidate for the final
bioreactor design was a 1000 mL Nalgene Straight Sided Container. This material, seen in Figure
12, allowed us to remain low cost, be versatile in creating holes in the cap for multiple organ
decellularization and maintaining a sterilizable container. The Nalgene container it made from
polycarbonate which can be sterilized by the process of EtOH.
Figure 12: Nalgene Container used in Bioreactor Design27
The second material that we chose as a candidate for the final bioreactor design was a T75 tissue culture flask. Like the Nalgene container, the flask allowed the bioreactor to remain
low cost, sterilizable and machinable. In order to perform multiple organ decellularization, hearts
would be placed in separate flask containers. This material can be seen in Figure 13 below.
44
Figure 13: T-75 Tissue Culture Flask28
2. Preliminary Designs
The conceptual ideas for bioreactor materials led us to develop preliminary designs. We
modeled these designs using the 3D CAD software SolidWorks so that we could visually
evaluate the positive and negative aspects of each design.
Nalgene Based Bioreactor
The first main preliminary design is based off of using a 1000 mL Nalgene Straight Sided
Jar as the chamber and 50 mL conical tubes as holding cells for the individual heart samples.
Figure 14 below is the main design featuring this concept.
45
Figure 14: CAD Model of Nalgene Bioreactor
The main concept of this design is that a sample heart, after cannulation, will be attached
to a luer lock that has been fitted and sealed to a hole in one of the conical tube caps. The conical
tube cap can then be screwed onto the conical tube which is fitted and sealed into a hole in the
Nalgene container cap. Solutions for decellularization will run from separate holding containers
into polyethylene tubing that will then split into two lines for each individual heart. This tubing
is then connected to the luer locks in the conical tube caps so that fluid can then flow through the
hearts. The heart attachment and assembly will have to be conducted in a biological flow hood to
ensure the inside of the chamber remains sterile.
Once assembled, the system is allowed to leave the flow hood to be attached to the
solution tubes. A peristaltic pump will pump the solutions from their individual containers to the
system and through the heart. Once the solutions have passed through the heart they will drip
down the chamber and exit through two holes cut in the side of the chamber. The waste holes
46
will then lead into polyethylene tubing that flows the waste into a closed container. This will
allow for flow out of the chamber to avoid flooding while maintaining sterility inside the system.
The mechanism for waste removal will be dependent on gravity.
The photosensor can be incorporated into this design by creating a small hole in the cap
of the container. The sensor can be housed in a closed holding device that can be put into the
hole created. The holding device can be sealed so that the inside of the container remains sterile.
This design not only can be used as is in the picture but also has the ability to be changed
to accommodate different criteria. For example the main Nalgene chamber can be modified to
have a separation between the two heart samples when running. This is to accommodate run-off
sample collection in case the user chooses to detect for DNA to correlate how far along in the
decellularization process the heart has gone. Another modification that can be made is adding
two more ports for heart decelllarization so that up to four hearts can be decellularized at the
same time. In Figures 15 and 16 the design modifications can be seen.
Figure 15: "Divided Section" Bioreactor Model
47
Figure 16: Four-Heart Bioreactor Model
Advantages to this design is that it allows for a larger space for decellularization. This
allows for the system to not become flooded with fluid as well as allows the user to reach into
the chamber and fix problems if they arise. The container also has the ability to be easily
removed from the system and transported into the hood if needed. A disadvantage to this system
is that it requires drilling of many different hole sizes as well as additional components that need
to be attached and sealed in order to maintain internal sterility of the bioreactor.
T-75 Flask Based Bioreactor
The second main preliminary design we produced was based upon using T-75 flasks that are
stacked upon each other. The flask idea integrates multi-heart decellularization but in separate
compartments. The design is flexible, based on the user’s needs. These flasks are intended for
cell culture work, and are used in most laboratories around the world; this system could be
constructed in any lab, as long as they have access to a drill press. They have an air vent
incorporated into the cap to keep the inside and outside pressure equal. The flask design can be
seen in Figure 17 below.
48
Figure 17: Tissue Culture Flask Design Model
Taking these flasks and standing them upright, they can become a bioreactor for rat hearts.
Drilling a hole at the top and the bottom, it will allow the solutions to flow into the cannulated
heart and have the wastes leave the bottom. The flasks have ridges on them, allowing the user to
easily stack the flasks. The number of flasks correlates with the number of tissue samples that
need to be decellularized. In this case, it would be 1 heart per flask.
Fluid flow into the heart will be driven by a syringe pump. Gravity will drain the waste
out. The flasks will be set on a stand, so that the pump would be on the shelf on top of it, making
more counter space in the lab. Another hole would be drilled near the top of the flasks for the
sensors to be inserted in. These sensors include temperature, pressure, and humidity. A
photosensor and a light source would be placed on each side of the flask so that the photosensor
can analyze the light going through the tissue. Some advantages to this design is that the hearts
are in different chambers and they can easily be manipulated if there were a malfunction; the
49
flask would simple be removed from the pump and be brought back into the hood. One
disadvantage is that the waste has to be manually changed, unless it is plugged into a vacuum.
3. Final Design
After drawing up all of the preliminary designs and their choices for modifications in
Solidworks, we presented the concept to our advisor, Professor Gaudette, and asked him which
was most pleasing to him. After discussion about how each could be used in the lab, the final
design chosen was the bioreactor based upon using the 1000 mL Nalgene container without the
divider to DNA sample detection. The final design CAD model can be seen below in Figure 18.
We as a group, began compiling a list of materials that we would need to build this
prototype and approaches we could use to manufacture the different sized holes in the chamber.
We decided that we would use the drill press and milling machine to create the holes for all the
components since a laser cutter is not idea for cutting polycarbonate, as it produces toxic gas.
The Nalgene container was purchased from ThermoScientific and the conical tubes, syringes and
luer locks were obtained from the Gaudette laboratory.
A consultation with the employees of the machine shop in Higgins Laboratories on the
WPI campus helped us learn that we could not precisely cut holes for the run-off on the sides of
the Nalgene container. Because of this finding, we made a modification to have the runoff
samples be taken from a hole that is cut in the bottom of the chamber. This hole will be sized so
that a 3 mL syringe can be inserted into it. Waste fluid runoff will exit the chamber through this
syringes. As stated before, gravity will be the mechanism of waste removal. The syringe will
then flow the waste into a container where waste will be disposed of properly.
50
4. Custom Built Semi-Automated System for Cardiac Decellularization
Once the design process for both the monitoring and automation portion of the project as
well as the bioreactor portion were complete, we brought all the components together to build a
working system for semi-automated cardiac decellularization. Our final prototype includes the
photosensor monitoring system, the MATLAB automation and user interface and the final
bioreactor design. Below in Figure 18 is 3D schematic of our complete system design.
Figure 18: Full Scale, Final CAD Design Model
This schematic shows every main component that allows our system to work and
successfully decellularize rat heart by means of perfusion. The process of decellularization starts
51
with the solutions in the top two reservoirs in the schematic. Between these two reservoirs there
is tubing that is transferring fluid in and out of the reservoirs at a constant rate. This fluid transfer
is controlled by two pumps that are controlled by the Arduino and MATLAB user interface. The
fluid transfer creates a constant volume in the second reservoir. This reservoir is closed off from
non-sterile air by a filter. The constant volume in this reservoir creates a constant pressure of
fluid that enters the hearts during decellularization. This allows for the decellularization process
to be consistent. The decellularization solution flow from the second reservoir to the hearts by
means of gravity. Once the fluid has flown through the hearts, it drips down into the bottom of
the bioreactor and out the waste spout into a waste container. Seen in the schematic as well is the
incorporation of the photosensor in the cap of the bioreactor. The photosensor holding device is
situated between the two places for heart decellularization. Each heart is provided with a
designated photosensor. Each photosensor if connected to the Arduino where data is then
transferred to the MATLAB program for analysis.
V.
Design Verification & Testing
Our team conducted a series of tests to determine whether or not the decellularization system
functioned as specified and could be used reliably and efficiently. Tests yielded information
about effective elements of our design, and led to suggestions about improvements that could be
made in future iterations.
1. Photosensor-based Monitoring & Automation Capability
Determining the functionality of the monitoring and automation system required two
separate tests: testing the system software and automation capability, and testing of the
monitoring system during a decellularization cycle.
52
System Automation Validation
System automation capability was evaluated by activating the peristaltic pumps and
monitoring system and determining if the system would deactivate and relay a notification to the
specified user if a system error was detected (specifically, an increase in light intensity over the
specified threshold). This functionality was necessary to respond to process errors properly, but
also to reduce the time necessary for users to actively monitor experiments themselves.
To test this functionality, the peristaltic pumps were activated and set to an arbitrary
speed value (about 50% speed for tests). Both user cellular phone numbers and email addresses
were added as notification addresses so that it could be validated that both would work as contact
addresses. After system parameters were set and the pumps were activated, the monitoring and
automation program was activated and the system was allowed to run for a pre-set runtime (~10
seconds). After this time had elapsed, the pumps and monitoring system deactivated
appropriately, and a notification was successfully received by the user (Figure 19, below).
Figure 19: Process Complete Notification and accompanying MATLAB graph of light sensor data.
Additionally, tests were performed in which the system was stopped by exposing the
photosensors to a light level above the 4.5V threshold. In this case, the pumps again stopped
53
once this light level was detected, the monitoring system deactivated, and the system sent an
appropriate notification to the specified user notifying that the system needed to be checked
(Figure 20).
Figure 20: “Problem Detected” notification and accompanying MATLAB graph of light sensor readings that initiated the
system response.
Decellularization Monitoring Validation
After validating that the system automation could work as specified, it was necessary to
assess whether the photosensor monitoring method could effectively track decellularization and
give a reasonable indication of process status. To test this, the monitoring system was run while
decellularization protocols (3 total, two with one heart perfused and 1 with two hearts perfused)
used to test the full decellularization bioreactor were being performed. Data from the first six
hours of SDS perfusion, and a recording of monitoring data from 20 hours of SDS perfusion are
presented below in Figures 21 and 22. As seen in the initial 6 hour trial, light intensity increases
gradually over time as a heart decellularizes, as expected. However, the rate of light intensity
increase appears to gradually decrease over time. This is more indicative in the 20 hour
monitoring test, performed on the same heart after the initial 6 hour test. The 6 hour test was
54
performed at night and in a dark room, and is free of sources of ambient light interference. But
the 20 hour test was done overnight. As seen in the graph, the time when the sun sets and the
lights turn off in the laboratory (about 3 hours into the test) and the sun rises and lights turn on
(16 hours in, approximately) interferes with the sensors and obscures readings.
Figure 21: Photosensor Test, 6 hours, no ambient light interference
Sensor Votage (V)
Trial 1 - Sensor on: 20 Hrs
3.5
3
2.5
2
1.5
1
0.5
0
Heart1
0
5
10
15
20
25
Time (Hrs)
Figure 22: Photosensor Test, 20 hours, ambient light interference due to day/night cycle and laboratory automatic lights
55
2. Histological Evidence of Cardiac Decellularization
Histological staining is a technique that can be used to visualize different biological
materials, structures, and fibers present in a sample of tissue. To ensure that our system was
successfully decellularizing the hearts taken from rats, we used specific stains to visualize
muscle fibers, cytoplasm, nuclei and collagen. To accomplish this we used three different
histological staining protocols. Figure 23 shows microscopic images of all the stained samples
taken using a Leica Upright Fluorescent Microscope in junction with the Leica Application Suite
Version 3.7 at a 40X magnification.
56
10 µm
Figure 23: Results of H&E (A), Trichrome Blue (B), and Hoescht (C) histological stain assays on decellularized and control heart
tissues from hearts decellularized in the prototype system.
57
The first stain we used is a Hematoxylin and Eosin stain. This stain focuses on showing
cell nuclei, cytoplasm proteins, extracellular (ECM) fibers and intracellular membranes. The
nuclei are stained a dark purple color and the cytoplasm, ECM fibers, and intracellular
membranes are stained a color resembling pink or red. Column A in the figure shows
representative images taken of the Hematoxylin and Eosin (H&E) stain for the control and
experimental tissue samples.
To confirm if the decellularized heart tissue has been completely washed of genetic
debris and other cellular structures, we stained a control heart as well as our experimental hearts.
The control heart was a native rat heart that did not undergo any portion of the decellularization
protocol. In the first row of column A in Figure 23, the control heart that had been stained is
represented. The image shows healthy heart tissue that is full of dark purple nuclei, and pink
ECM fibers and cytoplasm. This image is a good representation of what is expected in native
heart tissue. The images that follow after the control heart in column A are of the different
experimental hearts. The first experimental heart shows a good representation of tissue that has
been decellularized. The image show no formed nuclei or genetic debris that was left behind in
the tissue following the decellularization protocol. The image of the second experimental heart
does not show indications of any nuclei but there is a slight tinge of purple indicating that not all
the genetic debris was washed away. The third experiment that was conducted was a double
decellularized heart experiment where two hears were decellularized at the same time. The heart
that was on the right side of the bioreactor appears to have no complete nuclei left in the tissue
but there is an indication of genetic debris. The heart that was on the left side of the bioreactor
shows no formed nuclei or genetic debris and is thus a good representation of tissue that has been
decellularized. From this stain we could see that genetic debris was washed away in the hearts
58
that had undergone the decellularization protocol. Unfortunately, this stain did not show us the
specific proteins and fibers that were left after decellularization as it stained ECM proteins and
other fibers the same color.
Following the H&E stain, we stained tissue samples with Masson’s Trichrome Blue so
that we could tell the difference between muscle fibers, cytoplasm and collagen. This stain marks
cell nuclei with a black color, cytoplasm with pink, muscle fiber with red and collagen blue.
Column B in the figure shows the representative images of the control and experimental heart
samples stained with Trichrome.
The control heart for this stain is represented by the second image in row 1. This image
shows that the muscle tissue has been clearly stained red ad cell nuclei were black. There is also
indication of collagen that has been stained blue. This is what is expected of native tissues. We
see collagen in the native tissue as it is one of the main proteins in the ECM. Once tissue has
been decellularized the native ECM proteins are left behind, including collagen. In the first
experimental heart, the tissue has been stained completely blue showing that only collagen
remains. This indicated that the genetic material and cellular fibers have been washed away
during the protocol.
The second experimental heart was clearly stained blue indicating that lots of collagen
remains however, there was genetic debris that had been stained black. For the third experiment,
the heart that was on the right side of the bioreactor shows clear indications of collagen as well
as muscle fiber and genetic debris. The blue stained tissue indicated that the ECM protein
collagen has been partially cleared of genetic and cellular debris. Red muscle fibers are apparent
in the sample indicating that the decellularization process did not completely clean the ECM of
these fibers. Also, there is a shade of gray that covers most of the sample indicating that cell
59
nuclei were broken down but not all of the genetic material was removed from the tissue. The
heart from this experiment that was on the left side of the bioreactor shows a sample of tissue
that is comprised of collagen. This image shows no nuclei or other cellular debris. This image
shows that this heart was fully washed of cellular structures and debris during the
decellularization process.
The final stain that was used for histological evaluation was the Hoescht fluorescent
stain. We used the Hoescht 33342 dye and its accompanying protocol. Hoescht is able to stain
only cell nuclei and the fluorescence can be excited at a wavelength of 350 nm. With a
fluorescent lens, we were able to visualize the nuclei in the tissue samples. With Hoescht, nuclei
appear to be a bright blue dot on a tissue sample. In Figure 23, column C shows the
representative images of the control and experimental tissue samples stained with Hoescht.
The control heart sample can be seen in Figure 23 in the first row and third column. This
image shows an abundance of cell nuclei that have not been disrupted by any sort of the
decellularization process. The image of the first experimental heart sample shows no visible
nuclei or genetic debris. This image shows consistent results with the samples that were stained
with H&E and Trichrome. All three stains indicate that the tissue of the first experimental heart
was fully decellularized. The second experimental heart shows visible nuclei and genetic debris.
This finding is consistent with the previous stained samples of this heart that indicate that this
heart was not fully decellularized. The right side heart from the third experiment shows that
complete nuclei are not present but there is visible genetic debris that has been stained. Along
with the findings from the samples stained with H&E and Trichrome, this image indicated that
this heart was not fully decellularized. The image of the left side heart from this experiment
shows no indications of any nucleic or genetic debris in the tissue. This finding is consistent with
60
the previous statements that the left sided heart in the double decellularization experiment was
fully decellularized.
3. Visual Confirmation of Decellularization
The final way we ensured that our system was successfully decellularizing rat hearts was
by observing the change in visual properties of the organs as they were undergoing the
decellularization process. Figure 24 below shows two images that were taken during the double
heart decellularization experiment. The images are taken approximately 48 hours apart. This
figure allows us to confirm that the decellularization process was successfully taking place.
Figure 24: Decellularized Heart - Double Decellularization Experiment Results. Before = Top, After = Bottom.
61
VI. Discussion
1. Economics
This decellularization bioreactor was designed as a small-scale project, with our advisor
being the primary client: the device was designed for the Gaudette Lab’s purposes and was
customized to fit its needs. Consequently, we do not envision our device could produce a largescale economic impact. However, the development of a low-cost decellularization bioreactor
with similarly cost-efficient monitoring capability presents a method for researchers to
circumvent the need for high-cost decellularization systems. Effectively, it could open up
opportunity for lower cost devices to make their way onto the market in the future, should the
design be developed further in the future.
2. Environmental Impact
The decellularization system was designed to utilize readily-available materials that could
be found in any research laboratory. This was done, predominantly, to cut down on costs and the
need to purchase and wait for the shipment of additional materials during the course of this
project. Specifically, the device uses a Nalgene container, laboratory 50mL plastic conical tubes,
a 3mL syringe, silicon-based tubing, along with general wiring and electronic components,
powered by a AA battery pack. Because this device uses conventional materials, and due to the
nature of the research work done with it requiring containment within a laboratory setting at all
times, the environmental impact presented by the design is minimal. The fact that the pumps on
the device require conventional batteries may be the most significant environmental
consideration – future design iterations may take this fact into account and opt to use a more
sustainable power source.
62
3. Societal Influence
The decellularization system presented in this report presents unique implications for
society at large, but specifically for education and research within the scientific community. An
affordable design for a decellularization system offers opportunities for low-budget projects
involving decellularization and tissue engineering. By drastically reducing the cost to do this
type of research, it is feasible that researchers interested in applying decellularization technology
on a trial basis to start new projects could do so, expanding the field significantly. Additionally, a
low-cost system could be utilized in teaching laboratories, enabling students to engage in
projects exploring decellularization research, and the properties of natural ECM scaffolds.
4. Political Ramifications
The political and legal implications of this device largely focus on the impact a device
such as this may have on healthcare in society at large, and the global medical and research
device market. A low-cost regenerative engineering research device, and indeed any medical
device that plays a role in healthcare and therapeutics, can serve to improve healthcare
significantly and open up new markets for medical devices and therapies. While the global
political implications for a research device like this would likely be minimal, bringing a new
medical research device to market raises questions of how to appropriately allocate funding for
medical research, and may help raise political support, and society questions, about the
ramifications of decellularization technology in healthcare.
5. Ethical Concerns
Decellularization research requires the usage of whole organs and tissue samples from
both human donors and mammalian models. Our research utilized full hearts excised from rats
euthanized for both laboratory research, and undergraduate teaching classes. The use of animal
models in research represents a long-standing ethical concern we were well aware of during our
63
work and did our best to conduct the research with the respect and effort owed to sacrifice of a
life. However, this group feels that the promise of decellularization research and the opportunity
to advance healthcare and potentially save lives in the future are worth the sacrifices of animal
models and human donors.
6. Health and Safety
Decellularization of tissue can have health benefits and well as safety. If FDA
approved, it can decrease rejection of the organ, therefore decreasing the number of people that
die from heart transplants. It can also improve the quality of life of patients who receive a heart
transplant because of the adverse effects when a person is taking immunosuppresant drugs.
When a patient is on these drugs, they are susceptible to infection due to the fact that their
immune system cannot fight the infection. An organ that has been engineered to be genetically
identical to the patient will not create an immune response.
7. Manufacturability
Manufacturing of the bioreactor took place at Higgins Laboratory at Worcester
Polytechnic Institute. Two of the team members received training on the machines, and also
received help and supervision when using the machines. As mentioned before, we opted to
design the device with common laboratory materials and used electronic components, such as an
Arduino Uno, that are commonly used in educational and research settings. This assists in easeof-manufacturability, and ease-of-use in a laboratory setting. The streamlined design also allows
easy scalability for use with larger organs, if the need arise, or for production of similar devices
in the future.
8. Sustainability
Our device was designed with sustainability in significant consideration. The Nalgene
container bioreactor and additional components can all be cleaned, sterilized, and reused
64
repeatedly. Tubing can be reused several times, but may begin to wear out after repeated cycles
of cyclic stress due to the peristaltic pumps, and may require replacement.
9. Conclusion
Harvard Apparatus, mentioned previously, is the gold standard which funded research
laboratories use to decellularize tissue. It has an advanced system which allows for small and
large organ decellularization, and has multiple protocols stored within their software. It can
acquire data during the decellularization process too. Our bioreactor, which has been designed
for the Gaudette Lab, can replicate key functions of an ORCA bioreactor at a fraction of the cost.
The materials which make up the bioreactor are made from common laboratory
apparatuses which are usually bought in bulk, such as a conical tube, cannulas, and Nalgene
containers. It also allows for real time tracking of decellularization of the tissue. Using an LED
light and a photo sensor, this records light intensity data in MATLAB and correlates it with the
stage of decellularization. As the cells lyse, the light intensity will increase due to the lack of
tissue. This is definitely an innovative aspect of the bioreactor. Also, the bioreactor can be
adaptable for different organs. Currently, the bioreactor is built to decellularize two small
mammalian hearts. However, it can be designed to decellularize four small mammalian hearts, as
was previously shown. Not only can it house small mammalian hearts, it can do any type of
tissue, as long as it can fit inside the container.
Through this project we achieved all our major project objectives: affordability, time
efficiency, successful decellularization, automated controls with monitoring, and user
friendliness. The device was intended to be low cost. The total cost of the whole system was
$140. The system increases the time efficiency of research due to the fact that it has the ability to
decellularize two hearts simultaneously in the bioreactor chamber. The individual heart ports
65
give ease of use by being able to be screwed on and off with the hearts attached. Also with
further design this bioreactor has the potential to decellularize greater than two hearts at once.
The chamber is fairly simple to switch out for a larger chamber in order to house larger organs.
This bioreactor was able to decellularize hearts successfully shown through our histology as
previously discussed. The system achieved automation through our MATLAB program. The
MATLAB program in conjunction with the embedded light sensor monitored the
decellularization process with a remote warning notification via text or e-mail. The MATLAB
program also automatically stores the data of light translucency into a Microsoft Excel file. The
user interface of the MATLAB program makes it simple for the user to adapt the run time for
another protocol that may differ from the Gaudette Lab protocol.
VII. Final Design and Validation
1. Final Design Description
The final design of the perfusion-based cardiac decellularization system described in
this report contains two major components: (1) a two-organ decellularization bioreactor for small
mammalian hearts build from a modified Nalgene container and two 50mL conical tubes,
connected via conventional serializable tubing to a constant-volume solution reservoir fed by a
larger reservoir. This constant-volume control permits constant pressure for perfusion of the
hearts being decellularized, which can be modified by raising or lowering the reservoir. (2) A
decellularization system automation and monitoring program that controls two peristaltic pumps
for circulation of solution within the system, and two photosensors that monitor the light from
separate LEDs that penetrates through decellularizing tissue, thereby monitoring the
decellularization process.
66
This system is built off an Arduino Uno microcontroller and is programmed (and
controlled in) MATLAB. Using this automation and monitoring system in tandem with the
bioreactor decellularization device cuts down on time required to monitor decellularization
protocols, and provides status updates via text or email to the specified user.
2. Custom Decellularization Bioreactor
The bioreactor for the perfusion system is comprised of a 1000 mL Nalgene straight sided
container from Thermoscientific, modified with two 50mL conical tubes cut horizontally to
create separate holders for the decellularizing hearts. The caps each have a hole cut in the center,
in which a Luer tubing connector is glued in place, to allow cannulated hearts to be locked into
place, and facilitate easy removal of hearts. A hole is bored in the center of the Nalgene
container, into which a 1/4-in OD T-Valve from Home Depot is affixed to provide housing for
the two Radioshack photoresistors that comprise the light sensors.
Wiring for the light sensors extends out through the top, and the T-valve is glued in place
and sealed with Plasti-Dip spray, a rubber-coating spring that seals the container to maintain
sterility. The bottom of the Nalgene container is modified with a 1mL syringe that acts as a
drainage port for the system. This can be modified with tubing and directly connected to a sealed
container to maintain sterility in the device. All machining for this device was completed in the
WPI Higgins Laboratories Machine Shop. Our final prototype can be seen in Figure 25 below.
67
Figure 25: Final Decellularization System Prototype
3. Automation & Monitoring System Components
The automation and monitoring system is built entirely around an Arduino Uno
microcontroller, and an Adafruit Motor Shield V2, powered by 8 AA batteries in a 12V power
pack. This motor shield controls two Adafruit peristaltic pumps that run off the battery power
and can circulate fluid at speeds up to 100mL/min in forward and reverse directions. The
monitoring hardware is built off of two Radioshack-brand photoresistors built into separate
2.2kOhm resistor voltage divider circuits, as shown in the sketch in Figure 26, below.
68
Figure 26: Photosensor circuit schematic
This circuit is powered by a 5V input from the Arduino Uno, which also collects analog
data from the sensors.
The sensor data and peristaltic pump control is processed by the Arduino, which is
programmed via MATLAB functions programmed into a MATLAB GUI (Appendix B). These
functions are built with the Arduino Support from MATLAB add-on, which allows MATLAB to
interface with the Arduino, send it commands, and receive data. In this program, the user can
control the pumps, activate the monitoring and automation system, and input an email address or
cellular number to receive process notifications on.
4. Cardiac Decellularization
Individual rat hearts were provided by the Gaudette Lab for testing of the device and
cannulated for attachment into the system. Rat hearts were frozen in -20 degree Celsius
heparinized PBS until needed. Full decellularization protocols can be monitored via the
MATLAB decellularization system software, per the user manual instructions detailed in
Appendix C. Protocols were based off a previously described protocol by Guyette et al.8 After
decellularization protocols are completed, histological analysis on the hearts should be
performed as described previously in the Design Validation section.
69
VIII. Conclusions and Recommendations
The group has designed and created a functional, semi-automated, perfusion-based
decellularization bioreactor suitable for cardiac research. This low-cost design has salient
features comparable to commercial decellularization bioreactors. This will allow universities
around the world to afford a decellularization bioreactor to further expand the research in this
area. It is also more efficient than the current laboratory custom bioreactor in the Gaudette Lab,
and cheaper and easier to use than the ORCA bioreactor from Harvard Apparatus. Overall, this
system has met the need of the Gaudette Lab.
During the development process, several improvements for future iterations of this device
were documented. The photosensors, currently used in the bioreactor, are sensitive to ambient
light, which generates noise in decellularization monitoring data. A directed light source, such as
a laser, would increase the efficacy and reduce interference. Alternatively, calibrating with an
external sensor to offset ambient light values could prevent this problem. This system is
currently tested exclusively for decellularization purposes. Modifying it to enable use as a
recellularization bioreactor may be an appropriate next step in expanding this device.
Our results from the histology staining suggest that our bioreactor and system can work
as a successful decellularization process. One aspect to the system hindering the accuracy of the
decellularization process is the protocol by which specific solutions are used to decellularize the
tissue. The overall scope of our project did not include making adjustments and changes to the
decellularization protocol established by the Gaudette Lab. A recommendation for the future
would be to perfect the decellularization protocol so that the solutions can successfully
decellularize tissue completely every time.
70
The histology results also showed us that in a double decellularization experiment, one
heart will more likely be decellularized faster and more than the other. This is due to the specific
resistance in each individual heart. Because of this, the decellularization solutions will be more
likely to flow through the heart with least resistance. In order to overcome this difference in
decellularization, we would recommend inserting pressure catheters inside the individual hearts
so that the user can know if the resistance is affecting the decellularization in each heart. With
the information from the catheters, the user can then make adjustments as needed to ensure that
both hearts will be fully decellularized by the end of the process.
71
IX. References
1. Lopez- Sendo, J (2011). The Heart Failure Epidemic. Mediographia, Vol 33 (No. 4), 363369
2. Center for Disease Control and Prevention (2013, December 3). Heart Failure Fact Sheet.
Retrieved from http://www.cdc.gov/dhdsp/data_statistics/fact_sheets/fs_heart_failure.htm
3. Scientific Registry of Transplant Recipients & Organ Procurement and Transplantation
Network (2013). OPTN/SRTR 2012
4. Harvard Apparatus Regenerative Technology. (n.d.). ORCA Bioreactor.
5. Qu, N., et al. (2013). Effect of a Novel ORCA Bioreactor on Intact Porcine Heart
Decellularization. Circulation.
6. Harvard Apparatus Regenerative Technology. (2013). Harvard Apparatus ORCA Cost
Breakdown.Annual Data Report. 113-137, Retrieved from
http://srtr.transplant.hrsa.gov/annual_reports/2012/Default.aspx
7. Badylak, S. F., Taylor, D., & Uygun, K. (2011). Whole-Organ Tissue Engineering:
Decellularization and Recellularization of Three-Dimensional Matrix Scaffolds. Annual
Review of Biomedical Engineering, 13, 26.
8. Guyette, J., Gilpin, S., Charest, J., Tapias, L., Ren, X., & Ott, H. (2014). Perfusion
decellularization of whole organs. Nature Protocols, 9(6), 17.
9. National Heart, Lung and Blood Institute (2014, March 27) How can Heart Failure be
Prevented? retreived from http://www.nhlbi.nih.gov/health/healthtopics/topics/hf/prevention.html
72
10. US Department of Health and Human Services. Timeline of Historical Event Significant
Milestones in Organ Donation and Transplantation. retrieved from
http://www.organdonor.gov/legislation/timeline.html
11. Rahlf, S. H. "The Use of Skin Grafting for the Treatment of Burn Wounds in Denmark
1870-1960." 37 (2009): 99-116. Pubmed.gov. Web. 24 Sept. 2014
12. US Department of Health and Human Services. The Need is Real: Data. retrieved from
http://www.organdonor.gov/about/data.html
13. Abouna, G.M. "Organ Shortage Crisis: Problems and Possible Solutions."Transplantation
Proceedings 40.1 (2008): 34-38.
14. Patnaik, S., Wang, B., Weed, B., Wertheim, J., & Liao, J. (2013). Decellularized
Scaffolds: Concepts Methodologies, and Applications in Cardiac Tissue Engineering and
Whole-Organ Regeneration. In Tissue Generation: Where nano-structure Meets biology.
15. Khan, A., Vishwakarma, S., Bardia, A., & Venkateshwarulu, J. (2014). Repopulation of
decellularized whole organ scaffold using stem cells: An emerging technology for the
development of neo-organ. Journal of Artificial Organs. Retrieved September 23, 2014,
from http://link.springer.com/article/10.1007/s10047-014-0780-2/fulltext.html
16. Macchiarini, MD, P., Jungebluth, MD, P., Go, MD, T., & Asnaghi, A. (2008). Clinical
transplantation of a tissue-engineered airway. The Lancet, 372(9655), 2023-2030.
Retrieved October 15, 2014, from
http://www.sciencedirect.com/science/article/pii/S0140673608615986
17. Khang, G., Lee, S. J., Kim, M. S. and Lee, H. B. 2006. Biomaterials: Tissue Engineering
and Scaffolds. Encyclopedia of Medical Devices and Instrumentation. .
73
18. Crapo, P. M., Gilbert, T. W., & Badylak, S. F. (2011). An overview of tissue and whole
organ decellularization processes. Biomaterials, 32(12), 10.
19. Personal communication, Glenn Gaudette.
20. Ott, HC et al. (2008). Perfusion-decellularized matrix: using nature’s platform to engineer
a bioartificial heart. Nature Medicine, 24(2).
21. Gaudette Lab meeting minutes. 13 August 2014. Contributed by Jordan Jones
22. Kim, YJ, et al. (1988). Fluorometric assay of DNA in cartilage explants using hoescht
33285. Analytical Biochemistry. 174:168-176.
23. National Instruments. (2014). NI LabVIEW. Retrieved on 18 December 2014, from
http://www.ni.com/labview/
24. Arduino. (2014). Arduino Uno. Retrieved on 18 December 2014, from
http://arduino.cc/en/Main/arduinoBoardUno
25. Adafruit. (2014). Adafruit Motor/Stepper/Servo Shield for Arduino v2 Kit. Retrieved 18
December 2014 from http://www.adafruit.com/products/1438
26. ThermoScientific. (2014). Instructions: Hoescht 33342. Retrieved on 18 December 2014,
from https://www.piercenet.com/instructions/2162245.pdf
27. Nalgene® 2116-1000 Straight-Sided Wide Mouth Sample Jar, Clear Polycarbonate with
White PP Closure, 1000mL, Thermo Scientific.
http://www.capitolscientific.com/Nalgene-2116-1000-Straight-Sided-Wide-MouthSample-Jar-Clear-Polycarbonate-with-White-PP-Closure28. Corning® 75cm² Rectangular Canted Neck Cell Culture Flask with Vent Cap (Product
#430641) http://catalog2.corning.com/LifeSciences/en-
74
US/Shopping/ProductDetails.aspx?productid=430641(Lifesciences)&categoryname=Flas
ks%2C+Culture%2C+Plastic+(Lifesciences)%7C75cm%C2%B2++Flasks(Lifesciences)
75
X.
Appendix
Appendix A: Preliminary Prototyping Arduino Uno Code
// Photosensor Testing Code
// MQP Group GRG 1503
// Derived from Oscope Testing Code, BME 2210, Prof. Dirk Albrecht
#include <toneAC.h>
#define ANALOG_IN 0
void setup() {
Serial.begin(19200);
toneAC(2,10);
}
void loop() {
int val = analogRead(ANALOG_IN);
Serial.write( 0xff );
Serial.write( (val >> 8) & 0xff );
Serial.write( val & 0xff );
}
-----------------------------------------------/*
* WPI BME2210 Arduino Oscilloscope
* Gives a visual rendering of analog pin 0 in realtime.
* Allows saving of data to a text file.
*
* (c) 2013 Dirk Albrecht ([email protected])
*
* Modified from:
* (c) 2008 Sofian Audry ([email protected])
*
*/
import processing.serial.*;
Serial port; // Create object from Serial class
int val;
// Data received from the serial port
int[] values, t;
float zoom;
boolean halt;
String savefile;
int bg = 0;
void setup()
{
size(640, 480);
// Open the port that the board is connected to and use the same speed (19200 bps)
port = new Serial(this, "/dev/tty.usbmodem411", 19200);
values = new int[width];
t = new int[width];
zoom = 1.0f;
halt = false;
smooth();
}
int getY(int val) {
return (int)(height - val / 1023.0f * (height - 1));
}
int getValue() {
76
int value = -1;
while (port.available() >= 3) {
if (port.read() == 0xff) {
value = (port.read() << 8) | (port.read());
}
}
return value;
}
void pushValue(int value) {
for (int i=0; i<width-1; i++) {
values[i] = values[i+1];
t[i] = t[i+1];
}
values[width-1] = value;
t[width-1] = millis();
}
void drawLines() {
stroke(255 - bg);
int displayWidth = (int) (width / zoom);
int k = values.length - displayWidth;
int x0 = 0;
int y0 = getY(values[k]);
for (int i=1; i<displayWidth; i++) {
k++;
int x1 = (int) (i * (width-1) / (displayWidth-1));
int y1 = getY(values[k]);
line(x0, y0, x1, y1);
x0 = x1;
y0 = y1;
}
}
void drawGrid() {
stroke(64, 0, 0);
for (int i=1; i<5; i++) {
line(0, (i * height / 5), width, (i * height / 5));
}
}
void keyReleased() {
switch (key) {
case '+':
zoom *= 2.0f;
if ( (int) (width / zoom) <= 1 )
zoom /= 2.0f;
println(zoom);
break;
case '-':
zoom /= 2.0f;
if (zoom < 1.0f)
zoom *= 2.0f;
println(zoom);
break;
case ' ':
halt = !halt;
break;
case 's':
selectOutput("Select a file to write to:", "saveDataFile");
77
break;
case 'i':
bg = 255 - bg;
break;
}
}
void draw()
{
// int m = millis();
background(bg);
drawGrid();
val = getValue();
if (val != -1 && !halt) {
pushValue(val);
textSize(18);
text(nf(val / 1023.0f * 5.0f, 1, 3)+'V',width-100,30);
}
drawLines();
//
text(millis()-m, width-100, height-30);
textSize(12);
text("[+]/[-] Zoom time axis", 30, height-60);
text("[space] Pause", 30, height-45);
text("[s] Save data", 30, height-30);
}
void saveDataFile(File selection) {
if (selection == null) {
println("Save canceled.");
} else {
savefile = selection.getAbsolutePath();
PrintWriter output = createWriter(savefile);
for (int i=1; i<values.length; i++)
output.println((t[i]-t[1])/1000.0f + ", " + nf(values[i] / 1023.0f * 5.0f, 1, 3));
// Write the coordinate to the file
output.flush(); // Writes the remaining data to the file
output.close();
println("Data saved to:" + savefile);
}
}
/*
// The Arduino code.
#include <toneAC.h>
#define ANALOG_IN 0
void setup() {
Serial.begin(19200);
toneAC(2,10);
}
void loop() {
int val = analogRead(ANALOG_IN);
Serial.write( 0xff );
Serial.write( (val >> 8) & 0xff );
Serial.write( val & 0xff );
}
*/
78
//*****Gaudette Lab Decellularization Senseor System******
// For MQP Group: GRG 1503; Worcester Polytechnic Institute
// Program edits & modifications by Luke R. Perreault
// Original code derived from Adafruit and Virtuabotix code.
// This sketch was generated using open-source code and code from both Adafruit and
Virtuabotix sample sketches.
// copy the sketch below and paste it into the Arduino IDE compile and run the
program.
// this sketch was created using code from both the adafruit and the virtuabotix
sample sketches
// You can use any (4 or) 5 pins
#define sclk 4
#define mosi 5
#define cs
6
#define dc
7
#define rst 0 // you can also connect this to the Arduino reset
#define ANALOG_IN_1 0 // for cds light sensor
#define ANALOG_IN_2 1 // for cds light sensor
#define ANALOG_IN_3 2 // for resistive sensor
#include <Adafruit_GFX.h>
// Core graphics library
#include <Adafruit_ST7735.h> // Hardware-specific library
#include <SPI.h>
#include <dht11.h> // dht temp humidity sensor library
dht11 DHT11;
Adafruit_ST7735 tft = Adafruit_ST7735(cs, dc, mosi, sclk, rst);
void setup(void) {
DHT11.attach(2); // set digital port 2 to sense dht input
Serial.begin(9600);
Serial.print("hello!");
tft.initR(INITR_BLACKTAB);
// initialize a ST7735S chip, black tab
Serial.println("init");
//tft.setRotation(tft.getRotation()+1); //uncomment to rotate display
// get time to display "sensor up time"
uint16_t time = millis();
tft.fillScreen(ST7735_BLACK);
time = millis() - time;
Serial.println(time, DEC);
delay(500);
Serial.println("done");
delay(1000);
tftPrintTest();
79
delay(500);
tft.fillScreen(ST7735_BLACK);
// Splash screen for esthetic purposes only
// optimized lines
testfastlines(ST7735_RED, ST7735_BLUE);
delay(500);
testdrawrects(ST7735_GREEN);
delay(500);
tft.fillScreen(ST7735_BLACK);
}
void loop() {
// tft.invertDisplay(true);
// delay(500);
// tft.invertDisplay(false);
tft.setTextColor(ST7735_WHITE);
tft.setCursor(0,0);
tft.println("De-Cell has been");
tft.println("running for: ");
tft.setCursor(50, 20);
tft.setTextSize(2);
tft.setTextColor(ST7735_BLUE);
tft.print(millis() / 60000);
tft.setTextSize(1);
tft.setCursor(40, 40);
tft.setTextColor(ST7735_WHITE);
tft.println("minutes");
tft.setCursor(0, 60);
tft.drawLine(0, 50, tft.width()-1, 50, ST7735_WHITE); //draw line separator
tft.setTextColor(ST7735_YELLOW);
tft.print("Temperature (C): ");
tft.setTextColor(ST7735_GREEN);
tft.println((float)DHT11.temperature,1);
tft.setTextColor(ST7735_WHITE);
tft.print("Humidity
(%): ");
tft.setTextColor(ST7735_RED);
tft.println((float)DHT11.humidity,1);
tft.setTextColor(ST7735_YELLOW);
tft.print("Temperature (F): ");
tft.setTextColor(ST7735_GREEN);
tft.println(DHT11.fahrenheit(), 1);
tft.setCursor(20,90);
tft.print("Light Sensor 1");
int val_1 = analogRead(ANALOG_IN_1);
tft.setCursor(60, 100);
tft.setTextColor(ST7735_YELLOW);
tft.println(val_1, 1);
tft.setCursor(20, 110);
tft.print("Light Sensor 2");
int val_2 = analogRead(ANALOG_IN_2);
tft.setCursor(60, 120);
tft.setTextColor(ST7735_YELLOW);
tft.println(val_2, 1);
tft.setCursor(20, 130);
tft.setTextColor(ST7735_RED);
tft.print("Pressure Sensor");
int val_3 = analogRead(ANALOG_IN_3);
tft.setCursor(60, 140);
tft.setTextColor(ST7735_RED);
tft.print(val_3, 1);
delay(4000);
tft.fillScreen(ST7735_BLACK);
}
80
void tftPrintTest() {
tft.setTextWrap(false);
tft.fillScreen(ST7735_BLACK);
tft.setCursor(0, 60);
tft.setTextColor(ST7735_RED);
tft.setTextSize(2);
tft.println("Gaudette");
tft.setTextColor(ST7735_YELLOW);
tft.setTextSize(2);
tft.println("Lab");
tft.setTextColor(ST7735_GREEN);
tft.setTextSize(2);
tft.println("Decell");
tft.setTextColor(ST7735_BLUE);
tft.setTextSize(3);
tft.print("System");
delay(1000);
tft.setTextWrap(false);
tft.fillScreen(ST7735_WHITE);
tft.setCursor(40,5);
tft.setTextColor(ST7735_RED);
tft.setTextSize(3);
tft.println("WPI");
tft.setCursor(0, 60);
tft.setTextColor(ST7735_RED);
tft.setTextSize(2);
tft.println("Hello!");
tft.setTextColor(ST7735_BLACK);
tft.setTextSize(2);
tft.println("System");
tft.setTextColor(ST7735_BLACK);
tft.setTextSize(2);
tft.println("Starting...");
delay(2000);
}
void testfastlines(uint16_t color1, uint16_t color2) {
tft.fillScreen(ST7735_BLACK);
for (int16_t y=0; y < tft.height(); y+=5) {
tft.drawFastHLine(0, y, tft.width(), color1);
}
for (int16_t x=0; x < tft.width(); x+=5) {
tft.drawFastVLine(x, 0, tft.height(), color2);
}
}
void testdrawrects(uint16_t color) {
tft.fillScreen(ST7735_BLACK);
for (int16_t x=0; x < tft.width(); x+=6) {
tft.drawRect(tft.width()/2 -x/2, tft.height()/2 -x/2 , x, x, color);
}
}
81
Appendix B: Decellularization System MATLAB Software Code
82
83
84
85
86
87
88
89
90
91
92
93
94
95
96
97
98
Appendix C: Decellularization System User Manual
Decellularization MQP
Gaudette Lab, 2015
Protocol for Operation of Decellularization System
Linked Google Account (for system notifications):
Note – this is exclusively an email account for MATLAB to reference to send notifications. There is no
data that saves to the account.
Username: WPIMQP GaudetteLab
Email: [email protected]
Password [case sensitive]: Gaudette_2015
Required Software:
•
•
•
•
MATLAB, 2014a or later.
Arduino Uno with Adafruit Motor Shield v2 attachment.
MATLAB Support for Arduino add-on
o Initialize supportPackageInstaller in the MATLAB command prompt and follow
directions as process initializes.
o Select Arduino from menu, and install necessary add-on.
Requires MQP MATLAB software folder to be active in the MATLAB command space.
Procedure:
Fig. 1: Decell System Graphical User Interface (GUI); Windows 7.
99
1. To initialize system, activate Gaudette Data Analysis system (input command “startup” into
command prompt while in the research drive “Projects” folder.
2. Call the .m file for the GUI (decell_runprogram).
3. Plug Arduino Uno into a USB port on the computer.
4. Once system is initialized, select the port the Arduino is connected to (Select Port in Figure 1).
a. Once selected, MATLAB will connect to the Arduino and call the board and motor
shield.
5. Input your email or phone number to Set Text/Email to enable remote notifications.
a. This is not required to initialize the system.
b. Phone numbers should have “email address” format – check online with your provider:
example – [email protected] for Verizon wireless users.
6. Specify the run-time that the system will run independently. When RunTime terminates,
peristaltic pumps will shut off automatically and you will receive a notification to check your
experiment.
7. P1 automates Pump 1, P2 automates Pump 2. Speed ranges from -1, specifying full reverse, to 1,
full forward (1 = ~100mL/min).
a. Press the P1/P2 buttons to start/stop the pumps.
b. PUMPS MUST BE RUNNING WHEN “RUN PROTOCOL” BUTTON IS
ACTIVATED, TO KEEP PUMPS RUNNING DURING PROTOCOL.
c. Speed cannot be controlled while “Run Protocol” is active.
8. Once all preferences are set, connect the Arduino to the sensor system on the bioreactor.
9. Activate the Run Protocol button.
a. Two additional Figures tracking light sensor data over time, along with a progress bar,
will be generated in MATLAB. Monitoring is now activated and you will receive a
notification upon completion or process error.
Additional Notes:
•
•
•
•
Pumps can be run independently of one another or the automation (Run Protocol) system, but an
Arduino board (Select Port) MUST be synced.
Run Protocol monitoring data will save as an excel file automatically. Please ensure you are in a
subfolder of Projects where you want the data to be saved. This program is not protected by the
chkdir.m file developed by John Favreau for the Gaudette Lab MATLAB data analysis
environment.
Tech Support: Sends a text message to Luke Perreault, undergraduate volunteer responsible for
developing this program for the Decellularization MQP.
o Please don’t actually use this unless he’s involved with the project.
Summon Jordan: Sends a text message to Jordan Jones, undergraduate volunteer currently (as of
Feb 2015) responsible for decellularization projects in the lab.
o Please don’t actually use this unless he’s involved with the project.
100