1
Project Number: SA2-1401
A Microfluidic Device for Single Cell Isolation
A Major Qualifying Project Report
WORCESTER POLYTECHNIC INSTITUTE
By:
Meghan Hemond
Kelsey Krupp
Emily Tierney
Date: May 2014
Approved:
Professor Sakthikumar Ambady
Professor Dirk Albrecht
This report represents the work of WPI undergraduate students submitted to the faculty as
evidence of completion of a degree requirement. WPI routinely publishes these reports on its
website without editorial or peer review. For more information about the projects program at
WPI, please see http://www.wpi.edu/academics/ugradstudies/project-learning.html
1
Abstract
There exists a need for inexpensive and efficient methods to isolate single cells,
especially single tumor cells for single cell analysis to improve treatment methods. We
developed a microfluidic device that traps single beads ranging from 38 to 45 um, similar
to mammalian cells. Our results suggest our device could trap single beads in 60 um
microwells, indicating this device could allow isolation of similarly-sized cells. Our device
could be used for pharmacological testing for personalized medicine and other
applications.
2
Contents
Abstract ....................................................................................................................................................................................... 2
List of Figures ............................................................................................................................................................................ 6
List of Tables.............................................................................................................................................................................. 7
Authorship.................................................................................................................................................................................. 8
Acknowledgements ................................................................................................................................................................ 9
Chapter 1: Introduction ...................................................................................................................................................... 10
Chapter 2: Literature Review ........................................................................................................................................... 13
2.1 History of Cell Culture ............................................................................................................................................. 13
2.2 Growing field ............................................................................................................................................................... 14
2.3 Applications ................................................................................................................................................................. 15
2.4 Current single cell analysis devices ................................................................................................................... 16
2.4.1 Gold standard ..................................................................................................................................................... 16
2.4.2 Single Cell Isolation Methods ....................................................................................................................... 16
2.4.3 Limitations of Current Single Cell Analysis Techniques ................................................................... 20
2.5 Microfluidics ................................................................................................................................................................ 20
2.5.1 Why use microfluidics .................................................................................................................................... 20
Chapter 3: Project Strategy................................................................................................................................................ 23
3.1 Initial Client Statement ........................................................................................................................................... 23
3.2 Objectives ..................................................................................................................................................................... 23
3.3 Revised Client Statement: ...................................................................................................................................... 27
3.4 Project Approach:...................................................................................................................................................... 28
Chapter 4: Alternative Designs ........................................................................................................................................ 29
4.1 Needs Analysis............................................................................................................................................................ 29
4.2 Functions (Specifications) ..................................................................................................................................... 29
4.3 Conceptual Designs .................................................................................................................................................. 30
4.3.1 Alternative Design 1 ........................................................................................................................................ 30
4.3.2 Alternative Design 2 ........................................................................................................................................ 31
4.3.3 Alternative Design 3 ........................................................................................................................................ 33
4.3.4 Alternative Design 4 ........................................................................................................................................ 34
4.3.5 Alternative Design 5 ........................................................................................................................................ 35
4.4 Feasibility Study/ Experiments ........................................................................................................................... 36
4.5 Modeling ....................................................................................................................................................................... 36
4.5.1 Design Calculations .......................................................................................................................................... 36
3
4.5.2 Decisions............................................................................................................................................................... 37
4.5.3 Optimization ....................................................................................................................................................... 37
4.6 Preliminary Data........................................................................................................................................................ 37
Chapter 5: Design Verification ......................................................................................................................................... 39
5.1 Device Fabrication .................................................................................................................................................... 39
5.2 Device Setup ................................................................................................................................................................ 43
5.3 Proof of Concept Testing ........................................................................................................................................ 43
5.4 Cell Testing................................................................................................................................................................... 44
Chapter 6: Discussion .......................................................................................................................................................... 45
6.1 Proof of Concept Testing ........................................................................................................................................ 45
6.2 Cell Testing................................................................................................................................................................... 49
6.3 Design Considerations............................................................................................................................................. 50
6.3.1 Economics and Society ................................................................................................................................... 50
6.3.2 Environmental Impact .................................................................................................................................... 51
6.3.3 Political Ramifications .................................................................................................................................... 51
6.3.4 Ethics...................................................................................................................................................................... 51
6.3.5 Health and Safety .............................................................................................................................................. 51
6.3.6 Manufacturability ............................................................................................................................................. 51
Chapter 7: Final Design and Validation ........................................................................................................................ 53
7.1 Device Fabrication .................................................................................................................................................... 53
7.2 Device Setup ................................................................................................................................................................ 53
7.3 Proof of Concept Testing ........................................................................................................................................ 55
7.4 Cell Testing................................................................................................................................................................... 55
Chapter 8: Conclusions and Recommendations ....................................................................................................... 57
References ................................................................................................................................................................................ 59
Appendices ............................................................................................................................................................................... 60
Appendix A: Single Cell Isolation Methods............................................................................................................. 60
Appendix B: Photolithography Process ................................................................................................................... 63
Preliminary Setup. Determine photolithography parameters .................................................................. 63
Procedure 1. Dehydration Bake ............................................................................................................................. 63
Procedure 2. Spin-coating ........................................................................................................................................ 64
Procedure 3. Prebake (Soft Bake) ......................................................................................................................... 67
Procedure 4. UV exposure ........................................................................................................................................ 68
Procedure 5. Post-Exposure Bake (PEB)............................................................................................................ 70
4
Procedure 6. Development ...................................................................................................................................... 71
Procedure 7. Inspection ............................................................................................................................................ 72
Procedure 8. Post-bake.............................................................................................................................................. 73
Appendix C-Soft Lithography SOP ............................................................................................................................. 75
PROCEDURE 1: Fluorination of the Micropatterned Substrate ................................................................ 75
PROCEDURE 2: Preparing the PDMS Mixture .................................................................................................. 76
PROCEDURE 3: Casting and Curing PDMS......................................................................................................... 76
PROCEDURE 4: Preparing a PDMS device ......................................................................................................... 77
PROCEDURE 5: Plasma Bonding............................................................................................................................ 78
PDMS Bonding: ............................................................................................................................................................. 79
Appendix D- Tween 20 Surfactant............................................................................................................................. 81
Preparing Tween Solutions ..................................................................................................................................... 81
Appendix E: BME Educational Objectives............................................................................................................... 83
5
List of Figures
Figure 1: Objectives Tree.................................................................................................................................................... 24
Figure 2: Design Process..................................................................................................................................................... 28
Figure 3: Alternative Design 1.......................................................................................................................................... 30
Figure 4: Alternative Design 2.......................................................................................................................................... 32
Figure 5: Alternative Design 3.......................................................................................................................................... 33
Figure 6: Alternative Design 4.......................................................................................................................................... 34
Figure 7: Alternative Design 5.......................................................................................................................................... 35
Figure 8: Alternative Design 5, Microscope View .................................................................................................... 36
Figure 9: Silicon Wafer Spincoated with Photoresist ............................................................................................. 39
Figure 11: PDMS Device on Glass Slide......................................................................................................................... 42
Figure 10: Silicon Wafer Exposed to UV Light ........................................................................................................... 42
Figure 12: Device Set Up ..................................................................................................................................................... 43
Figure 13: Bead Capture at 0.5g Density ..................................................................................................................... 45
Figure 14: Multiple Rows of Single Bead Capture .................................................................................................... 46
Figure 15: Bead Capture at 0.25g Density ................................................................................................................... 46
Figure 16: Dust Clog ............................................................................................................................................................. 47
Figure 17: Poorly Bonded Feature with Bead ........................................................................................................... 48
Figure 18: Air Bubbles Present in Cell Testing .......................................................................................................... 49
Figure 19: Syringe Set Up ................................................................................................................................................... 54
Figure 20: Tubing and Metal Pins Inserted into Device ........................................................................................ 54
6
List of Tables
Table 1: Pairwise Comparison Chart ............................................................................................................................. 26
Table 2: Preliminary Data (Grid of Wells Device) .................................................................................................... 37
7
Authorship
All members of the team contributed equally to the writing and editing of this report.
8
Acknowledgements
The team would like to thank Worcester Polytechnic Institute, the Biomedical Engineering
department, our advisors Professor Sakthikumar Ambady (BME) and Professor Dirk
Albrecht (BME) for their guidance with the project, Lisa Wall (BME Lab Manager), and Ross
Lagoy and Laura Aurilio for their assistance with device fabrication.
9
Chapter 1: Introduction
Despite all of the major technological advances over the last century, basic
laboratory and cell culture techniques have remained nearly the same. Scientists are
comfortable with the techniques they are using, they are well understood and they have
been standardized to make results easier to produce, interpret, and share with scientists
around the world. Despite the advantages of using these techniques, the tremendous
opportunities to improve upon them should not be ignored.
Current cell analysis techniques have two issues that must be addressed in order
for more accurate cell analysis to be performed: cells are cultured in heterogeneous
populations and data is recorded on bulk properties of these cell populations. Both bulk
analysis and heterogeneous population samples add a layer of complexity to cell culture.
Bulk analysis only presents the average behavior of the cells and nuanced behaviors may
be misrepresented or masked. While a population may appear homogeneous, rare cell
types may exist within the population that display many interesting and unique properties
and their behaviors may be masked (Tibbett and Anseth, 2009). If these cells cannot be
studied individually, we are unable to understand these behaviors, which may hold the key
to understanding the human body at its simplest level. For example, in tumor biopsies,
there are many different types of cells present. By studying the cell population as a whole,
the average behavior of the cells is studied rather than the behavior of the individual cells.
Specific cells like cancer stem cells and certain aggressive cancer cells may have very
different behavior from a typical cell in the population, but their behavior is being
shadowed by the other cells. Therefore, single-cell analysis is a technique to overcome the
inaccuracy of the current methods (Carlo, 2012).
10
The most common single-cell separation and analysis method is flow cytometry.
Flow cytometry is currently the gold standard because it is incredibly high throughput,
some 10,000 cells per second can be analyzed, but flow cytometry was not designed to
perform multiple assays on the same cell (Carlo, 2012). Flow cytometry is able to collect
data from a single cell at a single time point, but after the assay is complete cells are
discarded as waste. This makes it difficult to identify which cells are behaving abnormally
to study them further and determine the cause of their behavior. Flow cytometry is also a
very expensive method of single cell isolation, which limits its use to labs that can afford or
have access to the equipment.
In order to create a low-cost device for single cell analysis, the team was tasked with
creating a microfluidic device to isolate single cells. Since single cells should be trapped
within micron-sized devices using low flow rates that prevent cell damage and allow the
cells to be cultured after isolation. Microfluidics can be used as a high throughput method,
which is ideal for single cell analysis applications. If rare cell types are of interest, there is
likely only a few in the cell population, so the more cells that are isolated, the higher the
chance of seeing the individual cells of interest.
Our ranked objectives are that the device must be: compatible with common cell
culture techniques, compatible with common microscopes, accurate, precise, inexpensive,
and high throughput.
This device requires single cells to be trapped in order to study each cell
individually. Media must also be delivered to the cells as they are studied in the device. To
fabricate these devices, a Computer Aided Design program called DraftSight and standard
11
photolithography techniques are used to transfer the designs to a silicon wafer from which
PDMS (polydimethylsiloxane) devices can be fabricated.
To perform proof of concept testing, Cospheric© polyethylene fluorescent beads
were used in a suspension of mineral oil in the device. The beads were approximately the
same size as PANC1 cells in suspension, we believe the behavior of the bead suspension
would mimic the behavior of cells within the device.
In the remainder of the report, we will provide background into the different
methods of single-cell isolation and how they compare to each other. We will also provide
some background into microfluidics. We will discuss our objectives, constraints, and
functions, and then explain the approach of our project. We will then provide alternative
designs and the reasons behind our design choices. Later, we will explain the experiments
that we ran and discuss the results. Finally, we will draw conclusions from our experiments
and discuss the overall functionality of our device.
12
Chapter 2: Literature Review
2.1 History of Cell Culture
Tissue culture was first introduced in the early 1900’s, and has been widely used
ever since. Initially, it allowed scientists to maintain cells and tissues in vitro so they could
perform experiments and study them over time, which was imperative to understanding
basic biology and living systems. Today, cell culture is a universally accepted practice that
influences many different industries and has enabled us to do things that wouldn’t have
been imaginable 100 years ago.
Traditionally cells are both cultured and analyzed as an entire population, and the
results are the average behavior of all the cells within that population. This requires the
assumption that the average response is representative of a typical cell in the population,
which is not necessarily accurate. For example, an average of 50% protein expression in a
cell population can represent either a 100% response in half the cells or a 50% response in
all cells and therefore averages can be misleading due to the difficulty of differentiating
between the two scenarios (Yin and Marshall, 2012). There is mounting evidence regarding
the cellular differences that are found in isogenic and clonal populations, which were
previously assumed to be identical throughout.
The population of cells present in tumors shows vast heterogeneity, which makes
them a particularly important application of single cell analysis. Cancerous cells exhibit
rapid changes in their genetic make-up due to either genetic drift, the rate of replication
and age of that cell, or the processes occurring and proteins that cell is expressing (Yin and
Marshall, 2012). Individual cells exhibit unique behavior in regards to protein expression
and metabolic activity. Therefore, the oversimplification of bulk analysis is problematic
13
because it neglects this cell to cell variability. In order to understand the heterogeneity and
inner workings of a cell population, each cell has to be analyzed individually. This enables
researchers to study the factors that influence individual cell behavior and understand
what causes the fundamental differences between cells. These differences dictate cell to cell
interactions and it is important to see how the behavior of one cell can influence those
around it and how that affects the overall health and function of the entire population (Yin
and Marshall, 2012).
2.2 Growing field
Single cell analysis is a field that has developed rapidly in the last decade, but it still
needs significant improvement and development before it can reach its full potential. At
this point people are taking many different approaches in order to determine what works
best, but there are still many unmet needs. The importance of single-cell analysis has
caught the attention of the US National Institutes of Health (NIH). The agency launched a
program to fund advances in single-cell research, with a budget of $90 million over five
years. The NIH recognizes the current shortcomings and challenges that come along with
single cell analysis, but they also recognize the importance of this research and the
potential that it has to improve our understanding of cell responses which will aid in better
detection and treatment of diseases. This program funds research in a wide array of
disciplines and applications and is geared toward changing the field of single cell analysis
from a small highly specialized group of researchers, and making it more widely used and
accessible by promoting commercialization (Single Cell Analysis Program, 2015).
14
2.3 Applications
In order to further improve single cell analysis, simple and reproducible techniques
should be developed. There also exists a need to develop a method for culturing and
expanding single cells for an extended period of time. If rare cells are captured and
expanded, cell lines of rare cell types can be created. Rather than performing experiments
using existing cell lines, which may be easy to grow but do not demonstrate the behavior
found in rare cells, these cell lines could be used in order to create a more realistic cell
culture where specific conditions need to be met in order for the experiment to be
successful. Another application is cell-cell interactions. By isolating individual cells, certain
cell types can be forced to interact in order to see their behavior and the way the cells
interact with each other. Further experimentation can be done by co-culturing the
individual cells together in hopes of advancing tissue engineering. By studying how the
cells interact with each other, it can help to determine what cells types and environmental
conditions are necessary for organ growth. Another limitation is that some methods
depend on the size of the cell, but whether the cells are in in the process of dividing or
already divided, the cell is always changing its size, which makes it difficult to use some
methods (Carlo, 2012).
A promising application that stems from single cell analysis is personalized
medicine. Personalized medicine tailors drug regimens to a specific patient based on how
their cells respond to certain therapies. While personalized medicine is not the creation of
novel drugs for individuals, it is the classification of individuals to sub populations who will
most benefit from preexisting and defined therapies, especially cancer therapeutics. Ideally,
a patient’s tumor sample would be isolated into single cells then exposed to different drugs
15
so doctors can determine which treatment is most effective for that patient and the specific
type of cancer cells present. Cancers vary widely because of their rapidly changing genome.
Cancer cells, even within the same tumor biopsy sample display distinct molecular
differences which lead to the development of different assays to provide prognoses (Bates,
2010). Tailoring treatments to patients who are most likely to respond to them has
incredible potential for improving cancer prognosis and patient outcomes.
2.4 Current single cell analysis devices
2.4.1 Gold standard
Currently, a majority of single cell analysis is done using flow cytometry. With flow
cytometry, hundreds of thousands of cells can be analyzed per minute. The cells can be
sorted by their size, granularity, and fluorescence properties (Carlo, 2012). The method of
flow cytometry does not require a lot of time and is easy to perform.
Though many researchers, scientists, medical workers, etc. use flow cytometry, for
the goals of our project, a combination of other methods seem to be more beneficial. Flow
cytometry requires expensive devices and the cells are discarded after each test, so the
cells cannot be studied over a more relevant period of time or beyond a single experiment.
2.4.2 Single Cell Isolation Methods
The different methods of isolating single cells span a diverse spectrum. There are a
number of mechanisms utilized and the processes vary greatly in complexity. A general
overview of the methods that have been used successfully in the past will highlight the
main advantages and limitations of each method to exemplify how they are selected for
specific applications. Here, we present a sampling of common single cell isolation
techniques. A more detailed list can be found in Appendix A.
16
One of the earliest and simplest methods of single cell isolation is serial dilution.
This process entails repeatedly diluting a cell suspension until only single cells remain.
Serial dilution is not a complicated process and requires only basic lab equipment such as
micropipettes, microtiter well plates, and a microscope. Since the process results in cells
contained within microwells, the cells are accessible and are compatible with many assays
and standard cell culture techniques (Ishii, 2010). Despite the simplicity of this method,
many of its limitations derive from its lack of automation. This process is done manually
and is therefore very labor intensive and time consuming. The technique has very low
throughput as a result, which reduces the probability of finding target cells especially if
they are rare cell types (Ishii, 2010).
Another method that is relatively straightforward and fits the capabilities of most
labs is micropatterning. Micropatterning can utilize a variety of techniques, material
combinations, and surface treatments depending on the application. Micropatterning uses
different surface modification mechanisms to create cytophilic and cytophobic regions that
guide cell attachment. By designing cytophilic regions only large enough to permit a single
cell to adhere, single cell isolation is achieved. An advantage of this method is that the cell
containing regions can be made into any size or shape to adjust to specific cell types and
the pattern can be scaled up to achieve desired throughput. Another attractive feature of
this methodology is that the cells are accessible and therefore easily maintained. Media and
other supplemental nutrients can be flowed over the immobilized cells for convenient
exchange, but one must consider the shear stress caused by media perfusion and ensure it
will not result in cell lysis. Different techniques of micropatterning vary in complexity. For
example, this process can be simplified so that it doesn’t require a microfabrication process
17
and can be done with standard laboratory materials as described by Lin et al, 2009 in a
Microscale Oil-Covered Cell Array (MOCCA). In this process, a glass slide is treated to make
it hydrophobic. It is then plasma treated while covered with a micropatterned aluminum
screen that created small hydrophilic circles where cell containing drops will form on the
slide. A cell suspension is poured over the treated glass slide, followed by mineral oil that
forms and seals droplets as it moves across the slide. This process is done manually,
without the requirement of controlled flow rates that require significant background
knowledge and planning to achieve. This makes the process extremely practical, and it
appeals to more users (Lin et al, 2009). Micropatterning can also incorporate
photolithography to create more intricate patterns. For example, McDevitt et al (2001)
used laminin coatings on polystyrene tissue culture plates to encourage cardiomyocytes to
assemble single file and form multinucleated myofibrils. A linear pattern was designed and
soft lithography was used to create a PDMS stamp of the device. Laminin was applied to the
stamp and the design was then transferred to a polystyrene tissue culture plate. Individual
cardiomyocytes were able to adhere to only the laminin patterned areas that were one cell
wide. The researchers then saw cell fusion and coordinated contractile activity (McDevitt et
al, 2001). Here, micropatterning was used to manipulate individual cells to form complex
arrangements typically found exclusively in vivo to create a more accurate platform for
studying cardiac activity at the cellular level. Using photolithography and soft lithography
significantly elevates the complexity of the process and creates a need for more expensive
and complicated equipment. A limitation of these methods is that they are only compatible
with adherent cells that are capable of binding to the surface. Once cells are in the array it
is not possible to remove particular cells of interest or to manipulate single cells since all
18
cells are exposed to the same factors. Lacking the ability to move or target specific cells
restricts the possibility of further processing or expansion.
Microdroplets are an additional method of single cell isolation. Droplets can be
generated using multiple techniques, and usually result in a single cell that is encapsulated
in an aqueous solution surrounded by a carrier oil. Microdroplet formation allows for high
throughput; some have been shown to generate droplets at rates exceeding 10,000,000 per
second. However, not all of these droplets contain single cells and the percentage of
successful single isolation may be lower than is desirable (Lindstrom and H. AnderssonSvahn, 2010). The volume of microdroplets usually ranges from several nanoliters to
microliters (Mazutis et al, 2013), and allows the droplet to function as a microreactor for
the encapsulated cell. The small volume allows the cell’s secretions to quickly change the
concentration within the droplet to detectable levels, and this information can in turn be
used to analyze or sort cells (Mazutis et al, 2013). The individual droplets don’t allow crosscontamination between drops and do not allow cells to influence each other as long as
coalescence is prevented. In order to lower the risk of coalescence, drops need to be
stabilized, usually with the use of a biocompatible fluorinated surfactant. These surfactants
can be very expensive, around $1,000/mL. One of the most appealing characteristics of cell
containing microdroplets is that they can be sorted and manipulated in many ways while
still maintaining integrity and isolation. Droplets are compatible with cell culture and are
shown to survive for several days without being removed from their original droplets
(Clausell-Tormos et al, 2008). All of these characteristics make this method versatile and
give it great potential in current and future applications.
19
2.4.3 Limitations of Current Single Cell Analysis Techniques
Limitations of some previous techniques are that they are not high throughput.
Only a few cells can be tested at a time, so a large number of tests have to be performed one
after another. This is much less efficient than running parallel experiments where all cells
can be tested at once under the same conditions. Another limitation is that cells are not
able to be analyzed over a long period of time. Often, cells are discarded, mixed, and not
cultured in media, so they will not survive long enough to be analyzed further. Also, since
many experiments are done on a larger-scale, on 96 or 364 well plates, the environment is
much larger than the size of the cell, so it’s hard to control the environment of the cell. The
experiments and assays that can be performed are also limited because of the single-cell
analysis method. Another disadvantage to some techniques is that they do not prevent
contamination between different cell types. For accurate single cell analysis techniques,
this is essential. During the process of some separation techniques, the cells can be exposed
to residues or chemicals and this adds an uncontrolled variable that could influence cell
behavior, which is another disadvantage (Carlo, 2012).
2.5 Microfluidics
2.5.1 Why use microfluidics
The goal of our project is to create a device that is inexpensive, reproducible and
marketable to scientists and researchers. The device should also be able to view the cells
over a biologically significant time period. A method that has a high throughput is a
necessity for our device. The device needs to trap cells in a way that allows further
experimentation to be performed. Microfluidics is a technique that has been proven to
successfully isolate single cells and expand them over a relevant time period, beyond the
scope of most single cell analysis techniques
20
Microfluidics is the study of fluids in the scale of nanometers to a few hundred
microns. Microfluidic applications were previously restricted to silicon based devices but
have since expanded to life science applications since the development of soft lithography
techniques that have allowed for polymer based applications. Microfluidics are appealing
to those performing research in cell biology because of their small size, customization, and
diagnostic potential (Streets and Huang, 2013).
Microfluidics is an emerging field that has been show to effectively isolate single
cells and culture cells in three dimensional constructs over a period of time. In these
systems it is easier to control the cells. The suspension flows into the device and the
geometry and channels arrange the cells to be cultured. These microfluidic devices
typically incorporate a network of small channels that range from about 10 microns to 200
microns in width. The microfluidic systems can have very specific designs for certain
studies, making them more customizable than a simple petri dish. For example, there can
be gradients, valves, channels, wells, or pillars incorporated into the device. Microfluidics is
beneficial for single cell analysis because features like wells or pillars can be used to
capture the single cells and allow them to stay isolated from each other.
Microfluidics has the ability to control fluids at a very small scale and can create
systems with laminar flow rather than turbulent flow. Using different types of flow driven
by either hydrostatic pressure or syringe pumps gives precise control of flow rates in the
devices, and allows cells to be processed without being damaged by rapid or uncontrolled
flow rates (Mehling and Tay, 2014). Like common cell culture techniques, microfluidics can
allow cells to be maintained over a long period of time, but the system is more automated
21
because there is limited need for pipetting fluids, which reduces user variability and gives
more predictable and reproducible results. Microfluidics also offers precise control over
the microenvironment of the cells due to the small volumes of reagents used, and the
microenvironment can be adjusted to more closely mimic the in vivo environment (Folch,
2013). Since the volumes of reagents required are on the nanoliter scale, devices are cost
efficient to run and produce very little waste.
Another advantage to microfluidics is the high throughput. Microfluidic devices
allow for parallel experiments, so many cells can be tested at once to yield a large quantity
of results (Folch, 2013). For example, droplet generation is an efficient method of isolating
single cells in a microfluidic device while retaining high throughput. This technique
preserves the viability of cells and allows for cells to be manipulated within the droplet
rather than having to be removed from the system and manipulated manually with a
micropipette (Mazutis et al, 2013).
We have provided the necessary background for understanding all aspects of our
project. Single cell analysis by way of single cell isolation and single cell culture has been
explained in depth. Next, we will talk about the objectives and constraints of our projects
and the specific functions of our designs.
22
Chapter 3: Project Strategy
3.1 Initial Client Statement
After speaking with our advisor, the initial client statement read:
“The aim of the project would be to develop a system that would isolate and expand single
cells from tissue biopsies. The system created must be able to trap and expand the cells in
micron sized hydrogels of varying stiffness representing different tissues. Ideally, the
system should allow placement and/or arrangement of cell laden microgels to produce
precise geometries that can facilitate organ engineering, tissue engineering and the study
and analysis of cell-cell interactions.”
Our client expressed a desire for a microfluidic device because of the range of
applications it’s compatible with. Microfluidics is an emerging field and is best suited to the
resources available here at WPI. There are opportunities to introduce a novel concept to
the field of single cell analysis using microfluidic devices that are cost efficient. After
further research, we determined it was necessary to expand the scope of our project.
3.2 Objectives
Using our initial client statement, we established a list of objectives that would need
to be met in order to successfully complete the project to the satisfaction of our client.
These objectives can be seen in the objective tree below in Figure 1, and are further
explained after.
23
FIGURE 1: OBJECTIVES TREE
Compatible with common cell culture techniques: Since cells are to be flowing through
our device, we thought that compatibility with cell culture techniques was most important.
Without the correct cell culture technique, the cells will not survive; therefore our device
will not be useful.
Compatible with common microscopes: Once single cells have been isolated, they need
to be analyzed. In order for our system to be useful in a wide range of labs, it has to be
compatible with common laboratory equipment. By bonding PDMS to a glass slide it gives
the system transparency, and the cells inside can be analyzed using a common light
microscope.
Accurate: The main function of our system is isolating single cells, so it is important that it
can do so accurately. If cells clump or if more than one is isolated in the same bubble or
24
pocket, the user can’t analyze them as single cells, and extra steps would need to be taken
to further separate them.
Precise: Ideally we want our device to be able to do a large number of tests and analyze a
large number of cells at once, so the device should be able to isolate a large number of
single cells.
Inexpensive: This is most applicable to completing our project while staying within our
$365 budget. The resulting device is going to be extremely inexpensive compared to other
single cell separating technologies that are currently on the market, which will be one of its
key features.
High Throughput: This objective isn’t essential in order for our device to function,
however it would be a desirable feature. It would make the device compatible with
applications that require a large number of cells to be processed and screened and it would
make it more marketable. However, 100 is the median number of isolated single cells used
per experiment (Single Cell Technologies Trends, 2014), so this is a realistic number to aim
for.
Primary Objectives
● compatible with common cell culture techniques
● compatible with common microscopes
● accurate
● precise
● inexpensive
25
● high throughput.
Secondary Objectives
● compatible with 2D and 3D cell culture
● compatible with a variety of cell culture techniques
● compatible with light/fluorescent microscopes
● should be transparent
● should be transportable
● should fit in a typical slide holder
● should capture a single cell
● should be able to capture a large number of single cells at once
● should not exceed $356
We then ranked our objectives using a pairwise comparison, shown below in Table 1:
TABLE 1: PAIRWISE COMPARISON CHART
Pairwise Comparison Chart
Compatible
with Cell
Culture
Inexpensive
High
Throughput
Precise
Accurate
Compatible
with
Microscopes
Varity of Cell
Types
Compatible
Compatible Variety
with Cell
High
with
of Cell
Culture
Inexpensive Throughput Precise Accurate Microscopes Types Score
1
1
0
0
0.5
1
3.5
0
0
1
0
1
0
1
0
0
0
1
1
3
2
1
1
0.5
0
0
1
1
1
1
0.5
0
0.5
1
1
1
1
1
3.5
3.5
3.5
0
0
0
0
0
0
0
0
26
After identifying each of our objectives, our team utilized a pairwise comparison
chart to establish a ranking of our objectives according to their importance and relevance
to our project. In this chart each of the objectives are compared to the others one by one. In
each comparison, the more important objective receives a 1 and the less important
objective receives a 0. If the two objectives are of equal importance they each receive a
score of 0.5. These scores are then totaled horizontally, and their final score determines
their ranking with the highest scoring being most important and the lowest scoring being
least important.
3.3 Revised Client Statement
Our final client statement reads as follows:
“The aim of this project is to develop an efficient system to isolate single cells from
tissue biopsies. Ideally, the device should allow multiple applications such as (a) sorting of
single cells from cell lines or tissue biopsies for clonal expansion and analysis (personalized
medicine), (b) high throughput- ability to screen multiple pharmacological agents on
hundreds of clonally expanded cells.”
27
3.4 Project Approach
Design
Draftsight
Software
Assessment
Fabrication
Eliminate or
improve designs
Photolithography
& Bonding
Testing
35-48 um beads in
mineral oil
FIGURE 2: DESIGN PROCESS
After establishing each of our objectives and ranking them in order of importance,
we used them to assess different design ideas. A thorough review of current literature on
microfluidics gave our team an idea of what is currently being done in terms of single cell
separation with microfluidics and what is possible and realistic. We were able to use some
of our original ideas in combination with concepts demonstrated in contemporary
literature to develop a set of preliminary designs.
Figure 2 demonstrates a brief outline of our design process. Each cycle begins with a
basic drawing in DraftSight. In order to determine the effectiveness of each design the
devices need to be fabricated and tested. After each design is tested, it is either eliminated
or improved upon, and then the next iteration begins.
28
Chapter 4: Alternative Designs
4.1 Needs Analysis
Our device needs to isolate single cells and allow for further analysis of individual
cells. The single cell isolation would create a homogenous cell population so that the
behavior of the cells is specific to that individual cell and the testing can take into account
the different cell types present in a tumor biopsy. We would like the single cells to be able
to be removed from the device for further testing, but we realize this may not be possible
due to the time constraints of our project. Our device must create a system to efficiently
isolate the single cells. It is preferable that the method of separation is a semi-automated
microfluidic device, based on the client statement.
Preferred method of separation
Separation mechanism must not cause cell lysis
Cells must be10 microns apart to be considered isolated
4.2 Functions (Specifications)
The function of our device is to capture single cells in wells. To accomplish this
successfully, the cells must remain isolated and not contact any other captured cells. The
device must capture single cells so that when treatments are tested using our device, the
researcher can see the behavior of every individual cell and not just a representative
behavior of the entire population of cells. A specification of our device is that minimally
50% of the wells have to be filled with a single cell. Some may have more than one cell or
no cells. This specification is necessary to create a high throughput system. The single cells
are the ones that will be studied, so this specification ensures that there will be a higher
number of single cells to investigate.
29
4.3 Conceptual Designs
4.3.1 Alternative Design 1
The first device we tried was based on the publication Microscale Oil-Covered Cell
Array (Lin et al, 2009). We created a simple system where a cell suspension would be
poured over a grid of microwells. The suspension would be manually spread over the top
surface of the PDMS to ensure cells have spread over the entire surface and reached all of
the wells. The goal was to have cells fall into wells that were just slightly bigger than the
size of the cells, so that no more than one cell could fit in each well. After cells are allowed
to settle into wells and the excess suspension is removed from the top surface, a second
microfluidic device would be flipped over and placed on top of the grid of wells. The top
device would have wells much bigger than the cells and would have channels connecting
the wells that allow media to flow through them. The diameter of the bottom wells ranged
from 15 to 100 microns whereas the wells on the top device were 800 microns in diameter.
The top device would be the method of cell culture media perfusion. The larger well size on
the top would also allow for the cells to expand (Figure 3).
FIGURE 3: ALTERNATIVE DESIGN 1
30
After creating this device and conducting preliminary testing, we discovered the
difficulty associated with aligning the larger top device above the smaller wells. We
included square markers in the upper corners of each device to assist with alignment but
the devices must be placed under a microscope to properly visualize these place-markers.
This restriction limits the reproducibility and ease of use of this device, because
misalignment of the two devices is likely to cause malfunction. We were able to capture
single cells in over 50% of the wells in the bottom device, but another reason we did not
choose this device is because it would not be sufficient for a mixed cell population. When
the device is designed, a specific well size is chosen and all the wells are the same size. If
there were varying cell sizes, only some of the wells would be trapping single cells because
some may be trapping 2 smaller cells or they would be unable to trap the larger cells.
Another problem with this device is that cells would not be able to be easily removed from
the device. A biopsy punch could be used to punch out a cell of interest, but once the cells
started growing, the cells would become mixed populations if they were to flow out of the
microfluidic device. Though we liked the simplicity of this device, we decided to pursue a
different device that would be easier to use and would be useful for a wider variety of
applications.
4.3.2 Alternative Design 2
We created a device that uses a droplet generator as the mechanism of single cell
isolation. This design idea came from a recent publication (Chabert, 2008). In this device, a
cell suspension would flow through the center channel where it is met by two streams of
mineral oil, one on each side, in a flow focusing channel. This forces the formation of
droplets, ideally capturing one cell in each droplet. The droplets are then sorted using
31
hydrodynamic flow so that that large, cell containing droplets drift to one side of a barrier,
while empty droplets move to the other. This leads empty droplets to flow out one outlet to
be discarded, while cell containing droplets flow to the other outlet where they can be
removed or put in a second device where further testing and manipulation can occur. This
device relies on delicate flowrates that dictate how efficiently the system works, and these
would have to be adjusted and finely tuned for each cell type, which takes away from the
device’s adaptability. Another drawback of this device is that it required fluorinated oils
and surfactants to keep droplets from merging together, and these far exceeded the budget
of this project. We decided this device would not be feasible for our team to use (Figure 4).
FIGURE 4: ALTERNATIVE DESIGN 2
32
4.3.3 Alternative Design 3
Next, we designed a device based on a serpentine channel with one well on each
side of the horizontal portions of the main channel. The wells have a tiny channel
connecting them, which creates a valve system. In this device, a cell suspension flows from
the inlet to the outlet, ideally capturing a single cell in each well. When cells pass the wells
the downward flow through the tiny channel would pull them downwards and trap them in
the well. Once a cell is trapped it blocks the tiny channel and cuts off the downward flow,
preventing other cells from drifting into the well with it. This device would allow for media
perfusion so cells can be cultured within the device, or they could be easily removed by
reversing the flow from the outlet to the inlet, which would push cells out of the wells.
When testing the device, we discovered that the channels connecting the wells were too
wide, so our suspension flowed in a vertical line from the inlet to the outlet rather than
back and forth through the channels, and nothing was trapped in the wells. Time
constraints prevented us from redesigning this device with more appropriately sized wells
and channels, but we do believe this device has potential as a simple method of single cell
isolation (Figure 5).
FIGURE 5: ALTERNATIVE DESIGN 3
33
4.3.4 Alternative Design 4
The next device that was tested was a simple serpentine device. From the inlet to the outlet,
the device had one channel shaped as a serpentine that was aligned vertically. On the horizontal
segments of the channel, there were 3 wells that took the shape of a semicircle and were
approximately 60 microns in diameter. In this device, cells would start in the inlet and flow through
the single channel towards the outlet. The goal was to have cells fall in the wells as they flowed
through the device. Since the wells ideally, would only be large enough to hold one cell, single cells
would be isolated. When watching the flow through the microscope as the device was being tested,
there were beads flowing over the tops of the wells without being trapped. We determined that the
flow rate was too high. Once we lowered the flow rate, the beads were still not getting trapped,
there was nothing pulling the beads from the main channel into the wells. With further testing and
modifications to the size and shape of the wells, this device could have potential. We were unable to
establish a method of removing any captured cells or beads, and we eliminated this design because
of its initial inability to capture any single beads (Figure 6).
FIGURE 6: ALTERNATIVE DESIGN 4
34
4.3.5 Alternative Design 5
This brought us to our last design (Figure 7).
FIGURE 7: ALTERNATIVE DESIGN 5
Similar to the previous design, it would have wells along the horizontal part of the
channel. Connecting the well and the next horizontal portion of the channel flowing
underneath one row of wells would be small rectangles that are smaller than the size of the
beads. The wells were 60 microns in diameter and the small channels were 20 microns
wide, designing the pocket in which cells would ideally be captured. These small rectangles
provided the suction that the beads needed to be isolated in the wells. This design was
simple and did not require a precise flow rate, so hydrostatic pressure could be used to
drive fluid flow through the device. A microscope image of this device can be seen in Figure
8.
35
FIGURE 8: ALTERNATIVE DESIGN 5, MICROSCOPE VIEW
4.4 Feasibility Study/ Experiments
Based on the complexity of using microfluidic devices, we determined that removing
the cells from the device would not be feasible for our team. The process of manufacturing
and testing devices included many steps and took a long time, therefore creating a device
solely for single cell isolation would be the only process feasible in our timeframe. The next
step in improving our device would be creating a method to remove the cells from the wells
and place them in another microfluidic device where they could be cultured for a longer
period of time in order for long-term studies to be performed.
4.5 Modeling
4.5.1 Design Calculations
We trypsinized PANC1 cells to determine what size would be required for the wells
to be able to isolate just one cell. The trypsinized cells were approximately 40 microns, so
we decided to design the wells to have a diameter of 60 microns. This size would allow
enough room for a single cell to settle in the well and prevent another from entering. The
36
small vertical rectangular channel underneath the well had a width of 20 microns, so this
prevents the cell from flowing through.
4.5.2 Decisions
Because of our budget, we decided that using the expensive surfactants needed for
the droplet generator or the design iterations that required a new photomask for the other
designs were not possible for our team. This left the air pocket design with the wells as the
primary option for our team.
4.5.3 Optimization
We decided to create our device out of PDMS because it would allow us to make
more devices for a lower cost. We also produced designs with a variety of well sizes on the
same photomask to reduce cost and increase the chances of success with one of these
devices.
4.6 Preliminary Data
TABLE 2: PRELIMINARY DATA (GRID OF WELLS DEVICE)
This table shows the preliminary data collected from the grid of wells device
(Alternative Design 1). After pouring the cell suspension over the device and letting the
cells fall into the wells, the wells were inspected to determine whether there was a cell
present in the well. Table 2 shows, out of 81 wells, how many wells were empty or filled.
Though this device had success capturing cells, it could not be determined if there was one
37
cell or more than one cell in each well. As described above, there were other characteristics
of this device that resulted in discontinuing experiments with the grid of microwells.
38
Chapter 5: Design Verification
This chapter verifies that we met our ranked objectives, which were: compatibility
with common cell culture techniques, compatible with common microscopes, accurate,
precise, inexpensive, and high throughput. Testing our devices with fluorescent beads
verified compatibility with microscopes, accuracy, precision, and the ability to be high
throughput. Testing of our devices with fibroblast cells verified the compatibility with
common cell culture technique.
5.1 Device Fabrication
Devices were created using “DraftSight software. A photomask was created at
CAD/Art Services Inc. and returned back to us. Using standard photolithographic
processes, the designs were transferred from the photomask to a silicon wafer, some steps
are shown in Figures 9 and 10.
FIGURE 9: SILICON WAFER SPINCOATED
WITH PHOTORESIST
39
FIGURE 11: SILICON WAFER EXPOSED TO
UV LIGHT
The photomask contained 3 wafers of designs, each wafer containing 12 devices. PDMS was
poured over the silicon wafer and baked. The devices were then cut from the PDMS mold and
plasma bonded to a glass slide, shown in Figure 11.
FIGURE 10: PDMS DEVICE ON GLASS SLIDE
42
5.2 Device Setup
In order to start testing the device, a syringe setup needed to be attached to the device. The
device setup is shown in Figure 12. One vertical syringe was to hold the suspension and the
horizontal one was to hold fluid in order to flush or prime the device. The tubing from the syringe
was then inserted into the inlet hole in the microfluidic device.
FIGURE 12: DEVICE SET UP
5.3 Proof of Concept Testing
In order to perform proof of concept testing, we used polyethylene fluorescent beads
ordered from the company, Cospheric© (Product ID: UVPMS-BR-1.20) with diameters ranging
between 38 and 45 microns. This size was chosen because they are similar in size to trypsinized
PANC1 cells. To prevent clumping of the beads in the devices, a solution of Tween surfactant was
created (Appendix D). The fluorescent beads were added to the Tween and water solution and
spun. Depending on the desired density, 0.25g or 0.5g of the beads and Tween were added to
mineral oil and placed in the vertical syringe. The device was flushed with oil to clear dust or PDMS
particles and the syringes were primed to remove bubbles. Hydrostatic pressure was created in
43
the device to initiate flow, and flow from the top syringe was turned on, causing beads to flow into
the device. Beads flowing through the main channel, and were too small to flow through the small
vertical rectangular channels, causing some to get trapped in the wells.
5.4 Cell Testing
Fibroblast cells were used to test in the devices to determine if they were compatible with
cell culture techniques and to determine if the devices were able to capture single cells. Since cells
were able to go in suspension in the water, water and media were used to flush the device and
prime the syringes. Since a surfactant wasn’t being added to the solution, Pluronic-127 was
pipetted into the device and let sit to coat the sides of the device in order to reduce the clumping of
cells. A suspension of cells at a density of 20,000 cells/ 1 mL was added to the top syringe. Again,
hydrostatic pressure was created to initiate flow, and cells were allowed to flow through the
device.
44
Chapter 6: Discussion
6.1 Proof of Concept Testing
The results of this device were unique because when using beads, the small channels
underneath the wells created suction because of the oil flowing in the main channel above as well
as below the small channels. The suction was able to pull the beads into the wells, causing them to
get trapped and remain in the wells as others flowed past them in the main channel. The design of
this device was based on a previous publication On-site formation of emulsions by controlled air
plugs (Huang, 2014) where they used a similar device to create air bubbles within their device. We
modified the design and operating protocol to allow us to isolate single beads or cells and then
contain them individually within droplets.
By varying the density of the beads in the suspension, the number of beads getting trapped
in the wells would change. Using 0.5g of beads in the suspension was creating a density of beads
that was too high, and multiple beads were getting trapped in one well, usually up to three beads
per well (Figure 13).
FIGURE 13: BEAD CAPTURE AT 0.5G DENSITY
When the amount of beads was reduced to 0.25g, single beads were trapped in the 60
micron diameter wells (Figure 14).
45
FIGURE 15: BEAD CAPTURE AT 0.25G DENSITY
Using one of the bigger devices resulted in beads getting trapped in multiple rows of the
device, shown in Figure 15.
FIGURE 14: MULTIPLE ROWS OF SINGLE
BEAD CAPTURE
Working with an oil suspension for the beads made it very difficult to get flow from
hydrostatic pressure in the device. Oil had to be used because the beads would not stay in
suspension when they were in water. The beads wanted to stick to the sides of the syringe, so they
would not flow into the device. Therefore, we decided to use mineral oil, but because of the change
in viscosity between the mineral oil and water or media, the flow rate drastically changed and it
was more difficult to achieve natural flow without forcing fluid into the device. This often caused
the 3-way valve to get clogged with oil and beads and would prevent anything from flowing into
the device.
Another challenge that occurred when flowing fluid through the device was dust or PDMS
particles clogging the channels. Because we were not in a clean room and not under sterile
46
conditions, dust or remnant PDMS particles were often appearing in the device after it was flushed
initially with oil. Since the channels were only 80 microns wide, this meant that single particles of
dust or PDMS would completely clog the channels and not allow beads to get trapped in the wells
(Figure 16).
FIGURE 16: DUST CLOG
We also faced challenges in the proper fabrication of our device. We needed to incorporate
small features into our device to capture beads and cells but plasma bonding such small features
posed a problem. In Figure 17, we show a bead that was able to flow under small features that had
not been plasma bonded to the glass slide. For future work, the aspect ratio (height:width) could
be adjusted to increase the stability of these features. We developed our silicon wafers with a
height of 80 microns. A shorter height may increase stability and the likelihood of features bonding
appropriately to the glass slide.
47
FIGURE 17: POORLY BONDED FEATURE WITH BEAD
Optimization of suspension density and minimization of dust are factors that could greatly
improve the throughput of our device. Once our device yields a higher throughput, we would be
able to determine how well the device meets the objectives of accuracy and precision. We were
unable to obtain numerical data and further testing is required to determine the accuracy and
precision of this device. To obtain this data we would want to flow bead suspensions through the
device until wells were filled. We would then calculate the percentage of single beads isolated in
wells compared to empty wells or wells containing multiple beads. We would run these trials in
triplicate and then repeat these same tests with a suspension of PANC1 cells.
48
6.2 Cell Testing
After getting results with the fluorescent beads, we tested the device with cells. To start, we
used human primary fibroblast cells. When flowing water through the device to start, there were
air bubbles that were formed in the small rectangular channels underneath the wells (Figure 18).
The air bubbles were a positive result of this device because these could later be utilized to help
removed the cells from the device. These were formed because the channels were too small to
allow any water to enter. After flowing the water, media was flowed through to coat the device
before flowing cells. When the fibroblasts entered the devices, they were too small to get trapped
in the wells. The cells would flow into the wells and the small channels and none were getting
isolated. Because of time constraints, we were not able to change the cell type or the size of the
device. For future testing of these devices, the first method of testing would be using a larger cell
type like the PANC1 cells.
FIGURE 18: AIR BUBBLES PRESENT IN CELL
TESTING
Our device was able to meet some of the objectives we established for this project. The
device is able to be used with common microscopes. We have been able to use our devices
successfully with both a fluorescent and a light microscope. Our device is also compatible with
common cell culture techniques. It has the ability to be used in the hood and it is able to be
sterilized by autoclaving which is a common sterilization technique that is available in most labs.
Microfluidic devices made of PDMS are frequently used for cell culture applications and while we
49
did not specifically test for cell viability, we can assume they will be biocompatible. It is also
relatively inexpensive. The cost to start producing these devices would be expensive because of the
costs of a clean room and the photomasks, but after those are acquired, the cost is cheap. All that is
needed to produce the devices would be silicon wafers and the materials to make PDMS. These
devices, while they have demonstrated potential, have not been high throughput up until this
point. Optimization of suspension density and minimization of dust are factors that could greatly
improve the throughput of our device. Once our device yields a higher throughput, we would be
able to determine how well the device meets the objectives of accuracy and precision. We were
unable to obtain numerical data and further testing is required to determine the accuracy and
precision of this device. To obtain this data we would want to flow bead suspensions through the
device until wells were filled. We would then calculate the percentage of single beads isolated in
wells compared to empty wells or wells containing multiple beads. We would run these trials in
triplicate and then repeat these same tests with a suspension of PANC1 cells.
While we are able to make very preliminary assessments about the success of our device,
more testing is required and more data must be gathered before any conclusive statements can be
made. Our trials were not reproducible and adjustments to the device protocol must be made.
6.3 Design Considerations
6.3.1 Economics and Society
Our device provides a low cost method for single cell isolation, leading to the possibility of
analyzing gene expression or clonal expansion for varied applications such as development of pure
populations of cells, drug and molecule testing. The device size can also be increased to lead to
higher throughput and increased cost-effectiveness.
50
6.3.2 Environmental Impact
The devices and associated set up are single-use only and would therefore create some
plastic waste. However, only the research community would be using these devices and the impact
should remain relatively small. The protocol could be optimized to reduce waste and this would
also increase the sustainability of the device.
6.3.3 Political Ramifications
This project has very minimal projected political ramifications. This device would be used
for research purposes and would therefore have limited impact on cultures of other countries even
though it may affect the culture of scientific research by producing a shift in the paradigm of cell
analysis and traditional culture techniques.
6.3.4 Ethics
Our project follows good ethical practices because it does not require any animal or human
testing. The only testing done in our devices uses previously established cell lines. When
eventually using human tumor samples, privacy considerations should be upheld to protect patient
confidentiality.
6.3.5 Health and Safety
As long as the device is used for the purposes described in the report, we do not see any
health and safety concerns for users.
6.3.6 Manufacturability
The most expensive part of manufacturing the device is the cost of a clean room. Assuming
a company already had access to a clean room, the only costs would be printing photomasks and
transferring the designs onto the silicon wafer. The photomask is approximately $120 including
shipping and the silicon wafers are approximately $7 per wafer. The photomask makes 3 wafers,
so each wafer costs about $47. Each wafer will make 12 devices. A company could make the silicon
wafers for $47 dollars and send them to labs who would only have to pour the PDMS, which would
51
be inexpensive for them. For us to pour the PDMS as well, each device costs around $4.91. But a
company could sell the silicon wafers instead of manufacturing the PDMS molds, so each device
would come out to around $3.91, 1 silicon wafer being $47. The device is very reproducible. Once
the design is made in DraftSight, the steps following are very standard procedures. The photomask
is made from the computer image and the design is transferred to the silicon wafer. PDMS is then
poured over the wafer. If the protocols are followed correctly, the device will be very reproducible.
52
Chapter 7: Final Design and Validation
7.1 Device Fabrication
1. Devices were created using the “DraftSight” software. Features were dimensioned and the
polarity was indicated to determine which features were raised and which were channels.
2. 1 silicon wafer was produced with 12 devices, including some duplicates.
3. On the photomask, the features that would stay as solid PDMS were clear and the channels,
wells or inlet/outlet holes were black.
4. The Designs were sent to CAD/Art Services Inc. in order for a photomask to be produced
with our devices.
5. Using the standard photolithography process described in Appendix B, the designs on the
photomask were transferred to a silicon wafer.
6. PDMS was then poured over the wafer and baked at 65 degrees C overnight after the wafer
was fluorinated; the full soft lithography process is described in Appendix C.
7. The devices were cut out from the PDMS slab, inlet and outlet holes were punched, and the
device was plasma bonded to a glass slide. The protocol for plasma bonding is also
described in Appendix C.
8. Devices were then ready to be tested.
7.2 Device Setup
1. A three-way valve was connected to two syringes and a luer valve. The luer valve was then
attached to plastic tubing. The syringe setup is shown in Figure 19.
53
FIGURE 19: SYRINGE SET UP
2. One syringe held about 5 mL of the suspension to flow into the device. The second syringe
had about 1 mL of a solution used to flush the device to minimize dust before the solution
would flow into the device.
3. The plastic tubing connected to the luer valve was inserted using a metal pin into the inlet
of the device, shown in Figure 20. A second set of tubing and pin was inserted into the
outlet and ran into a small petri dish to collect the fluid.
FIGURE 20: TUBING AND METAL PINS
INSERTED INTO DEVICE
54
7.3 Proof of Concept Testing
1. The detailed protocol to make the Tween20 surfactant is described in Appendix D.
2. About 90 uL of the Tween20 was added to 100 mL of boiling DI water and mixed for about
30 seconds. This created a 0.1% Tween solution.
3. About 2.0 mL of the Tween and water solution was added to 5g of the fluorescent beads.
4. The solution with the beads was spun for 5-10 minutes and the clumped beads from the top
of the conical tube were removed.
5. Then 0.25g or 0.5g beads (Depending on the desired density of the suspension) and Tween
were added to 10 mL mineral oil.
6. The conical tube was inverted to mix the beads into the oil.
7. Approximately 5 mL of the solution was added to the top vertical syringe.
8. Approximately 1 mL of mineral oil from the left horizontal syringe was pushed through the
device to clean out any dust particles.
9. The syringes were primed to remove bubbles.
10. The syringe setup was placed about 12 inches above the device to create hydrostatic
pressure. For this device, the flow rate did not need to be precise, so the height during each
trial could vary. The flow from the top syringe was turned on, allowing the beads to flow
into the device at the inlet hole.
11. Beads flowed through the main channels but could not pass through the small horizontal
channels. This would cause some of the beads to get trapped in the wells.
12. As beads exited the device, they flowed out of the outlet and into a small petri dish as waste.
7.4 Cell Testing
1. Water was flowed through the device to reduce particulates in the device, this created air
bubbles in the small channels underneath the wells.
55
2. Approximately 20 uL of Pluronic-127 was pipetted into the inlet in order to coat the device
so cells would remain in solution and not get stuck in channels and would be less likely to
clump.
3. Media was flowed through the device to coat the surfaces that cells would be in contact with
and to flush the Pluronic-127.
4. About 1 mL of media was pulled into the left horizontal syringe.
5. A suspension of cells at a density of 20,000 cells/1 mL was added to 10 mL of media.
6. 5 mL of the cell suspension was poured into the top vertical syringe.
7. The media from the left syringe was manually pushed through the device to clear any of the
remaining Pluronic-127 and dust.
8. The syringes were primed and again, hydrostatic flow was created with a height change of
12 inches between the syringe setup and the device.
9. Flow from the top device was turned on, allowing cells to flow into the device.
10. Again cells would flow through the main channel and out the outlet into a petri dish. In our
test, the cells were too small for our devices and they were able to travel through the small
horizontal channels.
We successfully created a microfluidic device that demonstrated potential to isolate single
beads from a solution. These same principles can be applied to a cell suspension and the device
could be used to isolate single cells from a tumor biopsy sample.
56
Chapter 8: Conclusions and Recommendations
Our device isolated single polyethylene beads. If more design iterations were to be
performed, we believe there is demonstrated potential to isolate single cells from a cell suspension
as well. Large-scale pharmaceutical testing could be done on these cells for applications in
personalized medicine. The cells would remain in their own wells to ensure that their behavior
was from that one specific cell, making it easier to understand how the patient’s individual cells
react to the specific drugs.
Though our device isolated single polyethylene beads from suspension, the next step in
development should allow for a retrieval method of these single beads, or eventually cells. Our
device provides minimal space for the cells to grow and expand, so the cells would not be viable in
this device for a significant period of time. If the isolated cells are retrieved from our device and
transferred to a microfluidic cell culture platform, more effective analysis could be conducted.
This device or a subsequent device could also be manufactured out of a hydrogel such as
gelatin. Cell culture would then occur in a three dimensional environment, more closely mimicking
the way they would grow in vivo. There are existing protocols for creating devices out of a
hydrogel. After making the PDMS mold, a hydrogel is cast over it to create an entirely hydrogel
device. Variable hydrogel stiffness could be obtained to match the tissue of origin of the cells being
studied.
Also it would be beneficial to conduct work in a clean room. Particulate contamination, via
dust particles, frequently clogged channels within the microfluidic device. Clogging prevented flow
through the device and caused device failure. Decreasing the likelihood of dust entering the system
would allow devices to function more successfully and over longer periods of time.
57
Finally, well size could also be altered to tailor the device to more specific application or to
isolate more specific cells. A variety of well sizes could also be used to isolate from a
heterogeneous population as opposed to the homogenous population we used throughout the
course of this project.
58
References
(2015). Single Cell Analysis Program. Available: https://commonfund.nih.gov/Singlecell/index
D. Carlo, Methods in Molecular Biology vol. 853. New York, NY: Humana Press, 2012.
M. Chabert and J.-L. Viovy, "Microfluidic high-throughput encapsulation and hydrodynamic selfsorting of single cells," Proceedings of the National Academy of Sciences, vol. 105, pp. 31913196, 2008.
J. Clausell-Tormos, D. Lieber, J. C. Baret, A. El-Harrak, O. J. Miller, L. Frenz, et al., "Droplet-based
microfluidic platforms for the encapsulation and screening of Mammalian cells and
multicellular organisms," Chem Biol, vol. 15, pp. 427-37, May 2008.
A. Folch, Introduction to BioMEMS. Boca Raton, FL: CRC Press, 2013.
HT Stec Ltd. (2014, October). Single Cell Technologies Trends 2014 [Online]. Available:
http://www.reportsnreports.com/reports/299621-single-cell-technologies-trends-2014.html
X. Huang, W. Hui, C. Hao, W. Yue, M. Yang, Y. Cui, et al., "On-site formation of emulsions by
controlled air plugs," Small,vol. 10, pp. 758-65, Feb 26 2014.
S. Ishii, K. Tago, and K. Senoo, "Single-cell analysis and isolation for microbiology and
biotechnology: methods and applications," Applied Microbiology and Biotechnology, vol. 86,
pp. 1281-1292, 2010.
L.-I. Lin, S.-h. Chao, and D. R. Meldrum, "Practical, Microfabrication-Free Device for Single-Cell
Isolation," PLoS ONE, vol. 4, p. e6710, 2009.
S. Lindstrom and H. Andersson-Svahn, "Overview of single-cell analyses: microdevices and
applications," Lab on a Chip, vol. 10, pp. 3363-3372, 2010.
L. Mazutis, J. Gilbert, W. L. Ung, D. A. Weitz, A. D. Griffiths, and J. A. Heyman, "Single-cell analysis
and sorting using droplet-based microfluidics," Nature Protocols, vol. 8, p. 870+, 2013.
M. Mehling and S. Tay, "Microfluidic cell culture," Current Opinion in Biotechnology, vol. 25, pp. 95102, 2// 2014.
A. M. Streets and Y. Huang, "Chip in a lab: Microfluidics for next generation life science research,"
in Biomicrofluidics. vol. 7, ed United States, 2013, p. 11302.
M. Tibbett and K. Anseth, "Hydrogels as Extracellular Matrix Mimics for 3D Cell Culture," vol. 103,
ed: Biotechnol Bioeng, 2009, pp. 655–663.
H. Yin and D. Marshall, "Microfluidics for single cell analysis," Current Opinion in
Biotechnology, vol. 23, pp. 110-119, 2// 2012.
59
Appendices
Appendix A: Single Cell Isolation Methods
Method
Serial Dilution
(Ishii, 2010)
Advantages
Compatible with standard
microtiter plates, easy to
culture
Microscale OilCovered Cell
Array (MOCCA)
Simple, no microfabrication
required, inexpensive, array
formation only takes 2
minutes, number of droplets
can be changed, only
requires common laboratory
supplies.
Limitations
Manual process, labor
intensive, time
consuming, low
throughput, low chance
of finding rare cells
Plasma treatment
extends beyond the
micropatterend filter and
causes larger droplets to
be formed. Variability in
droplet size. Most of the
process is done manually
Flow Cytometry
‘gold standard’, High
throughput (up to 10,000
cells/s), cells can be sampled
at multiple time points, semiquantitative data
It wasn’t designed to
work with single cells,
one cell can’t be followed
or identified over time,
expensive
Compatible with FACS
fluorescence activated cell
sorting, single cells can be
encapsulated in droplets and
cultured
Microscopy
Time dependent data can be
(automated
collected and a single cell
microscopy, high can be followed, qualitative
throughput
data regarding cell division
microscopy…ect) and expansion
Microwells
Micropatterning
The number of wells, and
their shape, size, depth and
dimensions can be
customized according to cell
types and applications.
Different materials and
fabrication methods can be
used. Capable of holding
cells for a longer period of
time. Compatible with
microscopy
Large arrays can be made to
increase throughput, many
Low throughput, multiple
cell parameters can’t be
analyzed, a lot of time is
spent collecting data,
cumbersome process,
not ideal for single cells,
difficult to get single cells
in wells
Throughput is limited to
the number of wells. It is
difficult to remove cells of
interest from the array, it
has to be done manually
Only compatible with
adherent cells that will
Process
Cell suspensions are
repeatedly diluted until
only single cells remain
Glass slide is treated to
make it hydrophobic, the
plasma treated with an
aluminum screen to make
small hydrophilic circles
where drops will form. Cell
suspension is poured over
glass, followed by mineral
oil that forms and seals
droplets
Flow cytometry (FCM) is
an approach to
quantitatively
analyze multiple
characteristics of millions
of single cells
and other particulate
matter from a
heterogeneous population
(Brehm-Stecher and
Johnson 2004)
Cells are fixed or placed in
a multi-well plate, and a
microscope takes
hundreds of pictures of
them, then they go through
automated image analysis
to find useful information
Cells are mechanically
separated. An array of
wells is created, each well
being small enough that
only a single cell can fit
within each.
A surface is treated to
make cytophilic and
60
different combinations of
surface treatments have
been used, cells can be
replenished easily by flowing
media or nutrients over the
array
Mechanical
Traps
Magnetic Traps
Compatible with microscopy,
high throughput, time
efficient, cells can be
organized into arrays of traps
Compatible with cell culture,
can be transferred out of
traps
Specific cell types of cells of
interest can be selectively
sorted out, cells can be
sorted according to a variety
of factors
bind to the surface, can’t
easily remove cells of
interest, substances
used to attract and bind
cells can affect their
behavior, flowing media
over cells can cause
shear stresses.
Not designed for long
term analysis (<24hrs),
flow has to be
considered to prevent
cell damage,
cytophobic regions that
guide cell attachment and
arranges single cells in an
array
Sort term analysis,
magnetic components
could have an effect on
cells
Uses immunomagnetic
labeling or binds a
magnetic marker to cells
so they can be sorted and
trapped when they interact
with a magnetic field at
designated time points
Most common method of
cell trapping in
microfluidics, uses small
channels or holes next to
the main channel that
allow enough flow through
them to trap single cells as
they pass by.
Optical tweezers (focused
laser beams): cells are
trapped at the focus point
of the laser beam, where
they can then be
repositioned in any
direction
Hydrodynamic
Traps
High throughput, cells can be
placed in an array,
compatible with non-adherent
cells
Short term analysis,
potential harm or cell
damage must be
considered,
Optical Traps
Very high precision and
control of cellular
arrangement, can be used to
selectively move cells of
interest, has been improved
to handle higher throughput
Extremely expensive,
laser energy can cause
increased heat and
photodamage that can
harm cells. careful,
complex planning and
good understanding is
required to prevent
photodamage
Dielectrophoretic
Traps
Cells can be moved within
enclosed chambers bc no
physical contact is needed,
compatible w cell culture
High throughput (10,000
cells/s), allows heat removal
that prevent cell damage,
sensitive enough to detect a
rare event and sort cells
according to it
Controlling more cells
increases complexity of
the design
Cell suspension flows over
traps that physically
separate single cells
Cells are moved by forces
generated in a non-uniform
electric field that direct
them
If target cells can be
labeled and bound to a
polystyrene bead they can
be sorted from a
population
61
Acoustic Traps
Offers dynamic control over
cell environment
Droplets
Low risk of crosscontamination between
droplets, the small volume of
droplets allows
concentrations to reach
detectible levels quickly,
droplets can be sorted and
manipulated, cells can be
incubated within their
droplets, drops can be
merged or split, high
throughput (>10^7)
Only capable of short
term analysis, need
thermal control to
prevent cell damage
Risk of drops coalescing,
stabilizing droplets to
prevent this requires the
use of expensive
surfactants, channel
dimensions and
microfluidic design must
be extremely accurate,
Ultrasonic waves create
pressure gradients that
isolate cells
Droplets are formed to
encapsulate single cells
typically using an aqueous
cell suspension
surrounded by a carrier oil
62
Appendix B: Photolithography Process
Preliminary Setup. Determine photolithography parameters
Before beginning any photolithography process, the entire procedure must be planned. The primary
determinants to spin speeds and duration of baking and development steps are the photoresist material
and the desired resist thickness. Refer to the photoresist spec sheets for more information. For example, for
a 80μm thick process using SU8 2035, we find the following information from the data below:
1. Spin speed: 1600 rpm
2. Soft3. Exposure energy: 215 mJ/cm2
4. Relative dose: 1x
5. Post6. Development time: 7 min
The bake times directly relate to the experimental plan, but the UV exposure time must be calculated from
the exposure energy, relative dose, the illumination intensity, and an empirical correction factor. The
illumination intensity of the UV-KUB should be stable at 23.4 mW/cm2, and the correction factor is 1.5 due
to the narrow spectrum of UV exposure at 365 nm. For example, from the data above, the UV exposure time
should be: 215 mJ/cm2 x 1 (multiplier) x 1.5 (correction factor) / 23.4 mW/cm2 = 13.8 s
Procedure 1. Dehydration Bake
The dehydration bake removes residual water molecules from the wafer surface by heating up the wafer on
a hot plate or convection oven. Removing residual moisture increases the adhesion of the photoresist on the
substrate.
1. Turn on the blower and light on the cleanhood. Let it run for a few minutes before working inside.
2. Power on the PMC Dataplate hot plate in the clean hood. Ensure the hotplate surface is clean.
Temp" [1], [1], [2], [0], [ENT]. The display cycles between the set temperature and current
63
temperature about once per second.
4. Place a clean new wafer onto the hotplate surface. The whole wafer should completely fit on the hotplate
surface so that heat can conduct evenly to the wafer.
5. Once the plate reaches the desired temperature, heat for 5 min. To set a timer, press the following
buttons in order: [SET], "Timer (h:m)" [4], [5], [ENT]. Or: [SET], "Timer (m:s)" [5], [5], [0], [0], [ENT].
6. Carefully remove from the hotplate with wafer tweezers and allow to cool to room temperature. The
wafer is now ready for the next procedure.
Procedure 2. Spin-coating
Spin-coating is a step to apply photoresist onto the wafer. This section will outline the steps of spin coating
SU-8, a common type of negative photoresist that is used in the MicroFabrication Laboratory. The
procedure is similar for AZ1512, a positive photoresist, except it is deposited via syringe rather than
pouring due to its lower viscosity. This step uses the Laurell spin-coater in the fume hood.
Preparation stage:
1. Turn on the spin coater using the left power strip switch under the fume hood. If the display does not
light up, turn on the unit power switch at the back of the unit.
2. Turn on the two 7" Dataplate hotplates (Figure 5) using the right power strip switch under the fume hood
If foil is absent, damaged, or dirty, replace with new foil.
3. Press [Select Process] and choose the appropriate spin program according to your desired
parameters. If none exist yet, you must enter a new spin program. Refer to the User Manual or
Appendix 1 for programming. If you make any changers or additions, note your changes in
64
the MFL logbook.
Edit Program 10
Step:001/002 Vac↓req Step:002/002 Vac↓req
Time:00:10.0 Cpm:00 Time:00:30.0 Cpm:00
Rpm : +00500 Loop:000 Rpm : +01600 Loop:000
Acel: 0100 Goto:001 Acel: 0300 Goto:001
Valv: Valv:
Sens: Sens:
The first step is a slow ramp to 500 rpm at 100 rpm/s and is designed to slowly spread the resist across the
wafer. The second step spins faster to determine the final resist film thickness. Only the spin speed (in rpm)
needs to be changed for different resist thicknesses; all other parameters should remain unchanged.
4. Remove the spin-coater lid and verify the presence of a foil liner. If the foil is not present, line the bowl
with foil to catch photoresist that is removed from the wafer during spinning. Ensure that the bowl
periphery is covered above the height of the chuck and wafer, and also completely covering the bottom to
the chuck. Rotate the chuck and ensure that the foil does not touch the chuck or impede rotation.
5. Select [Run Mode].
6. Turn on the N2 supply by opening the main tank valve. Ensure an output pressure of 60-70 psi. If the
display reads "Need CDA," open the round valve attached to the pressure regulator.
Open the vacuum valve by aligning the black handle with the tubing
7. Make sure that the wafer is clean and dry. Visible dust on the wafer can be removed by gently blowing the
wafer using the nitrogen gun, which is located on the right side of the fume hood.
65
8. Position the 4" wafer alignment tool against the chuck, and using wafer tweezers or your gloved hand,
touching only the edge, place the wafer on the chuck aligning to the marks on the alignment tool.
9. Before removing the alignment tool, press the [Vacuum] button. A hiss should be audible, and the display
should change from "Need vacuum" to "Ready". The wafer should now be held down on the chuck.
10. Test your alignment by beginning the spin program. Press [START] and observe the edge of
the wafer as it turns. It should wobble less than 5 mm. If not, press [STOP], then [Vacuum] to
release the vacuum, realign, and return to step 8. Reset the spin program if necessary by pressing
[Edit Mode] then [Run Mode] and ensuring the display reads "Ready".
Coating Stage:
1. Ensure the wafer is centered and the spin-coater is programmed and ready to spin.
2. For SU8 2035 photoresists and similar high-viscosity materials, pour the resist directly from a
50 mL conical tube. It will flow very slowly. Pour approximately 8-10 mL of resist onto the
wafer in one continuous motion, with the tube far enough to avoid contact with the wafer but close enough
to prevent thin filaments of resist from forming: about 1 cm. Once the resist blob covers about 5cm
diameter, quickly move the tube toward the edge while tilting the tube upwards and twisting to prevent
drips on the outside of the tube.
3. Press the [START] button of the spinner to start spin coating. The spin coating process takes
about 1 minute, depending on the program. [OPTIONAL:] Near the end of the second spin step,
use a piece of Al foil, rolled into a rod to collect resist streams that fly off of the wafer. Do not
touch the edge, but bring the rod close. This will clean up the resist at the edge and somewhat
66
reduce the edge bead, or thicker later at the edge due that forms due to surface tension.
4. The spinner will stop automatically when spin coating is completed.
5. Verify that the photoresist has been uniformly coated. If striations and streaks are
observed, the spin coating was not successful. Some causes may include:
- dust particles on the surface (clean it better),
- bubbles in the photoresist (heat the resist tube to 40them; see resist datasheet for more information)
- insufficient resist volume applied
6. Press [Vacuum] to release the chuck vacuum.
7. When the last wafer has been coated, close the vacuum and CDA valves at the N2 tank.
Procedure 3. Prebake (Soft Bake)
The prebake (Soft Bake) procedure is required to densify the photoresist following spin coating and
evaporate the solvent. In order to reduce thermal stresses due to the substantial difference in coefficient of
thermal expansion between Si and resist, the temperature should be raised and lowered gradually in a 2-
This step uses the two 7" Dataplate hotplates in the fume hood.
Set the timer for the desired time at this temperature, and cover the wafer with a foil tent.
time at this temperature and cover with a foil tent. Use wafer tweezers to lift up the edge, but
67
don't grab the wafer edge, since the resist is still very soft. Instead, slide the "removal tool" underneath and
lift.
room temperature. Be sure to place your hand underneath as you move the wafer from the fume hood to
clean hood: if you drop it, it'll shatter.
Procedure 4. UV exposure
The UV exposure procedure exposes the photoresist layer to collimated 365 nm UV light via an
LED source through a photomask. A negative resist becomes cross-linked and insoluble in developer when
exposed, whereas a positive photoresist becomes soluble in developer when exposed. This procedure
assumes that a transparency photomask will be used in direct contact with the resist layer. This step uses
the UV-KUB exposure system in the clean hood.
Preparation stage:
1. Turn on the UV-KUB via the power switch at the back left, just above the power cord. Press the silver
power button on the front panel, lower right. The touchscreen should light up and display "UV-KUB"
2. Touch the screen to reach the main menu. Touch [Settings] and [Drawer] to unlock the drawer. Wave
your hand near the door sensor at the lower left to open the drawer. If there is a wafer or mask present,
remove them. Place the 4"x 5" glass slide on the tray and wave near the door sensor to close it.
3. Return to the [Settings] menu (touch the [X] in the upper right of the screen). Touch
[Illumination] to calibrate the UV intensity. It should display about 23.4 mW/cm2 through the
glass plate. If not, adjust your exposure time calculations in "Preliminary Setup".
4. Return to the main menu and select [Full Surface] then [New cycle] then [Continuous]
68
5. Program the desired exposure duration and intensity. Enter the time using the touchscreen numbers,
then a unit ([h], [m], [s] for hours, minutes, seconds), then [v] to confirm. Note that
decimal values are not permitted, so round to the nearest second. Next enter the intensity in %, usually
100%, and [v] to confirm.
6. Test the exposure by touching [Insolate]. The drawer will open. Wave it closed. The display should read
"Loading in Progress". Touch the screen to start the exposure. Verify that the countdown timer begins at the
proper duration.
7. The exposure will end automatically and alert with a loud beep (silence by touching the screen). The
drawer will open automatically. Remove the glass slide if present.
Mask alignment stage:
1. Transfer the room temperature, resist-coated wafer to the UVKUB tray, centering it in the circular
pattern.
2. Observe the position of any defects in the resist layer. You will try to rotate your photomask such that
these defects are removed during development; i.e. they are covered with black mask regions if a negative
resist, or are covered with clear mask region if a positive resist.
3. Cut out the photomask circle using scissors, taking care not to kink the transparency film. Ensure it is free
of dust, and gently wipe with a lint-free cleanroom wipe or blow with the N2 gun if necessary.
4. Place the photomask over the resist-coated wafer and orient it such that any defects will be removed
during development
5. Place the 4" x 5" glass slide over the wafer and mask to keep it flat and in direct contact. First tilt the 5"
side to the back corner supports, then gently move it toward you so it rests on the bottom tray surface.
69
Finally, gently lower the glass plate onto the wafer, ensuring it is fully covering the mask and wafer, and that
it did not move the mask while lowering.
Exposure stage:
1. When you are satisfied with the mask orientation and glass plate placement, wave the door closed. Touch
the screen.
2. When is asks: "What do you want to do?", touch [Continue] on the screen.
The last used program will begin automatically after 1-2s. Verify the correct exposure. If anything is awry,
immediately press the large red button to abort and retry.
3. The exposure will end automatically and alert with a loud beep (silence by touching the screen). The
drawer opens automatically.
4. Gently lift the glass slide with wafer tweezers and set aside. Gently lift the photomask with wafer
tweezers and set aside.
5. Observe the resist surface. At this point, no pattern should be easily visible. If it is, the exposure time was
too long.
6. Wave the drawer closed when done exposing, then touch the screen and select [Cancel].
Procedure 5. Post-Exposure Bake (PEB)
The post-exposure bake completes the process of crosslinking a negative resist or solubilizing a positive
resist. As in the prebake, a two-step heating and cooling is required to minimize resist layer thermal
stresses. This step uses the two 7" Dataplate hotplates in the fume hood.
70
1. Transfer the wafer from the UVunderneath as you move the wafer so it doesn't drop. Set the timer for the desired time at this PEB
temperature.
2. Observe the resist surface. With ideal exposure, the mask pattern will become slightly visible in 5-30 s.
Cover with a foil tent.
3. Transfer the wafer from the 65
time at this temperature.
surface to cool to room temperature. At this point, the mask pattern should be clearly visible. If not,
exposure and/or baking times were too short.
Procedure 6. Development
The development step dissolves away the unexposed negative photoresist (or exposed positive
photoresist). It is performed by immersing the wafer in developer liquid and agitating until the resist is
dissolved and only the insoluble pattern remains. This procedure uses a glass dish and developer chemical
in the fume hood. Developers are located in the flammable cabinet below the fume hood, left side.
1. Ensure the glass dish is clean. Clean and dry with a cleanroom wipe if necessary. Pour developer in the
dish to about 0.5-1 cm depth.
2. Immerse the wafer in developer and gently slosh/agitate, taking care not to splash developer out of the
dish. Start a timer on the hotplate with the desired development time.
3. Observe the wafer periodically. Bare Si regions will become visible after ~30s - 1 min. The resist at the
edge is thicker than in the center, and therefore tends to be the last part to dissolve away.
71
4. When all resist appears dissolved, remove it from the developer bath with wafer tweezers and run under
a gentle stream of water in the hood sink. Grasp the wafer in your hands at the edges to ensure it doesn't fall
and break! Note the time of development in your lab notebook.
5. After both front and back sides are rinsed in H2O, dry both sides with the N2 gun. Bring the nozzle close
to the wafer and sweep side to side, especially in areas with small resist features.
6. Inspect the wafer as described in Procedure 7 below, and then perform a final cleaning development by
holding the wafer with tweezers horizontally over the dish and squirting a small amount of fresh developer
on the wafer. Gently slosh side-to-side for about 15s. Rinse with H2O and dry with a N2 gun.
Procedure 7. Inspection
Inspection is a step to verify general process quality and the development process. This section
will outline the main feature distortions that are encountered in photolithography process. The
Zeiss Stemi-2000 stereo microscope is equipped with a fiber-optic light ring and is used to visualize the
wafer in reflectance mode.
After initial development and rinsing, the wafer will appear dirty. This is OK! It is due to the resist that has
dissolved in the developer and will be cleaned to a shiny surface after brief wash with fresh developer. Also,
sharp corners and large resist fields will likely display surface cracks. This is also OK! It is due to the
thermal stresses during bakes, which were minimized by gradual heating and cooling but not fully
eliminated. These cracks will be eliminated with the Post-bake, Procedure 8.
1. Development time. Pay attention to the smallest features in the resist pattern. Lines should be sharp, with
no evidence of resist material in regions where it should be removed. If not, development is incomplete.
Return the wafer to the developer bath and repeat for ~30s, then rinse, dry, and re-inspect. Instead, if the
72
resist layer that should remain looks especially cloudy or rough, the wafer may be over-developed.
Additionally, overdevelopment may narrow a resist feature or widen a resist "hole", and underdevelopment
may do the opposite.
2. Bake times and temperatures. The extent to which a feature deviates from its ideal size is a
function of the exposure time, prebake temperature, prebake time, development temperature and
development time. Any of these parameters could be the cause for overdevelopment or underdevelopment
and it is therefore important that one understand some important troubleshooting techniques. The key idea
troubleshoot the distorted feature is to observe the effect of changing a parameter while holding the other
parameters at constant. The following example illustrates this idea.
It can be observed that by changing the exposure time while holding the other parameters at constant, there
is a time window where the feature size is optimal, i.e. between 15s and 25s in this example. If the changing
of this parameter does not produce the desired feature size, the problems are most likely to be caused by
other parameters or combinations of several parameters. Repeated troubleshooting with other parameters
should be carried out.
Procedure 8. Post-bake
The Postbake procedure is required to stabilize and harden the developed photoresist prior to
processing steps that the resist will mask. Typical post90-
off then the
timer ends, by pressing "Auto Off" [8]. Cover with a foil tent.
73
~30mins, then turn off and slowly return to room temperature. This will take around 1 hr total.
4. After the wafer has returned to room temperature, inspect the wafer again and verify that surface cracks
have disappeared. Document selected microscope fields with a camera.
74
Appendix C-Soft Lithography SOP
PROCEDURE 1: Fluorination of the Micropatterned Substrate
This procedure facilitates mold release by covalent treatment of Si or glass surfaces with a fluorosilane
chemical by vapor deposition. The treatment renders the Si or glass hydrophobic, and maintains the
Micropatterned SU8 features as long as possible without delamination by reducing the forces applied
during PDMS de-molding.
1. Set up the vacuum dessicator inside a fume hood. Line the bottom surface with foil if damaged, missing,
or dirty. Prepare a support ring (cardboard or other material) and line up Si wafers (or glass slides) along
the inner part of the ring, with the side to be treated facing inwards.
2. Make aluminum foil boat big enough to hold 40 uL (about 1 drop) and place in the center of the platform.
CAUTION (Tridecafluoro-1,1,2,2-tetrahydrooctyl)trichlorosilane (TFOCS; Gelest, SIT8174.0; or United
Chemical Technology, 6H-9283) is corrosive and toxic! Avoid direct contact and always handle it in the
fume hood.
3. Pipette 40ul of the TFOCS chemical directly from stock bottle and place into the aluminum foil boat you
just made. Remove the pipette tip by hand and gently place into the vacuum chamber (Do not eject it!)
4. Close the chamber and vacuum for 1 hour.
5. After 1 hr, remove the treated Si wafers (or glass). If any hazy film appears, remove with 15 - 30s contact
with isopropanol, rinse with water, and dry in an air stream.
6. Fluorinated pieces are ready to use right away. Verify hydrophobicity by observing contact angle of water
drops on the treated surface. Water drops should roll off the surface, leaving it dry.
7. After a few hours, the chemical liquid will have evaporated. Discard foil boat and pipette tip in hood
waste bag.
75
PROCEDURE 2: Preparing the PDMS Mixture
This procedure prepares a PDMS mixture for casting. We use Sylgard 184, which comes as a kit with Part A
(monomer) and Part B (cross linker). A typical ratio is 10:1 (w/w). For simplicity, we typically weigh out
the components into a single weigh boat on a balance.
1. Set up a paper tower on the balance, ensuring it does not hang over the edges, and a large weigh boat.
Remove any visible dust.
2. Determine your desired PDMS volume. Each wafer requires about 50-60g PDMS. Ideally, you should make
about 80-120 g PDMS per weigh boat, up to three boats at a time.
3. Tare the weigh boat (set weight to 0.0g). Pour Part A) into the weigh boat until the desired weight (e.g.,
91.2g). Then divide this value by 10 (for 10:1 ratio), tare again to 0.0g, and pour Part B to the desired weight
(e.g. 9.1g). Within -0.2/+0.5g is ok.
4. Using a transfer pipette, slowly and gently fold (as in baking) the low-viscosity Part B into the highviscosity Part A. Once Part B is no longer visible on the surface, increase your folding speed. Ensure that all
edges have been mixed. Mixing should take at least 1 min, ideally >2. (Technique is more important than
time here). There should be lots of bubbles!
5. Place the weigh boat into the vacuum chamber. If more than one is prepared, invert a second weight boat
on top, rotated such that the PDMS in the lower boat is visible, and place the second PDMS boat on top.
Repeat one more time for three total, as needed.
6. Apply a vacuum and observe bubble enlargement. Release the vacuum after 1 min as necessary if bubbles
appear as though they may overflow. This pops many of them, and reduces the likelihood of spillage.
7. Degas for 1 hr. At this point, all bubbles should be gone and PDMS is ready to pour in Procedure 3. Be
careful when releasing vacuum! Air rushing in could knock over the PDMS boats.
PROCEDURE 3: Casting and Curing PDMS
During this procedure, mixed PDMS is poured over the Si/SU8 mold master in a dish or foil vessel, bubbles
and/or dust particles are removed, and the PDMS is cured by baking at 65C for >3hrs.
76
1. Prepare casting vessels by bending a foil sheet over the bottom of a 500 mL Erlenmeyer flask. Flatten the
edges until they are about 10 - 15mm high. Ensure the bottom surface is flat.
2. Set up the masters to be cast on the bench top covered with absorbent mats and a paper towel. If dust is
visible, blow with the air gun. Weigh the master and vessel, recording the weight.
3. Once the PDMS mixture has been degassed for 1hr, and surface bubbles are gone, bring them to the
masters.
4. Pour PDMS mixture across the wafer, from one side to the other, in a continuous movement. This reduces
the number of bubbles formed. At this stage only the wafer needs to be covered.
5. Weigh the PDMS+master+vessel and subtract the master and vessel weight. About 60g PDMS is the target.
If more is needed, bring the vessel back to the absorbent pad and pour more. Repeat until the desired PDMS
weight is achieved.
6. Cover to prevent dust and observe after a few minutes any bubbles or dust remaining.
7. Surface bubbles can be removed by mouth blowing (from about 10 cm away).Deeper bubbles can be left
until they rise to the surface. Bubbles adherent to the Si or SU8 surface can be dislodged by tilting the vessel
back and forth (causing shear forces). Be careful not to spill any PDMS! It's messy, sticky, and hard to clean off
8. Large dust particles can be moved or aspirated with a disposable transfer pipette.
9. Once you are satisfied with the casting, place it onto a level shelf in the 65C oven, and bake for at least 3hrs.
Leaving overnight is also OK.
PROCEDURE 4: Preparing a PDMS device
This procedure completes a PDMS device, including punching inlet and outlet holes for microfluidic devices.
1. Demold the cured PDMS from the Si master. Peel off the foil and carefully remove the Si wafer. If PDMS
coated the underside of the wafer, you may need to cut it out with a scalpel or razor blade. Store the Si master
in a safe place, ideally a wafer holder.
2. Set up the rubber cutting pad. Use a straight razor blade to identify the indentation line that separates
adjacent devices, if present. Then, align the razor vertically and apply pressure to complete the cut. If
77
necessary, move the razor to the next position and cut with downward pressure. Do not slide the razor
through the PDMS! It will deform as you cut.
3. Once your device has been trimmed, determine the size of any inlet and outlet holes.
4. Apply Scotch Magic tape to the micropatterned side. If desired, mark the center of each hole for easier
viewing.
5. Flip over the device, tape and channel side on the rubber cutting pad.
6. Using a dermal punch of desired diameter, punch downward and in a straight line until contact with the
rubber cutting pad.
7. Lift up the device, leaving the punch inserted, and a cored PDMS piece should protrude from the
channel/tape side. Remove it before gently removing the punch.
8. Repeat steps 6-7 until all holes are punched.
9. Clean the punched holes by squirting water through each hole with a wash bottle. Repeat with ethanol and
water again. Then dry in an air stream. This process removes any PDMS particles that may have been left
behind during punching.
PROCEDURE 5: Plasma Bonding
This procedure covalently binds PDMS to glass, Si, or PDMS by oxygen plasma treatment of clean surfaces.
After plasma activation, surfaces are brought into contact, forming an instant and irreversible bond. Oxygen
plasma is also useful for cleaning substrates and vaporizing organic materials. (This is a relatively slow
process, and it will remove organic thin films, not clean off dust.)
Materials and equipment needed: glass tray, test slide and scrap PDMS piece, tape, plasma cleaner, vacuum
pump
Plasma bonder/cleaner setup:
(Set-up required only if plasma system has not been used recently)
1. Turn on the vacuum pump and open the "specialty vacuum" valve on the fume hood (labeled "SV"). A
hissing noise should be heard in the chamber.
78
2. Close both valves on the round metal door. Align it to the glass vacuum chamber, and after a few seconds
ensure that it is firmly held onto the chamber. Support it and do not let it drop!
3. Start a timer. After about 15s, turn on the power and set power level to [High]. A purple glow should be
visible through the vent holes after a few seconds.
4. Once a purple-glowing plasma is visible, slowly open the needle valve a very small amount to let in room air
and oxygen. The plasma should brighten and become more orange. If it dims too much, close the needle valve
slightly and observe the bright plasma return after a few seconds.
5. Allow the chamber to clean for 1-2 minutes.
6. When plasma treatment is completed, turn off the unit power and the vacuum pump power. Slowly open the
exhaust valve until the vacuum has been released. HOLD ONTO THE DOOR, or it will fall!
PDMS Bonding:
1. (Optional) Prepare a test bonding sample, such as a scrap of clean PDMS and a clean glass fragment (or two
PDMS scraps). Remove dust with tape. Then follow Steps 2-10, and if successful, repeat Steps 2-10 with the
desired parts to be bonded.
2. Seal the PDMS on the tray slide with treatment side facing up. Next to it, place the glass fragment (or the
second PDMS piece).
3. Insert the tray into the chamber. Ensure the door valves are closed, turn on the vacuum pump, and align the
door until it is held in place.
4. After ~5s, turn on unit power and wait for purple plasma as described in steps 3-4 above. Start a time when
it appears and adjust needle valve to generate brighter plasma.
5. Treat PDMS surfaces for 60s.
6. Turn off unit power and the vacuum pump power. Slowly open the exhaust valve until the vacuum has been
released. As before, HOLD ONTO THE DOOR, or it will fall!
7. Carefully remove the plasma-activated PDMS and glass.
8. Gently invert the glass onto the activated PDMS surface. Bonding is covalent and instantaneous, so there is
no opportunity to realign! Make sure you align before any contact, and be as gentle as possible.
79
9. Once the PDMS is sealed, apply light pressure the remove any air bubbles that may have been trapped
inside.
10. Wait about 15 - 30s, and test an edge for bonding by very gently peeling up at the corner. A successfully
bonded PDMS piece will not peel away from the substrate, and will break internally before debonding!
80
Appendix D- Tween 20 Surfactant
Preparing Tween Solutions
●
Fill the container for making the solution with desired amount of de-ionized
water and place it on the heating surface, such as the hotplate.
●
Heat until the water reaches a rolling boil and leave water boiling for ~5
minutes.
●
While the water is heating, using a precise scale and a pipette measure
0.10grams of Tween per each 100ml of water. (Example: 1500ml de-ionized
water, 0.10g x 15 = 1.5g of Tween)
●
Slowly add pre-measured Tween to hot water and mix with immersion mixer
for about 30 seconds. (Wait until water cools and any bubbles have settled
before using solution)
●
When finished, the solution should look clear and uniform.
Using Tween Solutions to Suspend Particles
The specifics of this section will pertain to creating Cospheric's Density Marker Beads
(DMB) products which are defined to have 20% solids in 2.5ml. The process is easily
modified to other situations.
●
Using a 2.5ml vial, add 0.5g of the desired microspheres. (Any container and
hydrophobic particles may be used).
●
Using a pipette or syringe, dispense 2.0ml of the 0.1% Tween solution on top of
the spheres.
81
●
Weigh the microsphere/Tween solution and add any additional Tween solution
to each vial to ensure vial weights are equal to better balance the centrifuge
while it is operation.
●
Secure the cap on the vial.
●
Centrifuge for 5 – 10 minutes to get the spheres wetted and into solution.
http://www.cospheric.com/tween_solutions_density_marker_beads.htm
82
Appendix E: BME Educational Objectives
3. An ability to design a system, component, or process to meet desired needs within
realistic constraints such as economic, environmental, social, political, ethical, health and
safety, manufacturability, and sustainability (ABET 3c) while incorporating appropriate
engineering standards (ABET Criterion 5) (need to assess each of these separately, but since
‘or’ and “such as” not all need to be met separately).
i) multiple realistic constraints (economic, environmental, social, political, ethical,
health and safety, manufacturability) – page(s) 54-55
ii) appropriate engineering standards - page(s) 23-28
4. An ability to function on multidisciplinary teams (3d). page(s) 8
6. An understanding of professional and ethical responsibilities (3f)
i) Professional – page(s) 23-27
ii) Ethical – page(s) 54
7. An ability to communicate effectively (3g). page 24
8. The broad education necessary to understand the impact of engineering solutions in a
global, economic, environmental, and societal context (3h). (both economic AND
environmental need to be addressed)
i) Economic – page(s) 54
ii) Environmental – page(s) 54
10. A knowledge of contemporary issues (3j). page(s) 13-20
83


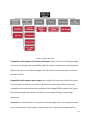
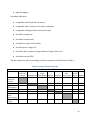


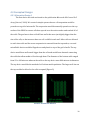

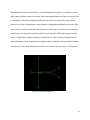


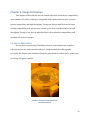

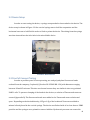

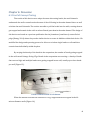

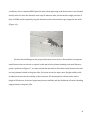
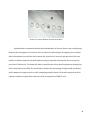


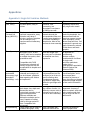


![1] n T169](http://vs1.manualzilla.com/store/data/005696581_1-b5b272b0c99ea5fca956b563015d9b67-150x150.png)