1
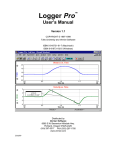
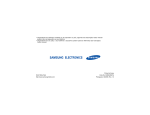
Graphical Analysis for Windows
USER’S MANUAL
Changing Display Features of a Graph
To change a graph, move the mouse to the graph and click it once to make the graph the active window. Now try
selecting different options from the Graph menu. Selecting a menu item toggles it on or off. If an item is preceded by a
check mark, the item is on. Here is a list of the available options:
•
•
•
•
•
•
Point Protectors (small squares, triangles, etc., that make the data points more visible)
Error Bars (marks that can indicate the uncertainty in the data)
Connecting Lines (straight-line segments from point to point)
Bar Graph (bars extending from the bottom of the graph to the top for each data point)
Background Grid (a pattern of background dots on the graph)
Legend (small box matching point protectors, data columns, and data sets)
Changing the Scale of a Graph
In most circumstances, the axis scales of the graph are automatically
adjusted by the program, but you may want to change them. To change
the scale of a graph, move the mouse to the graph and click either axis
label. A dialog box like the one to the right will appear.
You have three different choices for the scaling of each axis. If you
select Manual Scaling, you can enter the minimum and maximum values
to be used on the axis. Enter the appropriate value in each box. If you
choose Autoscale, the program will automatically calculate a scale for the graph, just fitting all the points on the graph.
If you choose Autoscale at Zero, the program will automatically choose the axis scale, but it will always include zero
on the axis.2
There is another way to quickly adjust the axis limits from the graph itself. You can change each limit by clicking on
that limit, entering a new value in the small box that appears, and pressing <enter>.
Zooming In on a Graph
You can zoom in on any region of a graph to examine it more carefully. When
you want to zoom in, click and drag the mouse over the region and click the Zoom
on the toolbar or choose Zoom In from the Graph menu. The
In button
program will then adjust the scales of the graph so that only the region included in
the rectangle is graphed. For example, a small section of the graph on this graph
has been selected with the mouse.
After selecting Zoom In, this region is expanded to yield the graph to the right.
2If
the numbers to be graphed are all positive, the axis will start with zero. If the numbers to be graphed are all
negative, the graph will end with zero. If both positive and negative numbers are to be graphed, the scale will be
adjusted to include both positive and negative values.
10