1
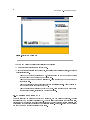
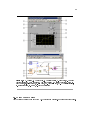
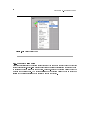
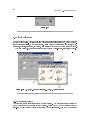
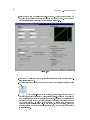
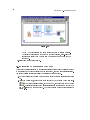
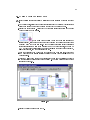
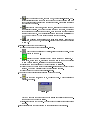
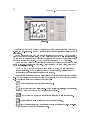
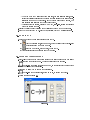
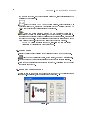
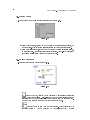
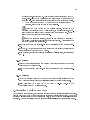
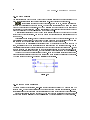
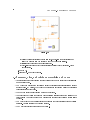
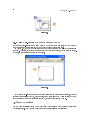
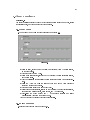
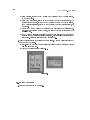
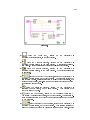
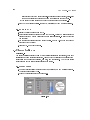
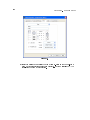
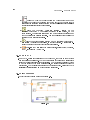
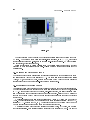
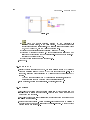
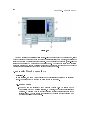
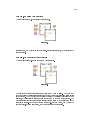
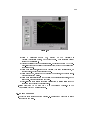
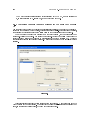
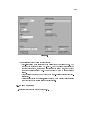
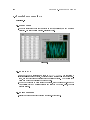
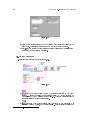
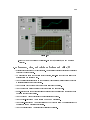
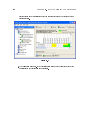
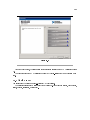
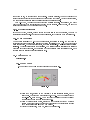
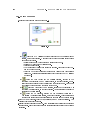
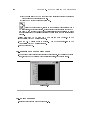
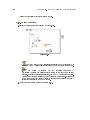
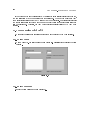
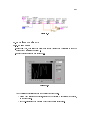
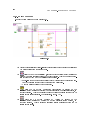
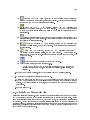
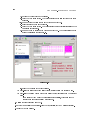
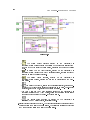
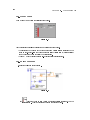
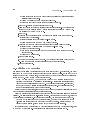
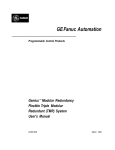
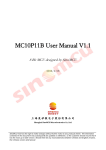
CHAPTER 7. PLOTTING DATA
120
Figure 7.9
(f)Click the OK button to close the dialog box when nished.
2.Right-click the waveform chart and select Data OperationsClear Chart from the
shortcut menu to clear the display buer and reset the waveform chart.
tip:
menu.
When a VI is running, you can select Clear Chart from the shortcut
3.Each time you run the VI, you rst must turn on the vertical toggle switch and then
click the Run button due to the current mechanical action of the switch. Modify the
mechanical action of the vertical toggle switch so temperature is plotted on the graph
each time you run the VI, without having to rst set the toggle switch.
(a)Stop the VI if it is running.
(b)Use the Operating tool to click the vertical toggle switch and turn it to the ON
position.
(c)Right-click the switch and select Data OperationsMake Current Value Default
from the shortcut menu. This sets the ON position as the default value.
(d)
Right-click the switch and select Mechanical ActionLatch When Pressed
from the shortcut menu. This setting changes the control value when you click
it and retains the new value until the VI reads it once. At this point the control
reverts to its default value, even if you keep pressing the mouse button. This
action is similar to a circuit breaker and is useful for stopping While Loops or for
getting the VI to perform an action only once each time you set the control.