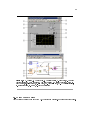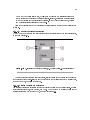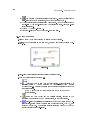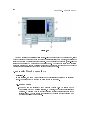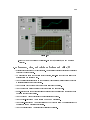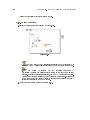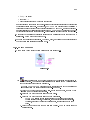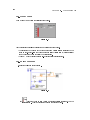
1
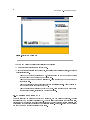
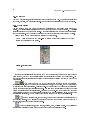
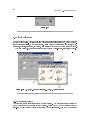
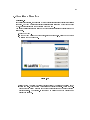
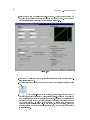
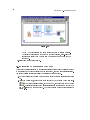
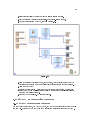
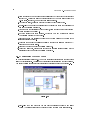
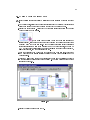
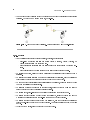
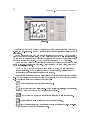
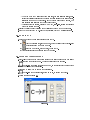
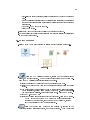
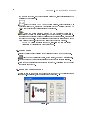
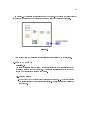
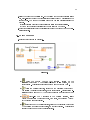
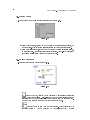
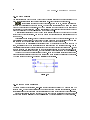
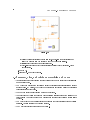
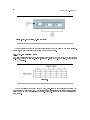
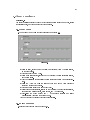
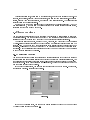
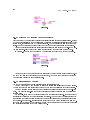
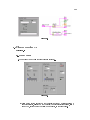
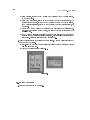
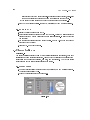
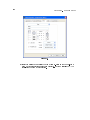
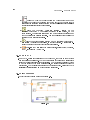
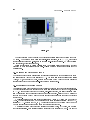
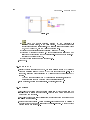
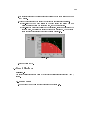
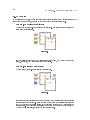
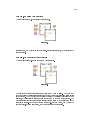
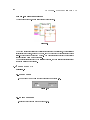
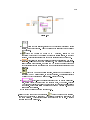
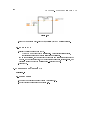
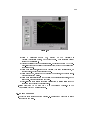
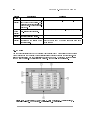
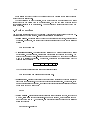
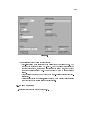
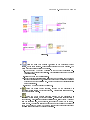
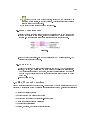
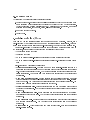
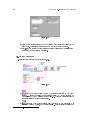
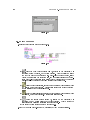
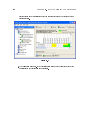
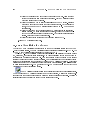
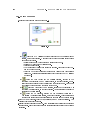
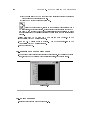
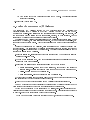
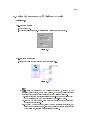
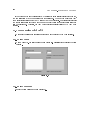
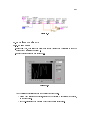
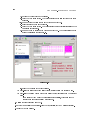
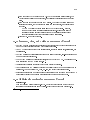
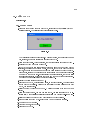
127
Bundle function to bundle the arrays into clusters, and you use the Build Array function to build
the resulting clusters into an array. You also can use the Build Cluster Array, which creates arrays
of clusters that contain inputs you specify. Refer to the (Xo, dX, Y) Multi Plot 2 graph in the
Waveform Graph VI in the NI Example Finder for an example of a graph that accepts this data
type.
7.4.3 Single Plot XY Graphs
The single-plot XY graph accepts a cluster that contains an x array and a y array. The XY graph
also accepts an array of points, where a point is a cluster that contains an x value and a y value.
Refer to the XY Graph VI in the NI Example Finder for an example of single-plot XY graph data
types.
7.4.4 Multiplot XY Graphs
The multiplot XY graph accepts an array of plots, where a plot is a cluster that contains an x array
and a y array. The multiplot XY graph also accepts an array of clusters of plots, where a plot is an
array of points. A point is a cluster that contains an x value and a y value. Refer to the XY Graph
VI in the NI Example Finder for an example of multiplot XY graph data types.
7.5 Graph Waveform Array VI
Exercise 7.3:
Complete the following steps to build a VI that generates and plots an array on a waveform
graph and modify the VI to graph multiple plots.
7.5.1 Front Panel
1.Open a blank VI and build the front panel shown in Figure 7.16.
Figure 7.16