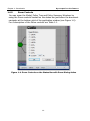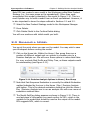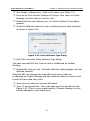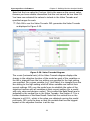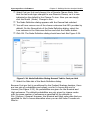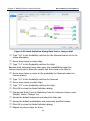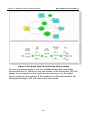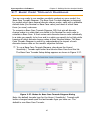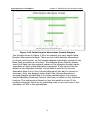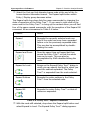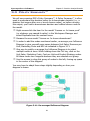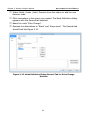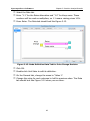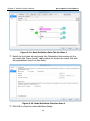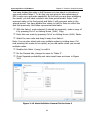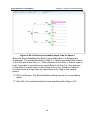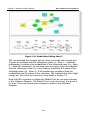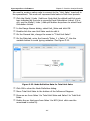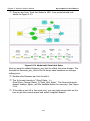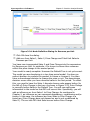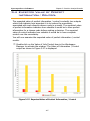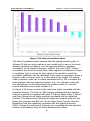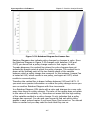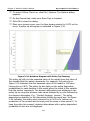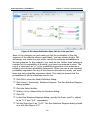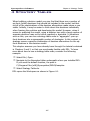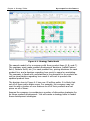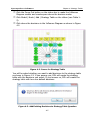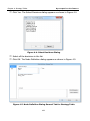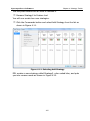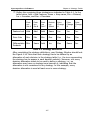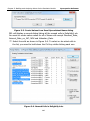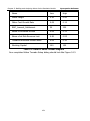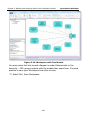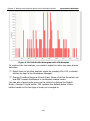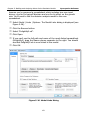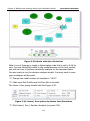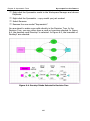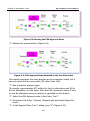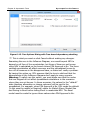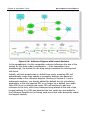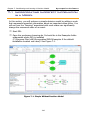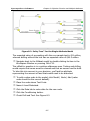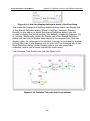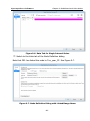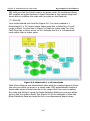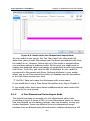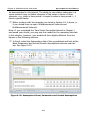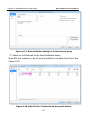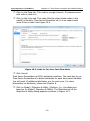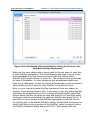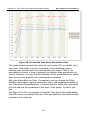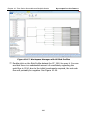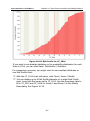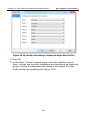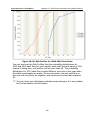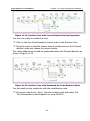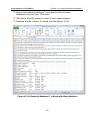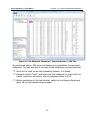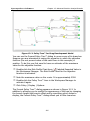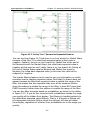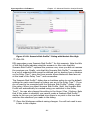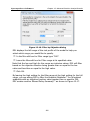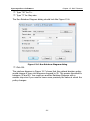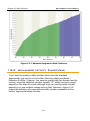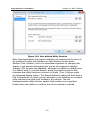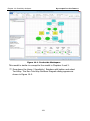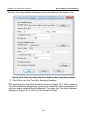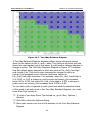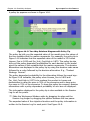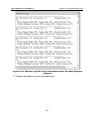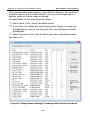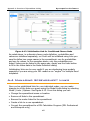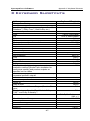
1
DPL 8 Professional User Manual Syncopation Software, Inc. www.syncopation.com Copyright © 2013 Syncopation Software, Inc. All rights reserved. Printed in the United States of America. Revised March 2013. Table of Contents Syncopation Software Table of Contents 1 Introduction ....................................................................................1 2 Building Decision Analysis Models ............................................... 23 3 Analyzing Decision Analysis Models ............................................. 73 4 Strategy Tables .......................................................................... 125 5 Building and Analyzing Monte Carlo Simulation Models ............ 141 6 Asymmetric Trees ....................................................................... 183 7 Conditioning and Learning in Decision Models .......................... 215 1.1 1.2 1.3 1.4 1.5 2.1 2.2 2.3 2.4 2.5 2.6 2.7 2.8 3.1 3.2 3.3 3.4 3.5 3.6 3.7 3.8 3.9 5.1 5.2 5.3 5.4 5.5 5.6 5.7 5.8 5.9 5.10 Welcome to DPL 8 Professional .................................................................... 1 How to get Help with DPL ............................................................................ 4 Installation .................................................................................................. 5 A Brief Tour of DPL ...................................................................................... 5 What's New in DPL 8 ................................................................................. 22 Value Nodes and Spreadsheet Links............................................................ 23 Arcs .......................................................................................................... 32 Running a Model ....................................................................................... 35 Decision Nodes .......................................................................................... 37 Value Tornado Diagram ............................................................................. 53 Discrete Chance Nodes .............................................................................. 59 Base Case Tornado Diagrams ..................................................................... 67 Initial Decision Alternatives Tornado Diagram.............................................. 70 Policy Tree™ ............................................................................................. 78 Risk Profile ................................................................................................ 85 Policy Summary™ ...................................................................................... 91 Expected Value of Perfect Information / Control .........................................107 Value Correlations ....................................................................................110 Saving Outputs .........................................................................................112 Rainbow Diagram on a Value ....................................................................113 Rainbow Diagram on a Probability .............................................................117 Probabilistic Base Case Tornado Diagram ...................................................122 The Excel Cash Flow Model .......................................................................142 Creating Linked Values..............................................................................145 Arranging the Influence Diagram ...............................................................150 Running a Value Tornado Diagram ............................................................152 Using the Workspace Manager ..................................................................157 Running a Monte Carlo Simulation .............................................................159 Comparing Risk Profiles ............................................................................164 Modeling an Up-Front Decision ..................................................................169 Performing a Sensitivity Analysis ...............................................................176 Modeling a Downstream Decision ..............................................................179 6.1 Eliminating Redundant Paths .....................................................................183 6.2 Using Multiple Get/Pay Expressions ...........................................................196 6.3 Adding a Downstream Decision .................................................................203 7.1 Incorporating Imperfect Information in a Model .........................................216 iii Table of Contents Syncopation Software 7.2 Summary of DPL Influence Arcs ................................................................ 232 8 Objective Functions and Multiple Attributes .............................. 235 9 Multidimensional Value Nodes ................................................... 253 8.1 Incorporating Multiple Attributes ............................................................... 236 8.2 Using a Constraint Function ...................................................................... 250 9.1 Creating and Linking a One-DimensionalValue Node................................... 254 9.2 Creating and Linking a Two-Dimensional Value Node ................................. 271 10 Time Series Percentiles and Multiple Metrics ............................. 277 10.1 Time Series Percentiles............................................................................. 277 10.2 Risk Profiles with Multiple Attributes .......................................................... 295 10.3 Using Multidimensional Value Nodes in Get/Pay Expressions ....................... 300 11 Using the Endpoint Database™................................................... 305 11.1 11.2 11.3 11.4 11.5 Recording and Viewing Endpoints ............................................................. 306 Playing Endpoints..................................................................................... 315 Reconnecting Endpoints to a Model ........................................................... 327 Exporting Endpoints ................................................................................. 330 Importing Endpoints................................................................................. 334 12 Additional Decision Analysis Results .......................................... 341 12.1 12.2 12.3 12.4 Policy Tree™ Features .............................................................................. 341 Scenario Risk Profiles™ ............................................................................ 348 Policy Summary™ Features....................................................................... 352 Option Value Charts ................................................................................. 361 13 Risk Tolerance ............................................................................ 365 13.1 Incorporating a Risk Tolerance ................................................................. 365 13.2 Advanced Utility Functions ........................................................................ 372 14 Sensitivity Analyses .................................................................... 375 14.1 Two-Way Rainbow Diagrams .................................................................... 375 14.2 Event Tornadoes ...................................................................................... 384 14.3 When to Use Which DPL Sensitivity Output ................................................ 388 15 DPL Programs and Code ............................................................. 391 15.1 15.2 15.3 15.4 15.5 15.6 What is a DPL Program? ........................................................................... 391 Overview of DPL Program Components ..................................................... 392 Converting a Model to a Program .............................................................. 394 Defining Components in the Definition Section ........................................... 399 Defining Event Sequences in the Sequence Section .................................... 412 Advanced Techniques for Programs .......................................................... 421 16 Converting Spreadsheets to DPL Code ....................................... 425 16.1 How to Convert Spreadsheets ................................................................... 425 16.2 Spreadsheet Practices for Easier Conversion .............................................. 434 A Overview of Spreadsheet Linking ............................................... 437 A.1 Types of Spreadsheet Links in a DPL Model ............................................... 437 iv Table of Contents Syncopation Software A.2 Calculation Links.......................................................................................438 A.3 Initialization Links .....................................................................................445 A.4 Managing Spreadsheet Links .....................................................................452 B System Requirements and Compatibility with Older Releases .. 455 C Keyboard Shortcuts .................................................................... 457 D Glossary of DPL and Decision Analysis Terms ............................ 459 Index ............................................................................................... 479 v Chapter 1: Introduction Syncopation Software 1 Introduction 1.1 Welcome to DPL 8 Professional Congratulations on your purchase of DPL 8! If you're a new user, we're confident that DPL's power and flexibility will exceed your expectations. If you've used DPL in the past, we think you'll find the new look and capabilities of DPL 8 significant improvements. The DPL modeling environment was designed to give you the capabilities you need to focus on the problem at hand -- the task and not the tools. This guide is an extension of that perspective, teaching you essential DPL skills in the context of simple but realistic decision models. This DPL 8 Professional User Manual is divided into 16 tutorial chapters plus appendices. Chapters 1 through 7 cover the basic functionality of DPL. These chapters are written with a new user to DPL in mind. Various sections of these chapters do, however, assume a basic knowledge of decision analysis, Excel, valuation techniques and Monte Carlo simulation. If you are new to DPL, you should find that these chapters provide a thorough introduction to the skills you will need to use DPL 8 Professional effectively. Chapters 8 through 16 cover more advanced features of DPL Professional. This section of the manual assumes you have some basic experience using DPL, as well as familiarity with decision and risk analysis concepts, Excel, and valuation techniques. If you are new to DPL, you should complete the tutorials in Chapters 2 and 3 and refer to other relevant parts of chapters 4 through 7 of the manual before covering the material in chapters 8 through 16. In general, chapters 8 through 16 are intended to be "stand-alone", although new DPL users may find that Chapters 8, 9, and 1 are best read sequentially, as discussed below. The remainder of this section briefly describes what is contained within this manual. The subsequent sections of this chapter describe how to get online help and technical support, DPL installation, and a brief tour of DPL. The final section lists the major changes you’ll find within the DPL family of products. 1 Chapter 1: Introduction Syncopation Software This manual focuses on DPL's graphical model development environment. It is intended to be read while working with DPL. The chapters in this manual contain tutorials that will give you the essential tools needed to develop real world decision problems in DPL. Chapters 2 and 3 contain a tutorial focused on building a model starting from a simple spreadsheet representing the business plan for a new product. These two chapters cover a broad range of modeling topics and cover all the major analytical outputs, so they're a good place to start if you're new to DPL. Chapter 4 contains a tutorial on strategy tables, which allow you to "aggregate" several up-front (initial) decisions into a logical, manageable set of strategies to be analyzed. Chapter 5 contains a tutorial focused on building and analyzing a Monte Carlo simulation risk analysis model in DPL based on an Excel cash flow model. The rest of the tutorials in the manual cover more advanced topics and assume that you are already familiar with DPL or have read one or more of the earlier chapters in this guide. Chapter 6 demonstrates how to build and run asymmetric decision trees. Although simple symmetric trees are useful in some situations, many decision problems are best modeled and communicated using asymmetric tree structures. Chapter 7 is an introduction to using DPL's modeling environment for more complex decision models and situations, including probabilistic conditioning, Bayesian updating, and learning models. Chapter 8 demonstrates how to create models with multiple attributes and use multiple attributes in an objective function, as well as how to use constraint functions. Multiple attributes are also used to track various metrics even if they aren’t incorporated into the objective function. This use of multiple attributes is discussed more in chapters 8 and 9. Chapter 9 demonstrates how to use multidimensional value nodes in the Influence Diagram. One-dimensional arrays or series and two-dimensional arrays can be modeled with value nodes in the Influence Diagram. These non-scalar value nodes can be used to represent items such as sales over several time periods (one dimension) or over both market segment and time period (two dimensions). They can also be used to represent free cash flows over a time horizon or other metrics that might be of interest. Multidimensional value nodes have several advantages. They significantly reduce the work required to build an Influence Diagram and set up 2 Chapter 1: Introduction Syncopation Software spreadsheet links. Multidimensional value nodes result in a much simpler, easier to read Influence Diagram. And lastly, they are faster than multiple scalar value nodes when linked to an Excel spreadsheet. Chapter 1 contains a tutorial on using DPL's time series percentiles feature, including the use of multidimensional value nodes with this feature. Because time series percentiles use multiple attributes, and can be used with multidimensional value nodes for greater efficiency, you may wish to review Chapters 8 and 9 before completing the tutorial in Chapter 1. Chapter 11 is a tutorial on using the Endpoint Database™ features in DPL. The Endpoint Database™ can be recorded (saved) and viewed. A recorded Endpoint Database™ can be played to very quickly produce decision analysis results even if the model has been modified in certain ways. The Endpoint Database™ capability can significantly reduce the time required to do multiple runs of large models. Chapter 12 covers DPL’s more advanced results, such as Policy Trees™, Scenario Risk Profiles™, Policy Summaries™, and Option Value Charts. Chapter 13 shows you how to use DPL to model attitudes toward risk and make decisions based on criteria beyond expected value. Utility functions are introduced in this chapter. Chapter 14 covers advanced sensitivity analysis features in DPL, including two-way Rainbow Diagrams and Event Tornado Diagrams. Chapter 14 also contains guidance about when to use each type of sensitivity analysis. Chapters 15 and 16 describe and demonstrate how DPL programs and DPL code are created, and how spreadsheets linked to DPL can be converted to DPL code for significant improvements in model runtime. These two chapters are intended mainly for more advanced applications that require large, complex models. A few conventions have been used in the text that follows. An instruction to you in a tutorial will be contained in a bulleted paragraph. Information to be entered in edit boxes, Excel cells, etc. is contained within doublequotes. Do not include the double-quotes when entering the information. DPL ribbon tab names, groups, and commands are separated by vertical bars (|). For example, "Model | Node | Add" refers to the default command indicated by the icon in the Add split button, located in the Node group on the Model tab of the command ribbon. When a command other than the default indicated in the icon is desired, you will be prompted to drop-down the split button and select the command from the drop-down list. 3 Chapter 1: Introduction Syncopation Software The word "Options" following a vertical bar refers to the dialog box launcher ( ), which is located at the bottom right corner of the given tab group. For example, "Model | Node | Options" refers to the dialog box launcher for the Node group on the Model tab of the ribbon and will launch the Model Options Dialog. If there are multiple tabs within a dialog, then the item following the last | refers to the desired tab. For example, Model | Links | Options | Settings refers the Settings tab of the Model Links dialog. 1.2 How to get Help with DPL Online help contains detailed descriptions of DPL features as well as a reference section for DPL dialogs. Descriptions of how DPL performs various calculations and how to interpret each of DPL's outputs are also in online help. Online help also contains a listing of common error and warning messages that may be generated by DPL. You can access online help by using the commands within the Help group of the Help tab on the ribbon or by pressing F1. The latter provides context-sensitive help, which means that pressing F1 will open online Help to the topic corresponding to what you're doing in DPL. You can also obtain technical and installation support by emailing [email protected]. Support resources such as technical notes, case studies, and answers to frequently asked questions, are available on our website: www.syncopation.com. Perpetual licenses of DPL include 90 days of Premium Care to help you get started with DPL. Premium Care includes phone and email support, feature releases and upgrades to major product releases at no additional charge and allows you the ability to create support tickets on our website. Following the first 90 days, Premium Care can be purchased on an annual basis. We recommend you consider purchasing Premium Care. More information is available at www.syncopation.com or by emailing [email protected]. Annual licenses include Premium Care. The quickest, most efficient way to become proficient with DPL is to attend a training course. Syncopation offers DPL training courses a few times a year at various locations. Custom training seminars can be provided as well. Please contact us at [email protected] if you are interested in DPL training. 4 Chapter 1: Introduction Syncopation Software 1.3 Installation If you have not already installed DPL, do so now. If you received your DPL 8 software and license electronically, you should have received an e-mail with the subject DPL download instructions from [email protected]. Follow the instructions contained in the e-mail. If you purchased a DPL 8 installation CD, insert it into your CD/DVD drive. If the setup program does not launch automatically, double-click on DPL8.msi in the root directory of the CD from Windows Explorer. Once the DPL8.msi file has been opened, follow the on-screen instructions. 1.4 A Brief Tour of DPL 1.4.1 The DPL Workspace Start DPL by double-clicking the icon on your desktop ( clicking the application in Windows Explorer. ) or double- DPL will load with an empty Model Window maximized on the right-hand side of the screen. On the left-hand side will be the Workspace Window. See Figure 1-1. 5 Chapter 1: Introduction Syncopation Software Figure 1-1. New Workspace with Empty Model Window 1.4.2 The Workspace Window The Workspace Window is divided into two different panes: 1) the Workspace Manager pane at the top and 2) the Session Log pane at the bottom. The Workspace Manager pane displays all the documents in the open Workspace in a Windows Explorer style tree structure. The top level is the Workspace. Below the Workspace will be displayed all the models in the Workspace. Below each model will be displayed the outputs and other items associated with each model. Currently there is only one model (Model1) in the Workspace. Right-click on the icon for Model1 to see the context menu for a model. Notice that you can delete, rename or duplicate a model. 6 Chapter 1: Introduction Syncopation Software Within a DPL Workspace, you can develop, run, and store results and outputs from multiple models. The model you most recently ran, compiled or viewed is bolded in the Workspace Manager. In general, when you run a Decision Analysis or use any other run or compile command, DPL runs or compiles the active model. Once you’ve run or compiled a model, its item in the Workspace Manager will have a compiled indicator, double chevrons ("»»…««"), around the model name. The Session Log displays information about the current session. Presently, it displays information about the version of DPL you are running and to whom the software is licensed. See Figure 1-2. You can also access DPL license information by clicking Help | Resources | License. As you build models and run analyses, further information such as compilation messages and the expected value of a model are written in the Session Log. Error messages are also written in the Session Log. The Session Log is cleared each time you close DPL and each time you open a new Workspace. Figure 1-2. The Session Log 7 Chapter 1: Introduction Syncopation Software Both the Workspace Manager and the Session Log can be undocked by clicking the top of the pane and dragging away from the side of the window or by right-clicking within the desired pane and selecting "Dock". The pane can be left floating or moved to one of the edges of the application window and re-docked there. The window border changes as you drag it to indicate whether and where it will be docked. If you dock one pane on top of the other, the window will show only the "top" pane and create two tabs at the bottom of the Workspace Window, one for each pane view. The Workspace Manager and Session Log can be hidden using the Autohide function (the thumb tack button on the top right of the pane). When the thumb tack is in Pin Down mode, the pane stays visible. Pressing the thumb tack button will toggle to Pin Up mode and the pane will collapse to a tab on the edge of the screen if docked or to a window bar if un-docked. When you mouse-over the tab or window bar, the pane will expand to its visible state. When your mouse leaves the tab/pane area, the pane will collapse to a tab/window bar again. To keep the pane at its visible state, click the thumb tack to toggle to Pin Down mode. 1.4.3 The Model Window The Model Window is also divided into two different panes: 1) the Influence Diagram pane at the top and 2) the Decision Tree pane at the bottom. The two panes are divided horizontally by a splitter, which can be moved up or down. Dragging the splitter bar to the edge of the window will make only one of the panes visible, as will double-clicking on the splitter bar. Double-clicking the splitter bar again sets it to the half-way split. To change back and forth between panes, press the Tab button, click anywhere within the desired pane (if visible), or click View | Window | Switch Panes | Decision Tree (or Influence Diagram). The active pane is indicated by a magenta outline around the edge of the pane. You can also change the splitter to split the screen vertically by selecting the radio button View | Layout | Split Vertically (which results in the Influence Diagram being on the left and Decision Tree on the right). 8 Chapter 1: Introduction Syncopation Software 1.4.4 Document Navigator In addition to the Workspace Manager, all the documents are also displayed as tabs in the Document Navigator (see Figure 1-3) just below the Decision Tree pane. You can click the tab for the item once to activate it or press the ( ) to delete the item. If the desired tab is not visible in the Document Navigator use the arrows at the far right to scroll through the document tabs. Figure 1-3. Document tabs in the Document Navigator 9 Chapter 1: Introduction 1.4.5 Syncopation Software Zoom Controls You can zoom the Model, Policy Tree and Policy Summary Windows by using the Zoom controls located on the status bar just below the document navigator at the bottom right of the application window (see Figure 1-4). For a description of the Zoom controls see Table 1-1. Figure 1-4. Zoom Controls on the Status Bar with Zoom Dialog Active 10 Chapter 1: Introduction Syncopation Software Button/Control Name Action Zoom Percentage This button launches the Zoom dialog (as seen in Figure 1-4) within which you can select a preset level of zoom or specify a custom zoom level. Zoom Full Zoom the active pane so that all of the Influence Diagram/Decision Tree is visible in the pane. Zoom Previous Return to the previous zoom. Zoom Slider Control Click the Zoom out ( )/Zoom in ( ) buttons to increase/ decrease zoom level or manually click and drag the Zoom slider control ( ) to the desired zoom level. Table 1-1. Zoom Controls on the Status Bar You can also zoom these windows by Ctrl+Shift selecting. To zoom on a specific region, click the left mouse button on the top left corner of the region you’d like to view, hold Ctrl+Shift and then drag the mouse down and to the right. A rectangle indicates what will be displayed when you release the button. Release the mouse button when the rectangle surrounds the portion of the diagram you wish to view. 11 Chapter 1: Introduction 1.4.6 Syncopation Software Introduction to the DPL Command Ribbon Above the Workspace and Model Windows, you will find a Microsoft Officestyle command ribbon consisting of multiple tabs. Each tab is split up into contextual groups that contain one or more commands. You can view a short description of a particular command on the ribbon by holding your cursor over the item until the tooltip note appears. File Tab The File tab contains standard commands for creating a new Workspace, opening and saving Workspaces, and printing. You can also access DPL and Workspace-level options via File | Options. These options will be discussed in more detail later in the chapter. Home Tab The Home tab contains a Workspace group within which you can add, delete, rename, copy, cut, paste, select and find/replace items in the Workspace. The Run group and Sensitivity group display the analyses that can be run on models and the options associated with those analyses. Model Tab The Model tab contains a number commands for editing DPL models. The buttons, their names and the action associated with each are described in the tables below. 12 Chapter 1: Introduction Syncopation Software Control Action The dialog box launcher will open Node Options dialog where advanced Value and Decision node features can be turned on/off. Add (Node) Add a new node to the Influence Diagram of the default type indicated by the icon. Use the drop-down split to select node type other than default. The default changes to the last added type. Edit (Node) Edit the selected node’s name, states or dimensions, data and/or links. Change to (Node type) Change type of selected node to the default type indicated by icon. Use dropdown split to select node type other than default. The default changes to the last changed to type. Sum / Difference / Product Create a new node that is the sum, product, or difference of the selected nodes. Table 1-2. Model | Node Ribbon Group 13 Chapter 1: Introduction Syncopation Software Control Action Add (Linked Node) The dialog box launcher will open the Model Links dialog where you can view model links, specify DPL program links, convert a spreadsheet to a DPL Program, and change links settings. Add linked node of default type as indicated by icon (see icons below). Use dropdown split to select link type other than default. The default changes to the last added linked node type. Excel Calc Link Excel Init Link DPL Program Calc Link Database Init Link Add (New Arc) Add new influence arc between nodes. From Formulas Add new influence arcs to Influence Diagram that are based on the formulas of the data definitions of each node. Bend/Straighten Bend or straighten the selected influence arc. To straighten all arcs at once, drop-down Straighten split button and select Straighten All. Table 1-3. Model | Links and Model | Influence/Arc Ribbon Groups 14 Chapter 1: Introduction Syncopation Software Control Action Default Tree Build or re-build the default tree. The existing tree will be deleted. (Add) Instance Add a new node instance (decision or chance) to decision tree as indicated by icon. Use drop-down split to select instance other than default. Default changes to the last instance type added. The dialog box launcher will open the Tree Options Dialog where you can turn off/on tree-based dependency checking, change alternative grouping for new nodes, and turn off/on advanced decision tree features. Asymmetric Check the checkbox to make branches of selected node asymmetric. Uncheck the checkbox to make symmetric. Detach Detach selected node and create a new detached subtree starting with the selected node. Subtree Create a Perform Subtree beginning with the selected node. Table 1-4. Model | Tree Ribbon Group 15 Chapter 1: Introduction Syncopation Software Control Action Control Combo Control node to the branch selected in the combo (or uncontrol if (None) selected.) The dialog box launcher will open the Control tab of the Branch Definition dialog where you can change branch control/block or set event states (if advanced features are on). Other tabs: Control All drop-down Control all branches to Low (first), Nominal (middle), High (last) or Default (as defined in the node’s definition) state. Use Uncontrol All to remove control from all branches in the model. • Get/Pay tab- define a get/pay expression for the branch • Risk Tolerance tab (only appears if advanced features are turned on)- define risk tolerance by branch • Display tab- change get/pay and state display options. The Get/Pay tab of the Branch Definition dialog will open if you double click the branches of a node in the decision tree or click Model | Get/Pay | Options. Table 1-5. Model | Branch Ribbon Group 16 Chapter 1: Introduction Syncopation Software Control Action Select Attributes Drop-down List Choose the attribute from the drop-down list for which you’d like to edit the get/pay expression for the selected branch(es). Only necessary in multiple attribute models. Edit Get/Pay Combo Box The dialog box launcher will open the Get/Pay tab of the Branch Definition dialog. See dialog box launcher description in Control column for the Branch group in Table 1-5. Use the drop-down list to select a single quantity or type in an expression for the get/pay for the selected branch (es). For multiple attribute models, the get/pay will be for the attribute selected in the Attributes dropdown list otherwise it is for the objective function. Use the ( or ( ) buttons to insert a variable or function. Get/Pay Display Radio Buttons Display, hide or show an indicator ($) for the get/pay for selected branch(es). Table 1-6. Model | Get/Pay Ribbon Group 17 ) Chapter 1: Introduction Syncopation Software Control Action Objective Function Combo Box Only enabled for multiple attribute models. Use the dropdown list to select a single attribute for the objective function or type in an expression involving more than one attribute and/or value from the model. Use Max/Min drop-down list to either maximize or minimize the The dialog box launcher will open the Objective tab of the Objective & Utility dialog where you can add, rename and delete attributes; and specify an objective function, and/or constraint function. You can also choose to display Fat Policy™ within Policy Tree™. Within the Risk Tolerance tab you can specify a single risk tolerance for the entire tree. objective function. Use the ( ( ) or ( ) buttons to insert a variable or function. Built-In Risk Tolerance Combo Box Specify the coefficient for the built-in risk tolerance function in order to model attitudes towards risk. Use the ( ) or ( ) buttons to insert a variable or function. Table 1-7. Model | Objective & Utility Ribbon Group 18 ), Chapter 1: Introduction Syncopation Software View Tab You can access several useful display commands within the View tab. Once you have multiple items within your workspace, you can arrange windows and icons and switch between windows via commands within the View | Window group. Within the View | Layout group there are commands to snap nodes to the grid and align or arrange nodes within the Influence Diagram. You can add a block of text, typically used for titles or explanatory notes, within the Influence Diagram or Decision Tree and edit or delete the text via the View | Layout | Add Text split button. Note that text blocks can be edited independent of the text associated with nodes (node names and branch names). You can toggle back and forth between the Certain Equivalents and Expected Value view for many outputs by clicking View | Results | CE. The Certain Equivalents view is available only if a risk tolerance has been specified. Lastly, you can change the font, font style, and font size for various items within the Influence Diagram, Decision Tree and output charts using the controls in the View | Font group. Data Tab Within the data tab you can export the data or statistics of a particular output via the Data | Export icon. Within Data | Distributions you can view the Statistics for a distribution or reduce the distribution to a single chance node. Lastly, DPL Enterprise users can set up an ODBC Datasource for a Workspace or load the database schema information within the Data | Database group. Help Tab View or update your DPL version, license and license information or register your DPL license via the commands within the Help | Resources group. View Help topics by clicking one of the three icons within the Help | Help group. Lastly, you can launch the Examples Navigator by clicking the Help | Examples | Navigator icon. Contextual Tabs and Commands Some ribbon tabs are contextual and will appear only when a particular item is active. For example, the Policy tab appears only when a Policy TreeTM or Policy SummaryTM is active. As you work your way through the following tutorials, in addition to the Policy Tab, you will find the following contextual tabs: the Grid Tab (when an Endpoint Database™ is active) and the Chart | Series and Chart | Format tabs (when a chart, such as a Risk Profile Chart or Value Tornado Diagram, is active). 19 Chapter 1: Introduction Syncopation Software Furthermore, not all commands within a particular tab will always be enabled since some of them are context specific. For example, the options within the Model | Get/Pay group are only enabled when you have a branch selected in the Decision Tree. 1.4.7 DPL and Workspace-Level and Model Options You will now check that several options are set in specific ways so that as you work with DPL, what you see on your screen will be similar to the images in this manual. In DPL 8, there are several places to set options. You can access DPL and Workspace-level options via File | Options (note in this case File | Options is a menu item not a dialog box launcher). Options that are specific to models within a Workspace (Model Options) are set via dialog box launchers that relate to the options being set, e.g., options relating to nodes are set via the Model | Node dialog box launcher. The various Model options are discussed throughout the manual. Select File | Options to access the DPL and Workspace-level options. The Options dialog appears with the General tab active as shown in Figure 1-5. Figure 1-5. Options Dialog with General Tab Selected 20 Chapter 1: Introduction Syncopation Software Make sure that Show Tips is checked. Select the Outputs tab. Make sure that Decimal places is set to 1. Make sure that Display probabilities as percentages is checked. Make sure that Decimal places for probabilities is set to 0. The Outputs tab should look like Figure 1-6. Figure 1-6. Options Dialog with Outputs Tab Selected All of the options on the General tab are at the installation level, i.e., they are not Workspace specific. The options on the Outputs and Workspace tabs are Workspace-level options and can vary from Workspace to Workspace. 21 Chapter 1: Introduction Syncopation Software 1.5 What's New in DPL 8 This section is intended as a reference for users of previous versions of DPL. A list of some of the major changes and new features in DPL 8 is provided below. If you are a new DPL user, you may skip this section. DPL Standard has become DPL Direct which is a pure Excel Add-in. I.e., you do your DPL modeling directly from Excel, there is no standalone DPL application. DPL 8 Professional is still a standalone application. With DPL Professional you also have access to the intuitive Excel-side interface if you prefer to work directly from Excel. The DPL 8 Direct Quick Start Guide provided with your license walks you through the essential features included in the new Excel-side interface. This DPL 8 Professional User Manual is a comprehensive guide to all of the features offered by the DPL 8 Professional standalone application. 1.5.1 New Features in DPL 8 Professional • Microsoft Office-style command ribbon user interface • Completely re-worked graphics • Modernized icons • Excel-side interface • New Tornado Diagram type called Probabilistic Base Case which helps you to better understand the risk drivers in your model • The ability to fully format and customize your outputs within DPL, no need to export and fiddle to get your outputs "presentation ready" • Node collections that allow you to group nodes into collections and collapse them for condensed display in the Influence Diagram • Find/replace in the Influence Diagram and Decision Tree • Ability to use relative paths for spreadsheet links so that you can more easily pass a DPL file and Excel file combination to a colleague • Ability to embed your DPL Workspace in an Excel file so your model is in a single file The above features and many other new features are demonstrated and explained throughout the chapters of this manual. 22 Chapter 2: Building Decision Analysis Models Syncopation Software 2 Building Decision Analysis Models This tutorial focuses on building a spreadsheet-linked DPL model for a simple decision analysis application. It will familiarize you with key DPL features by providing step-by-step guidance on how to create a DPL model from a simple Excel spreadsheet, modify the model and generate results. If you are new to DPL, this tutorial is a good place to start. A DPL model is a combination of an Influence Diagram and Decision Tree. The main purpose of an Influence Diagram is to show the relationships among the different factors relevant to a decision. DPL's Influence Diagram modeling environment provides a rich set of features to give you flexibility in defining these relationships. In this chapter, you will begin to work with those features. A Decision Tree provides an intuitive, map-like representation of the sequence (order) and structure of a decision problem. In DPL, Influence Diagrams and Decision Trees work together to provide a complete definition of the decision problem. You will work more with Decision Trees in subsequent chapters. 2.1 Value Nodes and Spreadsheet Links You will develop a decision model by adding spreadsheet-linked value nodes to the Influence Diagram. Each of these nodes will be linked to a cell in the Excel workbook called New Product Strategy.xls, which is an example file installed with the software. A value node is a constant (i.e., a number) or calculated quantity (i.e., a formula) in a DPL decision model. They can be linked to a cell in a spreadsheet or be local (i.e., not linked and contain a number or formula in DPL). Value nodes are represented by rounded blue rectangles in the Influence Diagram. Open DPL. DPL will start with an empty Model Window maximized on the right-hand side of the screen as shown in Figure 2-1. 23 Chapter 2: Building Decision Analysis Models Syncopation Software Figure 2-1. New Workspace with Blank Model Window Click the Model | Links | Add split button. Note that initially the default action of this button is to add Excel Calculation-Linked nodes (which is what you want). If you select another item from the split button’s drop-down list, the default action changes to that. So the split button allows you to execute whichever item you last executed again without having to drop down the list. In the Create Calculation Linked Values from Excel dialog, click Browse and select the file New Product Strategy.xls. It will be in the folder with DPL examples, usually C:\Program Files (x86)\Syncopation\DPL8\Examples. 24 Chapter 2: Building Decision Analysis Models Syncopation Software Figure 2-2. Create Linked Values Dialog Click OK. The Cell Names dialog appears. The Cell Names dialog displays all named cells in the spreadsheet that are suitable for linking to value nodes. Important note: DPL only displays named cells in the Cell Names dialog. Before using a spreadsheet with DPL, you should ensure that cells you wish to link are named in Excel. Please consult your Excel documentation if you are not familiar with named cells/ranges, as they are essential for using DPL with Excel. Select the cells named Cost_per_Unit, Launch_Costs, Marketing_Costs, NPV, Revenue_per_Unit and Unit_Sales as shown below. (Hint: to select multiple names, hold down the Ctrl key as you click the names.) 25 Chapter 2: Building Decision Analysis Models Syncopation Software Figure 2-3. Cell Names Dialog Click OK. DPL creates the new value nodes and adds them to the Influence Diagram. Arrange the nodes so they look like Figure 2-4 below. Drag the splitter down if you need more room. 26 Chapter 2: Building Decision Analysis Models Syncopation Software Figure 2-4. Model with Six Value Nodes. When you build a spreadsheet-linked DPL model, you will typically want to have DPL send different sets of input values (drivers) to Excel and have Excel send back one or more output values (metrics). Nodes in DPL that send data to Excel are called export nodes. Nodes that receive data back from Excel are called import nodes. Export nodes are typically linked to cells in Excel that contain constant numbers (not formulas). Import nodes in DPL are typically linked to cells in Excel that contain formulas. In our model, NPV is an import node, and the other nodes are export nodes. Double-click on the Cost per Unit value node. The Data tab of the Node Definition dialog is displayed. See Figure 2-5. 27 Chapter 2: Building Decision Analysis Models Syncopation Software Figure 2-5. Node Definition Dialog with Data Tab Selected The Data tab displays a data input tree for the value node and allows you to enter the data for this node. Because this node was created as a linked value, DPL has filled in the value of 0.8, which comes from the cell named Cost_per_Unit in the spreadsheet. There are several buttons on the Data tab which allow you to change items such as the node's conditioning; to view things differently by changing the zoom or going to full screen; or to help you input the data for this node by selecting variables. We'll discuss these later. Switch to the General tab of the Node Definition dialog. See Figure 2-6. 28 Chapter 2: Building Decision Analysis Models Syncopation Software Figure 2-6. Node Definition General Tab Switch to the Links tab of the Node Definition dialog. See Figure 2-7. Figure 2-7. Node Definition Links Tab 29 Chapter 2: Building Decision Analysis Models Syncopation Software The Links tab contains information about the links between the node and Excel. There are two categories of spreadsheet links: calculation links and initialization links. Calculation links are used to send or receive data from Excel during the course of a run. Initialization links are used to set the values (or probabilities) for a node at the beginning of each run. Initialization links are discussed in Appendix A.3. The radio buttons near the top of the Calculation links section of the dialog indicate whether the node is linked and if so, to what (Excel or a DPL Program). The workbook as well as the sheet and cell that the node is linked to are displayed in edit boxes. The sheet and cell syntax is the same as Excel's syntax (i.e., Sheet1!Cell_name). The table below summarizes the functions of the buttons in the Calculation links section. Button Action Browse... Finds a spreadsheet or allows you to change to which spreadsheet this node is linked. Cell Names… Brings up the Cell Names dialog which can be used to change the sheet/cell to which this node is linked. Go to Cell Takes you to the cell in Excel to which this node is linked. Paste Link Pastes a link to a cell from Excel. Table 2-1. Calculation Links Buttons Click the Go to Cell button. DPL activates Excel and selects the sheet and cell to which the node is linked. As you can see in Figure 2-8, the cell named Cost_per_Unit contains the value $0.80, which is what DPL copied for the node's data. 30 Chapter 2: Building Decision Analysis Models Syncopation Software Figure 2-8. Excel with Linked Cell Selected Switch back to DPL. Click OK to close the Node Definition dialog. 31 Chapter 2: Building Decision Analysis Models Syncopation Software At this point, you may want to name your DPL model and save your Workspace file. Select the item for the model in the Workspace Manager (DPL gave it the default name of "Model1"). Press F2 to edit the name. Type "License vs. In-house" or any other name you'd like. Press Enter to save the edit. Save the Workspace and give it a name of your choice using File | Save. 2.2 Arcs You will now add some influence arcs to the decision model. Influence arcs indicate one or more of three things to DPL: 1) dependency 2) conditioning and/or 3) timing. (Note: see the Glossary of DPL and DA Terms for definitions of dependency and conditioning.) Influence arcs are useful because they visually indicate which nodes depend on or are conditioned by other nodes. You will start by creating an influence arc between Revenue per Unit and NPV. To create an influence arc, click the Model | Influence/Arc | Add button on the ribbon (see Table 1-3). The mouse cursor changes to the begin arc cursor ( ). Place the cursor over the Revenue per Unit node and click. Now the cursor changes to the end arc cursor ( ) and an arc is anchored at the Revenue per Unit node. Revenue per Unit is called the predecessor node for this arc. Place the cursor over the NPV node and click. An influence arc is drawn from Revenue per Unit to NPV. See Figure 2-9. NPV is called the successor node for this arc. 32 Chapter 2: Building Decision Analysis Models Syncopation Software Figure 2-9. Model with Influence Arc An influence arc that points from node A to node B indicates that node B depends on, is conditioned by and/or occurs after node A. In Figure 2-9, the influence arc you just added indicates that NPV depends on Revenue per Unit. Note: DPL indicates which arc is selected by coloring it magenta. In general, DPL indicates which item is selected in the Influence Diagram or Decision Tree by coloring the item magenta. There is an easy way to have DPL automatically generate influence arcs based on your formulas or spreadsheet links. Click Model | Influence/Arc | From Formulas on the ribbon (see Table 1-3). DPL generates the influence arcs from the formulas found in the node data. Your model should now have all the arcs shown in Figure 2-10. 33 Chapter 2: Building Decision Analysis Models Syncopation Software Figure 2-10. Model with All Influence Arcs Note: the above process provided you with some familiarity on how to create individual Excel-linked nodes and how to create influence arcs. This information is useful when building and modifying DPL models. However, DPL also provides a command which will create the model shown in Figure 2-10 in a single step. Before continuing, you will try this now. Select Home | Workspace | Add to WS | Excel Linked Model. Select the same cells as shown Figure 2-3. In the Create Model from Excel dialog, click Browse and select the file New Product Strategy.xls. It will be in the folder with DPL examples, usually C:\Program Files (x86)\Syncopation\DPL8\Examples. Click OK. 34 Chapter 2: Building Decision Analysis Models Syncopation Software Note DPL has created a new model in the Workspace called New Product Strategy (i.e., the same name as the spreadsheet). Other than node arrangement this model is identical to the model in Figure 2-10. This is a much quicker way to build a model from an Excel spreadsheet. However, it is also important to know the steps outlined in Sections 2.1 and 2.2. Select the New Product Strategy model in the Workspace Manager. Press Delete. Click Delete Model in the Confirm Delete dialog. You will now continue with initial model you built. 2.3 Running a Model You are at the point where you can run the model. You may wish to save your Workspace before running the model. Click on the Home tab. Within the Home | Run group there are a number of different output and run options to consider prior to a Decision Analysis run. We will cover these options in more detail later. For now, uncheck Risk Profile and Policy Tree, as these outputs would be uninteresting (see Figure 2-11). Figure 2-11. Decision Analysis Options in Home | Run Group Note that Fast Sequence Evaluation is currently the default Evaluation method indicated by the icon in the Home | Run | Decision Analysis split button. This is the desired evaluation method so click the Home | Run | Decision Analysis icon to run an analysis. We will cover more on evaluation methods later. The Model Get/Pay dialog appears as shown in Figure 2-12. There is one last piece of information you must confirm for DPL: which is the variable in the model that should be used as the output of the model. DPL suggests NPV, which is correct. 35 Chapter 2: Building Decision Analysis Models Syncopation Software Figure 2-12. Model Get/Pay Dialog Click OK to close the Model Get/Pay dialog and run the analysis. DPL runs the model and brings up the Analysis Complete dialog. See Figure 2-13. Figure 2-13. Analysis Complete Dialog You will not normally see the Analysis Complete dialog since it is only displayed if no other outputs are requested in Decision Analysis options within the Home | Run group. In this instance, the model is deterministic; it does not yet include any uncertainty (i.e., it contains no chance nodes, which you will learn about in Section 2.6) so the expected value is just the calculated value of NPV. Click OK to dismiss the Analysis Complete dialog. 36 Chapter 2: Building Decision Analysis Models Syncopation Software 2.4 Decision Nodes You will now enhance your DPL model by adding a decision node. A decision node has two or more alternatives. DPL will choose the decision alternative that maximizes the output of the model (referred to as the objective function). A decision node is represented in the Influence Diagram by a yellow rectangle. Note that the default add node type currently indicated by the icon in the Model | Node | Add split button (see Table 1-2) is value. To create a decision node, drop-down the Model | Node | Add split button and select Decision from the list. The default add node type changes based on the last node type you added. Click anywhere in the Influence Diagram. The Node Definition dialog appears. Type "Product Strategy" for the Name of the node. DPL will automatically split the node name into multiple lines. Note: there is an Alternatives list box on the General tab of the Node Definition dialog for a decision node. You can add, delete, insert or rename decision alternatives. By default, DPL has created two decision alternatives and named them "Yes" and "No". These default alternative names can be changed within File | Options | General. Also, the first decision alternative ("Yes") is designated as the "default" alternative. You don't need to worry about this right now. Default alternatives are relevant in some asymmetric models, which are discussed later in this manual. Select the Yes alternative, type "In-house" to rename it. Note: you may also click the Rename button or press F2 to edit an alternative name. Rename the No alternative to "License". Your node definition dialog should now look like Figure 2-14. 37 Chapter 2: Building Decision Analysis Models Syncopation Software Figure 2-14. Node Definition Dialog for a Decision Node Click OK to close the Node Definition dialog. Your model should now look something like Figure 2-15. 38 Chapter 2: Building Decision Analysis Models Syncopation Software Figure 2-15. Model with Product Strategy Decision In the Decision Tree pane, DPL has begun to build a decision tree for you. This decision tree is called the Default Tree. Up to this point, your model had no decision nodes in it (and no chance nodes, which we will cover soon) so there was nothing for DPL to put in the Default Tree. If you do not modify the decision tree yourself, DPL will continue to build a Default Tree for you. If you build your model entirely from the Influence Diagram and find once it is completed that the Default Tree has the structure you want, then there is no need to change the Default Tree. Once you modify the Default Tree, you have taken control of the tree. DPL will no longer build a Default Tree for you. DPL will continue to add nodes to the Decision Tree when you add nodes to the Influence Diagram but you may need to further modify the Decision Tree for it to be correct for your purposes. You can always ask DPL to create the Default Tree from the current Influence Diagram by clicking Model | Tree | Default Tree (see Table 1-5). 39 Chapter 2: Building Decision Analysis Models Syncopation Software As in the Influence Diagram, DPL uses yellow squares to represent decisions in the Decision Tree. DPL uses blue triangles to indicate endpoints (sometimes called leaf nodes) in the Decision Tree. In order to incorporate the new decision into your model, you will need to add two additional nodes. Create a new value node by dropping down the Model | Node | Add split button and selecting Value from the list. Click near the top of the Influence Diagram to place the new node. The Node Definition dialog appears. Type "License Fee" for the node name. Switch to the Data tab. Type "0.75" for the node data. Click OK to close the Node Definition dialog. Click Model | Influence/Arc | Add (see Table 1-3). Draw an influence arc from License Fee to Revenue per Unit: click on License Fee, and then click on Revenue per Unit. Note: Another way to draw an influence arc is to hold down the Shift key, click on the first node (such as License Fee), and then click on the second node (such as Revenue per Unit). You can also right-click in the Influence diagram and select Add Arc from the context menu. Repeat the process above, adding a new value node called "Price" with data of "2". 40 Chapter 2: Building Decision Analysis Models Syncopation Software Figure 2-16. Model with Price and License Fee Nodes You will now edit the definition of Revenue per Unit to incorporate the Product Strategy decision. Double-click the Revenue per Unit node. The Node Definition dialog appears with the Data tab selected. Click the Conditioning button. The Conditioning dialog appears. Click the checkbox next to Product Strategy as shown in Figure 2-17. 41 Chapter 2: Building Decision Analysis Models Syncopation Software Figure 2-17. Conditioning Dialog Click OK to close the Conditioning dialog. The Node Definition dialog Data tab now indicates that two values are required for Revenue per Unit: one for the In-house alternative of the Product Strategy decision and a second for the License alternative. DPL has copied the value that was specified when the Revenue per Unit node was not conditioned on anything to both entries. DPL indicates the currently selected entry by coloring it magenta in the data input tree. With the In-house alternative selected, click the select Variable button ( ) to display the Select Variable dialog. See Figure 2-18. 42 Chapter 2: Building Decision Analysis Models Syncopation Software Figure 2-18. Select Variable Dialog Double-click Price in the list. DPL replaces the number 2 with Price within the data input tree. Note: In variable names, DPL replaces spaces and punctuation marks with underscores "_" in multiple word node names so the value node "Unit Sales" has a variable name of "Unit_Sales". The variable name is what is used in in expressions (formulas). Using the Select Variable dialog saves typing, reduces errors from misspellings and prevents you from having to remember the names of all the variables in your model. DPL variable names are case sensitive; "Costs" is different from "costs". Use the down arrow to move the selection to the entry for License. Click the select Variable button ( ) and double-click License_Fee in the list. Press Enter. Your data input tree for Revenue per Unit should now look like Figure 2-19. 43 Chapter 2: Building Decision Analysis Models Syncopation Software Figure 2-19. Data Input Tree for Revenue per Unit Node You have now told DPL that when Product Strategy is in the In-house alternative, Revenue per Unit is equal to Price, whereas when Product Strategy is in the License alternative, Revenue per Unit is equal to License Fee. Click OK to close the Node Definition dialog. Your model should now look something like Figure 2-20. Note that DPL has drawn an influence arc from Product Strategy to Revenue per Unit to indicate that Product Strategy conditions Revenue per Unit. Also note that the arrowhead of the arc is colored. DPL uses a blue arrowhead to indicate that the values of Revenue per Unit depend on which state or alternative Product Strategy is in. Arrowhead colors are covered in more detail in Sections 3.2 and 7.2. 44 Chapter 2: Building Decision Analysis Models Syncopation Software Figure 2-20. Model with Revenue per Unit Conditioned on Product Strategy DPL has also updated the Default Tree, adding NPV as a get/pay expression for the decision node Product Strategy. A get/pay expression tells DPL what value to get (i.e., you receive) or pay (i.e., you pay out) at each point in the tree. Get/pay expressions will be covered in more detail in Chapter 6. The get/pay expression is displayed below the branch on which it occurs in the decision tree. For now, leave the get/pay expression as is. Value nodes are not displayed directly in the Decision Tree; rather, the names of value nodes appear in get/pay expressions on branches in the decision tree. Unlike a decision or chance node, a value node is not an "event" which occurs in the sequence of the tree, it is simply a calculated quantity. 45 Chapter 2: Building Decision Analysis Models Syncopation Software You will now neaten up your model by bending the arc from Product Strategy to Revenue per Unit. Select the influence arc with the left mouse button and without releasing the mouse button begin to drag the arc. The mouse cursor will change to the arc bend cursor ( to preview the bended arc. ) and a dashed line will appear Continue dragging until your arc looks something like the arc in Figure 2-21. Release the mouse to fix the arc in place. Figure 2-21. Model with Bent Arc When you defined conditioning for Revenue per Unit, you used the Conditioning dialog. DPL also provides a way for you to define conditioning by changing the arcs in the Influence Diagram. You will now use this procedure to condition Cost per Unit and Marketing Costs on Product Strategy. 46 Chapter 2: Building Decision Analysis Models Syncopation Software Click Model | Influence/Arc | Add on the ribbon (see Table 1-3). Draw an arc from Product Strategy to Cost per Unit: click on Product Strategy, and then click on Cost per Unit. Double-click the new influence arc. The Value Influence Type dialog appears. Check the Different values for each conditioning event state checkbox as shown in Figure 2-22. Figure 2-22. Value Influence Type Dialog Click OK to close the Value Influence Type dialog. You have now told DPL that Cost per Unit is conditioned by Product Strategy. Double-click Cost per Unit. The Node Definition dialog appears with the Data tab selected. Note that DPL has changed the node data input tree so that it is conditioned on Product Strategy and has copied the data for Cost per Unit to each of these data entry slots. Arrow down to select the License alternative. Type "0" and press Enter. Your node data input tree should look like Figure 2-23. (This is a very simple model; if Product Strategy is in the License alternative, costs equal zero.) 47 Chapter 2: Building Decision Analysis Models Syncopation Software Figure 2-23. Node Data Input Tree for Cost per Unit Click OK to close the Node Definition dialog. You will now try a different procedure to create an influence arc between Product Strategy and Marketing Costs. To do this you will select multiple nodes in the Influence Diagram by holding down Control and clicking. Click Product Strategy to select it. Hold down Ctrl and click Marketing Costs to also select it. Click Model | Influence/Arc | Add. DPL creates an arc from Product Strategy to Marketing Costs. If you have exactly two nodes selected DPL will create an influence arc from the first selected node to the second selected node when you click Model | Influence/Arc | Add. Now repeat the remaining procedure above to make Marketing Costs conditioned on Product Strategy by changing the arc type. Like Cost per Unit, Marketing Costs will be zero if Product Strategy is in the License alternative. See Figure 2-24. 48 Chapter 2: Building Decision Analysis Models Syncopation Software Figure 2-24. Node Data Input Tree for Marketing Costs If you wish, bend the influence arc from Product Strategy to Marketing Costs. Your model should now look something like Figure 2-25. 49 Chapter 2: Building Decision Analysis Models Syncopation Software Figure 2-25. Model with Conditioning from Product Strategy Decision Note in this example you conditioned several nodes on the Product Strategy decision. For example, you specified that both Cost per Unit and Marketing Costs were zero if the Product Strategy alternative is License. Another way to do this would be to link the decision node to the spreadsheet with flag values (e.g., 1 and 2) and putting the logic for marketing costs, etc. in the spreadsheet (e.g, an Excel formula such as =if(Product_Strategy=2,0,Marketing_Costs)). As with any other node type, decision nodes can be linked to Excel. Now that you have added a decision to your model, you will run it again. You may wish to save the workspace first. For the Decision Analysis options within the Home | Run group make sure Risk Profile is unchecked. If Policy Tree™ is unchecked, check it. The Home | Run group should look like Figure 2-26. 50 Chapter 2: Building Decision Analysis Models Syncopation Software Figure 2-26. Decision Analysis Options for Model with Decision Click Home | Run | Decision Analysis or press F10 (F10 is the shortcut for the default run type indicated in the Home | Run | Decision Analysis icon). DPL runs the model with the newly added decision node and produces the Policy Tree™ output that you requested. See Figure 2-27. Figure 2-27. Policy Tree™ for Model with Decision 51 Chapter 2: Building Decision Analysis Models Syncopation Software DPL has created an item in the Workspace Manager for the Policy Tree™, which displays information in a decision tree format about the results of the decision analysis. The first thing to note is the structure of the Policy Tree™. It displays the Product Strategy decision you added to the model with each of its branches and a blue triangle at the end of each branch. As mentioned previously, the blue triangle is DPL's representation for an endpoint. As the model currently stands, the Policy Tree™ has two endpoints: one for the In-house branch and one for the License branch. The Policy Tree™ also displays the expected value (or rolled back expected value) at each point in the tree in square brackets ([]). The [105.1] next to Product Strategy is the expected value of the objective function for the complete model or tree. Look further down the tree to the two rolled back expected values that appear next to each blue triangle and you see that the expected value at the endpoint for In-house is 105.1 and the expected value for the endpoint at License is 93.7. As mentioned in Section 2.4, DPL maximizes the objective function of a model. Therefore when confronted with a decision with two alternatives, one of which has a rolled back expected value of 105.1 and the other a rolled back expected value of 93.7, DPL chooses the alternative with a rolled back expected value of 105.1. This can be seen in the Policy Tree™, not only by the [105.1] next to Product Strategy, but also by the In-house branch of Product Strategy being displayed with a thick branch. DPL indicates the optimal alternative of a decision at each point in the Policy Tree™ by displaying the optimal alternative with a thick branch. Recall that 105.1 is the same expected value result from when you ran the model in Section 2.3. So the model has not changed much from how it was originally constructed. The optimal decision alternative is to produce the product in-house. When the Policy Tree™ is created and activated a new ribbon tab labeled "Policy" with a yellow context shading and outline appears. Policy Trees™ and the commands within the Policy tab will be covered in more detail in Section 3.1. 52 Chapter 2: Building Decision Analysis Models Syncopation Software 2.5 Value Tornado Diagram You may want to know how sensitive the decision to produce the product in-house is to changes in value for the variables in your model. This can be accomplished by running a Value Tornado. Note that since the model is deterministic (has no chance nodes -- only value and decision nodes) the Value Tornado diagram is the only type of tornado diagram you can run at this point. Click Home | Sensitivity | Tornado (Value Tornado is the default currently indicated by the icon) or press F8 (F8 is the shortcut to run the default tornado type). You will see a blank Value Tornado Setup dialog similar to Figure 2-28 (the figure shows the dialog with the values already entered). The Value Tornado Setup dialog provides a table in which to enter the low and high settings (range) for each value node that is not a formula. The middle column shows the current setting for each variable. The Cost per Unit and Marketing Costs variables are not included in the table initially because they are conditioned by the decision and thus have more than one value. We will add these variables to the table manually. Within the Value group select Cost per Unit from the drop-down list and click Add. A line for "Cost_per_Unit|Product_Strategy.In_house will be added to the table. Again, within the Value group select Marketing Costs from the dropdown list and click Add. Click the blank cell for the Low value of Launch Costs and enter 20. Click the blank cell in the High column of Launch Costs and enter 25. Continue to fill in the Value Tornado Setup dialog with the rest of the High and Low values shown in Table 2-2. Note that you can use the arrow keys to move around. 53 Chapter 2: Building Decision Analysis Models Syncopation Software Value Low High Launch Costs 20 25 License Fee 0.7 0.8 Price 1.9 2.3 Unit Sales 20 60 Cost per Unit 0.8 1 Marketing Costs 5 20 Table 2-2. Variables and Ranges for a Value Tornado When you are done, the Value Tornado Setup dialog should look like Figure 2-28. Figure 2-28. Value Tornado Setup Dialog 54 Chapter 2: Building Decision Analysis Models Syncopation Software Note that the Low value for Cost per Unit is the same as the current value. Assume you have reliable information that the cost cannot be less than 0.8. You have now selected the values to include in the Value Tornado and specified ranges for each. Click OK to run the Value Tornado. DPL generates the Value Tornado as displayed in Figure 2-29. Figure 2-29. Value Tornado Diagram The x-axis (horizontal axis) of the Value Tornado diagram displays the change in the objective function of the model as each of the variables on the left is changed from the low setting you specified to the high setting you specified. For a given variable (e.g., Unit Sales) it is changed from the low setting to the high setting while all other variables are held at their current settings. DPL runs the model once to establish the value of the objective function with all variables at their current setting (for a model with only value and decision nodes). This is called the Base Result and is indicated by the vertical line in the Value Tornado. See Section 2.7 for a further discussion of the Base Result. Note that the vertical line on the diagram is at 105.1, which is the value you obtained running the model previously. DPL sorts the bars so that the variable that has the biggest impact on the objective function is at the top. 55 Chapter 2: Building Decision Analysis Models Syncopation Software The changes in color indicate that a policy change has occurred for either the low or high setting of the variable. In this model, a policy change occurs when a different alternative is optimal for the upfront decision (the decision at the head, i.e., far left, of the decision tree) from that which is optimal for the Base Result policy. We will further discuss policy changes in Sections 2.7 and 3.7. DPL indicates that a policy change has occurred for the low setting of the variable by displaying a portion of the bar for that variable in blue. For a high setting policy change, the end of the bar is displayed in light magenta. The legend on the tornado diagram helps to explain this. For different values, the blue and/or light magenta may occur on either side of the vertical line representing the Base Result. In Figure 2-29, light magenta and blue both occur to the left of the Base Result. This is because a low setting of Unit Sales decreases the objective function (NPV) while a high setting of Marketing Costs also decreases the objective function. Note that DPL displays the change in color from green to blue (or light magenta) midway between the value of the objective function for the current setting and the value for the low (or high) setting. For each variable, DPL has only tested a low, nominal and high value and the change in color does not indicate the exact value at which the change in policy occurs. If you would like more precise information on when the change in policy occurs, you could run a Rainbow Diagram (see Section 3.7) to narrow down the range. When a tornado diagram or any other graphical output is generated and active, the Chart tab group opens with a pink context shading and outline. It contains two tabs: Series and Format. Within the Format tab you can change several display options: titles, legends, axis, colors, lines, shading, and overall display of the chart. To format the policy change colors, you can chose from color palettes provided with DPL by checking the Use palette checkbox and then choosing a palette from the palette gallery in Chart | Format | Color. You can also choose a custom color via the bucket fill icon. If you have specific color preferences, such as a corporate standard color scheme for presentations, you can create your own custom palette in .xml format and add the file to the location indicated in the Palette tooltip (the tooltip will appear when you hold your mouse over one of the palette selections). You can format the selected text within the chart via the View | Font group. 56 Chapter 2: Building Decision Analysis Models Syncopation Software To add labels to your chart, check the Show checkbox in Chart | Series | Labels. The labels include the High/Low input values for each variable and the resulting objective function (i.e., NPV) values. Check the EV/CE Values checkbox in Chart | Format | Display. The tornado is updated as shown in Figure 2-30. Figure 2-30. Value Tornado with Values Displayed DPL displays the low and high settings for each variable as well as the expected value of the objective function when the variable is at its low and high setting. The variables' low or high settings appear before the "/" character and the expected values appear after. In addition, DPL displays the expected value for the Base Result at the bottom of the vertical line in the Value Tornado. If a variable has no impact on the objective function as it is changed from its low to high setting, DPL displays a zero width bar and no labels for that variable (as is the case for License Fee). 57 Chapter 2: Building Decision Analysis Models Syncopation Software The Value Tornado indicates that four variables result in a change in policy if they are at either their low or high setting. These variables are called decision sensitive. In this sample model, there is only one decision with two alternatives, so we know that a policy change implies that rather than producing the product In-house the optimal alternative is to License it. For more information on determining what policy change has occurred, see Section 3.7. You have just discovered that several of the variables in your model are decision sensitive. Assume you do not know the value of these variables for certain. You may want to know what the optimal policy is when these variables are treated as uncertainties. You will now change your model in order to treat these variables as uncertain quantities. You're about to make significant changes to the model, so you will create a copy of the model as it is and edit the copy. This is good practice when you have results, such as a Value Tornado, which are based on a simpler version of your model and which you may later need to reproduce. Right mouse-click on the item for the model in the Workspace Manager. The Workspace Manager context menu appears. Select Duplicate. The model is duplicated with the same name plus "– copy" appended to it. Click the item for the new model in the Workspace Manager and Press F2 to edit the name. Rename it "License vs. In-house prob". Press Enter. The new model is now active in the Model Window. You may wish to save the workspace at this point. 58 Chapter 2: Building Decision Analysis Models Syncopation Software 2.6 Discrete Chance Nodes You will now introduce uncertainty into the model by changing some of the value nodes to discrete chance nodes. In DPL, a discrete chance node has two or more outcomes which occur with specified probabilities. DPL evaluates each chance outcome to calculate the expected value of the decision model when rolling back the decision tree. A discrete chance node is represented in the Influence Diagram by a bright green oval. You will now change the value nodes that are decision sensitive into discrete chance nodes. Select Unit Sales. The Node Definition dialog appears as shown in Figure 2-31. Click the drop-down split of the Model | Node| Change To button on the ribbon (see Table 1-2) and select Discrete Chance from the list. Figure 2-31. Node Definition Dialog General Tab for a Discrete Chance Node 59 Chapter 2: Building Decision Analysis Models Syncopation Software The General tab of the Node Definition dialog for a discrete chance node contains an Outcomes list box. You can add, delete, insert or rename chance outcomes. DPL has created three chance outcomes and named them "Low", "Nominal" and "High". These defaults can be changed in File | Options | General. Note: As you saw with decision node alternatives in Section 2.4, DPL has designated one of the outcomes ("Nominal") as the "default" outcome. You don't need to change this setting for the purposes of this tutorial. Leave the settings as they are on the General tab and select the Data tab. The Data tab for the Unit Sales discrete chance node is shown in Figure 2-32. Figure 2-32. Node Definition Dialog Data Tab for a Discrete Chance Node 60 Chapter 2: Building Decision Analysis Models Syncopation Software There are a number of elements on the Data tab for a discrete chance node. You have already used the Conditioning button to condition Revenue per Unit. The Conditioning button for a discrete chance node works in a similar way. In addition to the Value edit box, there is a Probability edit box and a Distribution type drop-down list. You can specify numbers or formulas in the Probability edit box in a similar manner to specifying data for values. You can change the type of the distribution using the Distribution type drop-down list. The Distribution type drop-down list will be discussed in Chapter 5. DPL assigns default probabilities to the three chance outcomes. Like the outcome names, these probabilities can be changed in File | Options | General. DPL also assigns the low and high values that you specified in the Value Tornado to the Low and High outcomes (as well as the value that was specified for the value node to the Nominal outcome). Click OK to accept the probabilities and the previously specified low and high values. Press ESC to deselect Unit Sales. Your model should look something like Figure 2-33. 61 Chapter 2: Building Decision Analysis Models Syncopation Software Figure 2-33. Model with Sales Changed to a Discrete Chance Node Note that DPL has updated the Default Tree by adding the Unit Sales discrete chance node to it and moving the NPV get/pay expression to the branches for Unit Sales. In the Decision Tree, DPL displays discrete chance nodes as bright green circles. Note: if you select the Unit Sales node in the Influence Diagram, the corresponding Unit Sales node in the Decision Tree will turn light magenta, indicating the node is selected in the Influence Diagram pane. Conversely, if you select the Unit Sales node in the Decision Tree pane, the Unit Sales node in the Influence Diagram will turn light magenta. 62 Chapter 2: Building Decision Analysis Models Syncopation Software Select Cost per Unit and change it to a Discrete Chance Node. Note that the last node type changed to was Discrete Chance, so it is now indicated as the default in the Change To icon. Now you can simply click the Model | Node | Change to icon. The Node Definition dialog appears with the General tab selected. Click OK. The Node Definition dialog should now look like Figure 2-34. You will now remove one of the chance outcomes that DPL provides by default. On the General tab of the Node Definition dialog, select the Low outcome in the Outcomes list box and click the Delete button. Figure 2-34. Node Definition Dialog General Tab for Cost per Unit Select the Data tab of the Node Definition dialog. Because Cost per Unit is conditioned by the Product Strategy decision, there are two sets of probabilities and values, one for In-house and one for License (See Figure 2-35). No probabilities are given for the Nominal and High outcomes. The default probabilities are only given for chance nodes with the same number of outcomes as specified by the defaults in File | Options | General. However, the Nominal and High value data that you specified for the In-house alternative when you ran the Value Tornado are filled in. 63 Chapter 2: Building Decision Analysis Models Syncopation Software Figure 2-35. Node Definition Dialog Data Tab for Cost per Unit Type "0.6" in the Probability edit box for the Nominal branch of the Inhouse alternative. Arrow down twice to select High. Type "0.4" in the Probability edit box for High. Because both outcomes have value zero, the probabilities under the License branch don't affect the results, but they need to be filled in. Arrow down twice to move to the probability for Nominal under the License branch. Type "0.5" in the Probability edit box for Nominal. Accept the default outcomes and select the Data tab. Arrow down twice to select High. Type "0.5" in the Probability edit box for High. Click OK to close the Node Definition dialog. Change the Node Type of Marketing Costs to a discrete chance node (Model | Node | Change To). Accept the default probabilities and previously specified values. Click OK to close the Node Definition dialog. Repeat the above steps for Price. 64 Chapter 2: Building Decision Analysis Models Syncopation Software Note: If you don't review the data on the Data tab, DPL will warn you that default probabilities have been used when you first run the model and will ask whether you wish to continue the run with those probabilities. As you saw earlier, you can select multiple nodes in the Influence Diagram. When changing node types, you can select multiple unconditioned value nodes and change them to discrete chance nodes or vice versa. In this example, we could have selected both Unit Sales and Price and changed them simultaneously to discrete chance nodes. If you'd like to try this now, select them both (hold down Ctrl while selecting), change them to value nodes (Model | Node | Change To | Value). You will get a warning. Click OK. Then change them back to discrete chance nodes (Model | Node | Change To | Discrete Chance). If you try this and don't review the node data, you will get the default probabilities warning mentioned above. Your model should now look something like Figure 2-36. DPL has updated the Default Tree further by adding the discrete chance nodes for Cost per Unit, Marketing Costs, and Price and by moving the NPV get/pay expression to the end of the tree on the branches for Price. 65 Chapter 2: Building Decision Analysis Models Syncopation Software Figure 2-36. Model with Three Discrete Chance Nodes You are now almost ready to run the modified model with uncertainty incorporated into it. There are now two models in the Workspace. DPL will always run an analysis on the model you are viewing or on the model whose output you are viewing. If that model is not the bold model in the Workspace Manager, DPL will make it the bold model. 66 Chapter 2: Building Decision Analysis Models Syncopation Software 2.7 Base Case Tornado Diagrams You are now ready to run another sensitivity analysis on your model: the Base Case Tornado Diagram. The Base Case Tornado diagram is designed for models which have several discrete chance nodes, each with a plausible default state (the Nominal or Base Case value) and most of which have three (or more) outcomes. To compute a Base Case Tornado Diagram, DPL first sets all discrete chance nodes to a state that you define to be Nominal for each node to calculate a Base Case. It then varies each discrete chance node individually to a state you specify to be Low and to a state you specify to be High while keeping all other discrete chance nodes at their Nominal states. The Base Case Tornado Diagram is useful for understanding the impact of each discrete chance node on the model's objective function. To run a Base Case Tornado Diagram, drop-down the Home | Sensitivity | Tornado split button and choose Base Case from the list. The Base Case Tornado Setup dialog appears as shown in Figure 2-37. Figure 2-37. States for Base Case Tornado Diagram Dialog Note: the default tornado type for the Home | Sensitivity | Tornado split button changes based upon the last tornado type you have run. The default is now Base Case Tornado. 67 Chapter 2: Building Decision Analysis Models Syncopation Software To run a Base Case Tornado Diagram, you must tell DPL which state (i.e., outcome) is Low, Nominal and High for each discrete chance node. For three-outcome discrete chance nodes, this is usually straightforward. If you have used the default discrete chance node settings provided by DPL, the exercise is easy, as is the case for Marketing Costs, Price and Unit Sales. Figure 2-37 indicates that the states specified to be Low, Nominal and High for Marketing_Costs, Price and Unit Sales are Low, Nominal and High, respectively. Double-click in the cell for the Low State of Marketing Costs. You can see that there is a combo box that allows you to type or select the setting for the state of this chance node. Use the arrow keys to move around the other cells for each state of each chance node, leaving the settings as DPL has suggested. You will also notice that since Cost per Unit is a two-outcome discrete chance node, one of its outcomes will have to be repeated for the Low, Nominal or High state specification. DPL has suggested using the Nominal state for both the Low and Nominal tornado diagram setting. Leave this setting as is. Note: to start DPL chooses the outcome defined to be Default in the Node Definition dialog to be Nominal for a Base Case Tornado, the first outcome for Low and the last outcome for High. For discrete chance nodes with more than three outcomes, you may need to change the settings in the Base Case Tornado Setup dialog. Click OK to run the Base Case Tornado Diagram. DPL produces the Base Case Tornado Diagram as shown in Figure 2-38. In this example the Base Case Tornado is similar to the Value Tornado that you ran on the deterministic model (i.e., the model with no discrete chance nodes) in Section 2.5. This will not always be the case for several reasons. First, the Base Result of a Value Tornado may not be the same as the Base Case for the Base Case Tornado if the states chosen as Nominal for the Base Case Tornado do not match what was used as the current values in the Value Tornado. Second, if you change the high or low values for value nodes that you have changed to discrete chance nodes, the two tornado types will differ. 68 Chapter 2: Building Decision Analysis Models Syncopation Software Figure 2-38. Base Case Tornado Diagram Base Case Tornado Diagrams are useful for understanding how the chance nodes in your model impact the objective function. They are also flexible because you can add bars to a Base Case Tornado Diagram for values in your model. This allows you to compare the impact of chance nodes across their range of states to the impact of changes in values across a range of settings. Lastly, Base Case Tornado Diagrams are very quick to run which may be helpful for larger models with many chance nodes. While Base Case Tornado Diagrams are relatively simple and easy to understand, they can be limited in terms of showing impacts in a probabilistic model where there is a lot of conditioning and/or where probabilities represent skewed distributions. Base Case Tornado Diagrams don't use probabilities, so if, for example, the probabilities of a chance node reflect a skewed distribution, the Base Case Tornado will show the same results as for a symmetric distribution. A Base Case Tornado is also difficult to use when there is no natural middle case, as in a risk analysis model which considers a number of very unlikely bad outcomes. In later chapters we'll discuss more advanced tornado diagrams that can be insightful for complex models. See Section 14.3, When to Use Which DPL Sensitivity Output, for a comparison. 69 Chapter 2: Building Decision Analysis Models Syncopation Software 2.8 Initial Decision Alternatives Tornado Diagram The Initial Decision Alternatives Tornado diagram is an extension of the Base Case tornado that you ran in Section 2.7. To create an Initial Decision Alternatives Tornado, DPL sets the initial decision to each of its possible alternatives and runs a Base Case tornado for each alternative. The resulting Base Case tornadoes are then shown on one diagram. You will now run an Initial Decision Alternatives tornado using the model you built in the previous sections. Make sure the "License vs. In-house prob" model is still the active model. Drop down the Home | Sensitivity | Tornado split button and select Initial Decisions Alternative from the list. The Initial Decision Alternatives Tornado Setup table appears. It should be identical to the Base Case Tornado Setup table you examined in Section 2.7. Leave the settings as they are. Click OK. An Initial Decision Alternatives tornado appears as shown in Figure 2-39. 70 Chapter 2: Building Decision Analysis Models Syncopation Software Figure 2-39. Initial Decision Alternatives Tornado Diagram The tornado shown in Figure 2-39 is an example of a very simple Initial Decision Alternatives tornado. There are two initial decision alternatives (In-house and License), so the tornado diagram essentially consists of two Base Case tornadoes on one chart. The diagram shows that the chance event Unit Sales has the greatest impact on the objective function value, regardless of which initial alternative is pursued. It also shows that the impact on the objective function of Unit Sales is less for the License alternative than it is for the In-house alternative (the bar for License is narrower). Also, the diagram shows that if the License alternative is pursued (despite the fact that it is not the optimal policy), the chance events Marketing Costs and Cost per Unit have no effect on the objective function. This makes sense based on how the model is set up. If the product is licensed, there are no marketing costs or per unit costs in the calculation of NPV in the spreadsheet. 71 Chapter 2: Building Decision Analysis Models Syncopation Software Initial Decision Alternatives tornadoes are helpful for comparing the impact of each chance event on the objective function across the possible alternatives of the initial decision in the model. Although the tornado you ran in this section is simple and illustrative, Initial Decision Alternatives tornadoes can be quite powerful when used with models that incorporate several strategic alternatives and several chance events. Note in the simple example model there is only one decision in the model. Since DPL runs an Initial Decision Alternatives Tornado by fixing the initial decision at each alternative and running a Base Case Tornado, no policy changes will be seen in this model. However for models with subsequent decisions after the initial decision (often referred to as downstream decisions), policy changes may occur in an Initial Decision Alternatives Tornado since the optimal alternative may change for a downstream decision. You may want to save the workspace before you proceed to Chapter 3, Decision Analysis Results. 72 Chapter 3: Decision Analysis Results Syncopation Software 3 Analyzing Decision Analysis Models The model you built in Chapter 2 is now ready to produce the full suite of results that are available within the Home | Run group when you run a decision analysis. We will discuss each of these options in more detail now. See Tables 3-1 through 3-3 below. Control Description This section determines how DPL will analyze the decision tree. Fast sequence evaluation Provides the exact expected value of the objective function but optimizes run time by using the structure of the tree to avoid visiting every endpoint of the tree. The Risk Profile (and hence percentiles) may be approximate. Full tree enumeration Provides exact expected value of the objective function and visits every endpoint of the tree. The Risk Profile (and percentiles) is exact, and the Endpoint Database can optionally be recorded for re-use. Discrete tree simulation Provides an estimate of expected value by sending a specified number of samples down paths in the tree. Useful to reduce runtime when an exact expected value is not required. Table 3-1. Evaluation Method Types 73 Chapter 3: Decision Analysis Results Syncopation Software Control Description This section controls the probability distribution related outputs that DPL will provide for a model run. Risk Profile Creates a graph showing the full range of possible outcomes from the model. The format of the graph can be changed after the model run. Init Dec Alts (Initial Decision Alternatives) Creates risk profile graphs for each of the alternatives of the decision at the head of the tree. Table 3-2. Distribution Output Options 74 Chapter 3: Decision Analysis Results Syncopation Software Control Description This section controls the decision policy related outputs that DPL will provide for a model run. Policy Tree™ Creates an output tree that displays the optimal alternative for each decision, the probability of each outcome for each discrete chance node, get / pay values and rolled-back expected values at each point in the tree. Policy Summary™ Creates a view that summarizes the information in the Policy Tree™ for each decision and chance node. Expected Value of Perfect Information / Control Creates a chart showing the expected value of perfect information and the expected value of control of each discrete chance node in the model. Number of levels Tells DPL how many levels down the tree to gather policy information. A tree with N nodes in its longest path will have N+1 levels. Must be set to all for Expected Value of Perfect Information / Control. Endpoints Tells DPL to record an endpoint database for the run. The endpoint database allows you to "replay" the endpoints to quickly perform further analyses without recalculation. If Endpoints is checked, the evaluation method is set to full tree enumeration. 75 Chapter 3: Decision Analysis Results Value Correlations Syncopation Software Creates a bar chart showing the correlation coefficient between each value in the model and the objective function. Table 3-3. Policy Output Options The last section of the Home | Run group contains two buttons, Clear Mem ( ) and Compile ( ). Clear Mem tells DPL to clear the compile structures and any unsaved results from a Decision Analysis run for the active model. The Compile command tells DPL to compile the active model to test for missing data or other errors. Note that there are two additional evaluation methods in the Decision Analysis drop-down list not included in Table 3-1, Monte Carlo simulation and Full Tree Enumeration from Endpoints. Monte Carlo simulation and the options associated with this method will be covered in Chapter 5. Full Tree Enumeration from Endpoints will be covered in Chapter 11. The dialog box launcher for the Run group contains a number of run options. Most of the options are self-explanatory. A few of the options will be discussed later in the manual in the sections on Risk Profiles and Time Series Percentiles. If you haven't already done so, start DPL and open the workspace you saved from Chapter 2 by using File | Open or pressing Ctrl+O. Note: if you're starting here and haven't worked through the tutorial in Chapter 2, open the workspace New Product Strategy.da from the Examples folder in your DPL installation folder. Make sure the "License vs. In-house prob" model is the active model. The Decision Analysis options selected in Home | Run should be as shown in Figure 3-1. 76 Chapter 3: Decision Analysis Results Syncopation Software Figure 3-1. Decision Analysis options for Full Model Leave Evaluation method at Fast sequence evaluation. Make sure Init Dec Alts (i.e., Initial Decision Alternatives) is not checked. Make sure Policy Tree™ is checked. Make sure Risk Profile is checked. Leave Drop-down list as Objective Function. Make sure Number of levels is set to "6 (all)". Make sure Policy Summary™, Expected Value of Perfect Information/Control (VOIC), Endpoints, and Value Correlations are not checked. Click the Home | Run | Decision Analysis icon or press F10. DPL runs the analysis and produces the requested outputs. 77 Chapter 3: Decision Analysis Results Syncopation Software 3.1 Policy Tree™ The Policy Tree™ output will be active after the run is complete as shown in Figure 3-2. Before discussing the Policy Tree™, take another look at the Workspace Manager. Note that DPL has put double chevrons ("»»…««") around the "License vs. In-house prob" model you just ran. This indicates the model is compiled (i.e., checked for errors and data structures loaded in memory) and is ready to run. Once you modify the model, the compiled indicator is removed. Figure 3-2. Policy Tree™ for Probabilistic Model The Policy Tree™ indicates that In-house is still the optimal decision alternative with a thick branch. The expected value of the model has changed from 105.1 to 107.7. Note that this is the first time that you have a true expected value that incorporates probabilities, since there are now chance events in the model. The Policy Tree™ in Figure 3-2 also differs from the previous Policy Tree™ in Figure 2-27 because it now contains more levels. DPL indicates this by displaying discrete chance nodes at the end of each decision alternative branch of the Product Strategy decision. Recall in the previous Policy Tree™ that there were endpoints at the end of each of the decision alternative branches. To look further at the Policy Tree™ you will expand the discrete chance node at the end of the In-house branch. 78 Chapter 3: Decision Analysis Results Syncopation Software Select the Cost per Unit discrete chance node at the end of the Inhouse decision alternative branch. The Expand split button within Policy | Display group becomes active. The Expand split drop-down lists five menu commands for changing the state of expansion of the Policy Tree™. If you were to right-click on the same node in the Policy Tree™ to bring up the context menu you will find four of the same expand commands, with the exception of the Expand All command. All are summarized in Table 3-4 below. Control Action Expand Expands the currently selected node one level if the node has never been expanded before or to the previously expanded state. This can also be accomplished by doubleclicking the node. Expand and Zoom Does the same thing as Expand but then zooms the Policy Tree™ so that the whole tree can be seen. This can also be accomplished by Shift+double-clicking the node. Expand to Level... Brings up the Expand Policy Tree™ dialog in which you can specify the level to which you want the subtree expanded. The Policy Tree™ is expanded from the node selected. Expand Subtree Expands the entire subtree in the Policy Tree™ from the selected node. Expand All Expands the entire Policy Tree™ so that all nodes are expanded. Table 3-4. Policy Tree™ Expand Commands With the node still selected, drop-down the Expand split button and select Expand to Level. The Expand Policy Tree™ dialog appears. 79 Chapter 3: Decision Analysis Results Syncopation Software Enter 4 in the Expand to Level edit box in the dialog. Leave Zoom full after expanding checked. Click OK. The Policy Tree™ should now look similar to Figure 3-3. Figure 3-3. Policy Tree™ with In-house Subtree Expanded 3 Levels Note that once the subtree has been expanded and the discrete chance node it expanded from is still selected the Expand button will no longer be enabled in the ribbon or the context menu. The Collapse button is now enabled on the ribbon. There are two collapse options, Collapse and Collapse and Zoom. Analogous to Expand, the Collapse command will collapse the tree to the previous level. This can also be accomplished by double-clicking the node. While you have expanded above, there are still deeper levels that are not shown. Select the Marketing Costs node in the top right corner. Click Policy | Display | Expand Subtree. Click the Zoom | Full button on the status bar, located at the lower right corner of the screen. The Policy Tree™ should now look like Figure 3-4. Now the Policy Tree™ is expanded so that we can see nine endpoints (displayed as blue triangles) at the top right corner of the tree. This model contains 108 endpoints (or paths), so the tree would be difficult to read if 80 Chapter 3: Decision Analysis Results Syncopation Software we displayed them all at once. Practical applications often involve thousands or millions of endpoints, so it's important to be able to manipulate the Policy Tree™ to show the desired information. Figure 3-4. Policy Tree™ Expanded to Endpoints Nodes in the Policy Tree™ are displayed using the same symbols as in the Decision Tree. Decision nodes are yellow squares. Discrete chance nodes are bright green circles. Endpoints are blue triangles. For a closer look at the data elements displayed in the Policy Tree™ and a description see Figure 3-5, Table 3-5 and Table 3-6. 81 Chapter 3: Decision Analysis Results Syncopation Software Figure 3-5. Data Elements in Policy Tree™ Data element (location key) Definition Node Name (1) Rolled-back expected values (2) Value is displayed in square brackets, e.g., [107.7]. The expected value of the objective function for the subtree headed by the node adjacent to the value. For example, in Figure 3-4 look at the top occurrence of Cost per Unit. This is in the scenario where Product Strategy is In-house and Unit Sales is low. The expected value at this point in the tree is 18.3 (displayed below the node name). The probability of Cost per Unit being Nominal is 60% and being High is 40%. The expected values at the ends of these branches are 24.4 and 9.2, respectively. So “rolling back” the tree to calculate the expected value where Product Strategy is Inhouse and Unit Sales is low, you take 60% * 24.4 + 40% + 9.2 = 18.3. Table 3-5. Node Information Displayed in the Policy Tree™ 82 Chapter 3: Decision Analysis Results Syncopation Software Data element (location key) Definition State name (3) Branch probability (4) The conditional probability of this discrete chance outcome occurring on this path. If the discrete chance is conditioned by other nodes, this is the probability of the chance outcome occurring given the outcomes on this path of the nodes that condition it. The probability can either be displayed as a percent between 0%-100% or as a number between 0-1. This data is displayed for Discrete Chance nodes only. Get/pay values (5) The value of the get/pay expression (if any) that occurs at this point in the tree. If there is no get/pay value at this point in the tree, then nothing is displayed. Table 3-6. Branch Information Displayed in the Policy Tree™ In the model you have developed so far, there is only one get/pay expression (NPV) in the tree on the branches of Price. Price is the last discrete chance node in the tree (furthest to the right). In the Policy Tree™, the endpoints follow it. Therefore, you will see the get/pay value for NPV below each branch of each Price node. At the end of the tree, the NPV value is for a single, specific scenario. You could verify the NPV for that specific scenario in the spreadsheet by setting the inputs in the spreadsheet to be the inputs for the path in the tree. Since this model only has one get/pay expression, the rolled-back expected value is the same as the value of the get/pay expression at each endpoint, which is why the same number appears above and below the branch. You can use the Policy Tree™ to find out a number of things about your model. For example, the expected value of the model is 18.3 given that you develop the product in-house and that sales turn out to be low (18.3 is the rolled-back expected value above the node Cost per Unit on the Low branch of the Sales node which is on the In-house branch of the Product Strategy decision). 83 Chapter 3: Decision Analysis Results Syncopation Software Try manipulating the Policy Tree™ by expanding / collapsing different parts of it. You can do this by double-clicking a node, using the context menu or using the Expand/Collapse split buttons within the Policy | Display group on the ribbon. You can also control the data elements that are displayed in the Policy Tree™. Select Policy | Display | Options (the dialog box launcher) with the Policy Tree™ active. The Format Policy Tree™ dialog appears as shown in Figure 3-6. Figure 3-6. Format Policy Tree Dialog You can use the two spin buttons to increase or decrease the Branch length and Branch offset percentages to alter the shape and appearance of the tree. Experiment with using the checkboxes to turn on and off the different data elements the tree displays. 84 Chapter 3: Decision Analysis Results Syncopation Software 3.2 Risk Profile As shown in Figure 3-2, DPL creates an item in the Workspace Manager for each of the outputs it created. To be exact, DPL creates one or more items for each output. For Risk Profiles, DPL creates an item for the Risk Profile chart and an item for each Risk Profile dataset that is created. In the decision analysis run that you requested previously, DPL created one Risk Profile dataset for the optimal initial decision alternative. If you had requested Initial Decision Alternatives, DPL would have created two Risk Profile datasets: one for In-house and one for License. In addition, DPL would have created a Risk Profile chart showing the risk profiles for both alternatives. In the Workspace Manager, a Risk Profile chart is indicated by the icon ( ) and a Risk Profile dataset by the icon ( ). When you request a Risk Profile for the optimal alternative only, DPL names the Risk Profile chart and dataset "Expected Value". DPL encloses items in the Workspace Manager that do not correspond to windows (such as the Risk Profile datasets) with curly braces i.e., {Expected Value}. Double-click on the item for Risk Profile chart called Expected Value ( ) in the Workspace Manager to activate the window. You may also select it and press Enter. The Expected Value Risk Profile chart becomes active as shown in Figure 3-7. Note: you can also double-click on the Risk Profile dataset called Expected Value. DPL activates the Risk Profile chart that displays it. If you doubleclick on a Risk Profile dataset that is not displayed in a Risk Profile chart, DPL creates a chart for the dataset and activates the chart. 85 Chapter 3: Decision Analysis Results Syncopation Software Figure 3-7. Risk Profile Chart By default, DPL creates a cumulative Risk Profile chart. A cumulative Risk Profile chart displays the objective function on the x-axis (horizontal axis) and cumulative probability on the y-axis (vertical axis). A cumulative Risk Profile chart can be read by choosing a value on the x-axis, determining where the Risk Profile intersects with the vertical line "drawn" from the value, and then "drawing" a horizontal line over to the y-axis. The value where the horizontal line meets the y-axis is the probability that the objective function is less than or equal to the chosen value on the x-axis. For example, if you choose the value 40, you see that the vertical line drawn from 40 intersects the Risk Profile at a probability value of approximately 20%. Therefore, the probability that the objective function is 40 or less is 20%. To create a Risk Profile chart, DPL calculates all the endpoint values (objective function values and probabilities) associated with the model, and then aggregates the endpoints into a user-determined number of intervals for display. The number of intervals used can significantly affect the appearance of the Risk Profile chart. The number of intervals has no impact on the expected value of the Risk Profile. 86 Chapter 3: Decision Analysis Results Syncopation Software The precision of the percentiles from a Risk Profile chart is affected by the number of intervals. In the example in the previous paragraph, 40 is the 20th percentile. The 10th percentile is the x-axis value found by "drawing" a horizontal line from 10% on the y-axis to where it intersects the curve and then "drawing" a vertical line drawn from the intersection to x-axis. If you are interested in percentiles and require more precision, you should set the number of intervals to be larger. A larger number of intervals requires more memory and has a slight performance impact. The number of intervals can be changed by selecting Home | Run | Options. Double-click on the active model (or press Ctrl+F12). Click Cancel. Click Home | Run | Options to launch the Run Options dialog. Under the Risk Profile section you should see that the Number of intervals is 500. In general, 250 to 500 is usually a reasonable setting for most models. (Note: in the model as it currently stands there are only 108 paths in the tree – half of which are in the optimal policy and displayed in the Risk Profile. Setting the number of intervals to greater than 500 will not affect how the Risk Profile charts looks since there are many fewer scenarios than intervals.) If you have distributions with very long tails, you may wish to increase the number of intervals. DPL displays the expected value (EV) of the objective function on the Risk Profile chart by default. Displaying the expected value of the model is particularly useful when comparing multiple Risk Profiles. It is also helpful to display the expected value if the Risk Profile of the model is less symmetric, because it may be difficult to estimate the expected value from the risk profile. If you’d like to view your chart as a Histogram, do the following: Activate the Risk Profile Chart and check the checkbox next to Histogram in the Format | Display group. Uncheck the EV / CE Lines and EV / CE Values checkboxes in Format | Display. DPL updates the Risk Profile chart as shown in Figure 3-8. 87 Chapter 3: Decision Analysis Results Syncopation Software Figure 3-8. Frequency Histogram Type Risk Profile Chart A frequency histogram displays the Risk Profile information in a different format. The x-axis still displays the objective function and the y-axis still displays probability values. The height of each bar in the frequency histogram Risk Profile chart indicates the probability that the objective function falls within the range determined by the horizontal position and width of the bar. For example, in the frequency histogram Risk Profile chart in Figure 3-8 there is approximately a 4.8% chance that the objective function falls in the range 148 to 152 (the height of the highest bar is 4.8% on the y-axis; it starts at 148 on the x-axis and ends at 152). A Risk Profile chart can be formatted in a number of ways. If you like, experiment with some of the other formatting options available on the Format tab. Figure 3-9 demonstrates some of the ways in which a chart can be formatted. If you’d like your chart to match that in Figure 3-9, do the following: Revert back to a Cumulative risk profile chart type by un-checking the Histogram checkbox in Format | Display. Create a title of "Expected Value" for the chart by checking the checkbox next to Chart in the Format | Title group. To rename the title, double-click the default title "Chart 1" and type in "Expected Value". 88 Chapter 3: Decision Analysis Results Syncopation Software Select the Chart title text and change the font within View | Font. You can do the same with the values along both the x and y-axis and the axis label ("Cumulative Probability"). Within the Format | Display group uncheck Shading. This will cause the background shading of the chart to go away. Uncheck the checkbox next to Color Fill within the Format | Color group. This will leave a single line with no color fill beneath it. Select the line. Go to Chart | Series | Lines/Markers. In the Weight edit box, change the number from 2 to 3. This will thicken the weight of the line. Go back to the Format | Display group. Check the checkboxes next to X Grid Lines, Y Grid Lines, and Dashed Grid to format the grid lines in the background of the chart. Select the line within the chart and use the Color fill bucket split-button to select a new color for the line. Figure 3-9. Formatted Risk Profile Chart 89 Chapter 3: Decision Analysis Results Syncopation Software Finally, you will examine the statistics available for the Risk Profile. Click Data | Distributions | Statistics. You can also right-click on the Risk Profile and select Statistics from the context menu. The Statistics dialog appears as shown in Figure 3-10. Figure 3-10. Risk Profile Statistics The Statistics dialog gives you a standard statistical description of the distribution of your objective function, including the minimum and maximum values, the variance and standard deviation, the higher moments (skewness and kurtosis), and selected percentiles of the distribution. For example, the percentiles table shows that the 10th percentile of the distribution is 2.7; the objective function will be less than or equal to 2.7 with probability 10%. Similarly, with probability 90%, the objective function will be less than or equal to 218.8 (or conversely there is a 10% probability that the objective function exceeds 218.8). You may enter other percentiles into the Percentile list box and then click Update Percentile Values. Click Close to close the Statistics dialog. If you would like the 10th, 50th and 90th percentile values displayed directly on the Risk Profile, select Series | Labels | Show. 90 Chapter 3: Decision Analysis Results Syncopation Software 3.3 Policy Summary™ We will now examine DPL's Policy Summary™. A Policy Summary™ is often used to understand the decision policy for a downstream decision (i.e., a decision that occurs after one or more chance nodes), so before running this output, you'll add a downstream decision and related chance node to the model. Right mouse-click the item for the model "License vs. In-house prob" (or whatever you named it earlier) in the Workspace Manager and select Duplicate from the context menu. Rename the new model "License vs. In-house downstream". In order to add the nodes mentioned earlier, re-arrange your Influence Diagram to give yourself some space between Unit Sales, Revenue per Unit, Marketing Costs and NPV as indicated in Figure 3-11. One way to quickly re-arrange the Influence Diagram is to select multiple nodes at once. While holding down the Ctrl key, click on the Unit Sales, Marketing Costs, Cost per Unit and Product Strategy nodes. All these nodes turn magenta because they are selected as a group. Use the mouse to drag this group of nodes to the left, freeing up space in the center of the diagram. You may have to adapt these steps slightly depending on how your diagram is drawn. Figure 3-11. Re-arranged Influence Diagram 91 Chapter 3: Decision Analysis Results Syncopation Software Select Model | Node | Add | Decision from the ribbon to add the new decision node. Click somewhere in the space you created. The Node Definition dialog appears with the General tab selected. Name the node "Price Change". Rename the alternatives to "Raise" and "Keep same". The General tab should look like Figure 3-12. Figure 3-12. Node Definition Dialog General Tab for Price Change Decision 92 Chapter 3: Decision Analysis Results Syncopation Software Select the Data tab. Enter "1.1" for the Raise alternative and "1.0" for Keep same. These numbers will be used as multipliers, so 1.1 means raising prices 10%. Press Enter. The Data tab should look like Figure 3-13. Figure 3-13. Node Definition Data Tab for Price Change Decision Click OK. Double-click Unit Sales to edit its definition. On the General tab, change the name to "Sales 1". Change the value for each outcome to half its previous value. The Data tab should look like Figure 3-14 when you are done. 93 Chapter 3: Decision Analysis Results Syncopation Software Figure 3-14. Node Definition Data Tab for Sales 1 Switch to the Links tab and under the Calculation links section at the top select the "None (local)" radio button to break this node's link with the spreadsheet (more on this later). Figure 3-15. Node Definition Links for Sales 1 Click OK to close the node definition dialog. 94 Chapter 3: Decision Analysis Results Syncopation Software You have divided the sales in half because you are about to introduce a new node called Sales 2. To do this you are going to take advantage of DPL's node copy and paste capability. By the time you are done modifying the model, you will have created a two time period model. Sales 1 will represent sales in the first period and Sales 2 will represent sales in the second period. You have divided the values in half for Sales to reflect the fact that previously Unit Sales represented total sales. With the Sales 1 node selected (it should be magenta), make a copy of it by pressing Ctrl+C or clicking Home | Edit | Copy. Paste the new node by pressing Ctrl+V or clicking Home | Edit | Paste. Select the new node and drag it away from Sales 1. Note: You can also select and copy multiple nodes by holding down Ctrl and selecting the nodes to be copied, as you did earlier when you moved multiple nodes. Double-click Sales 1 (copy) to edit it. On the General tab, change its name to "Sales 2". Check Separate probability and value input trees as shown in Figure 3-16. Figure 3-16. Node Definition General Tab for Sales 2 95 Chapter 3: Decision Analysis Results Syncopation Software Note that there are now two tabs in place of the Data tab called Values and Probabilities, respectively. This is convenient if you have a discrete chance node whose probabilities are conditioned by one or more nodes and whose values are conditioned by a different set of nodes, or whose probabilities are conditioned but values aren't or vice versa. As you will see in the sample model you are building, the probabilities for Sales 2 will be conditioned by one node while the values will be conditioned by another node. Select the Values tab. Click Conditioning. The Conditioning dialog appears. Check Price Change as shown in Figure 3-17. Figure 3-17. Conditioning dialog for Sales 2 value Note that the Conditioning dialog tells you how many data expressions are required given the nodes selected. Since Sales 2 is a three-outcome discrete chance node and Price Change is a two-alternative decision node, six data expressions are required. 96 Chapter 3: Decision Analysis Results Syncopation Software Click OK to close the Conditioning dialog. The data input tree updates on the Values tab to account for the conditioning. Figure 3-18. Node Definition Value Tab After Conditioning Change the Low, Nominal and High values for the Raise alternative of Price Change to be "8", "15" and "28", respectively. You are assuming that demand (sales) is slightly sensitive to price. Leave the values for the Keep same alternative as is. The data input tree for Values should now look like Figure 3-18. Select the Probabilities tab. Click Conditioning. The Conditioning dialog appears. Click Sales 1 as shown in Figure 3-19. Click OK. 97 Chapter 3: Decision Analysis Results Syncopation Software Figure 3-19. Conditioning Dialog for Sales 2 Probabilities As the Node Definition probability tab indicated, nine data expressions are required. The probability input tree for this is rather small. Click Full Screen to make entering the data easier. See Figure 3-20. Enter probabilities for Sales 2 according to Table 3-7. Sales Outcome Sales 2 Outcome Probability Low Low .6 Nominal .3 High .1 Low .3 Nominal .4 High .3 Low .1 Nominal .2 High .7 Nominal High Table 3-7. Probability Data for Sales 2 98 Chapter 3: Decision Analysis Results Syncopation Software Figure 3-20. Full Screen Probability Input Tree for Sales 2 Note that the probabilities for Sales 2 given that Sales 1 is Nominal are unchanged. The probability data in Table 3-7 reflects the belief that if sales in the first period are low (i.e., if the outcome of the Sales 1 chance node is Low) then sales in period two are more likely to be low (i.e., the outcome of the Sales 2 chance node is more likely to be Low). Similarly if sales in the first period are high they are more likely to be high in the second period. Click Full Screen. The Node Definition dialog returns to normal dialog mode. Click OK. Your model should now look something like Figure 3-21. 99 Chapter 3: Decision Analysis Results Syncopation Software Figure 3-21. Model After Editing Sales 2 DPL has indicated the changes that you have just made with colored arcs. A green arc indicates that the influencing node (i.e., Sales 1 – called the predecessor) conditions the probabilities of the influenced node (i.e., Sales 2 – called the successor). As you have seen previously a blue arc indicates that the influencing node (i.e., Price Change) conditions the values of the influenced node (i.e., Sales 2). If the predecessor conditions both the probabilities and the values of the successor, DPL indicates this with a light orange arc. Arc colors are covered in more detail in Section 7.2. Note that DPL continues to update the Default Tree as you make changes in the Influence Diagram. The Default Tree is not yet correct, but ignore it for now. There are several more changes to make to the Influence Diagram. 100 Chapter 3: Decision Analysis Results Syncopation Software We need to create a value node to connect to the "Unit_Sales" input cell in the spreadsheet. This node will represent total sales in both time periods. Click the Model | Links | Add icon. Note that the default add link node type indicated by the icon is currently Excel-Calculation Linked. If it is not, use the Model | Links | Add split button drop-down to select Excel Calculation Linked. In the Range Names dialog, select Unit_Sales and click OK. Double-click the new Unit Sales node to edit it. On the General tab, change the name to "Total Unit Sales". On the Data tab, enter the formula "Sales_1 + Sales_2". Use the variable button to avoid typing mistakes. See Figure 3-22. Figure 3-22. Node Definition Data for Total Unit Sales Click OK to close the Node Definition dialog. Move Total Unit Sales to the bottom of the Influence Diagram. Draw an arc from Sales 1 to Total Unit Sales and Sales 2 to Total Unit Sales. Delete the arc that goes from Sales 1 to NPV (hint: click near the arrowhead to select it). 101 Chapter 3: Decision Analysis Results Syncopation Software Draw an arc from Total Unit Sales to NPV. Your model should look similar to Figure 3-23. Figure 3-23. Model with Total Unit Sales Now we need to update Revenue_per_Unit to reflect the price change. The formula for Revenue_per_Unit in the In-house case becomes an average selling price. Double-click Revenue per Unit to edit it. The In-house formula is "(Price*Sales_1 + Price*Price_Change*Sales_2)/Total_Unit_Sales". The License formula doesn't change. Again, use the Variable button for accuracy. See Figure 3-24. If the data is cut off in the input tree, you can right mouse-click on the tree to get the context menu and select Lengthen Branch. 102 Chapter 3: Decision Analysis Results Syncopation Software Figure 3-24. Node Definition Dialog for Revenue per Unit Click OK close the dialog. Add arcs from Sales 1, Sales 2, Price Change and Total Unit Sales to Revenue per Unit. You have now incorporated Sales 2 and Price Change into the expressions for Revenue per Unit. In particular, if In-house is chosen then revenues reflect the price change in the second period. Your model is nearly complete. However the Default Tree is not yet correct. The model you are developing is a two time period model. You have an upfront decision to produce the product In-house or License it. You then have a downstream decision to change the price or not. The downstream decision occurs after you have observed sales in the first period. To reflect this, you need to have the Sales 1 discrete chance node appear before (to the left of) Price Change in the tree. As shown in Figure 3-23, Price Change is currently before Sales in the Default Tree. You will now add some information to the model so that DPL will correct this. Specifically, you will add an influence arc from Sales 1 to Price Change. As mentioned in Chapter 2, an influence arc can represent dependency, conditioning and/or timing. In this case, the influence arc from Sales to Price Change is a timing arc (Price Change does not depend on and is not conditioned by Sales 1). The arc tells DPL that Sales occurs before Price Change. 103 Chapter 3: Decision Analysis Results Syncopation Software Click Model | Influence/Arc | Add (see Table 1-3). Create an arc from Sales 1 to Price Change: click on Sales, then on Price Change. Or use one of the methods discussed earlier to create the arc (hold down Shift, click predecessor, then click successor; or hold down Ctrl, click predecessor, click successor, then click Model | Influence/Arc | Add). Note that DPL has moved Sales 1 ahead of Price Change in the tree. For completeness, click Model | Influence/Arc | From Formulas. You may want to move some nodes around again and/or bend some influence arcs to make the Influence Diagram neater. Your model should look something like Figure 3-25. You will now run your updated model. Figure 3-25. Completed Model with Downstream Decision In the Home | Run group, make sure the following are checked: Risk Profile, Policy Tree™, Policy Summary™ and VOIC. Click Home | Run | Decision Analysis or press F10. DPL produces the requested outputs. Review the Policy Tree™ before looking at the Policy Summary™. 104 Chapter 3: Decision Analysis Results Syncopation Software In the revised model, we have a downstream decision. With downstream decisions there is not necessarily a single alternative that is always optimal. Note that in the Policy Tree™ a different alternative is optimal for the Raise Price decision depending upon the outcome of Sales 1. It is easy to review the relatively small Policy Tree™ in this example. The Policy Summary™ provides a useful view of the information in the Policy Tree™, particularly for models with larger and/or more complex Policy Trees™. Note that the expected value of the model has increased to 111.1. Double-click on the Policy Summary™ item in the Workspace Manager to activate the window. The Policy Summary™ as shown in Figure 3-26 is displayed. Figure 3-26. Policy Summary™ 105 Chapter 3: Decision Analysis Results Syncopation Software The Policy Summary™ displays summary information about the optimal policy in the Endpoint Database™. For each node, it displays the policy dependent probabilities for each state of the node at the end of the state branch. A policy dependent probability is the probability weighted fraction of optimal scenarios in which the state (either decision alternative or chance outcome) occurs. You will note that DPL also displays an additional state for each node called "(does not occur)" and displays the probability of this happening as well. The "(does not occur)" state will have a non-zero policy dependent probability if there are scenarios in which the node does not occur. This could happen in an asymmetric tree (a tree where not every node appears on every path). Asymmetric trees are covered in Chapter 6. For initial decisions (those that appear before any chance nodes in the decision tree), the policy dependent probability of the optimal branch will always be equal to one (or 100%) and will be zero (0%) for the rest. So in the Policy Summary™, the optimal decision alternative for each initial decision is the one with 100% probability. As you know, In-house is the optimal alternative and Figure 3-26 displays In-house with a 100% policy dependent probability. For downstream decisions, the Policy Summary™ displays the probability weighted fraction of scenarios for which each downstream decision alternative is optimal. In your updated model, Price Change is a downstream decision because it occurs after the Sales 1 discrete chance node. As indicated in Figure 3-26, Raise has a policy dependent probability of 30% while Keep same has a policy dependent probability of 70%. By looking at the Policy Tree™ again you can determine in which scenarios the Raise vs. Keep same alternative is optimal. The Policy Summary™ also displays the policy dependent probabilities of the outcomes for discrete chance nodes. For discrete chance nodes that are not conditioned by others and that do not depend on the optimal policy, the policy dependent probabilities are equal to the input probabilities. This is true of Sales 1, Cost per Unit, Marketing Costs and Price. However, Sales 2 is conditioned by another node (namely Sales 1). You can see that the policy dependent probabilities for Sales 2 are not the same as the input probabilities. 106 Chapter 3: Decision Analysis Results Syncopation Software 3.4 Expected Value of Perfect Information / Control The expected value of perfect information / control is actually two outputs which both indicate how important it is to reduce the uncertainty associated with each discrete chance node in a model. The expected value of perfect information indicates how valuable it would be to have perfect information for a chance node before making a decision. The expected value of control indicates how valuable it would be to have complete control over the uncertainty. You will now examine the expected value of perfect information / control results. Double-click on the Value of Info/Control item in the Workspace Manager to activate the window. The Value of Information / Control output as shown in Figure 3-27 is displayed. Figure 3-27. Expected Value of Perfect Information / Control 107 Chapter 3: Decision Analysis Results Syncopation Software DPL displays the value of perfect information for each chance node as a red vertical bar and the value of control as a yellow vertical bar. By default, both sets of bars are displayed and the nodes are sorted in descending order by their value of perfect information. DPL calculates the expected value of perfect information for each chance node by moving it to the front of the decision tree (or as far to the front as it can) while keeping all other nodes fixed in position and, in essence, "rerunning" the model. (Note that DPL's solution algorithms allow it to calculate the expected value of perfect information without actually having to re-run the model.) DPL calculates the expected value of the objective function for the modified model. The expected value of perfect information for a chance node is the difference in the expected value of the objective function of the modified model and the expected value of the objective function of the base model. It is called the expected value of perfect information because the modified model simulates the situation in which you have perfect information about the uncertainty before you need to make a decision. For example, in the base model you must make the decision to develop the product in-house vs. license it before you know what sales (in period 1 or 2) are. However, in the modified model to calculate value of perfect information of Sales 1, you have the benefit of knowing what sales in the first period are before making this decision. The difference in value between the modified model and the base model is due to the information gained. For a given chance node, if the value of perfect information is greater than zero, then the optimal alternative must be different given the outcome of the chance node in the reordered tree (otherwise the expected value of the objective function of the model with the reordered tree would be the same). See the Policy Tree™ from the reordered model in Figure 3-28. In the example model, the value of perfect information for Sales 1 is approximately 3, therefore the optimal alternative must have changed for one of the outcomes of Sales 1. If you had the luxury of knowing which state Sales 1 was in before deciding on Product Strategy, you would choose to License in certain scenarios. Overall In-house is the better alternative, but with information on Sales 1 you would choose to License for those scenarios in which License is optimal. 108 Chapter 3: Decision Analysis Results Syncopation Software Figure 3-28. Policy Tree™ to Illustrate Value of Perfect Information DPL calculates the expected value of control for a chance node in a similar manner to the way in which it calculates the value of perfect information, except that in addition to moving the chance node to the front of the tree it also turns it into a decision node. It is called the value of control because not only do you know which state the node is in before having to make a decision, but you also get to choose which state is optimal. The value of control for Sales 1 is approximately 75. This means that the expected value of the objective function would increase by 75 if you could choose the optimal outcome upfront for Sales (undoubtedly High in this case) and then decide on Product Strategy rather than deciding on Product Strategy and gambling on Sales. 109 Chapter 3: Decision Analysis Results Syncopation Software 3.5 Value Correlations In this section you will examine a simple example of Value Correlations. Value Correlation charts are bar charts that display the correlation coefficients between each value and event in the model and the objective function. Correlation coefficients are measures of statistical association between two variables. Correlation coefficients can vary between 1.0 (perfect positive correlation) and -1.0 (perfect negative correlation). Perfect positive correlation (1.0) means that as one of the two variables increases, the other variable always increases proportionately. Perfect negative correlation (-1.0) means that as one variable increases, the other variable always decreases proportionately. Correlation does not always imply causation; that is, even if two variables are correlated, it does not necessarily mean that an increase or decrease in one variable is causing the change in outcome of the other variable. Lack of causation may be due to, for example, both variables being influenced by some other variable which is not in the model. You will now re-run the model from Section 3.4 to generate Value Correlations. Make sure the "License vs. In-house downstream" model is active. Leave the other outputs selected if you would like to re-generate them. Check the checkbox next to Value Correlations in the Home | Run group. Click the Home | Run | Decision Analysis split button. Note when you request value correlations DPL must evaluate the model using full tree enumeration and does this automatically. This changes the default action of the Home | Run | Decision Analysis button. For this simple example, it is unlikely you will notice the difference. For larger models, you may wish to return to fast sequence evaluation after running value correlations. Use the Home | Run | Decision Analysis drop-down list to do this the next time you run the model. DPL runs the model and creates an item for Value Correlations in the Workspace Manager. Double-click on the Value Correlations item to activate the window. The Value Correlations chart is displayed as in Figure 3-29. 110 Chapter 3: Decision Analysis Results Syncopation Software Figure 3-29. Value Correlations Chart The Value Correlations chart assumes that the optimal decision policy is followed. It tells you which values in your model tend to vary in the same direction (positive correlation) or in the opposite direction (negative correlation) as the objective function, which in this case is NPV. Positive correlations are shown as purple bars, while negative correlations are aqua. A correlation (bar) is shown for each value in the model for which the correlation coefficient can be calculated. Each value corresponds to either a decision node, a chance node, or a value node in the model. If a chance node or decision node has no values associated with it, DPL correlates the state numbers with the objective function. E.g., for a decision node with two alternatives, the first alternative has a state number of 1 and the second alternative has a state number of 2. As Figure 3-29 shows, several of the values are highly correlated with the objective function. The first bar (NPV) simply indicates that the objective function is perfectly correlated with itself. Total Unit Sales, Sales 1, Sales 2 and Price Change are all highly positively correlated with the objective function. This makes sense because the higher the product sales are, the higher the revenues and NPV are. On the other hand, Cost per Unit and Marketing Costs are negatively correlated with the objective function (NPV). License Fee and Launch Costs are not correlated with the objective function at all because they are fixed (deterministic) values. 111 Chapter 3: Decision Analysis Results Syncopation Software In decision analyses with complex value models, Value Correlations charts are useful for understanding how the variability in the objective function is related to the variability in individual values such as chance nodes and downstream decisions. 3.6 Saving Outputs All outputs described in Chapter 3 up to this point (Risk Profile Charts and Datasets, Policy Trees™, Policy Summary™, Value of Information/Control, and Value Correlations) and Endpoint Databases™ (see Chapter 11 for more information on Endpoint Databases™), will remain in the Workspace until the next run of the model. When you have one or more of these outputs mentioned above associated with your model and you run a Decision Analysis, you will be given a warning that any unsaved results from the previous run will be cleared or overwritten by the new run. See Figure 3-30. Figure 3-30. Unsaved Results Warning An unsaved output or dataset will be cleared, even if you do not select the output to be created in the subsequent run. For example, if you have an unsaved Risk Profile associated with your model and run a Decision Analysis in which you do not request a Risk Profile output, the Risk Profile from the previous run is still deleted. To save outputs from a particular run, so that they will not be overwritten in subsequent runs, you must re-name the output in the workspace manager. Note that there is no limit to the number of saved sets of results you can have in DPL workspace. Furthermore, any formatting done to those outputs will be saved by re-naming. 112 Chapter 3: Decision Analysis Results Syncopation Software Outputs generated from a sensitivity analyses (tornado diagrams, rainbow diagrams, Time Series Percentiles, and Option Value charts) are not overwritten in subsequent Decision Analysis runs or analyses. They will remain in the workspace until you explicitly delete them. When you save a DPL workspace (File | Save) you will save all outputs of your of workspace, including any formatting done. 3.7 Rainbow Diagram on a Value The rest of this chapter addresses Rainbow Diagrams, which are another form of sensitivity analysis. A Rainbow Diagram provides more detailed information on how the objective function of the model and the optimal policy change as a single variable is varied across a range of settings. You will now create a Rainbow Diagram for a value node in the model. Click Home | Sensitivity | Rainbow Diagram (One-Way Rainbow diagram in is the current default indicated by the icon). The Run Rainbow Diagram dialog appears similar to Figure 3-32 but blank. Press the Select button to select a variable for the dialog. Select License_Fee in the Value for sensitivity drop-down list as shown in Figure 3-31. Figure 3-31. Select Value for Rainbow Diagram dialog Click OK. Set the Step size to be "0.025". The Run Rainbow Diagram dialog should now look like Figure 3-32. In the Run Rainbow Diagram dialog, specify the From: and To: values to be "0.7" and "0.9", respectively. 113 Chapter 3: Decision Analysis Results Syncopation Software Figure 3-32. Run Rainbow Diagram for License Fee Click OK to run the Rainbow Diagram. A Rainbow Diagram displays the value of the model's objective function on the y-axis and the values of the selected variable on the x-axis. The diagram shows how the objective function value changes as the variable setting changes across the specified range. The Rainbow Diagram for License Fee should look like Figure 3-33. The diagram indicates that as License Fee increases from 0.7 to 0.85 there is no change in the objective function value, but as License Fee increases from 0.85 to 0.9 there is an increase in the objective function value. 114 Chapter 3: Decision Analysis Results Syncopation Software Figure 3-33. Rainbow Diagram for License Fee Rainbow Diagrams also indicate policy changes by changes in color. Since the Rainbow Diagram in Figure 3-33 changes color between 0.85 and 0.875, you know that a policy change occurs in that region. As with Tornado diagrams, the vertical line where the color changes does not indicate the precise point at which the policy changes. The vertical line is drawn at the halfway point of the two tested values of the variable between which a policy change has occurred. In this instance, License Fee is tested at 0.85, which results in one policy, and again at 0.875, which results in a second policy. Therefore the vertical line is drawn halfway between 0.85 and 0.875.. If you want more precise information on where the policy change occurs you can run another Rainbow Diagram with finer increments. In a Rainbow Diagram, DPL starts with a color and changes to a new color every time there is a policy change. The color of the region does not relate to the value of the variable, i.e., blue does not mean that the high setting of the variable resulted in a policy change. It only indicates that a policy change has occurred. You can use your mouse to find out which policy applies in each colored region if you have Show Tips turned on. You turned these on earlier but you may need to check that they are on. 115 Chapter 3: Decision Analysis Results Syncopation Software To check if Show Tips is on, click File | Options. The Options dialog appears. On the General tab, make sure Show Tips is checked. Click OK to close the dialog. Place your mouse cursor over the blue square marker for 0.875 on the curve. A policy tip will appear as indicated in Figure 3-34. Figure 3-34. Rainbow Diagram with Policy Tip Showing The policy tip tells you the expected value of the model given the value of the variable that the marker represents. For example, the policy tip in Figure 3-34 indicates that the expected value of the model is 114 when License Fee is 0.875. The policy tip also tells you the policy dependent probabilities for each decision in the model given the value of the variable that the marker represents. The decision alternatives are displayed in the policy tip by using the decision node name followed by a colon followed by the decision alternative. E.g., "Product Strategy: License". The policy dependent probability for the alternative follows the equal sign. As Figure 3-34 indicates, the policy when License Fee is 0.875 is to License out production of the product and to keep price the same in time period 2. To keep the policy tip compact, decision alternatives with a policy dependent probability of zero are not displayed. 116 Chapter 3: Decision Analysis Results Syncopation Software If you wish, place your mouse cursor over one of the green circular markers on the curve to see what the policy is for these points. You have completed a Rainbow Diagram on one value in your model, namely License Fee. You will now see how to run a Rainbow Diagram on a probability. 3.8 Rainbow Diagram on a Probability When you ran the Rainbow Diagram in Section 3.7, you may have noticed that the only variables you could select in the Select Value for Rainbow dialog were values. What if you would like to run a sensitivity analysis on a probability? You will need to modify your model slightly to do so. Double-click on the item for the "License vs. In house downstream" model in the Workspace Manager. The Model Window becomes active. Add a value node to the model by clicking Model | Node | Add. If the default add node type isn’t value (as indicated by the icon), use the drop-down list to select Value. Click anywhere in the Influence Diagram. The Node Definition dialog comes up with the General tab selected. Name the value "p". Click the Data tab. Type "0.6" as shown in Figure 3-35. 117 Chapter 3: Decision Analysis Results Syncopation Software Figure 3-35. Node Definition Dialog Data Tab for p Click OK. Double-click the Cost per Unit node to edit it. The Node Definition dialog appears with the Data tab selected. In place of "0.6" for the probability of Nominal (given In-house), type "p". Press the down arrow twice to select the probability for High. Delete the "0.4" that is there for the Probability of High. Press Enter. Your node data for Cost per Unit should now look like Figure 3-36. 118 Chapter 3: Decision Analysis Results Syncopation Software Figure 3-36. Node Definition Data Tab for Cost per Unit Note: in the changes you just made you left the probability of the last outcome of the discrete chance node blank. You can always do this. DPL will assign one minus the sum of the rest of the outcome probabilities to the last outcome. In this instance, you must do this. Rather than entering a number for the probability of Nominal, you have now entered a value. The use of a value such as "p" in the probability expression of an outcome is called a non-constant probability expression. When you use a non-constant probability expression for any of the chance outcomes in a node, you must leave the last probability expression blank. This helps to ensure that the probabilities of all the outcomes sum to one. Click OK to close the Node Definition dialog. Click Home | Sensitivity | Rainbow Diagram. The Run Rainbow Diagram dialog appears. Click the Select button. Set the Step size to be "0.05". The Run Rainbow Diagram dialog should now look like Figure 3-37. Select p in the Select Value for Rainbow dialog. Click OK. In the Run Rainbow Diagram dialog, specify the From: and To: values to be "0.3" and "0.9", respectively. 119 Chapter 3: Decision Analysis Results Syncopation Software Click OK to run the Rainbow Diagram. Figure 3-37. Run Rainbow Diagram Dialog for p DPL produces the Rainbow Diagram for p as shown in Figure 3-38. The Rainbow Diagram indicates that while the objective function increases from approximately 102 to 120, no policy changes occur as p varies from 0.3 to 0.9. In this instance, you can be comfortable with your estimation of the probability of Nominal for Cost per Unit. Over a fairly wide range, it does not change the optimal strategy. Note, however, that the Rainbow Diagram in Figure 3-38 still assumes that the value for Cost per Unit is no lower than 0.8 and no higher than 0.9. The Rainbow Diagram tests the sensitivity of the optimal policy to the probability that Cost per Unit is Nominal or High given the specified Nominal and High values of the outcomes. 120 Chapter 3: Decision Analysis Results Syncopation Software Figure 3-38. Rainbow Diagram for p The next section discusses Probabilistic Base Case Tornadoes, an additional sensitivity type. 121 Chapter 3: Decision Analysis Results Syncopation Software 3.9 Probabilistic Base Case Tornado Diagram A Probabilistic Base Case Tornado Diagram is similar to a Base Case Tornado Diagram. However, the Probabilistic Base Case Tornado does not remove the uncertainty from the model when calculating results. To calculate the base run for the diagram, DPL evaluates the full model with all uncertainty as if it were running a Decision Analysis on the model. Consequently, the base run, or the vertical line in the tornado, will equal the expected value of the model as in a Risk Profile or a Policy Tree™. To produce the results for each chance node in the model, DPL runs the model with the chance node it is evaluating fixed to a low state while allowing all the remaining chance nodes to vary across their outcomes. DPL then repeats this with the chance node fixed at a high state and repeats the whole process for each chance node.Because the base run in the Probabilistic Base Case Tornado matches the expected value of the model in a Decision Analysis run, it can be more easily compared to other outputs from a Decision Analysis run and sometimes easier to explain. The process for setting up the Probabilistic Base Case Tornado is identical to that of the Base Case. Drop-down the Home | Sensitivity | Tornado split button and choose Probabilistic Base Case from the list. The Probabilistic Base Case Tornado Setup dialog appears. The set-up is identical to that of the Base Case Setup Dialog in Figure 2-37. Click OK to run the Probabilistic Base Case Tornado Diagram. DPL produces the Probabilistic Base Case Tornado Diagram as shown in Figure 3-39. 122 Chapter 3: Decision Analysis Results Syncopation Software Figure 3-39. Probabilistic Base Case Tornado Diagram The tornado indicates that all variables are decision sensitive (there is at least one policy change for each bar) and that Sales 1 and Sales 2 have the biggest impact on the objective function. Notice that the vertical line is at 111.1, which as noted in Section 3.3 is the expected value of the objective function of the model as currently built. You have now reached the end of the tutorial on building and analyzing DPL decision analysis models. Though the model you developed in this tutorial is fairly simple, you now have the essential skills needed to develop models of decisions varying complexity. 123 Chapter 3: Decision Analysis Results Syncopation Software 124 Chapter 4: Strategy Tables Syncopation Software 4 Strategy Tables When building a decision model you may find that there are a number of up-front (initial) decisions that should be included in the model, but that not all of the combinations of the decision alternatives make sense or are viable. Initially, it may be easier to think about the decisions individually when framing the problem and developing the model. However, when it comes to analyzing the model, using a decision tree with a large number of separate decisions may not be either practical or desirable. In situations such as this, you can use a strategy table node to "aggregate" your upfront decisions into a manageable number of strategies. In this context, a strategy means a specific combination of decision alternatives for the upfront decisions in the decision model. This chapter assumes you have already been through the tutorial contained in Chapters 2 and 3, or that you are already familiar with DPL. To learn more about how to use a strategy table node, consider the following example. Select File | Open. Select Strategy Table.da. Navigate to the Examples folder underneath where you installed DPL. If you used the default location, the path is C:\Program Files (x86)\Syncopation\DPL8\Examples. DPL opens the Workspace as shown in Figure 4-1. 125 Chapter 4: Strategy Tables Syncopation Software Figure 4-1. Strategy Table Model The sample model is for a company with three product lines (A, B, and C). The company must make product development decisions (called Feature Set A, Feature Set B, etc.) for each product line, pricing decisions for each product line, and a decision regarding how much to spend on marketing. The company is faced with uncertainties in the demand for its products as well as uncertainties regarding how much it will cost to produce the updated product lines. The decision tree in Figure 4-1 has over 43 million paths. It is likely that not all of these paths make sense. For example, the company may not want to add a number of new features to all of their products and cut prices on all of them. Assume the company is considering a number of alternative strategies for its future product development. You will create a strategy table to model these development strategies. 126 Chapter 4: Strategy Tables Syncopation Software Click the Zoom Out button on the status bar to make the Influence Diagram smaller and create space above the decision nodes. Click Model | Node | Add | Strategy Table on the ribbon (see Table 12). Click above the decisions in the Influence Diagram as shown in Figure 4-2. Figure 4-2. Cursor for Strategy Table You will be asked whether you want to add decisions to the strategy table as shown in Figure 4-3. If you answer yes, DPL will create the strategy table with the decisions you select. If you answer no, DPL will create the strategy table with two new default decisions. Figure 4-3. Add Existing Decisions to Strategy Table Question 127 Chapter 4: Strategy Tables Syncopation Software Click Yes. The Select Decisions dialog appears as shown in Figure 4-4. Figure 4-4. Select Decisions Dialog Select all the decisions in the list. Click OK. The Node Definition dialog appears as shown in Figure 4-5. Figure 4-5. Node Definition Dialog General Tab for Strategy Table 128 Chapter 4: Strategy Tables Syncopation Software Change the name of the strategy table to Strategy. Select the Data tab. As shown in Figure 4-6, the Data tab displays the Strategy Table Window. Figure 4-6. Data Tab for Strategy Table In the leftmost column of the Strategy Table Window, DPL displays the strategies defined in the table. By default, DPL creates two strategies named Strategy1 and Strategy2. DPL also uses colored icons to represent strategies. The first strategy in the strategy table is always represented by a red square icon. In each of the following columns, DPL displays the decisions included in the strategy table. DPL has included the decisions you selected previously. If you had not selected decisions, DPL would have created two default decisions called Decision1 and Decision2, which would be displayed in the columns to the right of the strategy column. In each decision column, DPL displays the decision alternatives for the decision that heads the column. Under each decision alternative in each decision column, DPL displays the strategy icon that applies to that alternative. As indicated by Figure 4-6 both Strategy 1 and Strategy2 are defined by the first decision alternative of all the decisions in the strategy table. Therefore Strategy1 and Strategy2 are initially identical. The Strategy Window has a number of buttons across the top. Most of the commands that you will use regularly can be found by clicking the Commands button 129 Chapter 4: Strategy Tables Syncopation Software or by right-mouse clicking in the Strategy Window to bring up the Strategy Window context menu as show in Figure 4-7. Depending on what you have selected in the Strategy Window, different menu items will be enabled in the context menu. Figure 4-7. Context Menu for Strategy Window You will now define some distinct strategies. To start, you will rename the existing strategies. Select Strategy1. It will be displayed in magenta when it is selected as shown in Figure 4-8. 130 Chapter 4: Strategy Tables Syncopation Software Figure 4-8. Selection in the Strategy Window Right-mouse click to bring up the Strategy Window context menu. Select Rename. DPL enters edit mode as shown in Figure 4-9. Figure 4-9. Edit Mode in the Strategy Window 131 Chapter 4: Strategy Tables Syncopation Software Rename the strategy to Status Quo. Press Enter. The Strategy Table Window should look like Figure 4-10. Figure 4-10. Renamed Status Quo Strategy 132 Chapter 4: Strategy Tables Syncopation Software You may also double-click an item to rename it. Rename Strategy2 to Feature Led. You will now create two new strategies. Click the Commands button and select Add Strategy from the list as shown in Figure 4-11. Figure 4-11. Selecting Add Strategy DPL creates a new strategy called Strategy3, color-coded blue, and puts you into rename mode as shown in Figure 4-12. 133 Chapter 4: Strategy Tables Syncopation Software Figure 4-12. Newly Created Strategy in Strategy Window Rename the strategy Price Cuts. Repeat the create strategy process to create another strategy called Differentiate Products. This will be color-coded yellow. Your Strategy Window should now look like Figure 4-13. 134 Chapter 4: Strategy Tables Syncopation Software Figure 4-13. Strategy Window with New Strategies Created DPL allows you to define up to 12 strategies in a strategy table. For this example, four strategies will suffice. You will now make the four strategies distinct from one another by defining them in terms of the decision alternatives that each represents. To define strategies in terms of a decision alternative, you drag the strategy icon to below the decision alternative that defines the strategy for each decision in the strategy table. You can either drag the strategy icons from the strategy column on the left to the decision alternative columns or within the decision columns from one alternative to the other. Drag the red square icon representing Status Quo (from either next to Status Quo or under Feature Set A: Add features) to below the Keep same alternative under Feature Set A. See Figure 4-14. 135 Chapter 4: Strategy Tables Syncopation Software Figure 4-14. Dragging Strategy Icons to Define Strategies Repeat this procedure to drag the icon for Status Quo to the Keep same alternative of the remaining decisions. The Status Quo strategy should now be defined as indicated in Figure 4-15. Figure 4-15. Status Quo Strategy Defined by Decision Alternatives 136 Chapter 4: Strategy Tables Syncopation Software Define the remaining three strategies as indicated in Table 4-1. In the table below, Add = Add Features, Same = Keep same, Min = Minimal, Inc = Increase, and Dec = Decrease. Feature Set A Feature Set B Feature Set C Marketing Spend Price Change A Price Change B Price Change C Feature Led Add Add Add Same Inc Inc Inc Price Cuts Min Min Min Dec Dec Dec Dec Differentiate Products Min Same Add Inc Dec Same Inc Table 4-1. Strategy Definitions After completing the strategy definitions, your Strategy Window should look like Figure 4-16. Note that each strategy has to be defined by an alternative of each decision in the strategy table (i.e., the icon representing the strategy has to appear in each decision column). However, not every decision alternative needs to be used to define a strategy, i.e., an alternative may have no strategy icons beneath it, indicating that the alternative is not considered in any strategy. In this example, every decision alternative is used at least once in some strategy. 137 Chapter 4: Strategy Tables Syncopation Software Figure 4-16. Strategy Window with Completed Strategy Definitions Click OK to close the Node Definition dialog. Click anywhere in the Influence Diagram or press ESC to deselect the strategy node. Your model should now look like Figure 4-17. Note that DPL has grouped the decisions added to the strategy table beneath the strategy node. DPL has also updated the Default Tree in the Decision Tree pane. It has removed the individual decisions and replaced them with the strategy table and the table's four alternatives (strategies). The Decision Tree now has 78,732 paths. 138 Chapter 4: Strategy Tables Syncopation Software Figure 4-17. Revised Model with Strategy Node You can now run the model. In this example, you saw how to create a strategy table, add a number of existing decisions to it, create strategies and define the strategies in terms of the decision alternatives. The Strategy Window interface also allows you to create decisions directly within the strategy table, delete decisions, remove decisions (but maintain them in the Influence Diagram), reorder the decisions in the strategy table (by dragging and dropping the decisions in the decision columns) and create and delete decision alternatives. 139 Chapter 4: Strategy Tables Syncopation Software 140 Syncopation Software Chapter 5: Building and Analyzing Monte Carlo Simulation Models 5 Building and Analyzing Monte Carlo Simulation Models This tutorial focuses on building an Excel-linked DPL model for a financial risk analysis application. It assumes familiarity with cash flow spreadsheets and with the analysis of uncertainty by Monte Carlo simulation. This chapter discusses how to do Monte Carlo simulation in DPL. If needed, start DPL. DPL will start with a blank Workspace. See Figure 5-1. Figure 5-1. A Blank DPL Workspace 141 Chapter 5: Building and Analyzing Monte Carlo Simulation Models Syncopation Software The window on the right-hand side of the screen is the Model window. The left-hand pane is the Workspace Window. For more information about the DPL Workspace Window, see Chapter 1. At the moment, Model1 is the only document in your Workspace. The risk analysis model you will build will consist of a DPL Model used to characterize uncertainties, and an Excel model used to calculate cash flows. 5.1 The Excel Cash Flow Model Before creating the DPL model, take a brief tour of the Excel model provided for this tutorial. Start Excel as you normally do. Open the file "Enlightify1.xls". This file will normally be found in the "Examples" folder where DPL was installed e.g., C:\Program Files (x86)\Syncopation\DPL8\Examples, if the default location was used during installation). 142 Syncopation Software Chapter 5: Building and Analyzing Monte Carlo Simulation Models Figure 5-2. Excel Cash Flow Model for Enlightify: Assumptions Sheet This simple cash flow model calculates the value of Enlightify Consulting LLC, a troubled business unit whose financial performance is of concern. The Excel model is built on two sheets, one for key assumptions and value drivers, and another for the cash flow calculations. 143 Chapter 5: Building and Analyzing Monte Carlo Simulation Models Syncopation Software In Figure 5-2, you can see that eight of the value drivers have already been identified as sources of uncertainty; the cells are shaded in light green. Each of these cells has been assigned a range name. When using an Excel model with DPL, you must name the cells you intend to link to DPL. If you select a named cell in Excel, the name will appear in the name combo box to the left of the formula bar. In Figure 5-3 you can see that cell C17 has a current value of $895, and has been given the name "Total_Value". Please consult your Excel documentation if you are not familiar with named ranges, as they are essential for using DPL with Excel. Figure 5-3. Cell C17 is Named Total_Value The calculations sheet (DCF) is shown in Figure 5-4. In this sheet, the model calculates the total value of the Enlightify Consulting business unit by the discounted cash flow method. These calculations are connected to the input cells on the Assumptions sheet. For example, if the Trendline Revenue Growth Rate (cell C22) is changed from 8% to 5%, the total value of Enlightify falls from $895 million to $690 million. You may want to spend a few minutes getting familiar with the spreadsheet. 144 Syncopation Software Chapter 5: Building and Analyzing Monte Carlo Simulation Models Figure 5-4. Cash Flow Model: DCF Calculations 5.2 Creating Linked Values Switch back to DPL. To begin building a DPL model linked to the Enlightify spreadsheet, you'll first need to create some linked values. Click the Model | Links | Add icon. Note that the default spreadsheet link type indicated by the icon should be Excel-Calculation Link. If it isn’t use the split button drop-down to select it from the list. In the Create Values from Excel dialog, click the Browse… button and browse to find "Enlightify1.xls". See Figure 5-5. Click OK to continue. 145 Chapter 5: Building and Analyzing Monte Carlo Simulation Models Syncopation Software Figure 5-5. Create Values from Excel Spreadsheet Name dialog DPL will display a second dialog listing all the named cells in Enlightify1.xls. You want to create value nodes for all of these cells except Discount_Rate, Interest_Rate_on_WC, NPV and Valuation_Date. Select the cells as shown in Figure 5-6. To select or de-select cells in the list, you need to hold down the Ctrl key while clicking each one. Figure 5-6. Named Cells in Enlightify1.xls 146 Syncopation Software Chapter 5: Building and Analyzing Monte Carlo Simulation Models Click OK. DPL will create a value node for each of the selected cells. A value node is a blue rounded rectangle representing a constant or calculated quantity. See Figure 5-7. Figure 5-7. Value Nodes Created from Enlightify1.xls Named Cells The top pane of the Model Window is called the Influence Diagram. The Influence Diagram is where you define nodes and their relationships. The bottom pane of the Model window is the Decision Tree, which is covered later in this chapter. Next, you'll look at how DPL has established the links with Excel. Double-click on Gross Margin. 147 Chapter 5: Building and Analyzing Monte Carlo Simulation Models Syncopation Software Figure 5-8. Node Definition Data for Gross Margin In Figure 5-8, you can see that DPL has brought over the data (0.35 or 35%) from the Excel cell. Right now this may seem like a lot of space for one number, but you'll be using it as you start to incorporate uncertainty into the model. Click on the Links tab. In Figure 5-9, you can see that DPL has recorded the path, file name, sheet name and cell name for the Gross Margin node. DPL also tells you that this is an "export" node. When spreadsheet inputs or drivers are linked to DPL nodes, they are always DPL export nodes, whereas spreadsheet outputs (e.g., NPV) are DPL import nodes. Export nodes are typically linked to cells containing data, whereas import nodes are typically linked to cells containing formulas. If you are unsure whether a DPL node is linked to the correct cell, you can have DPL activate the cell in Excel. 148 Syncopation Software Chapter 5: Building and Analyzing Monte Carlo Simulation Models Figure 5-9. Node Definition Links for Gross Margin Click the Go to Cell button. This takes you to Excel and selects the linked cell (Gross Margin in this case). Switch back to DPL. Click Cancel to close the dialog. 149 Chapter 5: Building and Analyzing Monte Carlo Simulation Models Syncopation Software 5.3 Arranging the Influence Diagram Before you begin to analyze the model, take a moment to organize the Influence Diagram. Double-click on the splitter bar between the two panes of the Model window. This maximizes the Influence Diagram pane. Click View | Layout | Snap to Grid. Drag both nodes to the left. Drag the Total Value node to the right. Click in the Influence Diagram to deselect it. While holding down the Ctrl key, click on the Share of Revenue at Risk value node and the Share of at Risk Revenue Lost node. Both nodes should now be magenta because they are selected. Use this same technique, or just move nodes one at a time, so that the nodes in your diagram are arranged in a circle with Total Value on the right. Arcs (arrows) in Influence Diagrams show relationships. In our model, Total Value depends on all the other value nodes. You could add an arc from each node to Total Value, but DPL has a single command to do the work. Click Model | Influence/Arc | From Formulas. DPL draws arcs from each of the other eight value nodes to Total Value. Your model should now look something like Figure 5-10. For information on how to create arcs individually, see Section 2.2. 150 Syncopation Software Chapter 5: Building and Analyzing Monte Carlo Simulation Models Figure 5-10. Influence Diagram with Influence Arcs At this point, you've put enough effort into building your DPL model that you should save it. Select File | Save As and give your Workspace a name (such as Enlightify.da). 151 Chapter 5: Building and Analyzing Monte Carlo Simulation Models Syncopation Software 5.4 Running a Value Tornado Diagram A Tornado Diagram is typically the first analysis done on a new model. At this point, your model is deterministic (consists only of value nodes), so the Value Tornado Diagram is the only tornado analysis available. Value Tornado is the default tornado type indicated by the Tornado split button icon. To run a Value Tornado click Home | Sensitivity | Tornado or press F8. DPL displays the Model Get/Pay dialog (see Figure 5-11). This gives you an opportunity to tell DPL which value you would like to calculate. In your model, Total Value is the only import node (and hence the only output of the spreadsheet) and is the only reasonable choice so DPL suggests that in the Model Get/Pay dialog. Figure 5-11. Model Get/Pay Dialog Click OK to accept the default (Total_Value). Next, DPL displays the Value Tornado setup dialog. 152 Syncopation Software Chapter 5: Building and Analyzing Monte Carlo Simulation Models Figure 5-12. Value Tornado Setup Dialog The Value Tornado Setup dialog provides a table in which to enter the low and high settings (range) for each value node that is a constant in the current model. DPL has also filled in the Current setting for each variable in the table. You will now enter the range for each of the value nodes shown in Figure 5-12. Click the blank cell in the Low column of the first value node, Bad Debt Allowance. Specify 0.02 for the Low value of Bad Debt Allowance. Specify 0.04 for the High value of Bad Debt Allowance. Continue to fill in the Value Tornado Setup table with the rest of the High and Low values shown in Table 5-1. Note that you can use the arrow keys to move around the Value Tornado Setup table. 153 Chapter 5: Building and Analyzing Monte Carlo Simulation Models Syncopation Software Name Low High Gross Margin 0.30 0.40 Other Cost Growth Rate 0.09 0.12 RMC_Lawsuit_Settlement 50 250 Share of Revenue at Risk 0.09 0.11 Share of at Risk Revenue Lost 0.50 0.95 Trendline Revenue Growth Rate 0.05 0.10 Working Capital 100 150 Table 5-1. Data for Value Tornado Diagram Your completed Value Tornado Setup dialog should look like Figure 5-13. 154 Syncopation Software Chapter 5: Building and Analyzing Monte Carlo Simulation Models Figure 5-13. Completed Value Tornado Setup Dialog Click OK. DPL displays a Value Tornado diagram (Figure 5-14) for the eight value nodes tested. The bars are sorted so the widest one (corresponding to the highest impact value) is at the top. This diagram will help decide which value drivers need to be modeled probabilistically (as chance nodes). See Section 2.5 for more information on Value Tornadoes. 155 Chapter 5: Building and Analyzing Monte Carlo Simulation Models Syncopation Software Figure 5-14. Value Tornado Diagram 156 Syncopation Software Chapter 5: Building and Analyzing Monte Carlo Simulation Models 5.5 Using the Workspace Manager DPL allows you to store any number of Models in a Workspace. Before continuing, you'll make a copy of your model as it now stands, so that you'll have it if you need to update the tornado diagram later. Most actions in the Workspace Manager Window are accomplished by right-clicking an item and choosing a command from the context menu. First, you will make a copy of the current model. In the Workspace Manager window, right-click on "Model1" and select Duplicate (Figure 5-15). Figure 5-15. Using the Workspace Manager to Duplicate a Model DPL makes an identical copy of Model1. Rename the first model "Deterministic" by right-clicking on it and selecting Rename. Rename the second model "Risk Analysis" in the same way. Activate the Risk Analysis model. If it isn’t already, double-click on the splitter bar to maximize the Influence Diagram pane. Click Zoom Full (see Table 1-1) button on the status bar or press Ctrl+L. Your Workspace should look like Figure 5-16. 157 Chapter 5: Building and Analyzing Monte Carlo Simulation Models Syncopation Software Figure 5-16. Workspace with Two Models You may notice that the tornado diagram is under Deterministic in the hierarchy -- DPL groups outputs with the models they came from. It's good practice to save your Workspace from time to time. Select File | Save Workspace. 158 Syncopation Software Chapter 5: Building and Analyzing Monte Carlo Simulation Models 5.6 Running a Monte Carlo Simulation The tornado diagram indicates which values have the highest impact on Total Value. The next step in our risk analysis is to model the uncertainty in those factors. You'll start with Gross Margin, since it's at the top of the tornado. Right-click on Gross Margin, select Change Node To and then Continuous Chance in the context menu. The Node Definition dialog appears as shown in Figure 5-17. Figure 5-17. Node Definition Dialog Gross Margin is now a chance node, meaning that it is uncertain. DPL has two types of chance nodes, discrete and continuous. Discrete nodes are used for uncertainties which have a finite number of outcomes, such as single events (e.g., regulatory approval) or fixed scenarios (Low, Base Case, High). Continuous nodes can have infinitely many outcomes sampled from named probability distributions (normal, triangular, poisson, etc.) In this chapter, you'll be using continuous chance nodes. DPL draws discrete chance nodes in bright green and continuous chance nodes in dark green. 159 Chapter 5: Building and Analyzing Monte Carlo Simulation Models Syncopation Software Next, you'll need to edit the data for Gross Margin. Click on the Data tab of the Node Definition Dialog. By default, DPL initializes the node as a normal distribution with the original value (0.35) as the mean. You need to supply the standard deviation. Click the edit box next to stddev. Delete "1". Type "0.04". The node definition dialog should look like Figure 5-18. Click OK. Figure 5-18. Node Definition Data for Gross Margin Now that your model has uncertainty, you can run a Monte Carlo simulation. In the Monte Carlo Samples section of the Home | Run group (see Figure 5-19) change the initial number of samples to 100. Make sure Risk Profile is checked. Uncheck all other outputs. 160 Syncopation Software Chapter 5: Building and Analyzing Monte Carlo Simulation Models Figure 5-19. Home | Run options for Monte Carlo Simulation Note that the default run type indicated in the Decision Analysis split button icon changed to Monte Carlo simulation when you introduced a continuous chance node to your model. Select Home | Run | Decision Analysis, or press F10. DPL checks your model for completeness whenever you run any kind of analysis. DPL will give you an error message if you've mistyped a formula or forgotten a value. DPL runs the Monte Carlo simulation with 100 samples, which is a very small number, but useful for illustration. When the simulation run is complete, DPL displays a Risk Profile Chart (Figure 5-20). The sample is random, so your results will be slightly different, but the general shape will be similar. In this simulation, each sample has a weight (probability) of 1/100 or 1%. In the graph, you can see how the histogram bars represent single samples (probability 1%) at the high and low extremes. 161 Chapter 5: Building and Analyzing Monte Carlo Simulation Models Syncopation Software Figure 5-20. Risk Profile Histogram with 100 Samples To continue the risk analysis, you need to make the other key value drivers uncertain. Switch back to the Risk Analysis model by pressing Ctrl+F12 or doubleclicking its item in the Workspace Manager. Change Trendline Revenue Growth Rate, Share of at Risk Revenue Lost and RMC Lawsuit Settlement to continuous chance nodes. You can also change node types via the ribbon by clicking the Model | Node | Change To split button. DPL updates the default action of this button based on the last type of node you changed to. 162 Syncopation Software Chapter 5: Building and Analyzing Monte Carlo Simulation Models Enter the probability distributions and parameters as given in Table 5-2. Node Distribution Trendline Revenue Growth Rate Normal, mean 0.08, standard deviation 0.01 Share of at Risk Revenue Lost Triangular, min 0.50, max 0.95, mode 0.70 RMC Lawsuit Settlement Lognormal, mu 4.0, sigma 1.0 Table 5-2. Probability Distribution Parameters for Continuous Chance Nodes Run a Monte Carlo Simulation with the same settings as Figure 5-19. Note: DPL will issue a warning about deleting unsaved output results. Click OK to the warning. DPL brings up a new Risk Profile Histogram. Finally, you will examine the statistics available for the Risk Profile. Click Data | Distributions | Statistics. The Statistics dialog appears as shown in Figure 5-21. The Statistics dialog gives you a standard statistical description of the results of your Monte Carlo simulation, including the minimum and maximum values, the variance and standard deviation, the higher moments (skewness and kurtosis), and selected percentiles of the distribution. You may enter other percentiles into the Percentile list box and then click Update Percentile Values. 163 Chapter 5: Building and Analyzing Monte Carlo Simulation Models Syncopation Software Figure 5-21. Risk Profile Statistics Click Close to close the Statistics dialog. Note that because each simulation run will produce somewhat different results and you have run only 100 samples, your results will not match Figure 5-21 exactly, but they should be similar. The Risk Profile statistics are also written to the Session Log. To see this, scroll down to the bottom of the Session Log. 5.7 Comparing Risk Profiles DPL allows you to show up to eight risk profiles in a single chart window. You'll use this capability to show how increasing the number of samples increases the accuracy of the results. In the Workspace Manager, right-click on the Risk Profile Dataset item called "{Expected Value}" ( ). Choose Rename. Call this Risk Profile Dataset "100 Samples". 164 Syncopation Software Chapter 5: Building and Analyzing Monte Carlo Simulation Models DPL reuses the "Expected Value" dataset each time an analysis is run. If you want to save a distribution, you need to rename it. You can see that rather than renaming Expected Value, DPL made a copy of it. For more information on saving Risk Profile Datasets, see Section 3.6. The second item called "Expected Value" is the Risk Profile Chart. Risk Profile Charts and Risk Profile Datasets are separate items in the Workspace Manager because one chart can display several datasets. For more information on Risk Profile Dataset and Charts in the Workspace Manager, see Section 3.2 Next, you'll run simulations with larger numbers of samples. Run a Monte Carlo Simulation with 1000 initial samples. Repeat the process specifying 10000 initial samples and renaming the Risk Profile Dataset "10000 samples." Rename the "{Expected Value}" Risk Profile Dataset ( Samples". ) "1000 The run with 10000 samples may take a minute or two. You can take the opportunity to switch over to Excel and watch the numbers change. Excel needs to recalculate Total Value 10000 times. Now you have three Risk Profile Datasets, which you can display in a single Risk Profile Chart. In the Workspace Manager, rename the "Expected Value" Risk Profile Chart ( ) to "Sample Size Comparison". Double-click the Sample Size Comparison chart to make the window active. Initially, the chart will display the Expected Value risk profile dataset from the last simulation run. You want it to display all three of the saved risk profiles. Click Chart | Series | Data | Modify from the menu. The Modify Data dialog will be displayed. In the drop-down list for Series 1, select 100 Samples. Select 1000 Samples and 10000 Samples for Series 2 and Series 3, respectively. See Figure 5-22. 165 Chapter 5: Building and Analyzing Monte Carlo Simulation Models Syncopation Software Figure 5-22. Format Diagram Dialog, Series tab Click OK. See Figure 5-23. 166 Syncopation Software Chapter 5: Building and Analyzing Monte Carlo Simulation Models Figure 5-23. Sample Size Comparison Uncheck Format | Display | Histogram to make it easier to compare the Risk Profile Datasets. The chart window displays all three of the risk profiles in cumulative form (Figure 5-24). You will also add a legend to indicate which color goes with which graph. Check the checkbox next to Show within the Chart | Format | Legend group. Try out different placements of the legend by using the commands available in the Chart | Format | Legend group. If you would like it to be placed as it is in Figure 5-24, choose Right from the drop-down list and check the checkboxes next to Centered and Inside. 167 Chapter 5: Building and Analyzing Monte Carlo Simulation Models Syncopation Software It's clear that the three risk profiles are similar in a general sense, but that the 100 Samples curve deviates from the other two. This deviation may be easier to see if the lines were thinner. To decrease the weight of the line of the curves, select a curve (it should turn magenta) and go to Chart | Series | Lines/Markers. Within the Weight edit box delete "2" and enter "1". Do the same for the other two lines. (See Figure 5-24) Figure 5-24. Formatted Sample Size Comparison with Legend If you like, you can compare the statistics and percentiles of the risk profiles by clicking Data | Distributions | Statistics again. Use the dropdown list to select from the three distributions. You may enter other percentiles into the Percentile list box and then click Update Percentile Values. 168 Syncopation Software Chapter 5: Building and Analyzing Monte Carlo Simulation Models 5.8 Modeling an Up-Front Decision Thus far, your analysis has focused on the risks to the business, without considering any decisions management might be able to make to mitigate those risks. Enlightify's parent organization has considered spinning off Enlightify. Doing so would alleviate regulatory pressure, but would probably reduce its rate of growth because cross-selling opportunities ("synergy") would be lost. Next, you'll add this decision to your model. Before making this change, you want to make a copy of the model as it is. In the Workspace Manager window, right-click on "Risk analysis" and select Duplicate. Rename the new model "Decision Analysis" by right-clicking on it and selecting Rename. If necessary, drag the splitter up from the bottom of the Influence Diagram to make the decision tree pane visible. Your Workspace should look like Figure 5-25. Figure 5-25. New Model for Decision Analysis 169 Chapter 5: Building and Analyzing Monte Carlo Simulation Models Syncopation Software Assume you've prepared a spreadsheet which includes two new input drivers, one for the spinoff decision and one for its effect on the growth rate. You'll need to link the decision analysis model to the new spreadsheet. Select Model | Links | Options. The Model Links dialog is displayed (see Figure 5-26). Click the Browse button. Click OK. Select "Enlightify2.xls". Click Open. If you can't see the full path and name of the newly linked spreadsheet (Enlightify2), drag the Name column separator to the right. You should see that Enlightify2.xls is now linked to the model. Figure 5-26. Model Links Dialog 170 Syncopation Software Chapter 5: Building and Analyzing Monte Carlo Simulation Models Next, you'll create two new DPL nodes for these new inputs in the spreadsheet. Click Model | Links | Add (Excel Calculation-Linked should be the default). The Range Names dialog is displayed. Select Spin_off and Loss_of_Synergy (hold down the Ctrl key while clicking the second item -- Figure 5-27). Figure 5-27. Range Names dialog Click OK. DPL initially adds the new nodes to the right. Move them so they are positioned as in Figure 5-28. 171 Chapter 5: Building and Analyzing Monte Carlo Simulation Models Syncopation Software Figure 5-28. Influence Diagram with Spin off and Loss of Synergy added Next, you need to change Spin off into a decision node. Select Spin off and drop-down the Model | Node | Change to split button and choose Decision from the list. DPL displays the Node Definition dialog. The default decision alternatives, Yes and No, are fine, but you need to edit the data. In the spreadsheet, a value of 0 for Spin off means that no action is taken, and a value of 1 means that Enlightify is sold. Click on the Data tab in the dialog. Press the down arrow to navigate to the No branch. Type "0" (Figure 5-29). Click OK. 172 Syncopation Software Chapter 5: Building and Analyzing Monte Carlo Simulation Models Figure 5-29. Node Definition Data for Spin off Select Model | Influence/Arc | From Formulas so that DPL will add arcs for the new nodes. Your model should look like Figure 5-30. 173 Chapter 5: Building and Analyzing Monte Carlo Simulation Models Syncopation Software Figure 5-30. Model with Spin off decision Note: Loss of Synergy is simply a linked value node that is set to 0.06 for now. You are linking this value to the model because in the next section, you will see how to perform sensitivity analysis on the assumed value. You are ready to run the decision analysis model. You may want to save your workspace at this point. Change the initial number of samples to "1000". Make sure Risk Profile and Init Dec Alts is checked. The Home | Run group should look like Figure 5-31. Figure 5-31. Home | Run options for Monte Carlo Simulation Click Home | Run | Decision Analysis (or press F10). 174 Syncopation Software Chapter 5: Building and Analyzing Monte Carlo Simulation Models The analysis will take a few seconds. Excel has to recalculate the spreadsheet 2000 times; 1000 for each decision alternative. When the run is finished, DPL will show you the outcome distributions for both alternatives. Uncheck Histogram in Chart | Format | Display. Check EV/CE Lines. Check EV/CE Values. A line is added to each risk profile to show the expected value (with its value to the left of it) for each alternative. See Figure 5-32. Figure 5-32. Risk Profile Chart Comparing Initial Decision Alternatives From this Risk Profile Chart, you can see that the risk profile for the No alternative generally lies below and to the right of the risk profile for the Yes alternative. This means that for almost any outcome value on the xaxis, there is a lower probability of the No alternative outcome being less than the x-value than there is of the Yes alternative being less than the xvalue. Also, the No alternative has a higher expected value than the Yes alternative. 175 Chapter 5: Building and Analyzing Monte Carlo Simulation Models Syncopation Software For most decision makers, the No alternative would be preferable to the Yes alternative. It appears that the parent organization should not spin off Enlightify. 5.9 Performing a Sensitivity Analysis In the previous section, you concluded that it was better not to spin off Enlightify. However, you didn't test the assumption about the loss of synergy that would result from a spin off. DPL's Rainbow Diagram feature allows you to run a model for several settings of an input variable. Since you earlier linked the value Loss of Synergy to your model, you can use this feature now. Select Home | Sensitivity | Rainbow Diagram. DPL displays the Run Rainbow Diagram dialog. Click Select. DPL displays the Select Value for Rainbow Diagram dialog (Figure 5-33). Choose Loss_of_Synergy from the Value for sensitivity drop list. Click OK. Figure 5-33. Select Value for Rainbow Diagram dialog 176 Syncopation Software Chapter 5: Building and Analyzing Monte Carlo Simulation Models You would like to know how low Loss of Synergy would have to be, in order for spinning off Enlightify to be the optimal alternative. Type "0.03" for From. Type "0.06" for To. Type "0.01" for the Step size. While you could run the sensitivity analysis with 1000 samples, the randomness of the simulation "draw" might obscure the effect of changing the Loss of Synergy value. For better results, increase the sample size to 5000. Click Change. The Run Options dialog appears. Change the Initial number of samples to 5000. Click OK. The Run Rainbow Diagram dialog should look like Figure 5-34. Figure 5-34. Run Rainbow Diagram dialog Click OK to run the Rainbow Diagram. 177 Chapter 5: Building and Analyzing Monte Carlo Simulation Models Syncopation Software DPL will run a full simulation for each of the four steps (0.03, 0.04, 0.05, 0.06), a total of 40,000 recalculations of the spreadsheet. This may take a few minutes. The Rainbow Diagram (Figure 5-35) shows the model's expected value for each of the steps. The color change between 0.04 and 0.05 indicates that the best (highest expected value) decision alternative changed between these two points. This tells you that if you knew Loss of Synergy would be only 4%, it would be better to spin off Enlightify. If you wanted to find the threshold more precisely, you could run another rainbow diagram with a range of 0.04 to 0.05 and a smaller step size. Figure 5-35. Rainbow Diagram on Loss of Synergy This Rainbow Diagram only has two colors, and the model only has one decision with two alternatives, so it's not hard to figure out the alternative represented by each color. In a more complex diagram, you can use DPL's policy tip feature to see the optimal alternative for each step. If you hold the mouse cursor over the green circle for 0.04 (as has been done in Figure 5-35), DPL will tell you that Spin off is Yes in that step. For more information on reading policy tips, please see Section 3.7. Note: Show Tips in File | Options | General must be checked in order for policy tips to work. 178 Chapter 5: Building and Analyzing Monte Carlo Simulation Models Syncopation Software 5.10 Modeling a Downstream Decision The decision analysis model used in the previous two sections assumes that the Spin off decision will be made at a time when the four uncertainties are not known. In Figure 5-30, the decision comes first in the decision tree sequence. You might ask how the results would differ if the decision could be made later, after the uncertainty Share of at Risk Revenue Lost is resolved. To answer this question, you will change the sequence of the nodes so that the decision is preceded by this uncertainty. A decision that comes after one or more uncertainties is called a downstream decision or a real option. For more on modeling real options using downstream decisions, see Chapter 7. In the Workspace Manager, right-click on "Decision Analysis". Select Duplicate. Right-click on the new model. Select Rename and call it "Real Option Analysis". Make the new model active in the Model Window. To make the Spin off decision a real option triggered by the Share of at Risk Revenue Lost uncertainty, you will need to tell DPL that the uncertainty comes first in the decision tree sequence. The easiest way to do this is by adding an arc. Click Model | Influence/Arc | Add. The cursor changes to the begin arc cursor ( Click on Share of at Risk Revenue Lost. The cursor changes to the end arc cursor ( ). ). Click on the Spin off decision. DPL reorders the Default Tree to reflect the new arc (Figure 5-36). 179 Chapter 5: Building and Analyzing Monte Carlo Simulation Models Syncopation Software Figure 5-36. Reordered Decision Tree The Monte Carlo options in the Home | Run group should be modified as shown in Figure 5-37. Make sure Risk Profile is checked. Uncheck Init Dec Alts. Change Initial number of samples to 500. Check the Policy Summary™ checkbox. Select "3" from the Number of Levels drop-down list. 180 Syncopation Software Chapter 5: Building and Analyzing Monte Carlo Simulation Models Figure 5-37. Monte Carlo Simulation Options for Downstream Decision Click Home | Run | Decision Analysis (or press F10). The run may take several minutes. DPL must sample each alternative of the downstream decision 100 times, and the decision itself will be sampled 500 times, so the run will require 100,000 recalculations of the spreadsheet. When the run completes, DPL displays the Policy Summary™. The Policy Summary™ shows that the option to spin off the business is exercised in about 12% of the scenarios. For more information on Policy Summaries™, see Section 3.2. Figure 5-38. Policy Summary™ for the Spin off option 181 Chapter 5: Building and Analyzing Monte Carlo Simulation Models Syncopation Software For continuous chance nodes in the Policy Summary™, DPL creates two pseudo-states: s1 and (does not occur). The probabilities (or percentages) displayed on these two states indicate how often the chance node occurs in the optimal set of scenarios. In Figure 5-38, the percentage for s1 is 100%. This means that the chance node occurs in all optimal scenarios. This makes sense because the decision tree is symmetric (every node occurs on every path). In an asymmetric tree (see Chapter 6), a continuous chance node might not appear in all optimal scenarios. If you'd like, you can compare this risk profile dataset, its expected value and other statistics with one from the model without the downstream decision, as described in Section 5.7. 182 Chapter 6: Asymmetric Trees Syncopation Software 6 Asymmetric Trees This chapter will walk you through the process of building an asymmetric decision tree. Asymmetric decision trees are important because many business decisions are asymmetric in nature: different strategic alternatives are often influenced by different sources of uncertainty. Modeling that asymmetry directly usually improves computational efficiency, and results in a model which reveals the structure of the problem and is useful for communication. This chapter assumes you have already been through at least one of the earlier tutorials (Chapters 2 and 3 or Chapter 5) in this manual, or that you are already familiar with DPL. Therefore, basic procedures such as starting DPL and opening and saving workspaces will not be explained in detail here. Note that in the tutorials in Chapters 2, 3 and 5, you worked mainly in the Influence Diagram pane of the Model Window. In this chapter, you will be working mainly in the Decision Tree pane because asymmetries are modeled in the decision tree. Refer to Chapter 1 if you need a refresher on how to move around the Model Window. 6.1 Eliminating Redundant Paths You will begin with a simple symmetric model for a pharmaceutical R&D project. Start DPL. Open the file AsymmetricTrees.da. If the default installation folder was used when installing DPL, then the file should be in the C:\Program Files (x86)\Syncopation\DPL8\Examples folder. See Figure 6-1. 183 Chapter 6: Asymmetric Trees Syncopation Software Figure 6-1. Simple Model with a Symmetric Tree This DPL model and its associated spreadsheet (AsymmetricTrees.xls) are set up to calculate the value of a pharmaceutical R&D project. The project is in an early stage, so there is uncertainty about whether it will succeed and result in a drug with regulatory approval (FDA Approval). If it does succeed, its revenues will be influenced by three factors: Price, Market Share and Market Size. These three factors are all modeled as uncertainties (Price is assumed to be set by a regulatory process, so it is not under management's control in this example). First, run the model and look at the results. Check Policy Tree™ in the Home | Run group. Uncheck all the other outputs (Figure 6-2). Figure 6-2. Home | Run Group for Symetric Model 184 Chapter 6: Asymmetric Trees Syncopation Software Select Home | Run | Decision Analysis (or press F10). DPL will launch Excel and open AsymmetricTrees.xls. From the Policy Tree™ (Figure 6-3), you can see that the optimal alternative is to continue to develop the drug. If you do so, the expected NPV is approximately $75 million, whereas if you abandon it, the value is zero. Expand the Policy Tree™ by Shift+double-clicking on both instances of the FDA Approval chance node. Figure 6-3. Policy Tree™ for the Symmetric Model If the decision is made to abandon the project, then FDA Approval does not matter -- the value is zero in either case. If you expand down further into the don't develop half of the tree, you'll see that all the values are zero. This tree has 108 scenarios or paths (to calculate this multiply the number of branches of the nodes: 2*2*3*3*3 = 108), but half of them have an objective function value of zero. These redundant paths increase runtime and make the tree harder to read. 185 Chapter 6: Asymmetric Trees Syncopation Software Right-click the Symmetric model in the Workspace Manager and choose Duplicate. Right-click the Symmetric – copy model you just created. Select Rename. Rename the new model "Asymmetric". You are about to make some edits directly in the Decision Tree. In the Decision Tree, you may either have a node or branches selected. In Figure 6-4, the decision node Develop? is selected. In Figure 6-5, the branches of Develop? are selected. Figure 6-4. Develop? Node Selected in Decision Tree 186 Chapter 6: Asymmetric Trees Syncopation Software Figure 6-5. Develop? Branches Selected in Decision Tree Double-clicking on a node in the Decision Tree brings up the Node Definition dialog (with the Tree Instance tab active). Double-clicking in the branches of a node brings up the Get/Pay tab of the Branch Definition dialog (more on this later). Double-click on the Develop? node in the decision tree (not in the Influence Diagram) to open the Tree Instance tab of the Node Definition dialog. Select Asymmetric for the Alternative Grouping (Figure 6-6). 187 Chapter 6: Asymmetric Trees Syncopation Software Figure 6-6. Node Definition dialog, Tree Instance tab Click OK. 188 Chapter 6: Asymmetric Trees Syncopation Software Figure 6-7. Decision Tree with Asymmetric Decision DPL detaches the node from the rest of the tree and changes the decision node instance so that each alternative branch of the decision can have a different subtree follow it. In Figure 6-7, the two blue triangles on the branches of the decision represent "attachment points" where other nodes can be connected. You want to attach the FDA Approval node to the Yes branch. Select FDA Approval by clicking it with the mouse. Without releasing the mouse button, drag the node until the semitransparent chance node is over the blue triangle for the Yes alternative (Figure 6-8). 189 Chapter 6: Asymmetric Trees Syncopation Software Figure 6-8. Moving the FDA Approval Node Release the mouse button (Figure 6-9). Figure 6-9. FDA Approval Node Attached to the Yes Alternative This model represents the same decision as the symmetric model, but it has only about half as many paths (55 rather than 108). Run a decision analysis again. The results, approximately $75 million for the Yes alternative and $0 for the No alternative, are the same. Note that DPL assumed a value of zero for the No alternative since no get/pay is specified on that branch. Select the FDA Approval node in the Policy Tree™. In the Expand Policy Tree™ dialog, type "4" (Figure 6-10). Drop-down the Policy | Display | Expand split and select Expand to Level…. 190 Chapter 6: Asymmetric Trees Syncopation Software Click OK. Figure 6-10. Expand Policy Tree ™ Dialog DPL expands the Policy Tree™ two more levels down -- enough to show you the expected values on the branches of Market Share (Figure 6-11). Figure 6-11. Policy Tree™ Expanded to 4 Levels 191 Chapter 6: Asymmetric Trees Syncopation Software When FDA Approval is No, all three values on the branches of Market Share are the same: -$174 million. This is the cost of developing the drug all the way to an FDA submission and being rejected. If the drug is not approved, Market Share, Market Size and Pricing are all irrelevant. The spreadsheet correctly handles this in calculating NPV in the disapproval scenarios. As with the Develop? decision, this is another situation where asymmetry can make the model more efficient and intuitive. Return to the Asymmetric model. You can double-click on its icon in the Workspace Manager window, click on its tab in the document navigator, or press Ctrl+F12. Double-click on FDA Approval in the decision tree. Click OK. Choose Asymmetric for the Outcome Grouping in the Tree Instance tab of the Node Definition dialog. Drag the Market Share node and drop it on the Yes branch of FDA Approval. Your model should look like Figure 6-12. Figure 6-12. Decision Tree with FDA Approval Asymmetric Unlike the decision to halt development, an outcome of No for FDA Approval does not result in a value of zero. The correct value is -$174 million, the cost of R&D up to that point. To correctly model the situation, you must tell put a Get/Pay expression on the No branch of FDA Approval. Select the No branch of FDA Approval. Use the Get/Pay drop-down in Model | Get/Pay to select NPV from the list. 192 Chapter 6: Asymmetric Trees Syncopation Software Figure 6-13. Model | Get/Pay Drop-down The decision tree (Figure 6-14) now indicates that DPL should add the value of NPV to the objective function if FDA Approval is No. The tree has a Get/Pay expression equal to NPV on the branches of the Pricing node, so DPL was already adding NPV to the objective function in paths leading all the way through the tree. Figure 6-14. Decision Tree with Two Get/Pay Expressions You can also drag and drop values from the Influence Diagram to branches in the Decision Tree to specify Get/Pay expressions. You will use this method later in this chapter. Before you run a decision analysis we will examine an option in DPL. Select Model | Tree | Options. The Tree Options dialog will open. Note that the Tree-based dependency checking checkbox is checked by default. See Figure 6-15. 193 Chapter 6: Asymmetric Trees Syncopation Software Figure 6-15. Tree Options Dialog with Tree-based dependency checking This is what you want so click Cancel without making any changes. Examining the arcs in the Influence Diagram, one would expect NPV to depend on all four of the uncertainties, but three of them are not known when NPV is calculated on the branch where FDA Approval is No. The three omitted uncertainties all affect revenues, and the spreadsheet knows to turn off all revenues in the disapproval case, so there isn't really a problem. By having this option on, DPL assumes that the tree is valid and that the dependencies in the Influence Diagram don't apply to every scenario. Warning: To safely use this option, you must make sure that the nodes that are skipped do not affect spreadsheet calculations in the scenarios where they are not known. In those scenarios, the values for the "default" state (decision alternative or chance outcome) will be sent to the spreadsheet. For example, when FDA Approval is No, DPL sends the default (in this case the middle or Nominal) values for Market Share, Market Size and Pricing to Excel before telling Excel to recalculate NPV. The Excel model must be coded to ignore these values when FDA Approval is No. 194 Chapter 6: Asymmetric Trees Syncopation Software You will now look at how to set default states. Open the Pricing chance node in the Influence Diagram. Select another state and press the Default button. The default changes. Click Cancel to discard the change. Click on the General tab. The Nominal outcome is designated as the default state for Pricing. Each chance node and decision node should have one of its outcomes assigned as the default in the General tab of Node definition. In particular if you are building an asymmetric model such as the example used here, you should ensure that each node has a default state set. You will now run an analysis. Click Home | Run | Decision Analysis (or press F10). The results are the same as before, although the tree is now much smaller and the analysis runs more quickly. To see how many paths there are in the model, you can look in the session log. Look for the "Number of paths" entry near the bottom. The end of the session log will look something like this: 11:00:00 Compiling: Asymmetric Number of paths = 29 11:00:01 Complete 11:00:01 Analyzing ... Full tree enumeration 11:00:02 Complete The tree now has only 29 paths, compared with 108 when you started. Since the tree is quite small either way, this may not seem to make much difference, but in much larger models, incorporating asymmetries in the tree will result in improved performance and clearer communication of the decision structure. 195 Chapter 6: Asymmetric Trees Syncopation Software 6.2 Using Multiple Get/Pay Expressions Currently, the model only imports data from Excel via one cell: DCF!Total_NPV. This is the simplest way to set up a linked model, and for many situations it's the best way. However, it is also possible to import data from several places in the spreadsheet. Doing so may result in a model which is more flexible and efficient, and can also help communicate the model's logic. In this section, you'll construct a "Pay as You Go" (PAYG) model, where costs and revenues are placed in the tree to reflect when they occur. Instead of using one value, NPV, for all cash flows associated with the project, you'll separate cash flows into three components: development costs, launch costs and revenues/marketing costs once the product is on the market. You will start by creating two new value nodes for development and launch costs. Switch back to the Asymmetric model (Ctrl+F12 or double-click on its item in the Workspace Manager). Click in the Influence Diagram pane. In the Range Names dialog, select PV_Development and PV_Launch (hold the Ctrl key when clicking on the second value). See Figure 6-16. Click Model | Links | Add (Excel Calculation-Linked should be the current default). 196 Chapter 6: Asymmetric Trees Syncopation Software Figure 6-16. Range Names Dialog Click OK. Initially, DPL will place the nodes to the right of NPV; you may have to scroll the Influence Diagram pane to the right to see them. Move the nodes so that they are positioned as in Figure 6-17. Add two new arcs as shown in Figure 6-17. 197 Chapter 6: Asymmetric Trees Syncopation Software Figure 6-17. Influence Diagram with Three Import Nodes You also need to change the NPV node so it includes only revenues and costs associated with a product on the market. Double-click on NPV in the Influence Diagram. The Node Definition dialog appears. Click on the General tab. Change the node name to "PV Market". Click on the Links tab. Click the Cell Names button. Select PV_post_launch from the list. Click Select. The Node definition dialog is updated (Figure 6-18). 198 Chapter 6: Asymmetric Trees Syncopation Software Figure 6-18. Node Definition dialog, Links Tab Click OK. A prompt will appear asking if you would like to replace the old node name (NPV) with the new node name (PV Market) in node data and get/pay expression in the decision tree (See Figure 6-19). Figure 6-19. Node Name Change Prompt Click Yes. Note that if you’d like DPL to automatically find and replace old names with new in the future, then you should check the Don’t ask again checkbox. If you’d like to be prompted each time, leave the checkbox unchecked. These options can be changed in File | Options | General in the After Node Name Change section. 199 Chapter 6: Asymmetric Trees Syncopation Software DPL changes the Get/Pay expression for Pricing and FDA Approval to PV Market, as shown in Figure 6-20. Figure 6-20. Get/Pay Expression Revised by Drag/Drop Method Now you need to place the other two import nodes in the appropriate decision tree paths as Get/Pay expressions. This time, you will use the drag-and-drop method. Development costs are only paid if the Develop? decision is Yes; launch costs are only paid if FDA Approval is Yes. Select the PV Development value node in the Influence Diagram. Drag it down to the Decision Tree pane. The cursor changes to the add get/pay cursor ( ). Drop it on the Yes branch of the Develop? Node in the Decision Tree. DPL adds PV Development to the Get/Pay expression for this branch, as shown in Figure 6-21. Figure 6-21. Get/Pay Expression Revised by Drag/Drop Method 200 Chapter 6: Asymmetric Trees Syncopation Software Repeat the drag/drop procedure to place PV_Launch on the Yes branch of FDA Approval. Select the No branch of FDA Approval. Remove "PV_Market" from the Get/Pay expression by deleting the expression in the Get/Pay drop-down and pressing enter. Note: If you drag and drop a value from the Influence Diagram pane to an existing Get/Pay expression on the branches of a node in the decision tree, DPL will add that value to the existing Get/Pay expression; e.g, the Get/Pay expression Value1 will become Value1+Value2. Your tree should now look like Figure 6-22 (you may need to Zoom Full to see the whole tree). Figure 6-22. Decision Tree with Three Get/Pay Expressions Select Home | Run | Decision Analysis (or press F10). The results, $75 million for Yes and zero for No, are as before. Shift+double-click on the FDA Approval node in the Policy Tree™ to expand and zoom the tree. See Figure 6-23. DPL displays the values for get/pay expressions below the node branch on which they occur in the Policy Tree™. In Figure 6-23, you can now see the values for development cost ($174 million -- below the Yes branch of Develop?) and launch costs ($123 million -- below the Yes branch of FDA Approval). 201 Chapter 6: Asymmetric Trees Syncopation Software Figure 6-23. Policy Tree™ With NPV split into its components, you are adhering to all the arcs in the Influence Diagram. You no longer need to suppress DPL's influence checking and could turn it off. If you were sharing this model with others in your organization that might modify it, turning off Tree-based dependency checking might be advisable to prevent from getting erroneous results if they changed the model in a way that violated the logic assumptions in the spreadsheet. 202 Chapter 6: Asymmetric Trees Syncopation Software 6.3 Adding a Downstream Decision Asymmetric trees often involve downstream decisions that represent risk mitigation options. These downstream decisions are sometimes referred to as real options. A real option is analogous to a financial option. With a financial option, you buy the right but not the obligation to purchase (or sell) an underlying financial asset (e.g., a stock) at some future date. With a real option, you invest an initial sum of money in a project or venture which gives you the ability but does not obligate you to invest more money in the project or venture at a future date after learning something about the project/venture. E.g., you could pay for some market research on a product and subsequently decide whether to launch the product or not. In this instance, the real option is the launch decision. You get to decide whether or not launch after learning about the market research results. In our model, the launch costs are significant ($123 million), and one might ask whether there are situations in which you suspect the product will perform poorly and you would like to know whether you are better off not launching it. In this section, you'll add a chance node and a decision node to model one such exit option. As before, switch back to the Asymmetric model. Click Model | Links | Add. The Range Names dialog appears. Select Key_competitor_outcome. Click OK. The new node is initially placed to the right. Move the new node so that it is above FDA Approval. While the node is still selected, drop-down the Model | Node | Change to split button on the ribbon (see Table 1-2) and choose Discrete Chance from the list. The Node Definition dialog appears with the General tab selected. Change the outcomes to Failure, Disappointment and Breakthrough. Click on the Data tab of the Node Definition dialog and enter values of 1, 2, 3 (See Figure 6-24). Leave the default probabilities of .3, .4 and .3. 203 Chapter 6: Asymmetric Trees Syncopation Software Figure 6-24. Node Definition dialog, Data tab Click OK. Your model should look like Figure 6-25. 204 Chapter 6: Asymmetric Trees Syncopation Software Figure 6-25. Influence Diagram and Decision Tree with Key competitor outcome Node The previous model assumed you would launch the product if you obtained FDA Approval. You'll now add an explicit launch decision. Drop-down the Model | Node | Add split button on the ribbon (see Table 1-2) and choose Decision node from the list. The mouse cursor changes to a semi-transparent decision node. Click in the Influence Diagram. The Node Definition dialog appears. Click OK. Name the decision Launch. Leave the default alternatives, Yes and No, as is. Rearrange the Influence Diagram so it looks like Figure 6-26. You'll need to remove and add several influence arcs. You can optionally bend the arcs as they are in the figure as well. 205 Chapter 6: Asymmetric Trees Syncopation Software Figure 6-26. Influence Diagram with Launch Decision In the spreadsheet, the Key competitor outcome influences the size of the market for the drug under consideration -- if the competitor has a breakthrough, the market for the drug being considered for development will shrink. Initially, all blank models start in default tree mode, meaning DPL will automatically create then update a symmetric decision tree based on changes made in the influence diagram. Starting in Section 6.1 and in subsequent sections, you directly edited the default tree by introducing asymmetry to the tree causing DPL to no longer be in default tree mode. Once DPL is not in default tree mode, DPL will continue to add new instances to the tree, with those instances being placed at the end of the longest subtree. E.g, DPL has attached the two nodes you just added to the Influence Diagram to the Pricing node since that node previously ended the longest subtree. 206 Chapter 6: Asymmetric Trees Syncopation Software If there is a Get/Pay expression on the branches of the node at the end of the longest subtree and DPL places a new instance at the end of that subtree, the Get/Pay expression is moved from the branches of the node that was previously at the end of the subtree to the newly added node (i.e., the PV_Market Get/Pay expression was moved from the branches of the Pricing node to the Key competitor outcome node and then from there to the branches of the Launch decision). You need to re-order the decision tree to put the Launch decision and Key competitor outcome in the correct places. But prior to re-ordering the tree, you will put the Get/Pay expression back on the branches of the Pricing node. To do so efficiently, you will use DPL's cut and paste feature. Select the branches of the Launch decision and press Ctrl+X. The expression is placed on the clipboard. Select the branches of the Pricing node and press Ctrl+V. The Get/Pay expression is removed from the branches of Launch and added to the branches of the Pricing node. You are now ready to reorder the tree so that the downstream decision is made after learning about the outcome of a key competitor. In the decision tree, drag the Key competitor outcome node and drop it on top of the Market Share node. The Key competitor outcome node is now connected to the Yes branch of the FDA Approval node and comes before the Market Share node. See Figure 6-27. Figure 6-27. Decision Tree with Key Competitor outcome node moved 207 Chapter 6: Asymmetric Trees Syncopation Software Drag the Launch decision node and drop it directly on the Market Share node. Your decision tree should look like Figure 6-28. Figure 6-28. Decision Tree with Launch Decision node moved You now need to make the launch decision asymmetric. Double-click on the Launch decision in the Decision Tree. The Tree Instance tab of the Node Definition dialog appears. Select Asymmetric for the Alternative Grouping. Click OK. Drag the Market Share node and attach it to the Yes branch of the Launch decision. Your decision tree should look like Figure 6-29. Figure 6-29. Decision Tree Attached 208 Chapter 6: Asymmetric Trees Syncopation Software Finally, you need to make sure that the launch costs are only paid if you decide to launch (the whole point of the launch decision is to avoid those costs if the project looks unattractive). Select the Yes branch of FDA Approval. Delete the Get/Pay expression in the Model | Get/Pay drop-down and press Enter. Drag the PV_Launch value node to the Yes branch of Launch in the Decision Tree pane, and release the mouse button. Figure 6-30. Completed Decision Tree Your decision tree should now look like Figure 6-30. You are now ready to run an analysis. Select Home | Run | Decision Analysis (or press F10). Figure 6-31. Policy Tree™ with Launch decision 209 Chapter 6: Asymmetric Trees Syncopation Software In the Policy Tree™ (Figure 6-31), the expected value has changed significantly. Previously, you were assuming a Key competitor outcome of Disappointment, but now the outcome can be either better or worse than that. The bad outcome, a competitor breakthrough, has more of an effect than the good outcome, competitor Failure. You can also see that the optimal decision alternative for Launch is always Yes. Although a Key competitor outcome of Breakthrough gives you a negative expected value of -$104 million, this is still better than quitting and losing $174 million. You will make one more change to the decision tree to make it even more asymmetric. Suppose that management wants to know the impact on the overall expected value of the Develop? decision, if they were to decide that they will not launch the product if the Key competitor outcome is Breakthrough. You can very easily answer this question using a simple modification to the decision tree. Activate the Asymmetric model again. Click in the Decision Tree. Double-click on the Key competitor outcome node to open the Node Definition dialog. See Figure 6-32. Figure 6-32. Tree Instance Dialog, Mixed Outcome Grouping 210 Chapter 6: Asymmetric Trees Syncopation Software Click the Mixed radio button under Alternative Grouping. The Select Groups dialog appears. Select both the Failure and Disappointment outcomes by using your mouse button and the Shift key. Click on Group. These two outcomes become the first outcome group. Select the Breakthrough outcome and click on Group again. The dialog should look like Figure 6-33. Figure 6-33. Mixed Outcome Group Definitions Click OK twice. DPL has detached the Launch decision from the Key competitor outcome node. Drag the Launch decision (and its subtree) to the blue endpoint for the Failure and Disappointment outcomes. Release the left mouse button to attach the subtree to these two outcomes. The decision model should now look like Figure 6-34. 211 Chapter 6: Asymmetric Trees Syncopation Software Figure 6-34. Decision Model with Mixed Outcome Grouping The tree structure now assumes that management will not launch the product if the key competitor has a breakthrough. You will run the decision analysis to see how much this assumption reduces the value of the Develop? decision. Click Home | Run | Decision Analysis (or press F10). Click OK for the warning. 212 Chapter 6: Asymmetric Trees Syncopation Software The results should look like Figure 6-35. The value of the overall Develop? decision has dropped to about $11 million, a loss of $10 million. Note that because this tree is small, it should be easy to explain to management exactly why this is the case. There is a 15% chance of ending up in the situation in which the competitor has a Breakthrough, and if this happens, about $70 million is lost by not launching the product anyway. The overall loss in expected value is 15% x $70 million, or about $11 million. Figure 6-35. Policy Tree™ for Revised Model 213 Chapter 6: Asymmetric Trees Syncopation Software 214 Syncopation Software Chapter 7: Conditioning and Learning in Decision Models 7 Conditioning and Learning in Decision Models When a decision is preceded by a chance node that provides information, we say that the model contains learning. For example, before deciding whether to carry an umbrella, you may look out the window and see if there are clouds. Learning about the "clouds" uncertainty provides imperfect information about the uncertainty of concern: whether or not it will rain later that day. Other typical examples of learning in decision models include medical tests, market research, and sampling of the physical environment. Test drilling for oil is a classic example of learning and is the basis for the tutorial in this chapter. This chapter assumes you have already been through at least one of the earlier tutorials (Chapters 2 and 3 or Chapter 5) in this manual, or that you are already familiar with DPL. Therefore, basic procedures such as starting DPL and opening and saving workspaces will not be explained in detail here. This chapter also assumes some familiarity with basic probability theory and Bayes' Rule. The example in this chapter demonstrates DPL's capability to perform Bayesian revision, which can be simply described as reversing the order of conditioning among chance nodes to take advantage of the data available. Please consult online Help and/or a probability theory or decision analysis textbook if you need further explanation of these topics. 215 Chapter 7: Conditioning and Learning in Decision Models Syncopation Software 7.1 Incorporating Imperfect Information in a Model In this section, you will enhance a simple decision model by adding a node that represents imperfect information about an important value driver. You will see how the "learning" associated with such nodes can significantly change the measured value of an asset. Start DPL. Open the workspace Learning.da. It should be in the Examples folder underneath where DPL is installed (C:\Program Files (x86)\Syncopation\DPL8\Examples if the default installation location was used). See Figure 7-1. Figure 7-1. Simple Wildcat Decision Model 216 Syncopation Software Chapter 7: Conditioning and Learning in Decision Models This model represents the decision problem faced by a "Wildcatter" exploring for oil. In a given field, s/he must decide whether or not to drill. If oil is found, uncertain costs are incurred. If a "dry hole" is drilled, nothing is gained. If oil is struck, then an amount of revenue is gained which depends on the price of oil and the reserves found. In the Home | Run group, check Risk Profile and Policy Tree™. Uncheck the Init Dec Alts checkbox (Figure 7-2). Click Home | Run | Decision Analysis. Figure 7-2. Decision Analysis Options dialog The Policy Tree™ tells you that you should drill, and that the expected value of this opportunity is $26.5 million (Figure 7-3). Figure 7-3. Policy Tree™ 217 Chapter 7: Conditioning and Learning in Decision Models Syncopation Software Navigate to the Risk Profile Chart (double-click on the item for it in the Workspace Manager or click on the item for it in the document navigator). Figure 7-4. Risk Profile While this opportunity has positive value, it is risky. There is a about a 51% chance of losing money (see Figure 7-4). For more on reading Risk Profiles, see Section 3.2. 218 Syncopation Software Chapter 7: Conditioning and Learning in Decision Models In reality, the wildcatter has more choices than just whether or not to drill. S/he can conduct one of several tests intended to tell him/r about the likelihood of finding oil and then decide whether or not to drill. You will add a decision and a learning uncertainty for one such test. Add a decision node to the Influence Diagram. Place it above the Drill decision. Call the decision node "Test". Name its alternatives "None" and "Core sample". Add a value node called "Test Costs". Place it above Revenues. If you need more room in the window, click the Zoom Out button on the status bar or drag the splitter bar between the Influence Diagram and the Decision Tree. Your diagram should look like Figure 7-5. Figure 7-5. Influence Diagram with Test decision Test Costs depend on whether the wildcatter decides to test. Double-click on the Test Costs node. In the Node Definition dialog, click the Conditioning button. Check the checkbox next to Test (Figure 7-6). 219 Chapter 7: Conditioning and Learning in Decision Models Syncopation Software Figure 7-6. Adding Conditioning Click OK. DPL changes the data input tree to reflect the new conditioning. You can now enter two data expressions, one for each alternative of the Test decision (Figure 7-7). 220 Syncopation Software Chapter 7: Conditioning and Learning in Decision Models Figure 7-7. Node Definition Data for Test Costs Type "0" for the None branch. Type "-6" for the Core sample branch. Click OK. In this model, you'll use an additive convention, so all costs will be entered as negative numbers. In your Influence Diagram, DPL has drawn an arc (arrow) from Test to Test Costs to reflect the conditioning you specified in the Node Definition dialog. The arrowhead is blue, which means that the Test Costs have different value expressions for each state of the conditioning event Test. The color codes for arcs are summarized at the end of this chapter. Double click on the arrowhead. DPL displays the Value Influence Type dialog (Figure 7-8). 221 Chapter 7: Conditioning and Learning in Decision Models Syncopation Software Figure 7-8. Value Influence Type dialog Unchecking the "Different values" checkbox would negate the conditioning you just added. In DPL, you have the choice of specifying conditioning in the Node Definition dialog when you're entering data or on the Influence Diagram itself by changing arc types. If you are developing a model in which you know that influence arcs into nodes will mainly be of one type, you can check the "Make this the default" checkbox. Future arcs will be of the same type. You may have a different default arc type for each node type of the successor in DPL (decision, chance, value and controlled). Click Cancel to close the dialog without making changes. You'll now add the learning node associated with the core sample test. Add a new Discrete Chance Node to the Influence Diagram. Place it below Amount of Oil. Name the node "Seismic Structure". Name its outcomes "None", "Open" and "Closed". Click OK to close the Node Definition dialog. Your model should look like Figure 7-9. 222 Chapter 7: Conditioning and Learning in Decision Models Syncopation Software Figure 7-9. Influence Diagram with Seismic Structure uncertainty You know from geological data the relationship between Seismic Structure and Amount of Oil. You need to add an arc from Amount of Oil to Seismic Structure. Hold down shift and click on Amount of Oil. The cursor changes to the end arc cursor ( ). Click on Seismic Structure. The new arc will initially have a black arrowhead. Note: you can also add influence arcs by clicking Model | Influence/Arc | Add (see Table 1-3), clicking on the predecessor node and then clicking on the successor node. Double-click on the arrowhead to change the type of the arc. DPL displays the Chance Event Influence Type dialog (Figure 7-10). Check Different probabilities for each conditioning event state. Make sure Different values for each conditioning event state is not checked. 223 Chapter 7: Conditioning and Learning in Decision Models Syncopation Software Figure 7-10. Chance Event Influence Type dialog Click OK. Now you are ready to enter data for Seismic Structure. Double-click on Seismic Structure. The Node Definition dialog now has separate tabs for Values and Probabilities. You don't need to enter values for this node. Click the Probabilities tab. Enter the probabilities as shown in Table 7-1. Amount of Oil Seismic Structure Probability Dry None 0.6 Open 0.3 Closed 0.1 None 0.3 Open 0.4 Closed 0.3 None 0.1 Open 0.4 Closed 0.5 Wet Soaking Table 7-1. Probability Data for seismic structure 224 Syncopation Software Chapter 7: Conditioning and Learning in Decision Models Your probability input tree should look like Figure 7-11. Figure 7-11. Node Definition dialog, Probabilities Tab for Seismic Structure Click OK. An expert geologist gave you the probability distributions for different seismic structures given different oil reservoir sizes. Had the expert given us the converse, you would have made an arc from Seismic Structure to Amount of Oil. DPL automatically performs Bayesian revision if the nodes are placed in the tree in the opposite of arc order, so you can accept the data in either form. 225 Chapter 7: Conditioning and Learning in Decision Models Syncopation Software The Influence Diagram is now complete. You now need to update the Decision Tree. You may wish to drag the splitter up to give you more room to work in the Decision Tree pane but make sure you can also see the Influence Diagram. Right-click on the Test decision node in the decision tree and select Detach from the context menu. Select the branches of Seismic Structure and delete Revenues from the get/pay drop-down in the Model | Get/Pay group. Double-click on the Test decision to bring up the Node Definition dialog. Select Asymmetric for the Alternative Grouping. Click OK. If the Wildcatter decides to conduct the Core sample test, s/he will know the Seismic Structure before making the decision about whether to drill. Therefore, the Seismic Structure chance node needs to be added to the Core Sample branch of the Test decision. Drag the Seismic Structure chance node and drop it on the blue triangle for the Core Sample branch of the Test decision. Your model should look like Figure 7-12. Figure 7-12. Decision Tree with Test Decision Added 226 Syncopation Software Chapter 7: Conditioning and Learning in Decision Models Drag the Seismic Structure node on the Core sample branch down to make some room. Drag the Test decision node (the Seismic Structure node will move as well) to the front of the decision tree. Drag and drop the Drill decision node and drop it on the blue triangle for the None branch of the Test decision. Your decision tree should now look like Figure 7-13. Figure 7-13. Decision Tree with Seismic Structure Uncertainty Added On the Core sample path through the tree, the Seismic Structure uncertainty is followed by the Drill decision and from there on the structure is the same as the top part of the tree. Rather than repeat that sequence, you'll use the Perform Subtree feature. Select the Drill decision in the tree and click Model | Tree | Subtree on the ribbon. You can also right-click the node and select Perform Subtree from the context menu. Place the semi-transparent node over the blue triangle after the Seismic Structure uncertainty. Click the left button. 227 Chapter 7: Conditioning and Learning in Decision Models Syncopation Software DPL labels the Drill decision node with an "a". This is called a Perform Target. DPL also changes the blue triangle after the seismic structure uncertainty to be a yellow decision node and labels it "a". This is called a Perform Reference. Perform Subtrees can also be headed by a chance node (i.e., the Perform Target can be a chance node). If the Perform Target is a chance node, then the Perform Reference is drawn as a chance node. Multiple Perform Subtrees are allowed in a DPL Decision Tree. Note: you can also create a Perform Subtree by Ctrl+Shift+dragging from the Perform Target to the Perform Reference. To do this for the example above, you would hold down both Ctrl and Shift and drag the Drill decision to the blue triangle after Seismic Structure. Finally, you need to add a Get/Pay expression to the tree for Test Costs and Revenues. Select the Test Costs node in the Influence Diagram pane. Drag it down to the Decision Tree pane. The cursor changes to the add get/pay cursor ( ). Drop it on the Core Sample branch of the Test decision. Use the same process as above to add Revenues as a get/pay for Oil Price. Note: as an alternative to the above steps, you could have used the Model | Get/Pay drop-down to specify the get/pay. Your decision tree should now look like Figure 7-14. 228 Syncopation Software Chapter 7: Conditioning and Learning in Decision Models Figure 7-14. Decision Tree with Test Costs Get/Pay Expression Added In the Home | Run group check Risk Profile and Initial Decisions Alternative. Check Policy Tree™. Click Home | Run | Decision Analysis. Click OK to the warning. The Policy Tree™ in Figure 7-15 shows that the Core sample test is the optimal alternative. Even including the $6 million cost of the test, the Core sample alternative has an expected value of $31 million, $4.5 million more than drilling without a test. 229 Chapter 7: Conditioning and Learning in Decision Models Syncopation Software Figure 7-15. Policy Tree™ When there is no seismic structure, the optimal policy is not to drill, since doing so has an expected value of -$31.5 million. The imperfect information about Seismic Structure is valuable because it changes the Drill decision in that scenario. Navigate to the Risk Profile Chart (labeled Initial Decision Alternatives in the Workspace Manager). See Figure 7-16. 230 Syncopation Software Chapter 7: Conditioning and Learning in Decision Models Figure 7-16. Risk Profiles for the Initial Decision Alternatives The Risk Profile shows how the seismic structure information has a risk mitigation effect. The probability of an NPV outcome of -$50 million or worse is 20% with the Core sample test and 50% without it. The slight difference between the two alternatives at the higher end of the chart (upper right) simply reflects the cost of the test, which reduces the value of the Core sample alternative slightly in the best-case scenarios. In the first implementation of the wildcat model above, the Drill decision was being made without any information. By adding the Test decision, the Drill decision becomes a real option: you have the ability but not the obligation to Drill after initially investing money in the testing decision. The reason the expected value of the model increased after you added the Test decision is due to the learning in the imperfect information contained in the Core Sample test. The Drill decision becomes an option to be exercised or not based on the results of the Core Sample outcome. 231 Chapter 7: Conditioning and Learning in Decision Models Syncopation Software 7.2 Summary of DPL Influence Arcs DPL influence arcs are color coded. Table 7-2 summarizes what each color means. Black No conditioning Blue Values conditioned Green Probabilities conditioned Light orange Both values and probabilities conditioned Table 7-2. Arc Color Meanings Arcs appear magenta when selected, so you may need to press Esc to see the actual arc color. The "from" node is known as the predecessor and the "to" node is called the successor. Because not all predecessors have states, and not all successors have probabilities, some arc types may not be available between a given pair of nodes. Even when an arc is black and there is no conditioning, there can still be dependence in the calculations if the value of the predecessor node is used in a formula in the successor node. This is the case with the arc from Oil Price to Revenues in the Learning.da model. 232 Syncopation Software Chapter 7: Conditioning and Learning in Decision Models Table 7-3 summarizes which type of arc is available between each of the node types in DPL. From (predecessor) Continuous chance Discrete chance To (successor) Continuous Discrete chance chance Black Black Black, light orange Decision Black, light orange Value Controlled Black Black, light orange Black, green, blue, light orange Black, green, blue, light orange Black Black, green, blue, light orange Decision Value Controlled Black Black Black Black, blue Black, blue Black, blue Black, blue Black, blue Black, blue Black Black, blue Black Black, blue Black Black, blue Table 7-3. Arc Types Available Between Node Types 233 Chapter 7: Conditioning and Learning in Decision Models 234 Syncopation Software Syncopation Software Chapter 8: Objective Function and Multiple Attributes 8 Objective Functions and Multiple Attributes Many decisions can be effectively modeled considering only a single measure of value, such as the net present value (NPV) of cash flows discounted at weighted average cost of capital (WACC). However, some decision problems, including many of those in the public sector, may require you to quantitatively model several measures of value, or you may find that including more than one measure is more enlightening. These value measures are referred to as attributes. Attributes can be useful even when the focus of the analysis is financial. You may find it useful to look at both free cash flow and earnings, for example. When you wish to track financial measures or other measures over time, DPL's Time Series Percentiles analysis feature lets you use one attribute for each time period to do this; see Chapter 1 of this manual. In large DPL models where multiple attributes are required, DPL's multidimensional value node feature may also be useful; see Chapter 9 of this manual. The tutorial in this chapter addresses a decision in which the attributes are not all financial. Chapters 9 and 1 use examples of slightly more complex multiple attribute models in which the focus is financial. DPL gives you the ability to model up to 1024 attributes. Some or all of these attributes can be weighted and combined in an objective function. DPL selects optimal decision alternatives based on objective function values, maximizing or minimizing as appropriate. The objective function should not be confused with a utility function for risk tolerance (see Chapter 13). The objective function combines several financial and/or other attributes into a single value, whereas a utility function typically adjusts a single financial value to account for risk aversion. 235 Chapter 8: Objective Functions and Multiple Attributes Syncopation Software 8.1 Incorporating Multiple Attributes You'll begin with a model that has only a single, economic attribute. You'll add a second attribute to this model to account for environmental considerations. Open the sample file MUA.da in the Examples folder underneath where DPL is installed (C:\Program Files (x86)\Syncopation\DPL8\Examples if the default location was used during installation). Double-click the splitter bar between the Influence Diagram and the Decision Tree to maximize the Influence Diagram. See Figure 8-1. Figure 8-1. Influence Diagram for the Single Attribute Wildcat Model Make sure Policy Tree™ is checked. Click Home | Run | Decision Analysis (or press F10). Based on the single attribute of profit, the optimal decision policy is to perform the core sample test and then drill unless the outcome is no seismic structure. See Figure 8-2. 236 Syncopation Software Chapter 8: Objective Function and Multiple Attributes Figure 8-2. Policy Tree™ for the Single Attribute Model The expected value of proceeding with the core sample test is $31 million, whereas drilling without the test has an expected value of $26.5 million. Navigate back to the Wildcat model by double-clicking its item in the Workspace Window or pressing Ctrl+F12. The oilfield in question is in a pristine wilderness area. Testing and drilling would require that some areas be cleared and that an access road be built. To take this into account in your decision, you'll add an attribute representing the amount of land that would need to be disturbed. To add a value node to the model, click Model | Node | Add (value node should be the current default). Place the node above Test Costs. Name it Land Disturbed. Click the Data tab to enter data for the new node. Click the Conditioning button. Check Drill and Test. See Figure 8-3. 237 Chapter 8: Objective Functions and Multiple Attributes Syncopation Software Figure 8-3. Conditioning for Land Disturbed Click OK. Enter data for Land Disturbed as indicated in Table 8-1. Your value input tree should look like Figure 8-4 when you are done. Test Land Disturbed Value None 5 Core Sample 12 None 0 Core Sample 10 Drill Yes No Table 8-1. Data for Land Disturbed Value Node Value 238 Syncopation Software Chapter 8: Objective Function and Multiple Attributes Figure 8-4. Node Definition Dialog for Land Disturbed Click OK. Note: don't be concerned that Drill comes before Test in the data input tree. The actual order of the nodes is dictated by the Decision Tree. DPL creates new influence arcs from Drill and Test to Land Disturbed. You may want to rearrange the nodes in your Influence Diagram for better readability. Next, you'll create a new value node for the weighting of disturbing land. Click Model | Node | Add to add another value node to the model. Place the node to the right of Land Disturbed. Name it Land Weight. Click the Data tab. Type "-0.5" as the value. Click OK. Your Influence Diagram should look something like Figure 8-5. You've made the required changes to the Influence Diagram. You'll now review the Decision Tree. 239 Chapter 8: Objective Functions and Multiple Attributes Syncopation Software Figure 8-5. Influence Diagram with New Nodes Press the Tab key to activate the Decision Tree. The Decision Tree in Figure 8-6 has three Get/Pay expressions: one for each of Test_Costs, Drilling_Costs and Revenues. At this point, all three of these expressions contribute their value to a single, implicit attribute which, if it were named, would probably be called "Profit". Figure 8-6. Decision Tree for the Single Attribute Model 240 Syncopation Software Chapter 8: Objective Function and Multiple Attributes Next, you'll add the attribute for Land. Click Model | Objective & Utility | Options. DPL displays the Objective tab of the Objective & Utility dialog. Click the Rename button to rename the first attribute "Profit". Click in the Objective function edit box. Click the Attribute button ( Click the Variable button ( Click the Attribute button ( Click Add to add a second attribute. Rename the second attribute Land. ). Select Profit. Click OK. Type a plus sign ("+"). ). Select Land_Weight. Click OK. Type an asterisk for multiplication ("*"). ). Select Land. Click OK. Check the checkbox next to Gather attribute expected values in the Policy Tree™. Now, when you run your model and produce a Policy Tree™ the rolled-back expected values of all attributes will be displayed in the tree. This option is referred to as Fat Policy™. The Objective dialog should look like Figure 8-7. 241 Chapter 8: Objective Functions and Multiple Attributes Syncopation Software Figure 8-7. Objective & Utility Dialog Click OK to close the dialog. You may wonder why you didn't use the value Land Disturbed in the objective function. Land Disturbed will contribute to the Land attribute in a Get/Pay expression in the tree. Separating attributes and values gives you greater modeling flexibility. For example, you might later have several value nodes which all contribute to Land, just as you already have three value nodes that contribute to Profit (Test Costs, Drilling Costs, and Revenues). You'll now add a Get/Pay expression for Land Disturbed and modify the other Get/Pay expressions in the Decision Tree. Double-click on the Yes branch of the Drill decision. The Get/Pay tab of the Branch Definition dialog appears. The dialog indicates that the model now has two attributes, Profit and Land, so two Get/Pay expressions must be defined. You don't need to contribute anything to Profit on this branch, so you'll just add zero as a placeholder for that attribute. 242 Chapter 8: Objective Function and Multiple Attributes Syncopation Software Type "0" (zero) in the cell for Profit (it is magenta to show it is selected). Click on the cell for Land. Click the Variable ( ) button and choose Land_Disturbed. Click OK. The dialog should look like Figure 8-8. Figure 8-8. Get/Pay tab of the Branch Definition Dialog with Two Attributes The Get/Pay expression on the Yes branch of Drill now accounts for both attributes. Note: with multiple attributes you can still continue to edit Get/Pay expressions directly from the ribbon using the Model | Get/Pay | Attribute drop-down list and the Model | Get/Pay combo box as you did previously. Using the ribbon method may be faster but only allows you to see the Get/Pay expression for a single attribute at a time. The Get/Pay tab of the Branch definition dialog allows you to see the expressions for all the attributes simultaneously. You also need to change the other Get/Pay expressions, this time adding a 0 placeholder for the Land attribute instead of the Profit attribute. 243 Chapter 8: Objective Functions and Multiple Attributes Syncopation Software Double-click on the branches of Drilling Costs. Type "0" zero in the cell for Land. Click OK. Note: When you edit a Get/Pay expression if you leave a cell blank for an attribute, DPL will fill in a zero when you click OK to close the Get/Pay Definition dialog. Try this now. Double-click on the branches of Oil Price. Repeat the above process for the Get/Pay on the Core Sample branch of the Test decision. Click OK. Note that zero is filled in for Land in the Get/Pay in the Decision Tree. You have created a two-attribute model with an objective function that linearly combines the attributes. Your tree should look like Figure 8-9. Figure 8-9. Decision Tree for Model with Two Attributes You are now ready to run your model. Remember, with the Gather attribute expected values checkbox checked DPL will produce a Fat Policy™ display of the Policy Tree™. Make sure Policy Tree™ is checked. Click Home | Run | Decision Analysis. Click OK to the warning. 244 Syncopation Software Chapter 8: Objective Function and Multiple Attributes DPL will warn you that the objective function and utility functions must be a linear combination of the attributes for sequence evaluation to work properly. If they are not, use Full Tree Enumeration as the evaluation method. Click Yes. The Policy Tree™ will look like Figure 8-10. Figure 8-10. Policy Tree™ for the Two Attribute Model with Fat Policy™ Feature The expected values of both alternatives in Figure 8-10 are lower than in the original Policy Tree™ (Figure 8-2), reflecting a "penalty" of $0.5 million per unit of land. The Core sample Test is still the preferred alternative, although the gap has narrowed. The tree in Figure 8-10 illustrates DPL's Fat Policy™ feature. At each node along the tree, three values are now shown in brackets: the expected value of the objective function followed by the expected value of each of the two attributes. For example, if the optimal policy (Core Sample) is followed and Seismic Structure is Open, the expected value of the objective function at that point is 27.6; the expected values of the Profit and Land attributes are 33.6 and 12.0, respectively. If you did not want to see the expected value of each attribute at every node, you can turn off the display of Fat Policy™ on the ribbon by unchecking the Policy | Display | Show Attribute EVs checkbox. 245 Chapter 8: Objective Functions and Multiple Attributes Syncopation Software You can also hold your mouse cursor over any node to see the expected values associated with that node more clearly in a tips box. See Figure 8-11. Figure 8-11. Policy Tree™ Displaying Fat Policy™ and Tips Finally, you will run a Rainbow Diagram on the Land Weight value. You want to know how much more penalty there would need to be associated with land disturbed for the optimal alternative to change, i.e., how much more negative Land Weight would need to be. Click Home | Sensitivity | Rainbow Diagram. The Rainbow Diagram dialog appears. Click Select. The Select Value for Rainbow dialog appears. Select Land_Weight from the Value for sensitivity drop-down list. Click OK. Type "-3.0" for From. Type "0.0" for To. Type "0.25" for Step size. The Run Rainbow Diagram dialog should look like Figure 8-12. 246 Syncopation Software Chapter 8: Objective Function and Multiple Attributes Figure 8-12. Run Rainbow Diagram Dialog Click OK. 247 Chapter 8: Objective Functions and Multiple Attributes Syncopation Software The Rainbow Diagram (Figure 8-13) shows that Land Weight would have to be less than -2 for the decision policy to change. This means the policy of testing before deciding to drill is fairly robust – there would have to be a substantial change in the attribute weighting for it to change. Figure 8-13. Rainbow Diagram on Land Weight When you change Get/Pay expressions in the Decision Tree, by default DPL expands the branch length of the node where the Get/Pay expression appears. You may not have noticed this in the model you just modified because the Get/Pay expressions were not particularly lengthy. If you do have lengthy Get/Pay expressions, you may end up with a tree that does not display easily on a single screen. You can change what is displayed for Get/Pay expressions in the Decision Tree. Double-click the "Wildcat" item in the Workspace Manager to activate the model you were just working on. Select the branches of the Oil Price node in the decision tree. Select the Indicator radio button in the Model | Get/Pay group. See Figure 8-14. 248 Syncopation Software Chapter 8: Objective Function and Multiple Attributes Figure 8-14. Get/Pay Display Options in Model |Get/Pay Group You could also change the Get/Pay display settings within the Display tab of the Branch Definition dialog (Model | Get/Pay | Options | Display). Directly on the ribbon or within the Branch Definition dialog, you can choose to display the actual get/pay (the default), display an indicator ($), or nothing. Additionally, within the Display tab of the Branch Definition dialog you can hide or display state names in the decision tree. One last display option for instances in the decision tree can be accessed by doubleclicking the node in the decision tree to open the Tree Instance tab of the Node Definition dialog. Under Display options you can show/hide, underline, and/or put a border around the node name. Your Decision Tree should now look like Figure 8-15. Figure 8-15. Decision Tree with Get/Pay Indicator 249 Chapter 8: Objective Functions and Multiple Attributes Syncopation Software 8.2 Using a Constraint Function The objective function gives you considerable flexibility in defining how much you like/dislike each attribute, but there may still be situations where you want to place an absolute limit on one or more attributes. In DPL, you do this by specifying a constraint function. A constraint function is normally an @if statement with a "halt" function for its False value. The halt function prevents DPL from continuing down that path. This serves to limit the size of the tree as well as enforce the constraint. The syntax for the @if function is @if(condition, True value, False value). Navigate to the active Model. Click in the Constraint function edit box. Click Model | Objective & Utility | Options. The Objective tab of the Objective & Utility dialog will appear. Type "@if(Land<=10,Profit+Land_Weight*Land,halt(-1e12))". DPL is case sensitive, so make sure your spelling, capitalization and punctuation are correct. When a constraint function is used, the objective function and the constraint function will normally be the same. Copy the constraint function up to the objective function edit box. See Figure 8-16. 250 Syncopation Software Chapter 8: Objective Function and Multiple Attributes Figure 8-16. Objective & Utility dialog with Constraint Function When the halt function is evaluated, DPL will stop evaluating the current decision tree path and will insert an expected value of negative 1e12. In other words, it would cost you one million trillion to violate the constraint, so the Land attribute will definitely never be greater than 10. Click OK. Notice that the new objective function is displayed in the Objective Function combo box in the Model | Objective & Utility group. In addition to the Objective & Utility dialog, you can edit the objective function using the Model | Objective & Utility | Objective Function combo box either by selecting a single attribute from the drop-down list or by typing an expression involving more than one attribute and/or value from the model into the edit box. The select attribute, value and function buttons are also available on the ribbon. Click Home | Run | Decision Analysis. Click OK to the warning. 251 Chapter 8: Objective Functions and Multiple Attributes Syncopation Software DPL will warn you that for fast sequence evaluation to work properly, the conditions under which the "halt" function is executed must depend only on attributes or constant values. Click Yes twice for the warnings. The constraint has changed the optimal alternative. If you were to conduct the Core sample test and then decide to drill, the land constraint would be violated. In the Policy Tree™, select the Seismic Structure node and drop-down the Policy | Expand split. Select Expand Subtree from the list to expand that section of the tree. Click the Zoom Full (see Table 1-1) button or press Ctrl+L. See Figure 8-17. Figure 8-17. Policy Tree™ for Model with Constraint DPL cannot expand the subtree for Seismic Structure further beyond Drilling Costs because the halt function prevented DPL from continuing to evaluate that path. If you double-click on Drilling Costs, the Policy Tree™ will not expand further. 252 Chapter 9: Multidimensional Value Nodes Syncopation Software 9 Multidimensional Value Nodes Multidimensional value nodes allow you to model series, one-dimensional arrays and two-dimensional arrays in the Influence Diagram. As with scalar value nodes, these value nodes can contain numeric constants and/or formulas. Each of these types of multidimensional value nodes will be demonstrated in the sections that follow. Regardless of its dimensionality, any value node in DPL can be linked to a DPL program or an Excel spreadsheet. Value nodes that are linked to Excel spreadsheets can be either import nodes that are calculated by Excel and returned to DPL, or export nodes whose data DPL sends to Excel for use in Excel's recalculation. This chapter covers three situations: a one-dimensional array that is an import node; a one-dimensional series that is an export node; and a twodimensional array that is an export node. This chapter assumes that you are familiar with building basic DPL models, linking DPL models to Excel, and naming ranges in Excel. If you are new to DPL and/or naming ranges in Excel, you may wish to review Chapters 2 and 3 of this manual and/or your Excel documentation, before proceeding with this chapter. If you are building cash flow models and wish to analyze the uncertainties associated with your cash flows over time, you may wish to work through Chapter 9.1.1 of this chapter (and the other sections, as needed) and then proceed to Chapter 1, Time Series Percentiles. 253 Chapter 9: Multidimensional Value Node Syncopation Software 9.1 Creating and Linking a OneDimensionalValue Node This section contains brief tutorials on setting up one-dimensional Excellinked array and series value nodes in DPL. One-dimensional Excel-linked arrays and series can be either import or export nodes. The tutorial will look at an example of a one-dimensional array import node, a series import node and a series export node. 9.1.1 A One-Dimensional Import Node You will begin by examining a model of a decision about a gas pipeline investment. Select File | Open. Select Multidimensional Value.da and click Open. You should see the Energy Model as depicted in Figure 9-1. Navigate to the Examples folder where you installed DPL. The default location path is C:\Program Files (x86)\Syncopation\DPL8\Examples. 254 Chapter 9: Multidimensional Value Nodes Syncopation Software Figure 9-1. Multidimensional Value Model This model contains a few features that may be unfamiliar to you, depending on your experience with DPL. You don't need to understand all the logic in the DPL model or the linked Excel cash flow model in order to complete this tutorial, but you should note the following components of the model. If any of these components are unfamiliar, you may wish to review Chapter 2, 3, 4 and/or 6 of this manual. Specifically, this model contains the following. • Several chance nodes, some of which are conditioned by other chance nodes (see Chapters 2 and 3). Not all the nodes are linked to the Excel cash flow model. • Several value nodes which serve various purposes: import nodes, export nodes, and parameters (p and q) that can be used for sensitivity analysis (see Chapter 3). • A strategy table comprising two decisions: pipeline capacity, and whether to expand the pipeline project to a second, riskier market (see Chapter 4). • Asymmetry -- for example, the "Market 2 Political Stability Future" node only matters if the project is expanded to Market 2 (see Chapter 6). 255 Chapter 9: Multidimensional Value Node Syncopation Software Right now the model has two Excel-linked import nodes: Upfront_NPV and Total_NPV. You will look at the Excel links and add another import node: a value node for the 10-year annual cash flow. Launch Excel. Select the Assumptions sheet (Figure 9-2). Open the spreadsheet called Multidimensional Value.xls. (Navigate to the Examples folder where you installed DPL. The default location path is C:\Program Files (x86)\Syncopation\DPL8\Examples.) Figure 9-2. Assumptions Sheet of Multidimensional Value.xls 256 Chapter 9: Multidimensional Value Nodes Syncopation Software The Assumptions sheet contains various market, price, and cost growth assumptions; numerous other parameters; and several "switch" cells for decisions and uncertainties. Some cells are linked to DPL export nodes and the color coding indicates whether they are linked to value, decision, or chance nodes. You can also see the two cells linked to DPL import nodes: Upfront_NPV and Total_NPV. You will run the model to generate results for comparison later on. Switch to DPL. Click the Home | Run | Decision Analysis icon or press F10. The model may take a couple of minutes to run. Examine the Risk Profile and Policy Tree™ results. In the Home | Run group, Fast Sequence evaluation should be the default indicated in the Decision Analysis icon and Risk Profile, Init Dec Alts, and Policy Tree™ should be selected. You will now examine a named range in Excel that contains 10 cells. It will be used for the value node you are going to create in DPL corresponding to the annual cash flow. Switch back to Excel. In the Assumptions sheet in Excel, select the range E42:N42. This is the first 10 years of annual cash flows in the model. It is labeled Total Annual Cash Flow (Time Series) in the Results section. Note in the Name combo box (located at the left end of the Excel edit bar) that it says Ten_year_CF. This is the name of this range. See Figure 9-3. 257 Chapter 9: Multidimensional Value Node Syncopation Software Figure 9-3. Excel Cash Flow Range Switch back to DPL. Activate the model: double-click on its item in the Workspace Manager or Ctrl+F12. To add a new value node to the model, click Model | Links | Add. Excel calculation linked should be default add link type (see Table 1-2). If it isn't use the drop-down to select it. In the Range Names dialog, select Ten_year_CF and check the Create arrays based on range size checkbox. Figure 9-4. 258 Chapter 9: Multidimensional Value Nodes Syncopation Software Figure 9-4. Range Name Dialog for Ten Year CF for 1 Dimensional Array Click OK. DPL places the node off to right. You may move it to near the Market Size 1 node if you'd like. Double-click the new node to examine its definition. Switch to the General tab. Note that DPL has created a onedimensional array or series. Change the name to Ten Year Cash Flow. 259 Chapter 9: Multidimensional Value Node Syncopation Software Figure 9-5. Node Definition Dialog for 1 Dimensional Array Switch to the Data tab of the Node Definition dialog. Note that DPL has created a series by setting the Series interval entry to be true. And it has created a single interval which goes from 0 to 9. So DPL has created a single interval series with ten elements. See Figure 9-6. This matches what DPL found in Excel when it examined the named ranges, e.g., that Ten_year_CF is a ten cell named range with formulas. DPL will create a series import node if it finds formulas in the named range. It will create an array export node if it finds numbers in the named range. You will learn more about series interval entry in the next section. 260 Chapter 9: Multidimensional Value Nodes Syncopation Software Figure 9-6. Data Tab for Single Interval Series Switch to the Links tab of the Node Definition dialog Note that DPL has linked the node to Ten_year_CF. See Figure 9-7. Figure 9-7. Node Definition Dialog with Linked Range Name 261 Chapter 9: Multidimensional Value Node Syncopation Software DPL tells you that the linked node is an import node. As mentioned above, DPL created an import because it found formulas in the named range and hence did not initialize the node with any data on the Data tab. Click OK. Your model should now look like Figure 9-8. You have created a 1 dimensional (1 x 10) import series value node that is linked to a 10-cell range in Excel. You can see in Figure 9-8 that the value node Ten Year Cash Flow has a vector arrow on it to indicate that it is a 1-dimensional node rather than a scalar value. Figure 9-8. Model with 1 x 10 Value Node Note when linking a one dimensional value node to a named range in Excel you may use either an array or a series node. DPL automatically creates a series node when it finds formulas in the range. But if you were creating the node and linking it using the Node Definition dialog you can use either type to link the node to Excel. See Figure 9-9 for an example of what the Node Definition Data tab looks like for a one dimensional import array. 262 Chapter 9: Multidimensional Value Nodes Syncopation Software Figure 9-9. Data Tab for One-Dimensional Import Node As your model is now set up, the Ten Year Cash Flow value node will import ten years of cash flow values from the Excel spreadsheet each time the model is run. However, further set up of the model is needed before you see these values in analysis results. At this point you might want to analyze the expected values and ranges of uncertainty around these annual cash flows. To do this, you need to add 10 attributes to your model to correspond to the annual cash flows. Defining attributes in your model allows you to run Time Series Percentiles to visualize how the uncertainty in the cash flows evolves over time. Do File | Save as to save the Workspace with a new name. If you would like to run a Time Series Percentiles now, skip to Chapter 1. If you would rather learn more about multidimensional value nodes first, continue to the next tutorial. 9.1.2 A One-Dimensional Series Export Node This tutorial provides an example of a one-dimensional value node containing a series. A series in DPL is a one-dimensional vector of values that may depend on the states of events, may use formulas, or may just contain constants. Series are different from one-dimensional arrays because they are defined using intervals and/or relative subscripts as will 263 Chapter 9: Multidimensional Value Node Syncopation Software be demonstrated in this tutorial. The ability to use relative subscripts in a series makes it easy to define elements of the series in terms of other elements, e.g., sales in time period t is equal to sales in time period t – 1 times a growth factor. Either continue with the example you saved in Section 9.1.1 above, or if you closed them re-open Multidimensional Value.da and Multidimensional Value.xls. Note: If you completed the Time Series Percentiles tutorial in Chapter 1 and saved your model, you may use that model for the remaining tutorials in this chapter, however, your model will look slightly different from the figures in the following sections. In Excel, select the Assumptions tab of the spreadsheet and look at the Basic Parameters and Annual Growth Assumptions sections near the top. See Figure 9-10. Figure 9-10. Assumptions Sheet, Parameters and Growth Assumptions 264 Chapter 9: Multidimensional Value Nodes Syncopation Software Some of the parameters (the ones shaded in blue) are already linked to value nodes in DPL. The parameters Market 1 Growth Model Choice and Market 2 Growth Model choice are linked, so these values (which are currently set to 3) are sent from the DPL model. If these values are set to 2, a simple annual growth rate (the value in cells C9 and/or C10) is used for the market size growth. If they are set to 3, a different growth rate may be used for each year. These rates are currently set in the block of cells that begins with cell E18. The growth model parameters can be set differently by year and for each market. In this section of the tutorial, you will look at the way the simple annual growth rates are set up in Excel, and change the DPL model so that this logic is done in DPL instead, using a series in a one-dimensional value node. Examine the formulas for Market 1 Size: Option 2 and Market 2 Size: Option 2 (these begin in cells E15 and E16). You'll see that the market sizes are initialized using cells that are also linked to value nodes in DPL: Market_1_Size and Market_2_Size. After the first year, the values Mkt_1_Growth and Mkt_2_Growth, which are not currently linked to DPL value nodes, are used to grow the market each year. In financial and cash flow models, as well as in other types of models, you will often see growth trends represented in series such as this one. As this model is currently set up, the series is defined in Excel rather than in DPL. However, in some situations, you might want the series values to be defined in DPL so that they can depend on other values in your DPL model or so that you can more easily do sensitivity analysis on them. You will now see how series like this one can be defined quickly and easily in a one-dimensional value node in DPL. Switch to DPL. Select Model | Links | Add. Select Mkt_1_Growth from the list. See Figure 9-11. Click OK. 265 Chapter 9: Multidimensional Value Node Syncopation Software Figure 9-11. Range Names Dialog DPL adds the value node, names it Mkt 1 Growth, and initializes it with 0.05, which is the growth rate (5%) from the spreadsheet. The node is now an export node whose value will be sent to Excel. If you wish to use a different value for Mkt 1 Growth, you would now change it in DPL instead of in Excel since the value in DPL will be sent to Excel and overwrite any change made there. You will use this value in the series you are about to create. Click Model | Node | Add to add a new value node. Place the node near the Mkt 1 Growth node you just created. In the General tab, name the new node Mkt 1 All Years. Switch to the Data tab. Select 1 dimensional array (N values) or series in the Dimensions section. 266 Chapter 9: Multidimensional Value Nodes Syncopation Software Check the Series interval entry checkbox. Change the number of intervals to 2. See Figure 9-12. Figure 9-12. Node Definition Data for a Series with 2 Intervals Series are defined using intervals. Your series has two intervals: you will set it up so that the first interval is for the first year, and the second is for every year thereafter. The intervals in a series do not have to start at 0, as DPL arrays do. Your series will use the cash flow years for the subscripts for clearer illustration. You will also see how to use a relative subscript in this example. In the From cell for interval 0, type "2014". In the To cell for interval 1, type "2038". Note: you must specify the To boundary for the last interval. Click in the Expression cell for interval 0. Click the Select Variable ( In the From cell for interval 1, type "2015". Note that DPL fills in the "To" cell for the preceding interval so that the interval subscripts are consecutive. ) button. Double-click on Market_1_Size in the list. 267 Chapter 9: Multidimensional Value Node Syncopation Software Click in the Expression cell for interval 1. Click the Select Variable ( ) button again. Double-click on Mkt_1_All_Years in the list. In the Expression cell for interval 1, edit the expression to read "Mkt_1_All_Years[$ - 1]*(1+Mkt_1_Growth)". Note: you can use the Select Variable ( ) button again if you wish, to bring in the Mkt_1_Growth variable. The dialog should now look like Figure 9-13. Figure 9-13. Node Definition Data for Mkt 1 All Years Node Take a moment to understand how this series is defined. The series definition refers to itself using the relative subscript symbol "$". The term "$ - 1" indicates the previous element in the series. (In DPL, series are the only type of expression in which you can use relative subscripts. See Chapter 15 of this manual for more information.) This series is now defined to produce exactly the same result that the Excel formulas for Market 1 Size (option 2) are producing. The series is indexed according to the years in the cash flow model: 2014 through 2038. This was done for clarity of definition. For purposes of the analysis, you could also have indexed the series from 0 to 24 or from any other integer to that integer plus 24. DPL will only export the actual values of the series expressions to Excel. 268 Chapter 9: Multidimensional Value Nodes Syncopation Software Now you need to link this node to the appropriate range in Excel so that DPL can export values. There is already a named range in Excel to do this. If you'd like to see the named range, switch back to Excel. Select cells E15 through AC15. Look in the Name combo box in Excel and note it says Mkt_1_All_Years. (Note: there is no requirement that you name this range exactly the same as the value node in Excel. Any range name acceptable to Excel is fine.) Switch back to DPL. Select Mkt_1_All_Years from the list. You can see that it has a "Count", or dimension of 25 cells. Click Select. Click the Links tab of the Node Definition dialog. Under Calculation Links, select Microsoft Excel. Click the Cell Names button. In the Range Names dialog, check the checkbox for Show ranges with formulas. (The range you defined in Excel currently has a formula in it.) Click Yes for the warning. DPL is telling you that you have just defined an export node that will overwrite a formula in Excel. The Links tab of the Node Definition dialog should now look like Figure 9-14. 269 Chapter 9: Multidimensional Value Node Syncopation Software Figure 9-14. Node Definition Links for Mkt 1 All Years Node Click OK. Create Influence arcs from Mkt 1 Growth and Mkt 1 All Years to Total NPV. The Mkt 1 All Years node is now fully defined and linked to Excel. Note that the Excel formulas for the Mkt_1_All_Years range now will not be used because the values are being determined in DPL and exported to Excel instead. You can tell DPL to reset the Excel cells back to their original values/formulas after a model run. In general, it is a good practice to do this. If you are overwriting cells with formulas as in this case, it is a particularly good idea to do this to maintain the spreadsheet with its initial functionality. Go to Model | Links | Options | Settings. Click OK. Click Home | Run | Decision Analysis to run the model. Check Reset Excel values/formulas after run, if it is not already checked. Make sure Fast sequence evaluation is the default run type and Risk Profile, Init Dec Alts, and Policy Tree™ are selected. 270 Chapter 9: Multidimensional Value Nodes Syncopation Software After a few minutes, DPL will return precisely the same decision analysis results that you obtained at the beginning of Section 9.1.1. Check the Session Log to compare results if you like. This tutorial illustrated how series can be used in DPL's 1-dimensional value nodes to give you more control and more power in building models. In some situations, you might want to develop more complex series using expressions that refer to other value nodes in your DPL model, or you might not want to have to switch to Excel every time you want to change an assumption or a formula. In this example, you needed to create the node and link it via the Node Definition dialog because you wanted to create an export node and the range you were linking to in Excel contained formulas. Had you used Model | Links | Add, the Range Names dialog would have assumed you wanted to create an import node. 9.2 Creating and Linking a TwoDimensional Value Node In the sections above, you modified a DPL model to include two new value nodes: a one-dimensional import node, and a one-dimensional export node. In this section you will define a two-dimensional array that is an export node and link it to Excel. The process for defining two-dimensional arrays is very similar to the steps you used to define the one-dimensional arrays. Either continue with the example you saved in Section 9.1.1 above, or if you closed them re-open Multidimensional Value.da and Multidimensional Value.xls. In Excel, select the Assumptions sheet. Press F5 (the Go To button in Excel). Scroll down to the Yr_By_Yr_Growth range and select it. See Figure 9-15. 271 Chapter 9: Multidimensional Value Node Syncopation Software Figure 9-15. Excel Go To Dialog Click OK to see where this range is. This two-dimensional range contains values that represent growth rates for the two energy markets. The Excel spreadsheet uses these if the market growth model choice is set to 3. This option allows the user to enter a separate market growth rate in each year for each of the two markets. Switch back to DPL without changing anything in Excel. In the Range Names dialog, click the Create arrays based on range size checkbox and select Yr_by_Yr_Growth. See Figure 9-16. DPL places the node to the right in the Influence Diagram. Move it if you’d like. Click Model | Links | Add to add a new Excel Calculation-Linked value node to the model. 272 Chapter 9: Multidimensional Value Nodes Syncopation Software Figure 9-16. Range Name Dialog for 2 Dimensional Array Double-click the new node to edit it. Switch the General tab of the Node Definition dialog, name the node Yearly Growth. Note that DPL has created it as a 2 dimensional array. See Figure 9-17. 273 Chapter 9: Multidimensional Value Node Syncopation Software Figure 9-17. Node Definition Dialog for 2 Dimensional Array Switch to the Data tab of the Node Definition dialog Note DPL has created a 2 by 25 array and filled in the data from Excel. See Figure 9-18. Figure 9-18. Data Tab for 2-Dimensional Array with Values 274 Chapter 9: Multidimensional Value Nodes Syncopation Software Switch to the Links tab DPL has linked the node to the Yr_By_Yr_Growth range. Click click OK. Your model should now look like Figure 9-19. Yearly Growth is a value node with perpendicular vector arrows on it to indicate that it is a 2dimensional node. Figure 9-19. Model with 2 x 25 Value Node Create an Influence arc from Yearly Growth to Total NPV. Your model is set up so that DPL exports the 50 values in the Yearly Growth node to Excel. You will now run the model. Make sure Risk Profile, Init Dec Alts, and Policy Tree™ are selected. Click Home | Run | Decision Analysis or press F10. Note: unless you have changed some of the input data, your results should be the same as those from model runs in earlier sections. 275 Chapter 9: Multidimensional Value Node Syncopation Software This tutorial has shown you how to set up and link a two-dimensional value node in DPL. In this example, the values in the node were constants representing growth rates. However, each element of the node could have been set up as any expression using DPL variables or functions. Chapter 1 of this manual includes more information on how to set up Get/Pay expressions in DPL when an array or series is used to define the Get/Pay, as well as an example using DPL's Time Series Percentiles feature in conjunction with a one-dimensional value node. 276 Syncopation Software Chapter 10: Time Series Percentiles and Multiple Metrics 10 Time Series Percentiles and Multiple Metrics Time Series Percentiles are useful for understanding how the range of uncertainty in performance metrics, such as gross sales or net profits, evolves over time. This chapter discusses how to run Time Series Percentiles, continuing the example from Section 9.1.1 which uses a 1dimensional value node that has been previously defined and linked to Excel. Time Series Percentiles require the use of DPL's multiple attributes feature, as described in Chapter 8 of this manual. This chapter also covers how to quickly generate Risk Profiles for multiple attributes simultaneously as well as more information on how to use the Get/Pay tab of the Branch Definition dialog with multiple attributes. Note that these features can be used in any multi-attribute DPL model, not just models in which the attributes correspond to metrics over time. 10.1 Time Series Percentiles Select File | Open. Select Time Series Percentiles.da. Navigate to the Examples folder underneath where you installed DPL. If you used the default location, the path is C:\Program Files (x86)\Syncopation\DPL8\Examples. DPL opens the Workspace as shown in Figure 10-1. 277 Chapter 10: Time Series Percentiles and Multiple Metrics Syncopation Software Figure 10-1. Energy Case Model Workspace This model is the same as the model that is used and modified in Section 9.1.1. Alternatively, if you've already worked through that section, you may use the model you saved then. You also need to open the Excel model you saved, or alternatively: Launch Excel. Open the spreadsheet called Time Series Percentiles.xls. (Navigate to the Examples folder underneath where you installed DPL. If you used the default location, the path is C:\Program Files (x86)\Syncopation\DPL8\Examples.) The first step to run Time Series Percentiles is to create a value node for the metrics you are interested in seeing over time. This was done in Section 9.1.1. The Ten Year Cash Flow value node is already linked to the spreadsheet and set up to import 10 years of cash flow results into DPL. To review this, do the following: Switch back to DPL. Double-click on the Ten Year Cash Flow value node to open it. 278 Syncopation Software Chapter 10: Time Series Percentiles and Multiple Metrics Click on the Data tab. This node is a single interval, 10 element series with with no data in it. Click on the Links tab. This node (like the other linked nodes in the model) is linked to Time Series Percentiles.xls. It is an import node since it has no data. See Figure 10-2. Figure 10-2. Links for Ten Year Cash Flow Node Click Cancel. Time Series Percentiles use DPL's attributes interface. The next step to run Time Series Percentiles is to define attributes for each time period variable. You will need 10 additional attributes, one for each year. For more information on attributes, please see Chapter 8. Click on Model | Objective & Utility | Options, (i.e., the dialog box launcher for Model | Objective & Utility). The Objective tab of the Objective & Utility dialog appears as shown in Figure 10-3. 279 Chapter 10: Time Series Percentiles and Multiple Metrics Syncopation Software Figure 10-3. Objective & Utility dialog Currently there is only one attribute defined in the model. It is called NPV. When there is only one attribute defined in the model and no explicit objective function has been defined, DPL maximizes the Get/Pay expressions specified in the decision tree. Therefore, the objective function for the model is to maximize NPV. In the model as it currently stands, there are two Get/Pay expressions: Upfront_NPV (which applies if the Proceed decision is No), and Total_NPV (which applies if the Proceed decision is Yes). So DPL is maximizing Upfront_NPV and Total_NPV depending upon the path through the tree. You will now add 10 attributes to the model for the cash flow information you are importing from Excel. Click Add to create another attribute. DPL names it Attribute2 by default. See Figure 10-4. 280 Syncopation Software Chapter 10: Time Series Percentiles and Multiple Metrics Figure 10-4. Objective & Utility dialog with Attribute2 Added DPL automatically puts you in edit mode. Type "CF_2014" to rename Attribute2. Press Enter. Click Add eight more times to create attributes named CF_2016, etc., until you have created ten new attributes altogether, the last of which will be named "CF_2023". The Objective & Utility dialog should look like Figure 10-5. Click Add again. DPL will add an attribute named CF_2015, which is what you want. 281 Chapter 10: Time Series Percentiles and Multiple Metrics Syncopation Software Figure 10-5. Objective & Utility dialog with Ten New Attributes Note: DPL will automatically increment from the previous attribute name any name that ends with a number when you add an attribute. This makes it easy to add sequential attributes as in this example. If you did not want a sequentially named attribute, you can always rename it. Now that there are multiple attributes defined in the model, you need to tell DPL explicitly what the objective function is. If you do not specify an objective function when there are multiple attributes defined, DPL will maximize the sum of the attributes by default. You do not need the ten new attributes for the objective function. The objective function is still simply NPV. Click in the Objective function edit box. Type "NPV" or use the select attribute button ( the objective function. 282 ) to select NPV for Syncopation Software Chapter 10: Time Series Percentiles and Multiple Metrics The maximize radio button is already selected. DPL will now maximize NPV for the objective function. The Objective & Utility dialog should look like Figure 10-6. Figure 10-6. Objective & Utility dialog after Edits Have Been Made Click OK. The last step to set up Time Series Percentiles is to change the Get/Pay expressions in the decision tree to tell DPL which values should be used for each attribute. For more information on specifying Get/Pay expressions for multiple attributes, see Chapter 8, as well as the last section of this chapter. Double-click the branches of the CapEx node in the Decision Tree. The Get/Pay tab of the Branch Definition dialog appears as shown in Figure 10-7. 283 Chapter 10: Time Series Percentiles and Multiple Metrics Syncopation Software Figure 10-7. Get/Pay tab of Branch Definition Dialog Now that there are multiple attributes defined in the model, DPL provides room in the Get/Pay expression for separate expressions for each attribute. When you have multiple attributes in a model, you must specify a value for each of them in every Get/Pay expression (or use zero as a placeholder). The Get/Pay expression as it is currently defined only has a value (Total_NPV) for the first attribute (called NPV). If you had multiple value nodes defined in your model for each attribute, you would need to use them in each separate expression in each of the ten get/pay rows in this dialog. However, your model is set up so that these ten attributes are determined by a single, 1 x 10 value node. Click in the expression cell for the CF_2014 attribute (the second cell). Click the variable button ( ). Select Ten_Year_Cash_Flow from the list of variables. Click OK to return to the Branch Definition dialog. 284 Syncopation Software Chapter 10: Time Series Percentiles and Multiple Metrics The Get/Pay for CF_2014 is now defined as Ten_Year_Cash_Flow, but as you know, this variable is a 10-element series. You want the first element (Ten_Year_Cash_Flow[0]) to be used for the attribute CF_2014. You can have DPL do this for you and set up the expressions for the remaining attributes with one button click. Click the Fill Down button ( ). DPL initializes the second attribute and the remaining nine attributes to be the elements of the Ten_Year_Cash_Flow value node: Ten_Year_Cash_Flow[0] through Ten_Year_Cash_Flow[9]. The dialog should now look like Figure 10-8. Figure 10-8. Get/Pay tab of Branch Definition Dialog with New Get/Pay Expressions 285 Chapter 10: Time Series Percentiles and Multiple Metrics Syncopation Software More information is given in Section 10.3 on how to use the Fill Down button. Click OK. You can see in the Decision Tree pane that DPL has added the ten new attributes to the Get/Pay expression on the CapEx node of the decision tree. This causes the branches of the node to be quite long. Select the branches of the CapEx node in the Decision Tree pane. In the Model | Get/Pay group, select the Indicator radio button. (Note that you could alternatively choose to show nothing by selecting the Hide radio button.) The Get/Pay expression is no longer displayed on the CapEx node. Next you will repeat this process for the other tree branch that has a Get/Pay expression: the No branch of the Proceed decision. First, select the No branch of the Proceed decision node in the decision tree, and again, select the Indicator radio button in the Model | Get/Pay group. This will prevent the new actual Get/Pay expressions from being shown so you won't have to reformat the tree later. Repeat the above process to add the Ten_Year_Cash_Flow value node to the Get/Pay expression defined for the No branch of the Proceed decision. Note that the value for the NPV attribute for this branch is Upfront_NPV. See Figure 10-9. 286 Syncopation Software Chapter 10: Time Series Percentiles and Multiple Metrics Figure 10-9. Get/Paytab of Branch Definition Dialog for Proceed = No, with New Get/Pay Expressions Note that the same value node is being used for the ten years of cash flow in both Get/Pay expressions. This works because the logic is set up in the Excel spreadsheet so that these ten annual cash flow values reflect whether the Proceed decision is Yes or No. The model was set up this way for ease of illustration. In other situations, the spreadsheet might have been set up differently, so that an entirely different value node (or group of value nodes) would be used for each Get/Pay in the decision tree. Note: you can copy and paste Get/Pay expressions from one branch to another. There are two ways to this. If you wish to copy the entire Get/Pay expression for all attributes (or if it is a single attribute model), select the branch whose Get/Pay you'd like to copy and press Ctrl+C and then select the branch where you would like to paste the Get/Pay and press Ctrl+V. If you'd like to copy a subset of the Get/Pay expression you can do this via the Get/Pay tab of the Branch Definition dialog. Double-click the branch for which you'd like to copy a portion of the Get/Pay, select a range of cells in the Get/Pay Definition dialog and press Ctrl+C. Then double-click the 287 Chapter 10: Time Series Percentiles and Multiple Metrics Syncopation Software branches where you wish to paste the Get/Pay expressions, select the appropriate cell in the Branch Definition dialog and press Ctrl+V. You have now specified a value for each of the model attributes on both branches of the tree that require a Get/Pay expression. You are ready to run Time Series Percentiles. If you wish, save your Workspace under a new name of your choice. (This is not essential, but you may find it useful for future reference, if you intend to use Time Series Percentiles frequently.) Click Home | Sensitivity | Time Series. The Time Series Percentiles dialog appears. In the Time Series Percentile dialog, you need to tell DPL which is the first and last attribute to include in the run. This is done by setting the From and To drop-down lists. In the From: drop-down list, select CF_2014. Type "2014" into the Initial time period edit box. The dialog should now look like Figure 10-10. Figure 10-10. Time Series Percentiles Dialog After Edits 288 Syncopation Software Chapter 10: Time Series Percentiles and Multiple Metrics The first time period in the Time Series Percentiles chart is labeled using the Initial time period. Time periods are labeled sequentially after that. DPL displays the current evaluation method and the number of intervals in the Run settings section. In the Percentiles section you can specify the percentiles you would like included in the chart. You may edit the existing three to change them to a different percentile, type a number in a slot that says "(none)" to add one or select a number and press Clear to remove it. If you'd like two percentiles displayed as a range bar, select a percentile and use the Type button to toggle which type it is. You must specify both a range min and range max to display a range bar. You may also set the type by rightmouse clicking the Percentiles box and using the context menu. Click the Change button to see the Run Options dialog. See Figure 10-11. Figure 10-11. Run Options Dialog 289 Chapter 10: Time Series Percentiles and Multiple Metrics Syncopation Software Risk Profiles underlie the Time Series Percentiles output. In the Run Options dialog, you can change the number of intervals to be used to accumulate Risk Profiles for the Time Series Percentiles chart. This setting is the number of "bins" into which the outcome values will be grouped. The accuracy of the percentiles depends on the number of intervals setting. The more intervals you use, the greater the accuracy, however, more intervals requires more memory and will have an impact on model runtime. Usually, 500 intervals should suffice. If you have extremely long tails in your distributions, you may wish to increase the number. Note the number of intervals setting is also used for Risk Profiles in a Decision Analysis run. If you change the setting here, your new setting will also be used the next time you run a Decision Analysis and generate a Risk Profile. If you’d like to change these settings prior to a Decision Analysis run you can access the Run Options dialog via Home | Run | Options. Also see Section 3.2 for information on Risk Profiles and the Number of intervals setting. Make sure the Number of intervals is 500. Click OK twice to run a Time Series Percentiles chart. Note: adding attributes to a model does have a performance impact. After a minute or two, DPL produces the Time Series Percentiles Chart shown in Figure 10-12. 290 Syncopation Software Chapter 10: Time Series Percentiles and Multiple Metrics Figure 10-12. Time Series Percentiles Chart DPL displays the 10th, 50th and 90th percentiles (or the percentiles/percentile ranges you specified) plus the expected value of the time series variable for each time period. In this case, the time series variable is annual cash flow, so Figure 10-12 displays the three percentiles and expected value of cash flow in each of the time periods. The 10th percentile is the value such that there is a ten percent chance that the time series variable is less than that amount. The 90th percentile is the value such that there is a ten percent chance that the time series variable is greater than that amount. The 50th percentile is the value such that there is an equal chance that the time series variable is less than or greater than that amount. The expected value series is the expected value of the variable for the time period. Finally, you can change several display options to tailor the appearance of the Time Series Percentiles chart to suit your needs. With the Time Series Percentiles chart still active uncheck Error Bars in Chart | Format | Display. In Chart | Series | Lines/Markers, make sure Lines and Dashed are checked. The chart will look like Figure 10-13. 291 Chapter 10: Time Series Percentiles and Multiple Metrics Syncopation Software Figure 10-13. Revised Time Series Percentiles Chart The revised chart connects the points for each series (10th percentile, etc.) over time. Technically, how the uncertainty in the attributes evolves between time periods cannot be derived from this output. That is, the percentiles for points in time in between the discrete time periods are not known. However, you may find this depiction of the percentiles more useful than the error bar depiction for communication purposes. Also note that within the Chart | Format tab, you can change the Titles, Subtitles, Axis labels, Legend, marker/line color, and background display of the Time Series Percentiles chart. To format the font within the chart select the font and use the commands in the View | Font group. Try this if you like. See Figure 10-14 for an example of what the Time Series Percentile dialog looks like when you specify that two of the percentiles as the minimum and maximum of a range bar. 292 Syncopation Software Chapter 10: Time Series Percentiles and Multiple Metrics Figure 10-14. Time Series Percentiles Dialog for Range Bar The settings in Figure 10-14 produce the Time Series Percentile Chart below in Figure 10-15. You can see that the 95th percentile of the cash flows is greater than the 90th while in most time periods the 5th percentile is the same as the 10th. As specified, the 10th and 90th percentiles are displayed as the minimum and maximum of the range bar. 293 Chapter 10: Time Series Percentiles and Multiple Metrics Syncopation Software Figure 10-15. Time Series Percentiles Chart with Range Bar The Time Series Percentiles Chart does not provide all the information you might need about the full risk profile for each of the ten attributes (cash flows); it gives you up to seven percentiles plus the expected values. However, more information about the uncertainty in each attribute is available by generating Risk Profiles from a Decision Analysis run. You will examine this feature in the next section. 294 Syncopation Software Chapter 10: Time Series Percentiles and Multiple Metrics 10.2 Risk Profiles with Multiple Attributes In the previous section, you set up a Time Series Percentiles analysis to look at ten attributes (years of cash flow) in the energy model. In some situations, you might want more detailed information about the full risk profile (range of uncertainty) for one or more attributes. You will continue the example from the previous section to see how easily this can be done with one run of DPL. Activate the "Energy Model" in the Model Window. Use the Risk Profile drop-down list (just below the Risk Profile checkbox) to select Objective Function and All Attributes ("Obj. Fn. & All Atts."). This will generate the full Risk Profile for the objective function and every attribute in your model. See Figure 10-16. Click Home | Run | Decision Analysis or press F10. In the Home | Run group, make sure that Risk Profile and Policy Tree are the only selected outputs. Click Yes to the warning. Figure 10-16. Generating Risk Profiles for All Attributes The model may take a few minutes to run. As mentioned earlier, adding attributes to a model does have a performance impact, however, requesting a single Risk Profile vs. multiple Risk Profiles does not. When it completes, you will see Risk Profile charts and datasets for the objective function plus all the attributes in the Workspace Manager, as in Figure 10-17. 295 Chapter 10: Time Series Percentiles and Multiple Metrics Syncopation Software Figure 10-17. Workspace Manager with All Risk Profiles Double-click on the Risk Profile dataset for CF_2014 to open it. You can see that there is a substantial amount of uncertainty regarding the cash flow in 2014; due to the initial investments required, the net cash flow will probably be negative. See Figure 10-18. 296 Syncopation Software Chapter 10: Time Series Percentiles and Multiple Metrics Figure 10-18. Risk Profile for CF_2014 If you want to see detailed statistics on the probability distribution for cash flows in 2014, you can click Data | Distribution | Statistics. For comparison purposes, you might want to view multiple attributes on one Risk Profile chart. With the CF_2014 chart still active, click Chart | Series | Modify. You can display up to 8 Risk Profile datasets on a single Risk Profile chart. Leave the first series set to CF_2014. Use the drop-down lists to fill in CF_2015 and CF_2016 for Series 2 and Series 3 in the Modify Data dialog. See Figure 10-19. 297 Chapter 10: Time Series Percentiles and Multiple Metrics Syncopation Software Figure 10-19. Modify Data dialog to Display Multiple Risk Profiles Press Ok. In the Chart | Format | Legend group, check the checkbox next to Show. You can use the other checkboxes and drop-down list within the group to format the placement and display of the legend. The Risk Profile should look something like Figure 10-20. 298 Syncopation Software Chapter 10: Time Series Percentiles and Multiple Metrics Figure 10-20. Risk Profiles for 2008-2010 Cash Flows You can see from the Risk Profiles that the probability distributions for 2015 and 2016 cash flow are very similar; each cash flow has about a 30% chance of being zero, and neither will be more than 60. The probability distribution for 2014 cash flow is quite different since this is the year when the initial investments are made. As you saw earlier, the net cash flow in this year will very likely be negative, and could even be less than negative 50. You can close your Workspace without saving changes; it is not needed for the last section of this chapter. 299 Chapter 10: Time Series Percentiles and Multiple Metrics Syncopation Software 10.3 Using Multidimensional Value Nodes in Get/Pay Expressions As discussed in Chapter 8 and earlier in this chapter, any time you use DPL's multiple attributes feature, whether to set up Time Series Percentiles or to track multiple attributes for the objective function, you must set up your Get/Pay expressions to match the attributes you have defined. On any decision tree branch that has a get/pay, you need to have exactly as many Get/Pay expressions as the number of attributes you have defined. If you use multidimensional value nodes (arrays or series) in a multiple attribute model, you may find that you need to refer to elements of these value nodes in your Get/Pay expressions. This section provides a brief discussion of how to do this using the Get/Pay tab of the Branch Definition dialog and its Fill Down ( Time Series Percentiles. ) button, which you also used earlier to set up Assume that you have set up a project evaluation model in DPL with six attributes. The first attribute corresponds to the objective function, and is called NPV. Management is concerned about the up-front spend on this project, so you must also track the other five attributes, which represent corporate investments in each of the first five years of the project. You have left the attribute names at their default for now: Attribute2 through Attribute6. You are setting up Get/Pay expressions on the Proceed branch of the tree. Initially, the Get/Pay tab of the Branch Definition dialog for this branch would look something like Figure 10-21. 300 Syncopation Software Chapter 10: Time Series Percentiles and Multiple Metrics Figure 10-21. Get/Pay tab of Branch Definition Dialog for a Six-Attribute Model You need to define values for each of the five attributes other than NPV (which is already defined as Total_NPV). There are several ways in which you might use a multidimensional value node to fill in get/pay expressions. Assume first that you have defined a 1 x 5 (row) value node called Invest_1x5 as shown in Figure 10-22. 301 Chapter 10: Time Series Percentiles and Multiple Metrics Syncopation Software Figure 10-22. A 1 x 5 Value Node Definition In order to use this value node to fill in the Get/Pay expressions on the Proceed branch, you would take the following steps: Double-click the branch to open the Get/Pay tab of the Branch Definition dialog. Click in the get or pay expressions cell for Attribute2. Click the Select Variable button ( list. Click OK. Click the Fill Down ( ) and select Invest_1x5 from the ) button in the Get/Pay Definition dialog. DPL will fill in the array elements Invest_1x5[0], Invest_1x5[1], and so forth for the Get/Pay expressions. The Get/Pay Definition dialog would now look like Figure 10-23. If there is data in any of the subsequent cells, you will get an overwrite data prompt before DPL fills in the subsequent values. 302 Syncopation Software Chapter 10: Time Series Percentiles and Multiple Metrics Figure 10-23. Get/Pay Definition Dialog with Array Values Filled In The procedures for filling in Get/Pay expressions with array elements using the Fill Down button are very similar for arrays with other dimensionality. For example: • Suppose you have defined a 5x1 column vector (array) called Invest_5x1. Just as with the row vector, you would select Invest_5x1 from the variables list and enter it for Attribute2. The Fill Down button ( ) will then fill in the other four attributes with elements of the column vector, which are denoted Invest_5x1[0][0], Invest_5x1[1][0], etc. • Suppose you have defined a 2x5 (two-dimensional) array called Invest_2x5. As with the one-dimensional arrays, you would select Invest_2x5 for Attribute2, and use the Fill Down button. In this case DPL will ask you whether to fill in with the first row or the first column of the array. 303 Chapter 10: Time Series Percentiles and Multiple Metrics Syncopation Software • You can also start filling in from an element of an array other than the first element. To do this, enter, for example, Invest_1x10[5] for the first attribute you wish to fill in, and again use the Fill Down button to fill in the subsequent array elements. In this example, DPL would fill in array elements 5 through 9 for the five attributes. • The Fill Down button works with series value nodes as well as array value nodes. You may wish to experiment on your own to fully see how the Fill Down button in Get/Pay expressions works. 304 Chapter 11: Using the Endpoint Database™ Syncopation Software 11 Using the Endpoint Database™ When DPL runs a Decision Analysis, it creates a variety of results and charts that help you understand, interpret, and display insights from your model. Underlying these results is an Endpoint Database™, which DPL can also store (or "record") from a model run. An Endpoint Database™ can be envisioned as a simple tabular data set in which the records (or rows) correspond to endpoints (single paths) in the Decision Tree, and the fields (or columns) correspond to information about each endpoint, such as the state of each event for that path, the values of the objective function and each attribute for that path, and so forth. With DPL Professional, you can record, view, sort, and re-use an Endpoint Database™. Endpoint Databases™ can also be imported from or exported to other applications. An Endpoint Database™ can be re-used for further analysis; this is called playing endpoints. In order to play endpoints you must select Full Tree Enumeration from Endpoints for your evaluation method. In a number of situations even if you make changes to your model after recording endpoints, you can still play the endpoints to produce additional results. With large DPL models and/or DPL models linked to large spreadsheets, the ability to record and play endpoints can save you a lot of analysis time. The first two sections in this chapter provide an overview of the Endpoint Database™ and its display report and demonstrate how to play recorded endpoints. The last three sections describe how to reconnect, export, and import an Endpoint Database™. A model with a large number of endpoints will result in large Endpoint Databases™. The displaying of a sizeable Endpoint Database™ in a report at the completion of a run consumes additional memory and may take some time. In addition, saving DPL Workspace files with large Endpoint Databases™ in them (particularly those displayed in a report) require significant disk space to save. If you try to record and save databases of tens of thousands of endpoints (or more), you will see DPL messages warning you about the amount of disk space that will be required. Extremely large Endpoint Databases™ (i.e., with hundreds of thousands or millions of endpoints) may be infeasible or inadvisable to record and save depending on your computer. 305 Chapter 11: Using the Endpoint Database Syncopation Software Also please note that if you save your model while completing this tutorial, you may see that it will take a few minutes to save and it may result in a fairly large (20-30 megabyte) saved Workspace file. If you want to be sure not to save a file this large, you should select Home | Run | Clear Mem (or press F9) before saving the Workspace file. However, this will clear the Endpoint Database™ and you will have to re-run the model the next time you open the Workspace. Other tips for using DPL's Endpoint Database™ with large models are given later in this chapter. This tutorial assumes that you are familiar with the basics of using DPL Professional and with most of the material contained in the earlier tutorials contained in this manual. 11.1 Recording and Viewing Endpoints For this tutorial, you will use the energy model that you used in Chapters and 1 of this manual. However, rather than continuing with the multiattribute version of that model, you will use the original version in which the objective function, NPV, is the only attribute. Therefore, you do not need to complete the tutorials in Chapters 9 and 1 before completing this tutorial. Select File | Open. Select Energy Case.da to open the Workspace as shown in Figure 11-1. Navigate to the Examples folder underneath where you installed DPL. If you used the default location, the path is C:\Program Files (x86)\Syncopation\DPL8\Examples. 306 Chapter 11: Using the Endpoint Database™ Syncopation Software Figure 11-1. Energy Case Model Workspace In order to record endpoints, DPL uses the Full Tree Enumeration evaluation method. If you click Endpoints in the Home | Run group, DPL will automatically set the evaluation method to Full Tree Enumeration. Within the Home | Run group, check the checkbox next to Endpoints if it is not already. Request a Risk Profile and a Policy Tree™ as well. Leave everything else including Init Dec Alts unchecked. Click Home | Run | Decision Analysis or press F10 to run a Decision Analysis. DPL will open the linked spreadsheet if it is not already and run the model. It may take a few minutes, as this model has more than 32,000 endpoints and Excel has to recalculate results each time. The expected value of this model is 34.9, as you can see in the Session Log or by zooming in on the Policy Tree™. When the model run is complete, you will see an icon for an Endpoint Database™ in the Workspace Manager. 307 Chapter 11: Using the Endpoint Database Syncopation Software Double-click on this icon to display the Endpoint Database™. Note that the Grid tab appears and becomes active in the command ribbon. See Figure 11-2. Figure 11-2. Endpoint Database™ Report The first column in the Endpoint Database™ indicates the endpoint number. Following that the Endpoint Database™ has a column for each event (decision, chance or controlled node) in the model. In a multiattribute model, following the event columns there will be a column for each attribute. In a single attribute model, these columns do not appear. The next to last column is the probability column and the final column is the objective function column. The columns display the following for each of the endpoints of the Decision Tree: • Event columns: the state of each decision node, chance node and controlled node in the model (the column labels are the event name); • Attribute columns: the value of each attribute at the endpoint (the column labels are the attribute names); • Probability column: the probability of the endpoint (i.e., the probability of the path in the Decision Tree represented by the endpoint); • Objective function column: the objective function value at the endpoint. 308 Chapter 11: Using the Endpoint Database™ Syncopation Software As you examine the Endpoint Database™, you will notice that there are some blank cells in the event columns. Blank cells may occur if there is asymmetry in the tree. Blank cells in a column indicate that the state of the event heading the column is not defined, i.e., the event does not occur on that path. For example, the first few thousand rows in the Endpoint Database™ correspond to paths where the state of the chance event "Market 2 Political Stability Future" is not defined because this chance event does not occur for these paths. The alternatives for Pipeline Strategy are either Mkt 1 – 10 BCM or Mkt 1 – 20 BCM for these first few thousand endpoints. Paths through the tree with these two alternatives do not include the Market 2 Political Stability Future chance event. You can navigate around the Endpoint Database™ report as you would an Excel spreadsheet. Press Ctrl+End to scroll down to the bottom, rightmost cell. You can see that there are 32,112 endpoints in the database. Press Ctrl+Home to go to the top, leftmost cell. Note that by default, the Endpoint column (or column 0) is frozen so that when you scroll to the right the Endpoint column remains visible. You can freeze multiple columns or no columns by entering the number of columns you’d like to freeze in the Freeze column dialog via Grid | Format | Freeze. For example, if you enter "3" into the dialog and then scroll to the right (you may need to make the application window smaller to scroll), columns 0, 1, and 2 should remain visible. You can drag the vertical lines separating the columns (in the first row) to change their width. You can also click Grid | Format | Columns | Width to specify the width for a particular the column. If you’d like to specify a width for all columns in the database check the checkbox next to Apply to all in the Column Width dialog. Select Grid | Format | Row | Hide/Unhide or Grid | Format | Column | Hide/Unhide and experiment with hiding and unhiding a row or column. Depending on how your display options are set, you may notice that most of the probabilities appear as 0%. The objective function value also may have fewer or more decimal places than you need to see. Go to File | Options and select the Outputs tab. Change the decimal places for both General number formatting and Probabilities to 2. See Figure 11-3. 309 Chapter 11: Using the Endpoint Database Syncopation Software Figure 11-3. Outputs Tab of the Options Dialog Click OK. The Endpoint Database™ report updates to reflect the change. 11.1.1 Filtering the Endpoint Database™ You can filter the Endpoint Database™. Click Grid | Sort & Filter | Filter. You will see the Filter dialog similar to Figure 11-4. Figure 11-4. Filter Dialog for Endpoint Database™ 310 Chapter 11: Using the Endpoint Database™ Syncopation Software For Condition 1, use the drop-down list to select Pipeline Strategy (Col 3). Select both of the strategies that include "10_BCM" (hold down the Ctrl key and click on the first and third strategy states). For Condition 2, select Actual Reserves (Col_8) and select the Low outcome. Leave the radio button for "all" selected. The dialog should look like Figure 11-5. Figure 11-5. Completed Filter Dialog Click OK. DPL displays the filtered Endpoint Database™. The endpoints shown in the Endpoint Database™ are filtered to the endpoints for which the Pipeline_Strategy is in either the Mkt_1__10_BCM or Mkt_1_and_2__10_BCM alternatives and for which the outcome of Actual_Reserves is Low. Using the filter dialog, you can combine up to five filter conditions (for the purposes of this manual only four are displayed above). In the example above, you defined a filter in which the endpoints must meet all of the conditions, e.g., a logical AND between the conditions. You may also define a filter in which the endpoints meet any of the conditions using the radio button below the conditions, i.e. a logical OR is used between conditions in the filter. You can also create a Custom filter using the Custom button as shown in the filter dialog. Custom filters allow you to define more complex filtering rules so that you can view more specific subsets of the Endpoint Database™. To see how to do this, you will modify the filter you just created to become a custom filter. Click Grid | Sort & Filter | Filter. 311 Chapter 11: Using the Endpoint Database Syncopation Software Press the Custom button. If you have defined a filter using the controls at the top of the dialog as you have just done, DPL will translate that filter into a custom filter and show the logic in the Custom filter edit box as shown in Figure 11-6. Figure 11-6. Custom Filter Logic In custom filters, the columns (i.e. DPL events, attributes, etc.) are denoted Col_0, Col_1, etc., according to their order in the report. The states of each column are integers numbered starting at zero. The filter operators are as shown in Table 11-1 below. In particular, the filter you created uses the operators "==" (equal to), "||" (logical OR) and "&&" (logical AND). 312 Chapter 11: Using the Endpoint Database™ Syncopation Software Filter Operator Meaning && logical AND || logical OR == Equal to != Not equal to <, > Less than, Greater than <=, >= Less than or equal to, Greater than or equal to ! logical NOT Table 11-1. Filter Operator Definitions Place your cursor in the Custom filter edit box so that it is between the last two right parentheses. Type " && (". Place your cursor after the Col_7 in the Custom filter edit box and type " < 2)". The filter should now read: Use the drop-down list below the Add label to add Actual_Price (Col_7) to the filter. ((Col_3 == 0 || Col_3 == 2) && (Col_8 == 0) && (Col_7 < 2)) You have added an AND condition such that Col_7 is less than 2. This last condition corresponds to Actual_Price being Low (0) or Nominal (1). Note: you could have created this filter without using custom logic. Click OK. DPL refreshes the Endpoint Database™, restricting it further to endpoints in which Actual Price is Low or Nominal. Custom filters can be used to "drill down" further in the Endpoint Database™, letting you see narrowly defined sets of endpoints; you can combine AND with OR conditions and you can include more conditions than the five provided in the dialog. 313 Chapter 11: Using the Endpoint Database Syncopation Software Click Grid | Sort & Filter | Clear to clear the filter and display the entire Endpoint Database™. 11.1.2 Sorting the Endpoint Database™ You can sort the Endpoint Database™ via the Sort dialog or directly from the ribbon. Within the Sort dialog, you may sort using up to three columns. Among many other things, this feature is useful for finding out the maximum and minimum values of your objective function and which paths lead to these best case or worst case outcomes. Select Grid | Sort & Filter | Sort. In the Sort by drop-down list, select Objective Function. Click the Descending radio button. See Figure 11-7. Figure 11-7. Sorting the Endpoint Endpoint Database™ Click OK. Note to sort by a single column it is quicker to select a cell in the column you’d like to sort by (it will turn magenta) and press the Descending ( or Ascending ( ) button in Grid | Sort & Filter. The Sort dialog is useful when you'd like to sort by more than one column. Scroll to the right of the report. You can see that the maximum value of the objective function is 338.36; this occurs when all outcomes are favorable (actual prices are High, operating costs are Low, and so forth). 314 ) Chapter 11: Using the Endpoint Database™ Syncopation Software Select Grid | Sort & Filter | Sort again and sort by (none) to return the Endpoint Database™ to its default display. Endpoints in the Endpoint Database™ are sorted by default in the order in which DPL recorded them. You can also click in the leftmost column of the report to return the sort order to the default recorded order. 11.2 Playing Endpoints If you are running a DPL model that is relatively large and is linked to an Excel spreadsheet that is also relatively large, you can save time by recording and playing an Endpoint Database™. Playing endpoints works whenever DPL can re-use the Endpoint Database™ to get the results you need. The Endpoint Database™ stores all the value model information that is needed to roll-back the Decision Tree. Typically, calculating this value model information (particularly if this information comes from an Excel spreadsheet that needs to be re-calculated) is the most time consuming part of a DPL run. When you play endpoints, DPL only needs to look up values rather than recalculate them which results in much quicker runtime. If you change your value model (i.e., add a value node which contributes to an attribute or the objective function) after you record endpoints, you will not be able to play endpoints. If you have not changed your value model, playing endpoints is usually possible. The exception is when you have changed the structure of the model such that there are "new" endpoints. This can occur if you record endpoints for an asymmetric tree and then reorder nodes. Reordering nodes in a symmetric tree, changing probabilities, adding conditioning events, branch controlling, and branch blocking do not result in new endpoints. Depending upon how you reorder, you may also be able to reorder nodes in an asymmetric tree and play the endpoints. Therefore, you can often make significant changes to your model and still be able to play a recorded Endpoint Database™. This section demonstrates how you can play endpoints to save time when you need to do "what-if" analyses or quickly test changes to your model. Before beginning this section, you should have an Energy Model Endpoint Database™ recorded and available from the previous section. 315 Chapter 11: Using the Endpoint Database 11.2.1 Syncopation Software Reordering Nodes You will reorder the tree so that Operating Costs are known before the Pipeline Strategy must be decided. Switch back to the Model window (Ctrl + F12 or double-click on the Energy Model item in the Workspace Manager). Click on the Operating Costs chance node in the Decision Tree. Release the mouse button. The reordered tree should look like Figure 11-8. Note: you can also reorder by right-clicking on a node and choosing Reorder. Drag the node so that the chance node is positioned over the Pipeline Strategy decision node Figure 11-8. Reordered Decision Tree In the Home | Run group, select Risk Profile and Policy Tree™. Click Ok to the warning. Drop-down the Home | Run | Decision Analysis split button and select Full Tree Enumeration from Endpoints from the list (or press the keyboard shortcut for Playing Endpoints: Alt+F10). 316 Chapter 11: Using the Endpoint Database™ Syncopation Software DPL takes just a few seconds to play the endpoints and produce the results. Examine the Policy Tree™ and/or the Session Log. You can see that the expected value increased slightly, to about 35.2. If Operating Costs are known before the Pipeline Strategy decision has to be made, the gain in value is about 0.3 (35.2 - 34.9). Note that you could have renamed and saved the original Policy Tree™ and Risk Profile. Since you did not rename them, they were over-written when you played endpoints. You will switch your model back to its original state. But before doing so take a moment to drop-down the Undo split button where you will find a list of the actions last executed. In this case you will see Undo Reorder Node as the last action taken. When there are multiple actions in the list you could choose to undo more than one of the previous actions in the list. You can set the number of undo levels in File | Options | General. DPL allows you to set the number of Undo levels separately for graphics windows and for text windows (DPL Code). Switch back to the Model window. Click the Undo button on the Quick Access menu located at the top left of the application window. This will undo the last action executed. 11.2.2 Changing Probability Data You can change any of the probabilities in your model and play endpoints instead of re-running the entire model. You will change the probability distribution for Actual Reserves to be more optimistic. Edit the probability data for Actual Reserves so that it looks like Figure 11-9. Note that only the probabilities, not the values, are changing. 317 Chapter 11: Using the Endpoint Database Syncopation Software Figure 11-9. Revised Probabilities for Actual Reserves Node Click OK. Note that although Full Tree Enumeration from Endpoints (or playing endpoints) was the last evaluation method used DPL does update the Run | Decision Analysis split button. Therefore, each time you wish to run a Full Tree Enumeration from Endpoints, you must drop-down the Home | Run | Decision Analysis split button and select it from the list or press the keyboard shortcut Alt+F10. Run a Full Tree Enumeration from Endpoints. Click Ok to the warning. The expected value has increased substantially to 46.8. Switch back to the Model Window and select Undo from the Quick Access menu. 318 Chapter 11: Using the Endpoint Database™ Syncopation Software 11.2.3 Adding Learning Events You can add a chance event to the model and play endpoints as long as the new chance event only probabilistically conditions or is probabilistically conditioned by other chance events in the model. If the conditioning is value-wise, you will not be able to play endpoints. In the Influence Diagram pane, add a chance node called Op Costs Research and position it near the Operating Costs chance node. On the General tab, specify two outcomes: Low Costs and High Costs. Set Low Costs to be default. Switch to the Data tab. Click the Conditioning button. Select Operating Costs. Click OK. Edit the probability data for Op Costs Research so that it looks like Figure 11-10. Figure 11-10. Probability Data for Op Costs Research Node Click OK. The new node appears in the Influence Diagram and Decision Tree as shown in Figure 11-11. 319 Chapter 11: Using the Endpoint Database Syncopation Software Figure 11-11. Influence Diagram and Decision Tree with Op Costs Research Node Notice that the new Op Costs Research node has been added to the end of the longest subtree in the Decision Tree. This causes the Get/Pay expression to be moved from the branches of the Capex node (the node previously at the end of the subtree) to the branches of the newly added Ops Costs Research node. You will reorder the tree so that the new node will be placed immediately before the Proceed decision. Prior to reordering, you will first move the Get/Pay expression back to the branches of the Capex node using DPL's cut and paste feature. Select the branches of the Ops Costs Research node in the Decision Tree and press Ctrl+X to cut the Get/Pay expression from the branches. Select the branches of the Capex node and press Ctrl+V to paste the Get/Pay expression to the branches of the nodes. Your Decision Tree should now look like Figure 11-12. 320 Chapter 11: Using the Endpoint Database™ Syncopation Software Figure 11-12. Decision Tree with Cut and Pasted Get/Pay Expression You are now ready to reorder the tree. Click on the Ops Costs Research chance node in the Decision Tree. Drag the node so that the chance node is positioned over the Proceed decision node and release the mouse button. The newly added node should be positioned before the Proceed decision as shown in Figure 11-13. Figure 11-13. Decision Tree with Reordered Op Costs Research Node You are ready to play endpoints with the conditioning node. Drop-down the Home | Run | Decision Analysis split and select Full Tree Enumeration from Endpoints or press Alt+F10. 321 Chapter 11: Using the Endpoint Database Syncopation Software You will see a warning message. DPL is telling you that you have added a new event since the recording of the Endpoint Database™. If the conditioning relationship between the new event and existing events were not purely a probabilistic one, you would not be able to play endpoints. However, the Op Costs Research node serves only one purpose which is to update the probabilities of the Operating Costs node located farther down the Decision Tree given the results of the research. In this situation, you can play endpoints. Click Yes for the warning. You can see from the Policy Tree™ or the Session Log that the expected value of the model is slightly higher than the original value (35.04 compared with 34.9). Doing research on operating costs before making the Proceed decision adds a small amount of value. The added value, 0.1, might be less than the cost of the research in this example. This exercise gives you an upper bound on how much you would be willing to spend to gain the quality of information as specified by the Op Costs Research node. Before continuing, you will remove the new node. Select the Op Costs Research node in the Influence Diagram, and delete it. Click OK for the warning. You can see in the Decision Tree pane that DPL has removed the Op Costs Research node from the tree and detached the subtree beginning with the Proceed decision. Select the Proceed decision in the Decision Tree and drop it on the blue triangle (endpoint) following the Market 2 Political Stability Now node. 11.2.4 Saving Workspace Files with Endpoint Databases™ As mentioned earlier, Endpoint Databases™ can require a large amount of memory and disk space when a Workspace file is saved with an Endpoint Database™ in it. The display of an Endpoint Database™ also contributes a fair amount to the storage requirements. If you need to save a Workspace file which contains a sizeable Endpoint Database™, you can reduce the storage requirements by saving the Workspace file with the Endpoint Database™ but without the report. You may remove the report by doing the following. Right-click on the Endpoint Database™ item and select Delete. (You are not really deleting the Endpoint Database™ itself; you are merely deleting the report view of it.) 322 Chapter 11: Using the Endpoint Database™ Syncopation Software Alternatively, you can click on the " " button within its document tab in the Document Navigator. If the report window is not maximized, you can click on the close button ( ) at the top right of the window or icon. A dialog will appear confirming that you would like to delete the Endpoint Database™. Again, you are confirming deletion of the report view, not the Endpoint Database™ itself. Your Endpoint Database™ is still stored but the view is not. The icon for the item in the Workspace Manager will change to a blue triangle with a database can behind it instead of a blue triangle with a grid behind it as shown in Figure 11-14. Also, DPL will change the caption to be "{Endpoint Database}" to indicate that the database is no longer displayed in a window. Figure 11-14. Endpoint Database™ Without View in Workspace Manager You can restore the view of the Endpoint Database™ by double-clicking on the icon in the Workspace Manager. You can also play endpoints without them being displayed in a report as you will see in the next section. If you select the Endpoint Database™ item at this point and press Delete, then the Endpoint Database™ itself will be deleted. 11.2.5 Risk Profiles On occasion, you will want to play endpoints for the purpose of generating output charts that you did not generate with the initial decision analysis run. You can generate four types of outputs by simply playing the endpoints: Risk Profiles, Policy Trees™, Policy Summaries™, and Expected Value of Perfect Information and Control charts. If your model has multiple attributes, you may want to play endpoints in order to generate Risk Profiles for attributes other than the objective function. See Chapters 8 – 1 of this manual for more information on models with multiple attributes. 323 Chapter 11: Using the Endpoint Database Syncopation Software You can also play endpoints to generate an Initial Decision Alternatives Risk Profile. You will do this now. Make sure Risk Profile and Init Dec Alts is checked. Run a Full Tree Enumeration from Endpoints. Also check Policy Tree™ and Policy Summary™ (for comparison with the results of the next sub-section of this tutorial). DPL quickly creates an Initial Decision Alternatives Risk Profile for the energy case, as shown in Figure 11-15. You can see from this Risk Profile that the two initial decision alternatives have very similar risk profiles and that neither alternative is substantially riskier than the other. There is little reason for the decision maker not to choose the initial alternative with higher expected value, which is High Initial Upstream Investment. Figure 11-15. Initial Decision Alternative Risk Profile from playing Endpoints 324 Chapter 11: Using the Endpoint Database™ Syncopation Software 11.2.6 Branch Controlling and Blocking You can very quickly generate what-if analyses by controlling the outcome of an event to a particular state, or blocking a specific branch of a decision, and playing endpoints. You should have a Policy Tree™ and a Policy Summary™ from the previous endpoint play, with an expected value of 34.9. Right-click on the Policy Tree™ and rename it to Original Policy Tree. Right-click on the Policy Summary™ and rename it to Original Policy Summary. You have just saved the original results for comparison with your what-if analysis. You will evaluate how the model results change when two of the chance nodes are set to their worst-case outcomes. In the Decision Tree, branch control the Actual Reserves chance node to the Low state. You can do this directly on the ribbon or via the Control tab of the Branch Definition dialog. To control via the ribbon, select the branches of the Actual Reserves node in the decision tree and select Low from the Control drop-down list in Model | Branch (See Figure 11-16). Figure 11-16. Branch Control via the Command Ribbon To control branches via the Control tab of the Branch Definition dialog, double-click the branches of a node in the decision tree and click the Control tab. Select the Control radio button and choose the control state from the drop-down list. Also branch control the Market 2 Political Stability Future node to Unstable. Your Decision Tree should look like Figure 11-17. 325 Chapter 11: Using the Endpoint Database Syncopation Software Figure 11-17. Decision Tree with Branches Controlled for Two Chance Nodes Uncheck Risk Profile. Make sure Policy Tree™ and Policy Summary™ are checked. Run a Full Tree Enumeration from Endpoints. You can see from the Policy Tree™ that the expected value of the decision has declined to only about 4.5. You can compare the what-if Policy Summary™ with the one you saved (Original), and see that the optimal initial decision alternative has changed to the Low level of investment, and that the policy dependent probabilities of the downstream strategy have changed significantly as well. For example, the No branch of the Proceed decision is chosen much more often. Switch to Model window and click Model | Branch | Uncontrol All to return the model to its earlier state. Delete Original Policy Tree™ by right-clicking its item in the Workspace Manager and selecting Delete. Delete Original Policy Summary™. 326 Chapter 11: Using the Endpoint Database™ Syncopation Software 11.3 Reconnecting Endpoints to a Model In some situations, you may find it useful to rename and save an Endpoint Database™, just as you can rename and save other model outputs in DPL. When you save an Endpoint Database™, you can later reconnect your model to the saved database and play its endpoints. You might need to do this, for example, if you make changes to your value model (e.g., in your linked Excel spreadsheet) but then wish to revert to the original version to compare results. You will do a simple example of this now. Double-click on the Endpoint Database™ icon. Click Yes. Click OK for the warning. Right-click on the Endpoint Database™ and Rename it to Saved Endpoints. DPL makes a copy of the Endpoint Database™ under the new name. See Figure 11-18. Figure 11-18. Workspace Manager with Saved Endpoint Database™ 327 Chapter 11: Using the Endpoint Database Syncopation Software At this point, the renamed Endpoint Database™ (Saved Endpoints) is not connected to your model; it is essentially a backup copy of your Endpoint Database™. Note: because it is not connected to your model, the Endpoint Database™ displayed in the report Saved Endpoints does not exist anywhere except in the report. If you delete an Endpoint Database™ that is not connected to a model, the report and the Endpoint Database™ it displays will be deleted. I.e., it is not possible to have a disconnected Endpoint Database™ that is not displayed in a report. The original Endpoint Database™ (still named Endpoint Database™) is currently connected to your model. You will now change your value model and re-run, over-writing this database. Switch to Excel to edit the Energy Case.xls spreadsheet. Also, change the Annual Op Costs Growth assumptions (cells C26 and C27) so that they are both 2%. Change the value of Initial Marketing Spend (cell C33) to 650. In the Assumptions tab, change both the Annual Price Growth assumptions (cells C24 and C25) to 5%. The "Other Assumptions" section of the spreadsheet should look like Figure 11-19. Figure 11-19. New Assumptions in Energy Case.xls 328 Chapter 11: Using the Endpoint Database™ Syncopation Software Switch back to DPL. Make sure that Endpoints, Policy Tree™, and Policy Summary™ are checked and run a Full Tree Enumeration. DPL runs your model with the new assumptions in Excel, and overwrites the Endpoint Database™ with a new one. As you can see from the Policy Tree™, the model results are dramatically different. The expected value is now over 100. From the Policy Summary™, you can tell that the optimal policy has changed as well. Most of the time, the optimal pipeline strategy is to pursue Market 1 only with a pipeline capacity of 20 BCM. You learn the new assumptions are incorrect (they were too optimistic). You need to immediately produce a Value of Information and Control chart for the model using your original assumptions. Rather than going back to Excel, removing the changes, and re-running the model, you can generate this in a few clicks by simply reconnecting and playing the Endpoint Database™ you saved earlier. Activate (double-click on) the Saved Endpoints item in the Workspace Manager. Click Grid | Endpoints | Reconnect. DPL will ask if you wish to save the Endpoint Database™ currently connect to the model (the one you created with the optimistic assumptions), as shown in Figure 11-20. Click No. Figure 11-20. Save Endpoint Database™ Prompt DPL reconnects the Saved Endpoints database and gives it the default name, Endpoint Database™, as shown in Figure 11-21. Note that the connected endpoints are not yet displayed in a report. Note also that Saved Endpoints is still saved as a separate item. 329 Chapter 11: Using the Endpoint Database Syncopation Software Figure 11-21. Workspace Manager after Reconnecting Check Risk Profile, Init Dec Alts, Policy TreeTM, Policy SummaryTM, and VOIC. Select Home | Run | Decision Analysis | Full Tree Enumeration from Endpoints. DPL instantly creates new outputs from the original Endpoint Database™. You can examine the Policy Tree™ or session log to see that the expected value is back to 34.9, as before. In addition, DPL has generated a new Value of Information and Control chart from the reconnected endpoints. Examine this chart if you like. Value of Information and Control charts are explained in the Chapter Section 3.4 of this manual. You do not need to save your model for use in the last two sections of this chapter. If you do save the model in its current state, it will be a large file because there are two Endpoint Databases™ (one of which is displayed in a report) in the file. Right-Click on the Saved Endpoints item and select Delete. The Endpoint Database™ in this report was not connected to a model so it will be deleted entirely. Close the Excel file, Energy Case.xls, without saving changes. 11.4 Exporting Endpoints As you have seen, the Endpoint Database™ report looks a lot like an Excel spreadsheet. In fact, you can quickly and easily export the Endpoint Database™ to a comma separated value (.CSV) file which can be read by Excel or other applications. 330 Chapter 11: Using the Endpoint Database™ Syncopation Software There are two ways to export endpoints: with state names for each event (as you see in the report) or with state numbers. If you plan to use the .CSV file in Excel or another application where you need to see the state names, you can use the state names option. However, if you wish to import the .CSV file back into DPL later (as you will do in the next section), you need to choose the state numbers option. You will do both in this tutorial. If you have the energy model open with a recorded Endpoint Database™ (from the previous sections), double-click on the Endpoint Database™ item to make sure the report is displayed. Click Yes if you are prompted to display the report. If you do not have the energy model currently open or you do not have a recorded Endpoint Database™, open it and/or run it and record endpoints as described in the beginning of this chapter. Activate the Endpoint Database™ if it is not already active. Go to the Data tab, drop down the Export list and select Data. Choose a folder location and name the file Endpoints1.csv. Click Save. You will be prompted whether to use state names or state numbers as shown in Figure 11-22. Figure 11-22. Saving Exported Endpoints Click Yes to use state names. DPL saves the file Endpoints1.csv. 331 Chapter 11: Using the Endpoint Database Syncopation Software You can open this file in Excel or in other applications and see how it has stored the endpoint data for you. As shown in Figure 11-23, the rows at the top of the worksheet describe the number of endpoints and other information about the database, including the state names for each event. Following that is a row with column labels, and then the 32,112 rows of data that you have examined previously. Figure 11-23. Endpoint Database™ in Excel with State Names Next, you will export the endpoint data again using state numbers instead of state names. Switch back to DPL (if you were viewing the data in Excel). Activate the Endpoint Database™ again, if needed. 332 Chapter 11: Using the Endpoint Database™ Syncopation Software Export the Endpoint Database™ and give the file the name Endpoints2.csv this time. Click Save. Click No to the DPL prompt in order to save state numbers. Examine the file in Excel. It should look like Figure 11-24. Figure 11-24. Endpoint Database™ in Excel with State Numbers 333 Chapter 11: Using the Endpoint Database Syncopation Software Note that at the top of this file, there are several comment lines explaining the file format. This format is required in order for DPL to re-import the endpoint data. As you can see in Figure 11-24, the file (other than the comment lines) is very similar to the previous file you exported; however, instead of state names, the data (other than the last two columns, which are the probabilities and the objective function values) indicates the settings of each state using state numbers. The state numbers are indexed beginning with zero for each event. If you should need to import endpoint data that was created by an application other than DPL (such as a statistical package or just within Excel), you will need to make sure that the data is in the correct format. The easiest way to do this is to export a database from DPL using state numbers as you just did, and then look at the format and the comment lines at the top of the file. Also, if you intend to do any post processing of the exported Endpoint Database™, it may be easier to do so with one that has been exported with state numbers. In the next section, you will see how to import endpoints. 11.5 Importing Endpoints There are two ways to import endpoints: from a DPL Workspace (.DA) file or from a .CSV file. In addition, you can import and merge multiple Endpoint Databases™. This section contains three brief tutorials to demonstrate how importing works. When you import an Endpoint Database™, DPL does not display to you any endpoint probabilities contained in the database. These probabilities are not used when you play endpoints. Further, if the endpoints were generated in an application other than DPL, probability data will most likely be missing. 11.5.1 Importing from DPL Workspace Files You can import an Endpoint Database™ from a previously saved DPL Workspace (.DA) file and connect it to your model. As you might expect, the Endpoint Database™ structure must match the structure of your model in order for DPL to be able to successfully import and play the imported endpoints. In this tutorial you will continue with the energy case model, but you will import an Endpoint Database™ containing different results. You should still have the energy model open (if not, open Energy Case.da from the folder where you installed the DPL examples). 334 Chapter 11: Using the Endpoint Database™ Syncopation Software Switch to the Energy Case model. You should have no Endpoint Database™. If needed, press F9 to clear model memory and click OK for the warning. With the model still activated, select Home | Workspace | Add to WS | External Endpoints. Browse to find the file: Energy Case for Import.da in the path where you installed DPL. This DPL file contains an Endpoint Database™ that was previously created with the energy model. Select the file and click Open. You will see the Import Endpoints dialog; see Figure 11-25. Figure 11-25. Importing Endpoints from a .DA File Leave Display report unchecked. Click OK. DPL imports the Endpoint Database™. You can see in the Workspace Manager that Imported Endpoint Database™ is present, although the report is not shown. Check Policy Tree™ and Policy Summary™ in the Home | Run group. 335 Chapter 11: Using the Endpoint Database Syncopation Software Run a Full Tree Enumeration from Endpoints. The expected value of this model is approximately 50 and the policy is different from the energy model you have been using. Note that you played endpoints, instead of running the model. If you were to run the model at this point, you would revert to your earlier results (expected value of 34.9), because your model is still linked to the original Excel file. Before proceeding to the next tutorial, switch to the Energy Model and Home | Run | Clear Mem to clear model memory. Press Ok to the warning. The imported Endpoint Database™ is no longer available. 11.5.2 Importing Endpoints from .CSV Files In this section you will see how to import the Endpoint Database™ from a .CSV file that was exported from DPL. The steps are simple. With the Energy Model activated and model memory cleared, select Home | Workspace | Add to WS | External Endpoints. Browse to the folder where you installed DPL, using the "Files of type" drop-down list to select Comma Separated Value Files (*.CSV). Select endpoints_import.csv from the list. Click Open. Click OK. DPL displays the endpoint report and calls it Imported Endpoint Database™, as shown in Figure 11-26. In the Import Endpoints dialog, check Display report so that you will be able to see the imported endpoints this time. 336 Chapter 11: Using the Endpoint Database™ Syncopation Software Figure 11-26. Endpoint Database™ Imported from a .CSV File As mentioned above, DPL does not display any probabilities for imported endpoints. You can see this is the case in the endpoints you just imported. Scroll to the right to see the probability column. It is blank. Before continuing to the last tutorial, switch to the Energy Model and press F9 to clear model memory again. Request a Policy Tree™ and then play the endpoints to check that the model results are as before, with an expected value of 34.9. 337 Chapter 11: Using the Endpoint Database 11.5.3 Syncopation Software Merging Two Endpoint Databases™ In this last tutorial you will import and merge two separate Endpoint Databases™ from two different .CSV files. You might need to do this, for example, if you have created a model that includes an initial decision with two alternatives, and you have used other applications (such as statistical or database software) to calculate values for each alternative. As long as the Endpoint Databases™ are compatible with your DPL model structure and have the required format (as documented in the first several lines of comments in the .CSV files), you can merge the databases in DPL and use them in conjunction with your model. Note that you can also merge Endpoint Databases™ from two or more DPL Workspace files. You may wish to do this if you have a model with particularly long run times. You could put the model on several different computers and record endpoints with for example an upfront decision controlled to a different alternative on each computer. You could then quickly conduct a complete analysis after merging the separate Endpoint Databases™. In this example, you will merge two databases that were created using the energy model. Each database contains half (16,056) of the endpoints in the overall database, so each .CSV file contains a comment section and required formats at the top, followed by the column heading row and then 16,056 rows of data. If you like, examine the files endpoint merge 1.csv and endpoint merge 2.csv which are in the Examples folder beneath where you installed DPL. Close the .CSV files. Select Home | Workspace | Add to WS | External Endpoints. Browse for the file endpoint merge 1.csv (you will have to use the Files of Type drop-down to look at files with the extension .csv, as you did earlier). Open the file. In the Import Endpoints dialog, keep Display report unchecked. Select Endpoint Database - endpoint imerge 1 and click OK. DPL loads this database. Select Home | Workspace | Add to WS | External Endpoints again. This time locate and open the file endpoint merge 2.csv. Switch to DPL. Make sure that the energy model is open and activated, and has no Endpoint Database™ in it. Press F9 to clear model memory if needed. 338 Chapter 11: Using the Endpoint Database™ Syncopation Software In the Import Endpoints dialog, check Merge with existing endpoints, as shown in Figure 11-27. Click OK. Figure 11-27. Merging an Endpoint Database™ DPL updates the Endpoint Database™. Note that the Workspace Manager does not change. There is still one Imported Endpoint Database™. Double-click on the Imported Endpoint Database™ to create and display the report. Scroll to the bottom of the Endpoint Database™ (Ctrl + End). You can see that the Endpoint Database™ has 32,112 endpoints. Play Endpoints to see results. Your model has the full, merged Endpoint Database™ and results available. The expected value is still 34.9. Close the Workspace without saving changes. The tutorials in this chapter provided you with the basic steps you need to record, manipulate, view, play, import, export and merge Endpoint Databases™. 339 Chapter 11: Using the Endpoint Database Syncopation Software 340 Syncopation Software Chapter 12: Advanced Decision Analysis Results 12 Additional Decision Analysis Results This chapter discusses additional decision analysis results and outputs available in DPL Professional including further features of Policy Trees™ and Policy Summaries™; Scenario Risk Profiles™; and Option Value Diagrams. Chapter 3 also provides an overview of DPL's fundamental decision analysis outputs. You may wish to review that chapter before proceeding with this chapter. This chapter assumes that you are familiar with the basics of using DPL Professional, i.e., with the material covered in Chapters 2 and 3 of this manual. 12.1 Policy Tree™ Features You will start by looking at the Format Display features for pruning Policy Trees™ to make them easier to examine and analyze. Select File | Open. Select Policy Tree.da and click Open. Navigate to the Examples folder underneath where you installed DPL. If you used the default location, the path is C:\Program Files (x86)\Syncopation\DPL8\Examples. DPL opens the Workspace as shown in Figure 12-1. 341 Chapter 12: Advanced Decision Analysis Results Syncopation Software Figure 12-1. Policy Tree.da This is a drug development example. Make sure Risk Profile, Policy Tree™, and Endpoints are checked in the Home | Run group. Make sure that Init Dec Alts and all other outputs are unchecked. Run a Decision Analysis. DPL launches Excel if it is not already running and loads Policy Tree.xls, runs the model, and produces the requested outputs. The Policy Tree™ as shown in Figure 12-2 will be active. 342 Syncopation Software Chapter 12: Advanced Decision Analysis Results Figure 12-2. Policy Tree™ for Drug Development Model You can use the Format Policy Tree™ dialog to prune some of its branches. Suppose you are interested in seeing the scenarios in which the objective function (the net present value of the cash flows in this example) is positive. To do this you first need to have an estimate of the maximum value for the objective function. Double-click the Risk Profile Chart item ( ) labeled Expected Value in the Workspace Manager. The Risk Profile Chart for the objective function is activated. Note the maximum value on the x-axis. It is approximately 2500. Click Policy | Display | Options. Double-click the Policy Tree™ item in the Workspace Manager to activate it again. The Format Policy Tree™ dialog appears as shown in Figure 12-3. In addition to allowing you to modify the appearance of the tree by changing the branch length and branch offset and by specifying which items to display, the Format Policy Tree™ dialog allows you to filter branches. 343 Chapter 12: Advanced Decision Analysis Results Syncopation Software Figure 12-3. Format Policy Tree Dialog In the Branch filter section of the dialog, check the Based on rolledback obj. fn. expected values checkbox. Leave the Min: edit box in the rolled-back objective function values section filled in with "0". In the Max: edit box, type in "2500" (the value you noted from the Risk Profile). Click OK. As shown in Figure 12-4, DPL filters out any branch in the Policy Tree™ whose rolled-back expected value is negative. Note that in Figure 12-4 there is no longer a branch for the No outcome of FDA Approval. This is because if the FDA does not approve the drug, then the expected value is negative. Similarly, there is no longer a branch for Key competitor outcome of Breakthrough. The expected value is less than zero if the key competitor achieves a breakthrough outcome. Lastly, there are no branches shown for Launch equal to No in either of the scenarios where the key competitor fails or has moderate success. 344 Syncopation Software Chapter 12: Advanced Decision Analysis Results Figure 12-4. Policy Tree™ Filtered on Rolled-Back Expected Values Select the Market Share chance node at the end of the Moderate success branch of Key competitor outcome and the Yes branch of Launch. Drop-down the Policy | Display | Expand split button and select Expand Subtree from the list. Click the Full button within the zoom controls or press Ctrl+L to Zoom Full. The Policy Tree™ should now look like Figure 12-5. The Policy Tree™ is difficult to read at this zoom level. You will zoom in on a portion of the Policy Tree™. Figure 12-5. Filtered Policy Tree™ with Expanded Subtree 345 Chapter 12: Advanced Decision Analysis Results Syncopation Software While holding Ctrl + Shift, left-mouse click above the Market Size node at the end of the Nominal branch of Market Share and without letting go, drag down and to the right to create a rectangle around the endpoints of the expand subtree as shown in Figure 12-6. Figure 12-6. Using the Mouse to Zoom a Portion of the Policy Tree™ Release the mouse button. DPL zooms to the portion of the Policy Tree™ you selected as shown in Figure 12-7. 346 Syncopation Software Chapter 12: Advanced Decision Analysis Results Figure 12-7. Policy Tree™ Zoomed to Expanded Subtree You can see from Figure 12-7 that there is no Low branch for Market Share because of the filter. The rolled-back expected value at that node is negative. Similarly, there is no Low branch for Market Size at the end of the Nominal branch for Market Share; the rolled-back expected value is negative at that point as well. Lastly, there is no Low branch for Pricing at the end of Market Share equal to Nominal and Market Size equal to Nominal; the rolled-back expected value (in this case the value at the endpoint) is negative. The branch filtering feature can be used to give you information on which scenarios lead to negative expected values. Note that if a branch does not appear because its rolled-back expected value is outside the range of the filter, this means that the expected value over all the scenarios further down the subtree is outside the range of the filter; it does NOT mean that EVERY scenario further down the subtree is outside the range of the filter. You can also filter branches based on probabilities, as shown in the dialog in Figure 12-3. If you do this, branches with probabilities outside the range you specify will be hidden from display. The filtering is handled similarly to the rolled-back expected value filtering. That is, if a branch is filtered out, all subsequent branches (further down the subtree) will also be hidden from display, regardless of whether their probabilities are in the range you specify. 347 Chapter 12: Advanced Decision Analysis Results Syncopation Software Click Policy | Display | Options. Uncheck Based on rolled-back obj. fn. expected values. Click OK to clear the filter. 12.2 Scenario Risk Profiles™ Scenario Risk Profiles™ can be used to view the risk profile for any particular scenario in your model. A scenario is defined as a combination of fixed states of one or more events in your model. Events that are not defined as part of the scenario are allowed to vary as in a Decision Analysis run, generating a Scenario Risk Profile™ chart. Scenario Risk Profiles™ use an Endpoint Database™ (see Chapter 11 of this manual) in conjunction with a Policy Tree™, so you must run Full tree enumeration and Record Endpoints in order to create them. Make sure you have an Endpoint Database™, Policy Tree™ and Risk Profile from the example in the previous section. If not, create one of each now by re-running the model. Right-click on the Risk Profile Dataset item called {Expected Value}. Rename it Full Profile. You have created a copy of the risk profile for the full model for comparison with a risk profile for a scenario. Double-click on the Policy Tree™ to make it active. Click Policy | Scenario Risk Profile | Add. You will see the Scenario Risk Profile™ dialog as in Figure 12-8. Select the chance node for Key competitor outcome. (You may need to scroll left slightly to see it.) 348 Syncopation Software Chapter 12: Advanced Decision Analysis Results Figure 12-8. Scenario Risk Profile™ Dialog You asked for a Scenario Risk Profile™ from the point in the Policy Tree™ where the initial decision (Develop) is Yes and the outcome of FDA Approval is Yes. The dialog is initialized to these settings and indicates that this is the scenario you have selected. All other events in the tree are denoted *(All)* which means that they are allowed to vary as usual; only the initial decision and the first chance node are fixed. Click OK to generate the Scenario Risk Profile™. See Figure 12-9. 349 Chapter 12: Advanced Decision Analysis Results Syncopation Software Figure 12-9. Scenario Risk Profile™ Chart You will see a Risk Profile Dataset and a Risk Profile Chart item, both called Scenario Expected Value. Note: Scenario Risk Profile™ charts and datasets will overwrite Expected Value charts and datasets. Since you renamed the Expected Value dataset to Full Profile it did not get overwritten. As you would expect, the risk profile and expected value for this scenario are very different from the full profile, because you have removed the possibility that the product is not approved. You can compare the Scenario Risk Profile™ chart with the Full Profile chart you created and see the differences. Also note that the Scenario Risk Profile™ has a title indicating the states of the events that are not varying, i.e. Develop and FDA Approval are both set to Yes. You will generate one more Scenario Risk Profile™ using the dialog. Open the Policy Tree™ again. Use the combo box to select the High setting for Market Size. See Figure 12-10. This time right-click on the chance node for Key competitor outcome and select Scenario Risk Profile™ from the context menu to generate the dialog. 350 Syncopation Software Chapter 12: Advanced Decision Analysis Results Figure 12-10. Scenario Risk Profile™ Dialog with Market Size High Click OK. DPL generates a new Scenario Risk Profile™ for this scenario. Note the title of the Risk Profile indicates what the scenario is. Also note that this Scenario Risk Profile™ replaced the previous one, since you did not rename the previous one. Finally, note that this Scenario Risk Profile™ corresponds to a set of endpoints that cannot be defined just by starting from a location on the Policy Tree™ since the three events whose states are fixed are not at the head of the Policy Tree™ and consecutive. The Scenario Risk Profile™ dialog has a checkbox option to use the default settings for each event based on where you are in the Policy Tree™. If you do not want to be prompted with the Scenario Risk Profile™ dialog, check this option. When you select Scenario Risk Profile | Add, the Scenario Risk Profile will automatically be created using your selection in the Policy Tree™. You can also change this setting in the Home | Run | Options. Note that if this option is checked, you cannot create a Scenario Risk Profile™ similar to the one you just created since there is no point in the tree that matches the selections you made in the dialog. Close the Workspace without saving changes. You will not need to use it later in this chapter. 351 Chapter 12: Advanced Decision Analysis Results Syncopation Software 12.3 Policy Summary™ Features As discussed in Chapter Section 3.3, the Policy Summary™ provides information about the probability-weighted percentage that each decision alternative is selected in the set of optimal endpoints or scenarios. For example, in the model discussed in that section, the Raise alternative of the Change Price decision is optimal in a probability-weighted 30% of the scenarios. You may wish to know in which scenarios the Raise alternative is optimal. In that model, the Risk Profile indicates that the objective function (NPV in this case) is negative in nearly 50% of the scenarios. You may wish to know which scenarios lead to losing money. DPL provides several features that allow you to compare the full set of optimal scenarios to those scenarios filtered on specific criteria. These comparison features help you find out the type of information alluded to in the above examples. This section covers the Comparison (filtering) features of the Policy Summary™ output. Select File | Open. Select Wildcat.da. Navigate to the Examples folder underneath where you installed DPL. If the default location was used for installing, the path is C:\Program Files (x86)\Syncopation\DPL8\Examples. DPL opens the Workspace for the Wildcat model as shown in Figure 12-11. 352 Syncopation Software Chapter 12: Advanced Decision Analysis Results Figure 12-11. Wildcat Model The Wildcat model is a simple model of oil exploration. The decision tree is asymmetric (see Chapter 6). There is an upfront decision to test (one of two versions) or not. If a Test is conducted, information on the seismic structure is gained which provides an indication of the amount of oil. If no test is conducted, this information is not gained. After either testing or not, uncertainties regarding oil price and pipeline costs are resolved. These are followed by a decision to drill or not and further uncertainties regarding drilling costs and the amount of oil. The results of the two tests are conditioned on the actual amount of oil present, however, the results of the tests are available before the amount of oil is known. DPL uses Bayesian revision (see Chapter 7) to calculate the unconditional probabilities of the test outcomes. In the Home | Run group check Risk Profile and Policy Tree™ only. Make sure to uncheck Init Dec Alts. Click Home | Run | Decision Analysis (Fast sequence evaluation should be indicated as the default). 353 Chapter 12: Advanced Decision Analysis Results Syncopation Software DPL runs the model and produces the requested outputs. The Policy Tree™ will be active. You could have requested a Policy Summary™ when you ran the Decision Analysis. You can also create a Policy Summary™ by re-playing recorded endpoints. Here, you will see how to create one from the Policy Tree™. With the Policy Tree™ active, select Policy | Policy Summary | Add from the command ribbon. DPL creates a Policy Summary™ as shown in Figure 12-12. Figure 12-12. Policy Summary™ for the Wildcat Model DPL displays the policy dependent probabilities for each state of each event in the decision model in the Policy Summary™. It also displays these probabilities graphically by drawing a blue bar proportionate in length to the probability on each branch. As the Policy Summary™ indicates, in just under half of the scenarios it is optimal to drill and in just over half it is 354 Chapter 12: Advanced Decision Analysis Results Syncopation Software optimal to not drill. The Policy Tree™ contains all the information needed to create a Policy Summary™ and Policy Summary™ comparisons. You will now use DPL's Filter by Decision Alternative feature to give you information on which event states are correlated with drilling. Activate the Policy Tree™ again. Select Policy | Policy Summary | Compare | By Decision Alternative… The Filter by Decision Alternative dialog appears as shown in Figure 12-13. Figure 12-13. Filter by Decision Alternative Dialog The dialog allows you to select which decision and alternative you would like to use for the filter. As the dialog indicates, the endpoints will be filtered to select the endpoints that are part of the optimal set of endpoints AND for which the selected decision takes the selected alternative. The decision and alternative in which you are interested (Drill and Yes) are already selected. Click OK. DPL creates a new filtered Policy Summary™ as shown in Figure 12-14. Note that the original Policy Summary™ is still in the Workspace Manager; it was not overwritten. 355 Chapter 12: Advanced Decision Analysis Results Syncopation Software Figure 12-14. Policy Summary™ with Comparison Bars for Drill.Yes In comparison mode, DPL displays graphically the policy dependent probabilities for the full set of optimal endpoints with a blue bar below each branch. It also displays graphically the policy dependent probabilities for the filtered endpoints with a red bar above each branch. DPL displays the numeric values for the filtered policy dependent probabilities in angle braces (e.g., <32%>) above the end of each branch. As before, the policy dependent probabilities for the unfiltered set of optimal endpoints are displayed below the branch. Chance outcomes or decision alternatives that have a red bar that is longer than their blue bar are more likely in the filtered scenarios than they are in the full set of optimal scenarios. These event states are positively correlated with the decision alternative used for the filter. For example, in Figure 12-14 you can see that Seismic Structure.Open and Seismic Structure.Closed both have red bars that are longer than the blue bars. This means that both these two outcomes are more likely given that the 356 Syncopation Software Chapter 12: Advanced Decision Analysis Results Yes alternative to Drill is optimal. This tells you that these outcomes are positively correlated with the decision to drill. You can also see that oil price is more likely to be nominal or high in scenarios where drilling is the optimal decision alternative. Conversely, chance outcomes or decision alternatives that have a red bar that is shorter than their blue bar are less likely in the filtered scenarios than they are in the full set of optimal scenarios. These event states are negatively correlated with the decision alternative used for the filter. For example, in Figure 12-14 you can see that Seismic Structure.No has no red bar at all. This means that this outcome never occurs given that the Yes alternative to Drill is optimal. This information can be used to help develop a decision rule, i.e., if Seismic Structure is No, then do not drill. You can also see that oil price is less likely to be low in scenarios where drilling is the optimal decision alternative (in fact it is 50% less likely: 15% vs. 30%). Double-click the Risk Profile Chart item in the Workspace Manager labeled Expected Value ( ). 357 Chapter 12: Advanced Decision Analysis Results Syncopation Software DPL activates the Risk Profile chart for the Wildcat model as shown in Figure 12-15. The Risk Profile Chart indicates that in about 10% of the scenarios the objective function exceeds 200. Figure 12-15. Risk Profile Chart for Wildcat Model You will now use DPL's Filter by Objective Function feature to find out more about which scenarios lead to big gains. Double-click the Policy Tree™ item in the Workspace Manager to activate it again. Select Policy | Policy Summary | Compare | By Objective Function... The Filter by Objective dialog appears as shown in Figure 12-16. 358 Syncopation Software Chapter 12: Advanced Decision Analysis Results Figure 12-16. Filter by Objective dialog DPL displays the full range of the risk profile of the model to help you select which range you would like to specify. In the Min edit box for Filter range type "200". Leave the Max edit box for Filter range at its specified value. Note that the low and high for the range are inclusive values. DPL will filter based on the objective function being greater than or equal to the low value and less than or equal to the high value. Click OK. By leaving the high setting for the filter range at the high setting for the full range, you are asking DPL to filter the Endpoint Database™ for all optimal endpoints with an objective function value greater than or equal to 200. DPL creates another filtered Policy Summary™ as shown in Figure 12-17. 359 Chapter 12: Advanced Decision Analysis Results Syncopation Software Figure 12-17. Policy Summary™ with Comparison Bars for Objective Function Filter The Policy Summary™ with comparison bars for the objective function being greater than or equal to 200 indicates that the Soaking outcome of Amount of Oil occurs in 100% of the filtered scenarios. The comparison also indicates that the No outcome of Seismic Structure never occurs in scenarios where the objective function exceeds 200. You can also see that the Yes alternative of Drill occurs in 100% of the scenarios. This information tells you that if Seismic Structure is in the No outcome there is zero chance that the objective function will exceed 200. In order for the objective function to exceed 200, you must drill and the amount of oil must be soaking. 360 Syncopation Software Chapter 12: Advanced Decision Analysis Results Note that DPL gives each filtered Policy Summary™ a name that indicates which filter is active and how it is set. You can rename or delete these comparisons using the Workspace Manager. DPL will not overwrite them when you run the model, and they are not cleared when you clear model memory. 12.4 Option Value Charts Option Value Charts display the value of each "option" (decision) in your model. In DPL the value of each option (decision) is defined as the difference in the objective function value when the model is run with that decision uncontrolled vs. the value when the model is run with the decision controlled to a fixed alternative. You will run an Option Value Chart using the Wildcat model from the previous section. The process DPL uses for calculating option values will be discussed in the context of this example chart. Click Home | Sensitivity | Option Value Chart. The Option Value Chart setup dialog appears as in Figure 12-18. Figure 12-18. Option Value Chart Setup Dialog 361 Chapter 12: Advanced Decision Analysis Results Syncopation Software This dialog is asking you to specify the default alternative states for each decision in your model for use in your Option Value Chart™. Note that the default states the dialog suggests are the same as the default states for each decision as specified on the General tab of the Node Definition dialog. You can check the checkbox at the bottom left of the dialog if you wish not to be prompted for the defaults each time. However, when you use Option Value Charts, you will usually want to examine (and possibly change) the default states. You will change one of the default settings for purposes of generating the chart. Use the combo box for the Test decision to change the default alternative to Core Sample. Leave the default alternative for Drill set at Yes. The dialog should look like Figure 12-19. Figure 12-19. Option Value Chart Setup with Changes Click OK. DPL creates the Option Value Chart as in Figure 12-20. 362 Syncopation Software Chapter 12: Advanced Decision Analysis Results Figure 12-20. Option Value Chart for Wildcat Model DPL calculated the option values in this chart by first running the model with the Test decision controlled to Core Sample and the Drill decision controlled to Yes. If this is always the strategy, then the objective function value is approximately 11, which is the value at the bottom of the first bar on the chart. DPL then ran the model with the first decision (Test) uncontrolled, and the Drill decision still controlled to Yes. If the Drill decision is always Yes, then there is no value associated with testing, so the optimal alternative for Test is None. The objective function in this case is 17, which is the value at the top of the first bar (and bottom of the second bar) on the chart. 363 Chapter 12: Advanced Decision Analysis Results Syncopation Software Finally, DPL uncontrolled both decisions and ran the model again. In this case the objective function value is 24.7, which is the value at the top of the second bar on the chart, and is also the value you will get if you simply run the Wildcat model as usual. This value reflects the optimal initial decision alternative, which is to Core Sample, as well as full flexibility in the downstream option to Drill. If there were more decisions in the model, DPL would continue from left to right in the tree, uncontrolling decisions one at a time and adding a bar for each decision. The cumulative height of the last bar in the chart is always equal to the objective function when it is run with all decisions uncontrolled. However, the starting value for the first bar as well as the lengths of the individual bars may vary depending on your choice of default alternatives. Note that the choice of the default alternatives can make a significant difference in the appearance of the chart. For each decision (option) in your model, the length of the bar can be interpreted as the incremental value of having flexibility in that option, given that all previous options are also flexible (uncontrolled) and all subsequent options are controlled to the default alternatives you select. You may find that you wish to change the default alternatives in the Option Value dialog, and save the new settings. To do this, check the first checkbox in the lower left corner of the Option Value Chart Setup dialog. This accomplishes the same thing as changing the default alternatives using the General tab of the Node Definition dialog. 364 Chapter 13: Risk Tolerance Syncopation Software 13 Risk Tolerance While there are theoretical arguments for making decisions based on expected value alone, often decisions are made with some consideration of the degree of risk involved in the different alternatives. In many cases, good risk visualization is enough and a judgment about risk can be made after looking at Risk Profiles, Time Series Percentiles, Tornado Diagrams, and other results. In situations where explicitly modeling attitudes toward risk is appropriate, DPL gives you the ability to model your risk aversion (or risk seeking) in terms of a utility function. To model attitudes toward risk using an exponential utility function (a standard form well supported by research), you need only specify a single number: the risk tolerance coefficient. This chapter assumes you have already been through at least one of the earlier tutorials (Chapters 1 through 5) in this manual, or that you are already familiar with DPL. Therefore, basic procedures such as starting DPL and opening and saving workspaces will not be explained in detail here. 13.1 Incorporating a Risk Tolerance You'll start with a file containing a model similar in concept to the one introduced in Chapter2. Start DPL. Open RiskTolerance.da in the Examples folder underneath where DPL is installed (C:\Program Files (x86)\Syncopation\DPL8\Examples if the default location was used during installation). DPL opens the Workspace as shown in Figure 13-1. 365 Chapter 13: Risk Tolerance Syncopation Software Figure 13-1. License vs. In-house Model Run the model to review the current results. Make sure Risk Profile, In Dec Alts and Policy Tree™ are checked in the Home | Run group. Select Home | Run | Decision Analysis (or press F10). 366 Chapter 13: Risk Tolerance Syncopation Software Figure 13-2. Policy Tree™ The Policy Tree™ (Figure 13-2) shows that In-house is the optimal alternative. The expected value of In-house is $2.9 million more than the expected value of License. Navigate to the Risk Profile Chart called Initial Decision Alternatives. Uncheck EV/CE Lines and EV/CE Values in Chart | Format | Display. 367 Chapter 13: Risk Tolerance Syncopation Software Figure 13-3. Risk Profiles The Risk Profiles of the two alternatives show a more ambiguous result (Figure 13-3). In-house is better in terms of expected value, but it is also more risky. Would a decision maker's attitude toward risk ever lead him/r to choose License? Return to the active model. Place the node near Profit. Add a Value node to the model by clicking Model | Node | Add (add value should be the current default, see Table 1-2). The new node will contain data for your risk tolerance. Name it Risk Tolerance. Click the Data tab. Type "50" for the value. Click OK. 368 Chapter 13: Risk Tolerance Syncopation Software Within the Model | Objective & Utility group there is a Risk tolerance combo box. Select Risk_Tolerance from the drop-down list. See Figure 13-4. Figure 13-4. Risk Tolerance Combo Box You might ask where the 50 comes from. In rough terms, it's the amount you (or your company) are willing to put at risk. You can assess your risk tolerance coefficient directly using the following rule. Imagine that a fair coin will be tossed. If you call it correctly, you win R, if not, you lose half of R. What is the largest R for which you would be willing to play this game? The largest R for which you would be willing to play is the risk tolerance coefficient. Risk tolerance coefficients are difficult to assess and are never very precise. You should always test your risk tolerance coefficient using sensitivity analysis (as you will below). For this reason, it is good to define a value node for your risk tolerance rather than specifying the number directly. If you did the latter, you would not be able to run a sensitivity analysis on it. You'll now run the model and observe how the results have changed. Select Home | Run | Decision Analysis. Click OK for the warning. 369 Chapter 13: Risk Tolerance Syncopation Software Figure 13-5. Policy Tree™ with Certain Equivalent results In-house is still the preferred alternative, but the gap has narrowed. The results in Figure 13-5 are Certain Equivalents, which are being shown because risk tolerance is now incorporated in your model. Pursuing the Inhouse alternative might result in an outcome better or worse than 29.3, but a decision maker with a risk tolerance of 50 would be indifferent between the investment and a perfectly safe 29.3. If, as is usually the case, the decision maker is risk averse, the Certain Equivalent will be less than the Expected Value. If you would like to see the Expected Value results (Figure 13-2) again, click View | Results | CE to turn off the Certain Equivalents view. DPL changes the Policy Tree™ to show the EV results. In a model with a risk tolerance, DPL always calculates both EV (Expected Value) and CE (Certain Equivalent) results. With a risk tolerance coefficient of 50, the optimal decision is unchanged. How much lower would it have to go (i.e., how much more risk averse would you have to be) for the License alternative to have a higher certain equivalent than the In-house alternative? Click Home | Sensitivity | Rainbow Diagram. Click Select. Select Risk_Tolerance from the Value for sensitivity drop-down list. Click OK. Type "10" for From. 370 Chapter 13: Risk Tolerance Syncopation Software Type "50" for To. Type "5" for Step size. The Run Rainbow Diagram dialog should look like Figure 13-6. Figure 13-6. Run Rainbow Diagram dialog Click OK. The rainbow diagram in Figure 13-7 shows that the optimal decision policy would change if your risk tolerance dropped to 35. The precise threshold is between 35 and 40. You could run another Rainbow Diagram with a smaller step size if you need to know more precisely the value at which the policy changes. 371 Chapter 13: Risk Tolerance Syncopation Software Figure 13-7. Rainbow Diagram on Risk Tolerance 13.2 Advanced Utility Functions If you want to specify a utility function other than the standard exponential, you can do so in the Risk Tolerance dialog via Model | Objective & Utility | Options. You need to specify both the function and its inverse, using the objective function variable "$". Utility functions cannot depend on the state of events although they can (and generally should) depend on or use constant values such as Risk Tolerance. Figure 13-8 shows the definition of a user-defined utility function equivalent to the built-in exponential utility function. 372 Chapter 13: Risk Tolerance Syncopation Software Figure 13-8. User-defined Utility Function Note: Most applications that require modeling risk aversion can be done so by specifying a single risk tolerance or utility function for the entire Decision Tree. However, there is a theoretical argument for changing the degree of risk aversion throughout the tree as the company's situation changes. DPL provides this capability, although it is hidden by default since it is seldom used. To use this feature, check the checkbox next to Risk tolerance and utility functions by branch in Model | Tree | Options under the Advanced Setting section. The Branch Definition dialog will then have a Risk Tolerance tab on which you can set either a risk tolerance or a custom utility function from that point forward in the subtree. The risk tolerance/custom utility function applies until another one is specified further down the subtree or until the end of the subtree is reached. 373 Chapter 13: Risk Tolerance Syncopation Software 374 Chapter 14: Sensitivity Analyses Syncopation Software 14 Sensitivity Analyses Five types of sensitivity analyses (Value Tornado, Base Case Tornado, Probabilistic Base Case Tornado, Initial Decision Alternatives Tornado, and Rainbow Diagram) were discussed in Chapter 3 and other earlier chapters. This chapter covers two further types of sensitivity analysis that DPL offers and provides some guidance on when it is most appropriate to use each of DPL's sensitivity analysis outputs. 14.1 Two-Way Rainbow Diagrams A Two-Way Rainbow Diagram is a sensitivity analysis that is run on two selected values from a model. The diagram displays the policy changes for each combination of the two values selected. In addition, you can use the Show Tips feature to see the change in the objective function of the model for each combination of the two values. You will now run a Two-Way Rainbow Diagram. Select File | Open Workspace. Select Product.da. Navigate to the Examples folder underneath where you installed DPL. If you used the default location, the path is C:\Program Files (x86)\Syncopation\DPL8\Examples. DPL opens the Workspace as shown in Figure 14-1. 375 Chapter 14: Sensitivity Analyses Syncopation Software Figure 14-1. Product.da Workspace This model is similar in concept to the model in Chapters 2 and 3. Drop-down the Home | Sensitivity | Rainbow split button and select Two-Way. The Run Two-Way Rainbow Diagram dialog appears as shown in Figure 14-2. 376 Chapter 14: Sensitivity Analyses Syncopation Software Figure 14-2. Run Two-Way Rainbow Diagram Dialog Click the Select button in the First Variable (x-axis) section. The Select Value dialog appears as shown in Figure 14-3. Figure 14-3. Select Value Dialog for Two-Way Rainbow Select Per_Unit_Costs in the Value for sensitivity drop-down list. 377 Chapter 14: Sensitivity Analyses Syncopation Software The Select Value dialog updates to show you that the value Per_Unit_Costs is conditioned as shown in Figure 14-4. In this instance Per Unit Costs is a discrete chance node that has probability and value data. Therefore the value for Per_Unit_Costs is conditioned by which state (or outcome) the Per Unit Costs discrete chance node is in. To run a Two-Way Rainbow Diagram on a value that is conditioned, you must specify the conditioning states for each conditioning event. For example, if value node C were conditioned by discrete chance node A and decision B, in the Conditioning section of the Select Value dialog you would need to specify an outcome for A and an alternative for B in order to run a Two-Way Rainbow Diagram on C. Figure 14-4. Select Value Dialog Displaying Conditioning for Per_Unit_Costs In the drop-down list in the Conditioning section, select High. Click OK. The Run Two-Way Rainbow Diagram dialog updates to indicate the value and the conditioning states (if any) that you have selected. DPL displays a value and its conditioning using the notation value|event.state. You have selected the Per_Unit_Costs value for the High state of the Per_Unit_Costs chance event, so DPL displays Per_Unit_Costs|Per_Unit_Costs.High in the Variable name label box. If the value you have chosen is conditioned by multiple events, this is indicated by separating each event.state with commas, i.e., value|event1.state, event2.state, etc. In the Current value label box, DPL displays the current value for the variable given its conditioning. See Figure 14-5. 378 Chapter 14: Sensitivity Analyses Syncopation Software Figure 14-5. Two-Way Rainbow Diagram After Selecting First Variable In the From: edit box in the First Variable (x-axis) section, type "0.8". Select License_Fee in the Value for sensitivity drop-down list. In the To: edit box, type "0.9". In the To: edit box, type "1.05". In the Step Size edit box, type ".025". Click the Select button in the Second Variable (y-axis) section. The Select Value dialog appears again. Click OK. In the From: edit box in the Second Variable (y-axis) section, type "0.7". In the Step Size edit box, type ".025". 379 Chapter 14: Sensitivity Analyses Syncopation Software The Run Two-Way Rainbow Diagram dialog should look like Figure 14-6. Figure 14-6. Run Two-Way Rainbow Dialog after Specifying Values Click OK to run the Two-Way Rainbow Diagram. DPL produces the Two-Way Rainbow shown in Figure 14-7. DPL creates a Two-Way Rainbow Diagram by running the model for each combination of the two values selected for the diagram. To create the Two-Way Rainbow Diagram in Figure 14-7, DPL ran the model 99 times. 380 Chapter 14: Sensitivity Analyses Syncopation Software Figure 14-7. Two-Way Rainbow Diagram A Two-Way Rainbow Diagram displays policies using colors and marker types for the values on the x- and y- axes. The policy at all points with the same color and marker type is the same. A color/marker change indicates a change in policy. The Two-Way Rainbow Diagram in Figure 14-7 indicates that the optimal policy depends on both the value of Per_Unit_Cost.High and License_Fee. This can be seen because the change in policy as License_Fee increases occurs at lower and lower values as Per_Unit_Costs.High increases. For example, when Per_Unit_Costs.High is 0.8, 0.825, or 0.85, a change in policy occurs as License_Fee increases from 0.85 to 0.875, but when Per_Unit_Costs.High is 0.875, a change in policy occurs as License_Fee increases from 0.825 to 0.85. To see which policy is optimal at each point and what the expected value of the model is at each point in the Two-Way Rainbow Diagram, you must have Show Tips turned on. To check if you have Show Tips turned on, go to Files | Options | General. Click OK to close the Options dialog. Move your mouse over one of the markers in the Two-Way Rainbow Diagram. 381 Chapter 14: Sensitivity Analyses Syncopation Software A policy tip appears as shown in Figure 14-8. Figure 14-8. Two-Way Rainbow Diagram with Policy Tip The policy tip tells you the expected value of the model given the values of the two variables that the marker represents. For example, the policy tip in Figure 14-8 indicates that the expected value of the model is 33.9 when License_Fee is 0.825 and Per_Unit_Cost.High is 0.875. The policy tip also tells you the policy dependent probabilities for each decision in the model given the values of the variables that the marker represents. The decision alternatives are displayed in the policy tip by using the decision node name followed by a colon followed by the decision alternative. E.g., "Product Strategy: License". The policy dependent probability for the alternative follows the equal sign. As Figure 14-8 indicates, the policy when License_Fee is 0.825 and Per_Unit_Cost.High is 0.875 is to produce the product in-house and downstream to raise the price in 30% of the scenarios and to keep price the same in 70% of the scenarios. To keep the policy tip compact, decision alternatives with a policy dependent probability of zero are not displayed. The information displayed in the policy tip is also available in the Session Log for all the points. Make the Workspace Window wider by dragging its edge and the Session Log longer by dragging the splitter between the two panes. The expected value of the objective function and the policy information is written to the Session Log for each point. See Figure 14-9. 382 Chapter 14: Sensitivity Analyses Syncopation Software Figure 14-9. Session Log with Policy Information from Two-Way Rainbow Diagram Return the Session Log to its default size. 383 Chapter 14: Sensitivity Analyses Syncopation Software 14.2 Event Tornadoes Event tornadoes provide information about how much each chance node in a model contributes to the overall uncertainty in the outcomes of the objective function of the model. There are two types of Event Tornadoes in DPL: Deterministic and Probabilistic. DPL creates a Deterministic Event Tornado by running the model once to establish the minimum amount of uncertainty in the model (called the Minimum Model Range). DPL calculates the Minimum Model Range by replacing all the chance events in the model with their expected values. Then, DPL runs the model one additional time for each chance event in the model (call this event the sensitivity event). In each of these subsequent runs, DPL replaces all of the chance events in the model except the sensitivity event with their expected values. It leaves the sensitivity event unchanged. In effect, in each sensitivity event model run the only uncertainty left in the model is the uncertainty associated with the sensitivity event (unless Always Gamble has been set for chance events, see below). DPL follows an analogous procedure to create a Probabilistic Event Tornado. DPL runs the model once making no changes to the model to establish the original amount of uncertainty in the model (called the Original Model Range). Then, DPL runs the model one additional time for each chance event in the model (the sensitivity event). However, for Probabilistic Event Tornadoes, in these subsequent runs DPL leaves all of the chance events in the model unchanged except for the sensitivity event. The sensitivity event is replaced with its expected value. In effect, in each sensitivity event model run the reduction in uncertainty from the Original Model Range is due to the removal of the uncertainty associated with the sensitivity event. If either Don't Gamble or Always Gamble is set for a chance event, this has an impact on how the Event Tornado is run. The Don't Gamble and Always Gamble checkboxes are found on the Tree Instance tab of the Node Definition dialog. To access the Tree Instance tab for a chance node, double-click the chance node in the Decision Tree (or select Model | Node | Edit while the node is selected in the Decision Tree). For Probabilistic and Deterministic Event Tornadoes, Don't Gamble and Always gamble have the following effects. If Don't Gamble is set for a chance event, then it is not gambled on regardless of whether or not it is the sensitivity event (i.e., it is always replaced with its expected value in the Event Tornado). If Always Gamble is set for a chance event, then it is 384 Chapter 14: Sensitivity Analyses Syncopation Software gambled on regardless of whether or not it is the sensitivity event (i.e., it is never replaced with its expected value in the Event Tornado). Note: because a Deterministic Event Tornado replaces chance events with their expected value, it may not be appropriate to use for models that use a risk tolerance and hence have certain equivalents. For such models, consider using a Probabilistic Event Tornado. You will now run a Deterministic Event Tornado. If Product.da is not already open, select File | Open Workspace. Select Product.da. Navigate to the Examples folder underneath where you installed DPL. If the default location was used for installing, the path is C:\Program Files (x86)\Syncopation\DPL8\Examples. In the Home | Sensitivity group, drop-down the Tornado split button and select Event (Deterministic) from the list. DPL produces the Deterministic Event Tornado shown in Figure 14-10. 385 Chapter 14: Sensitivity Analyses Syncopation Software Figure 14-10. Deterministic Event Tornado The width of each bar indicates the difference between the 10th percentile and the 90th percentile of the risk profile of the objective function for the model when the sensitivity event labeling the bar is the only uncertainty in the model (unless chance events have been set to Always Gamble). The change in color occurs at the 50th percentile. The bar is yellow between the 10th and the 50th percentiles, and red between the 50th and 90th percentiles. The black vertical line running through all the bars indicates the expected value established in the run for the Minimum Model Range. A bar may not change color if the risk profile is highly skewed for a particular chance event. For example, if the 50th percentile were equal to the 90th percentile, then the entire bar would be yellow. The narrower a bar is for a chance event in a Deterministic Event Tornado, the less impact the chance event has on the overall uncertainty in a model. Bars nearer the top of a Deterministic Event Tornado contribute more to the overall uncertainty in a model. 386 Chapter 14: Sensitivity Analyses Syncopation Software If a chance event appears in a Deterministic Event Tornado with a "bar" of no width, then the 10th and 90th percentiles are equal. The most likely reason for this is that Don't Gamble has been set for the event, though it could be because the 10th and 90th percentiles are truly equal. The latter may happen in an asymmetric tree when an uncertainty only occurs for a particular decision alternative, and that alternative is never optimal. You will now run a Probabilistic Event Tornado. In the Home | Sensitivity group, drop-down the Tornado split button again. This time, select Event (Probabilistic) from the list. DPL produces the Probabilistic Event Tornado shown in Figure 14-11. Figure 14-11. Probabilistic Event Tornado 387 Chapter 14: Sensitivity Analyses Syncopation Software The width of each bar indicates the difference between the 10th percentile and the 90th percentile of the risk profile of the objective function for the model when the sensitivity event labeling the bar is the only uncertainty removed from the model (unless other chance events have been set to Don't Gamble). The change in color occurs at the 50th percentile. The bar is yellow between the 10th and the 50th percentiles; red between the 50th and 90th percentiles. The black vertical line running through all the bars indicates the expected value established in the run for the Original Model Range. As in a Deterministic Event Tornado, a bar may not change color if the risk profile is highly skewed for the model with the sensitivity event replaced by its expected value. The narrower a bar is for a chance event in a Probabilistic Event Tornado, the greater the reduction in uncertainty is due to the "removal" of the chance event. Bars nearer the top of a Probabilistic Event Tornado contribute more to the overall uncertainty in a model. 14.3 When to Use Which DPL Sensitivity Output Table 14-1 and Table 14-2 provide a summary of when it is most appropriate to use each of DPL's sensitivity outputs as well as when to be careful using a particular sensitivity output. 388 Chapter 14: Sensitivity Analyses Syncopation Software Output Value Tornado Base Case Tornado Probabilistic Base Case Tornado Deterministic Event Tornado Probabilistic Event Tornado Particularly good for: Determining which values in a deterministic model should be treated as uncertainties, understanding the probabilistic impact of changes to values in probabilistic models. Understanding the deterministic impact of chance events, comparing the deterministic impact of changes to values to chance events. Comparing to other results since the base run (i.e. vertical line) will equal the expected value of the model as in a Risk Profile or a Policy Tree. Ease of explanation. Understanding the probabilistic contribution of each chance event to overall model uncertainty. Understanding the impact of a chance event while preserving conditioning. Useful for models with a lot of conditioning. Same as Deterministic Event Tornado. Things to be aware of: Can be difficult to interpret for highly asymmetric models. All conditioning and probabilities are ignored. Results are sensitive to the definition of the Nominal state for each chance event. Takes longer to run. Inappropriate to use for models with risk tolerance. Appropriate to use for models with risk tolerance. Can be difficult to explain. Table 14-1. Summary of When to Use Each of DPL's Tornado Diagrams 389 Chapter 14: Sensitivity Analyses Syncopation Software Output Particularly good for: Rainbow Diagram Understanding the impact on the objective function of varying a single value across a number of settings, determining if policy changes occur as a result of varying a single value across a number of settings Two-way Rainbow Diagram Understanding how the interaction between two variable impacts the objective function, determining if policy changes occur as a result of varying two values simultaneously. Things to be aware of: Table 14-2. Sumary of When to Use Each of DPL’s Rainbow Diagrams 390 Chapter 15: DPL Programs and Code Syncopation Software 15 DPL Programs and Code The DPL language (DPL "code") is at the heart of DPL. It provides a simple, compact and precise way to define almost any decision analysis model using text rather than graphics. You don't have to know anything about DPL code to use DPL. If you are building large, complex models, or are converting spreadsheets, however, you may find it useful to look at DPL code and/or work with it. In a DPL Workspace, DPL code is contained within DPL programs. This chapter provides an overview of DPL programs and their components followed by a brief tutorial on converting DPL models to programs. The last three sections of this chapter are intended mainly as a reference; they provide more detailed documentation of the definition and sequence sections of programs as well as advanced techniques for using DPL programs. 15.1 What is a DPL Program? A DPL program is a text based description of the components of a decision analysis model. A DPL program may contain a complete description of a decision analysis model with decision and chance events; conditioning; values and a sequence section or it only may contain a set of data definitions to be used in another program. When you build an Influence Diagram and Decision Tree in the Model window and then run any form of analysis on it, DPL converts the model to a DPL program written in DPL code. It then compiles the program, checking that the model is complete, consistent, and structurally sound. Then, it uses the analysis engine to evaluate the model and create the requested outputs. 391 Chapter 15: DPL Programs and Code Syncopation Software You don't have to start with an Influence Diagram and Decision Tree. If you prefer, you can write a DPL program directly in a Program window. Most people, however, prefer to use the graphics and data management tools in the Model window. There are three situations in which you may wish to work with a DPL program directly: • Converting spreadsheets -- DPL is able to convert Excel spreadsheets into DPL programs. Models using converted spreadsheets run much more quickly than models linked to Excel. DPL can evaluate models that combine graphic models and DPL programs, so you can continue to use the Model window to build Influence Diagrams and Decision Trees while using a converted spreadsheet. • Documenting your model -- if you need a printed, hard-copy version of your complete model, you can print the Influence Diagram, Decision Tree, and all the data trees from the Model window. Or, you can convert your model to a DPL program and print it out. The DPL program is usually much more compact. • Quality assurance -- you may find that a DPL program's compact presentation of all the data and formulas in your model makes verifying that everything is complete and correct an easier task. DPL can generate programs automatically from Influence Diagrams/Decision Trees. 15.2 Overview of DPL Program Components A typical DPL program is divided into two sections: a definition section and a sequence section. In the definition section, you enter a collection of statements that describe the elements of the decision problem—decisions, chance events, data—and how they work together. The definition section is analogous to the Influence Diagram. In the sequence section, you describe the sequence in which decisions are made, uncertainties are resolved, and values are calculated. The sequence section is analogous to the Decision Tree. It is not necessary to include both sections in every program. If you generate a DPL program from a graphical DPL model, the Influence Diagram will be described in a definition section. The Decision Tree will be described in a sequence section. Most programs created from graphical models will have both a definition section and a sequence section. If you convert a spreadsheet to a DPL program file, it will have the appropriate format to be included in the definition section and it will not contain a sequence section. 392 Chapter 15: DPL Programs and Code Syncopation Software 15.2.1 The Definition Section Most DPL programs start with a definition section. This section, which specifies and initializes the components of a decision problem, usually contains the bulk of the model. There are two components you can define in the definition section: • Events, which include decisions, chance events, and controlled events • Values, which include constants, scalars, series, arrays with string or numeric data Strategy tables are handled as a set of decisions in DPL programs. 15.2.2 The Sequence Section DPL sequence sections are systematic English-language descriptions of Decision Tree structures. There are two tasks to accomplish in the sequence section of a DPL program. First, you must specify the chronological order in which the events, or nodes, occur. Second, you must specify the actions, such as payment or receipt of values, which are associated with each branch. 15.2.3 Comments Comments are strings of characters that are ignored by the DPL compiler. They allow you to insert explanatory notes in a DPL program to organize it or to help other people understand it. You can create comments that occupy several lines, but you cannot nest one inside another. Comments can appear anywhere a blank or tab is allowed. There are two types of comments in DPL. The first type is bracketed by two pairs of characters, /* and */. This type of comment can occupy more than one line. The first occurrence of */ ends the comment. This type of comment may be used in the data entry fields of the Model window as well as in programs and command statements. The second type of comment begins with a pair of forward slash characters (//) and ends at the end of the line. By definition, this type of comment cannot occupy more than one line. 393 Chapter 15: DPL Programs and Code 15.2.4 Syncopation Software Spelling/Case Sensitivity It is very important to pay attention to spelling in a DPL program. DPL is case sensitive, which means that "Oil_Price" and "oil_price" are not equivalent. All DPL reserved words are lower case (decision, chance, and value are all reserved words). A reserved word cannot be used as an identifier. User-defined identifiers can be in lower or upper case. Refer to the online Help for more information on identifiers and reserved words. 15.3 Converting a Model to a Program The easiest way to familiarize yourself with DPL programs is to convert an existing Influence Diagram/Decision Tree model to a program and inspect the code that results. As you become more proficient with DPL, you may find it helpful to convert your models to programs from time to time for debugging, documentation, or other purposes. In this section, you will convert the energy case to a DPL program. Select File | Open. Select Home | Workspace | Add to WS | Program from Model Open the energy case file that you also used in Chapter 6. The default location path and filename is C:\Program Files (x86)\Syncopation\DPL8\Examples\Energy Case.da. DPL converts the model to a DPL program and displays the converted model in a Program Window. Note that DPL did not replace the model with the program; both the model and the program are contained in the Workspace and can be seen as separate items in the Workspace Manager. Below is the text of the DPL program for the energy case. The text is included here for reference, but it will be easier for you to read in the DPL Program Window because of its width. Use the scroll bar at the bottom of the window to scroll right and see all the text. If you like, select File | Print and print the text of the energy case program. You may need to print in Landscape format to see the entire program. string Excel_1="C:\\Program Files (x86)\\Syncopation\\DPL8 \\Examples\\Energy Case.xls"; excel(Excel_1,"Assumptions!Discount_Rate") value Discount_Rate=.1; value p=.55; value q=0; excel(Excel_1,"Assumptions!Market_1_Size") 394 Chapter 15: DPL Programs and Code Syncopation Software value Market_1_Size=110; excel(Excel_1,"Assumptions!Market_2_Size") value Market_2_Size=180; excel(Excel_1,"Assumptions!Mkt_1_Model") value Market_1_Growth_Model=3; excel(Excel_1,"Assumptions!Mkt_2_Model") value Market_2_Growth_Model=3; excel(Excel_1,"Assumptions!Proceed") decision Proceed.{Yes~,No}= 1, // Proceed.Yes 0; // Proceed.No excel(Excel_1,"Assumptions!Initial_Upstream_Investment") decision Initial_Upstream_Investment.{Low~,High}= 620, // Initial_Upstream_Investment.Low 630; // Initial_Upstream_Investment.High decision Pipeline_Strategy.{Mkt_1___10_BCM~,Mkt_1___20_BCM, Mkt_1_and_2___10_BCM,Mkt_1_and_2___20_BCM, Mkt_1_and_2___30_BCM}; excel(Excel_1,"Assumptions!Include_Market_2") decision Include_Market_2.{Yes~,No}= 2500, // Include_Market_2.Yes 0; // Include_Market_2.No excel(Excel_1,"Assumptions!Pipeline_Capacity") decision Pipeline_Capacity.{BCM_10~,BCM_20,BCM_30}= 10, // Pipeline_Capacity.BCM_10 20, // Pipeline_Capacity.BCM_20 30; // Pipeline_Capacity.BCM_30 chance CapEx.{Low,Nominal~,High}={.2,.4,.4}; excel(Excel_1,"Assumptions!CapEx") value CapEx|Pipeline_Capacity,CapEx= // Pipeline_Capacity.BCM_10 650, // CapEx.Low 1000, // CapEx.Nominal 1750, // CapEx.High // Pipeline_Capacity.BCM_20 750, // CapEx.Low 1100, // CapEx.Nominal 2000, // CapEx.High // Pipeline_Capacity.BCM_30 850, // CapEx.Low 1200, // CapEx.Nominal 2200; // CapEx.High excel(Excel_1,"Assumptions!Actual_Price") chance Actual_Price.{Low,Nominal~,High}={.3,.4,.3},= 10, // Actual_Price.Low 25, // Actual_Price.Nominal 35; // Actual_Price.High excel(Excel_1,"Assumptions!Actual_Reserves") chance Actual_Reserves.{Low,Nominal~,High}={.3,.4,.3},= 1000, // Actual_Reserves.Low 3000, // Actual_Reserves.Nominal 5000; // Actual_Reserves.High chance Market_2_Political_Stability_Now.{Stable~,Unstable}={p}; chance Forecast_Price.{Low,Nominal~,High}|Actual_Price= {.75+q,.15-q}, // Actual_Price.Low {.125+q,.75-q}, // Actual_Price.Nominal {.1+q,.15-q}; // Actual_Price.High value Forecast_Price|Forecast_Price= 395 Chapter 15: DPL Programs and Code Syncopation Software 15, // Forecast_Price.Low 25, // Forecast_Price.Nominal 35; // Forecast_Price.High chance Market_2_Political_Stability_Future. {Stable~,Moderate,Unstable}| Market_2_Political_Stability_Now= {.7,.2,.1}, // Market_2_Political_Stability_Now.Stable {.05,.1,.85}; // Market_2_Political_Stability_Now.Unstable excel(Excel_1,"Assumptions!Market_2_Stability_Future") value Market_2_Political_Stability_Future| Market_2_Political_Stability_Future= 1, // Market_2_Political_Stability_Future.Stable .5, // Market_2_Political_Stability_Future.Moderate .05; // Market_2_Political_Stability_Future.Unstable excel(Excel_1,"Assumptions!Operating_Costs") chance Operating_Costs.{Low,Nominal~,High}={.3,.4,.3},= 18, // Operating_Costs.Low 20, // Operating_Costs.Nominal 22; // Operating_Costs.High chance Appraisal_Results.{Low,Nominal~,High} |Initial_Upstream_Investment,Actual_Reserves= // Initial_Upstream_Investment.Low {.45,.3,.25}, // Actual_Reserves.Low {.275,.45,.275}, // Actual_Reserves.Nominal {.25,.3,.45}, // Actual_Reserves.High // Initial_Upstream_Investment.High {.85,.1,.05}, // Actual_Reserves.Low {.075,.85,.075}, // Actual_Reserves.Nominal {.05,.1,.85}; // Actual_Reserves.High excel(Excel_1,"Assumptions!Total_NPV") value Total_NPV; excel(Excel_1,"Assumptions!Upfront_NPV") value Upfront_NPV; sequence: decide gamble gamble gamble to Initial_Upstream_Investment then on Appraisal_Results then on Forecast_Price then on Market_2_Political_Stability_Now then decide to Proceed.Yes then decide to Pipeline_Strategy.Mkt_1___10_BCM and set Pipeline_Capacity.BCM_10 and set Include_Market_2.No and StrategyTableSubtree0: a: gamble on Actual_Price then gamble on Actual_Reserves then gamble on Operating_Costs then gamble on CapEx and get Total_NPV to Pipeline_Strategy.Mkt_1___20_BCM and set Pipeline_Capacity.BCM_20 and set Include_Market_2.No and perform StrategyTableSubtree0 to Pipeline_Strategy.Mkt_1_and_2___10_BCM and set Pipeline_Capacity.BCM_10 and set Include_Market_2.Yes and StrategyTableSubtree1: gamble on Market_2_Political_Stability_Future then perform a to Pipeline_Strategy.Mkt_1_and_2___20_BCM and 396 Chapter 15: DPL Programs and Code Syncopation Software set Pipeline_Capacity.BCM_20 and set Include_Market_2.Yes and perform StrategyTableSubtree1 to Pipeline_Strategy.Mkt_1_and_2___30_BCM and set Pipeline_Capacity.BCM_30 and set Include_Market_2.Yes and perform StrategyTableSubtree1 to Proceed.No and get Upfront_NPV Spend a few minutes examining the program you have created. Below are some of the characteristics of the code that you should notice. The first line of the program tells you that the model is linked to a spreadsheet and gives the spreadsheet's filename and path. DPL gives the spreadsheet the label "Excel_1" and the value, chance, and decision nodes that are linked to this spreadsheet are preceded by the "excel" keyword and the name of the linked cell; for example: excel(Excel_1,"Assumptions!Market_1_Size") value Market_1_Size=110; The majority of the code is the definition section representing the Influence Diagram, as described earlier. See Section 15.4 for more information on the definition section. DPL automatically inserts comments (the text following each //) indicating the settings of each event state whose probability and/or value is being defined; for example: Actual_Price.{Low,Nominal~,High}={.3,.4,.3},= 10, 25, 35; // Actual_Price.Low // Actual_Price.Nominal // Actual_Price.High Comments such as the above are not necessary but they usually make it easier to read and interpret the DPL program. The last elements in the definition section are the definitions of the two Excel-linked value nodes that import the cash flow results: excel(Excel_1,"Assumptions!Total_NPV") value Total_NPV; excel(Excel_1,"Assumptions!Upfront_NPV") value Upfront_NPV; Scroll down until you see the line that says "sequence:". The section of the program after the line "sequence:" represents the Decision Tree. This section tells DPL the order in which it should evaluate the nodes and which Get/Pay expressions to evaluate during the analysis. 397 Chapter 15: DPL Programs and Code Syncopation Software Notice that since the first four events on the tree are symmetric, the DPL code for this portion of the tree is very simple: decide to Initial_Upstream_Investment then gamble on Appraisal_Results then gamble on Forecast_Price then gamble on Market_2_Political_Stability_Now then decide … Following this section, the DPL program describes the asymmetric portion of the tree. In this last part of the program, the indenting of the program text matters. See Section 15.5 for detailed information on the sequence section. If the Program Window is active in the Model Window, DPL will analyze the program when you run an analysis. With the Program Window active, run the program as you normally would run a model (Home | Run | Decision Analysis or press F10). The program will open the linked Excel spreadsheet and run the model, producing the same initial results you saw in Chapter 11. The expected value of the model is still 34.9. You will make a change to the program that affects the value model, and run it one more time. Click in the Program Window to edit the program. In the second line of the program, change the discount rate from 0.10 to 0.05. The code should now look like this: excel(Excel_1,"Assumptions!Discount_Rate") Discount_Rate=.05; value Run the program again and inspect the new results. The results are quite different because a lower discount rate implies a higher value for investments with long-term payback. The expected value is now roughly 57, and the optimal policy is always to proceed with the pipeline strategy regardless of the outcomes of the initial uncertainties. Keep in mind that the program and graphic model are not linked, so changes in one do not appear in the other. Also, it is not possible to go the "reverse direction" and generate a graphic model from a program. Also note that the program in this example is still linked to the Excel spreadsheet for evaluation of the cash flow results. That is, when you ran the program, the program had to open the Excel spreadsheet to calculate Upfront_NPV and Total_NPV, just as the DPL model would do. 398 Chapter 15: DPL Programs and Code Syncopation Software If you become comfortable with using DPL programs, you may find them useful for quick "what-if" analyses, such as the change you just made to the discount rate. You can always revert back to the original model by deleting the program from the Workspace Manager and re-generating it from the original model. The remaining sections of this chapter are intended for DPL users who need a more thorough understanding of DPL programs. 15.4 Defining Components in the Definition Section The definition section is a list of definitions of events, variables, and constants. This section can also include comments. DPL is a very flexible language; there are only a few rules for ordering, punctuation, and spacing. 15.4.1 Definition Order You may define the elements of a decision problem in any order; you do not have to group all values together or have all decisions appear at the beginning of the definition section. You can refer to previously defined events, values, or other elements in subsequent data definitions and in the sequence section. The only limitation is that you cannot refer to a name before it is defined. 15.4.2 Punctuation and Spacing DPL requires that statements that define elements of a decision problem end with a semicolon. (In contrast, semicolons are not required in the second part of a DPL program, where you define the sequence of events.) Definitions also have punctuation to separate the parts; refer to the punctuation in the examples as a guide. DPL will usually catch punctuation errors during compilation. If it does find such an error, it will return you to the error location. DPL doesn't care how many lines a definition covers or how many spaces or tabs you include between the words in a definition. The only restriction on spacing is that identifiers (the names of events, states, values, series, and so on) must not include blanks or tabs. Everywhere else in the definition section, you may space things however you like. Note that this is 399 Chapter 15: DPL Programs and Code Syncopation Software not the case in the sequence section if the model is asymmetric; see Section 15.5. 15.4.3 Excel-Linked Events and Values Values and events linked to Excel will be preceded by an excel() clause, as in the following. excel(Excel_1,"Assumptions!Market_1_Size") value Market_1_Size=110; The excel() clause shows the workbook path (Excel_1) and the sheet and cell (Assumptions!Market_1_Size) to which the value or event is linked. In most cases, all nodes will be linked to the same workbook, and the path and file name of that workbook will be defined as a string named Excel_1. If the Excel linked value is an import node, then there will be no assignment ("=") following the value as in the Total_NPV example above. 15.4.4 Decisions The following statement defines a decision in DPL. decision Research_Funding.{Low,Medium~,High}; The tilde (~) character indicates that the Medium state is the default state. The tilde is optional; however, it is recommended if you will be using Base Case Tornado diagrams or Asymmetric Tree Dependency Checking. If no state is marked with the tilde, the first state is the default. If you wish to associate value expressions with the states of a decision, add them to the definition following the state names. decision Research_Funding.{Low, Medium~, High} = 10000,25000,35000; 15.4.5 Chance Events The following statement defines a chance event in DPL. chance Research_Time.{Short,Medium~,Long} = {0.3,0.5}; In the statement above, only two probabilities are specified. If no probability is given for the last state, DPL will calculate it as one minus the sum of the other probabilities. Like decisions, chance events can have default states, indicated by the tilde (~) character. 400 Chapter 15: DPL Programs and Code Syncopation Software If you wish to associate value expressions with the states of a chance event, enter them after the probability distributions. A chance event with both probabilities and values assigned to its states is sometimes called a random variable. chance Research_Time.{Short,Medium~,Long} = {0.3,0.5} = 1, 5, 10; //in months Chance events may be drawn from named distributions. To do so, do not enter probabilities and value expressions. Instead, use the distribution name and enter value expressions for the parameters. chance A.{High, Medium, Low} = beta(1,2); For more information on named distributions, refer to the online Help. Chance events may also be continuous. A continuous chance node is defined in two parts, one for the chance event and one for the associated value. chance B.{1}=; value B=DPLMC.normal(10,3); The first line above defines a chance event with a single unnamed state (this is how DPL knows the event is continuous — discrete events have two or more states). The second line tells DPL that the chance event will be drawn from a normal distribution, and that the mean and standard deviation will be 10 and 3 respectively. DPLMC refers to DPL's Monte Carlo library, DPLMC.DLL, which is part of the DPL installation. For a list of available continuous distributions, see the online Help. If the probabilities or values associated with a chance event depend on the states of other events, you include this information in the chance event's definition. You must define the conditioning events before you define a chance event that depends on them. You must provide probability distributions and value expressions for each combination of conditioning event states. 401 Chapter 15: DPL Programs and Code Syncopation Software For example, the following statement defines a chance event that depends on a decision called Research_Funding and a chance event called Research_Time, both defined earlier. Both Research_Funding and Research_Time are conditioning events. chance Research_Cost.{Low,Moderate,Outrageous} given Research_Funding,Research_Time = //Research_Funding {0.6,0.2}, //Low {0.4,0.3}, //Low Research_Time Short Medium {0.2,0.4}, //Low {0.4,0.3}, //Medium Medium {0.2,0.4}, //High Short {0.4,0.3}, //Medium {0.2,0.4}, //Medium {0.2,0.4}, //High {0.1,0.4}; = 40, 50, //High 80, 45, 60, 50, 95, 110, 40, 60, 85, 80, //Low Medium Long Short //Medium Short //Low 90, 105, 130, //High 95, 140, 160; Long Medium //Medium 95, 120, 140, Short //Low 80, 100, 125, 85, 105, 130, Long //Medium //High //High Long Medium Long Short Medium Long This statement defines nine sets of probabilities, one for each combination of the conditioning events' states (Research_Funding and Research_Time). The order in which you specify the probabilities depends on the order in which you list the conditioning events after the keyword given. (You can substitute a vertical bar "|" for the keyword given.) DPL uses the first set of probabilities when all conditioning events are in their first state. The next set of probabilities applies when the last conditioning event in the list changes to its second state. After associating sets of probabilities with all the states of the last conditioning event DPL varies the states of the nextto-last conditioning event and so on. This continues until probabilities are associated with all combinations of states. This method for determining the order of the various combinations of states is sometimes called row major order or the odometer principle. This means that the states of the last event vary most rapidly. The same applies for the values. 402 Chapter 15: DPL Programs and Code Syncopation Software The comments in the earlier statement show the states of the conditioning events. These comments are ignored by DPL, and they do not determine the order in which you specify the probabilities. 15.4.6 Controlled Events The following statement defines a controlled event in DPL. controlled AchieveOrbit.{Yes,No}; If you wish to associate value expressions with the states of a controlled event, enter them after the state names. controlled AchieveOrbit.{Yes,No} = 500,-10; 15.4.7 Values The following statement defines a value in DPL. value Base_Price = 585.30; The following statements define two events and a value, Inflation_Factor that depends on the two events. chance MoneySupply.{Lower, Constant, Higher} = {.35,.55}; chance TaxRate.{Unchanged, Increased} = {.1}; value Inflation_Factor given MoneySupply, TaxRate // = TaxRate.Unchanged, TaxRate.Increased 1.14, 1.12, //MoneySupply.Lower 1.11, 1.09, //MoneySupply.Constant 1.09, 1.08; //MoneySupply.Higher The order in which you list the numbers depends on the order in which you list the conditioning events. DPL uses the first number when all conditioning events are in their first state. The next number applies when the last conditioning event changes to its second state. After associating numbers with all the states of the last conditioning event, DPL varies the state of the next-to-last conditioning event and so on. This continues until a number is associated with all combinations of states. Once again, the comments are ignored by DPL and do not determine the order in which you specify the values. 403 Chapter 15: DPL Programs and Code 15.4.8 Syncopation Software Shortcuts Statenames If you don't want to name the states of an event, you can define events without state names. DPL will supply default state names. For example, the following statement defines a decision called Invest that has two alternatives. decision Invest.{2}; In the program you can refer to these alternatives as Invest.s1 and Invest.s2. If an event has only two states, DPL also allows you to call them t (for true) and f (for false), or y (for yes) and n (for no), respectively. If you do not specify the number of alternatives or list their names, DPL will generate two unnamed states. The following definition is equivalent to the one above. decision Invest; If you define a chance event without specifying state names, you should still provide probabilities. chance MarketPrice.{4} = {0.1, 0.3, 0.4}; If you define a chance event without probabilities, DPL will assign a uniform distribution to it. chance MarketPrice.{4}; For this example, each state of MarketPrice will have a probability of 0.25. Events and Values with the Same Name Although you cannot have two events with the same name or two values with the same name, you can have an event and a value with the same name. For example, this definition: decision Research_Funding.{Low,Medium,High} = 30, 52.5, 80; could be replaced with these two: decision Research_Funding.{Low,Medium,High}; value Research_Funding given Research_Funding = 30, 52.5, 80; Values defined with events and values defined separately can be used in exactly the same way. DPL can tell whether you are referring to the value or to the event by the context. 404 Chapter 15: DPL Programs and Code Syncopation Software Zeros DPL also allows you to under specify the number of values. If there are fewer initialization expressions than expected, DPL will set the remaining values to 0. chance Fire_Damage.{High, Medium, None} = {0.2, 0.5} = 50000,10000; DPL will automatically assign a value of 0 to the final state of this chance event. Beware: The fact that DPL does this can cause problems if you have incorrectly specified the values because you will not get an error message. For example, the following definition will not work as expected. value Profit | Revenues, Costs = Revenues - Costs; This definition will result in Profit being assigned the difference between Revenues and Costs only when Revenues and Costs are each in their first states. All other times, Profit will be assigned a value of 0. The correct definition is: value Profit = Revenues - Costs; Default...Case Notation DPL provides another way to specify the probabilities for a chance event that depends on other events. This approach can simplify the task of specifying the probabilities when the conditioning events have many combinations of states. For example, rather than specifying each probability distribution individually: chance A.{S1, S2, S3, S4} = {.1, .2, .3}; chance B.{Yes, No} | A ={.1}, {.1}, {.1}, {.5}; you can define a default distribution and then define only the exceptions. chance A.{S1, S2, S3, S4} = {.1, .2, .3}; chance B.{Yes, No} | A = default: {.1}, case A.S4: {.5}; If there are multiple conditioning events, you can use logical OR (||) and logical AND (&&) to specify combinations of events for the cases. As with the probability distributions in chance event definitions, you can save time and effort in a value definition by defining one value as the default for the value and identifying particular cases for other definitions. 405 Chapter 15: DPL Programs and Code 15.4.9 Syncopation Software Series A series is a one-dimensional vector of numbers whose elements are initialized in groups or intervals. series Sales = from 2014 : 0, from 2015 : 100000, from 2017 to 2020 : 150000; In this example, the series is called Sales. Sales contains three intervals: one that has one element (corresponding to the year 2014), one that has two elements (corresponding to years 2015 and 2016), and one that has four elements (corresponding to years 2017, 2018, 2019, 2020). A series has at least one interval definition that contains an expression that gives the number represented by the series in that interval. The interval definitions also contain the interval boundaries—in this case 2014, 2015, 2017, and 2020. The lower bound of the first interval and the upper bound of the last interval define the lower and upper bounds of the series, and they must be constant expressions. The other interval boundaries are called intermediate interval boundaries, and they may be variable expressions. Only the upper bound for the last interval must be explicitly defined; the upper bounds for the other intervals are calculated by subtracting one from the lower bound of the next interval. The interval bounds and subscripts must be integers, and they can cover any range that you designate, including negative numbers. Each interval boundary must exceed the previous one. All interval ranges must lie between –32768 and +32767. If necessary, DPL will truncate subscripts and interval bounds to integers. A series also has a subscript (a way to reference particular elements of the series) which can range between the lower and upper boundaries of the series. In this example, the subscript may range from 2014 to 2020. A basic subscript refers directly to a particular element in the series. For example, the following refers to the value for Sales in 2017: Sales[2017] A relative subscript, contains a special identifier ($) that represents the current subscript of the series being initialized. series Sales = from 2014 : 0, from 2015 to 2024 : Sales[$ - 1] + 10000; 406 Chapter 15: DPL Programs and Code Syncopation Software In this case, when DPL evaluates the value of Sales for 2015, the $ symbol stands for 2015, so DPL looks up the value of Sales for 2014 (that is, Sales[2015-1]) and adds 10,000 to it. You must initialize each element of a series, which means that each interval must be assigned an expression. The expression can include the names of variables previously defined in the model and any function supported by DPL. Unlike those of an array (described later in this chapter), DPL does not allow the elements of a series to be un-initialized. In addition to using the $ symbol in the name of a series element, you can use the $ symbol to represent the number of the current index in an expression. series Years = from 2014 to 2024: [$]; Most definitions in DPL can only reference objects defined earlier in a program. However DPL allows you to reference a series before defining it. That makes it possible to define several series recursively. In the following example, the definition of Series1 references Series2 before Series2 is defined. series Series2; series Series1 = from 1: 1, from 2 to 10: Series2[$ - 1] + 1; series Series2 = from 1 to 10: Series1[$] * 2; With these definitions, Series1[2] equals 3, Series2[2] equals 6, Series1[10] equals 1023, and Series2[10] equals 2046. The first definition in the example indicates that the variable Series2 is a series rather than an array. You can refer to series in three ways. Assume the series Cash_Flows is defined as below. series Cash_Flow= from 2014: 10000, from 2015 to 2023: Cash_Flow[$-1] * 1.1; You may refer to Cash_Flow as follows. • With a subscript, referring to a single element: e.g.,value CF2014 = Cash_Flow[2014]; CF2014 is 10000. • Without a subscript, referring to the entire series: e.g.,value CFTotal = @sum(Cash_Flow); 407 Chapter 15: DPL Programs and Code Syncopation Software CFTotal is 159374.25. • With a subrange specification, referring to a selected subset of the elements in the series: e.g.,value CFSubTotal = @sum(Cash_Flow{2017..2020}); CFSubtotal is 61771.71. For more information on using series, refer to the online Help. 15.4.10 Arrays You can define one- or two-dimensional arrays of numbers in DPL. The following statement defines a one-dimensional array in DPL: array A = {1, 2, 3}; The first element of this array is referred to as A[0], and it equals 1. The second element is A[1], and it equals 2 and so on. Commas separate elements in a one dimensional array. The following statement defines a two-dimensional array in DPL: array B = { 1, 2, 3; 7, 8, 9; 4, 5, 6; 10, 11, 12}; To refer to the element in the first row and first column of array B, you use the syntax A[0][0] (which equals 1). The element in the first row and second columns is A[0][1] (which equals 2) and so on. Commas separate elements in a row in two-dimensional array. Semicolons separate rows in a two-dimensional array. Note: the last row does not end with a semicolon. The elements of an array, unlike those of a series, cannot be initialized in groups. You must initialize each element of an array separately, although you can leave some elements un-initialized. If you do not initialize an array element, it is called a null element. The subscripts of an array are always in a range from 0 to a positive integer. If necessary, DPL will truncate the number represented by an array subscript to produce an integer. 408 Chapter 15: DPL Programs and Code Syncopation Software If you would like to declare an array that has multiple rows and one column, you must do this as a two-dimensional array. The array Payments below is an array with four rows and one column. array Payments = {100; 150; 200; 240}; To access the third row of this array you use Payments[2][0]. You may not omit the [0]. Note: one-dimensional arrays are treated like two-dimensional arrays with one row. Therefore you can refer to the elements of array A declared above as either A[0][1] or A[1]. The [0] is optional. You can initialize each element of an array with an expression. The expression can contain values that depend on events and any of DPL's functions. DPL allows you to reference an array before defining it. This makes it possible to define several arrays recursively. Because you can define both series and arrays recursively, you must first specify whether the variable being referenced before its definition is a series or an array (if you don't, DPL will assume it is a series). Then, use the variable name, and finally, provide the complete definition. For example: array a; series s = from 1: a[0][0], from 2 to 4: a[1][$-2]; array a = {@sum(s{2..4}), 0, 0; 1, 2, 3}; You can refer to arrays in three ways. Assume the series Costs is defined as below. array Costs = {10000, 20000, 30000, 40000; 12500, 22500, 32500, 42500; 15000, 25000, 35000, 45000}; • With subscripts, referring to a single element: e.g.,value Year1Cost = Costs[0][0]; Year1Cost is 10000. • Without subscripts, referring to all the elements in the array: e.g., value CostTotal = @sum(Costs); CostTotal is 330000. 409 Chapter 15: DPL Programs and Code Syncopation Software • With a subrange specification, referring to a selected subset of the elements in the array: e.g.,value CostSubTotal = @sum(Costs{0..1}{1..3}); CostSubTotal is 187500. 15.4.11 Strings You can define a variable called a string and initialize it with a sequence of characters. string Report_Title = "Fuel Price Analysis"; Strings can depend on events. decision Strategy.{US, Europe}; string Currency given Strategy = "Dollars", "Euros"; You can use a string name in place of a string literal anywhere that DPL allows string literals. You can use strings and string literals as the argument of a display function, as arguments of the lookup functions (@hlookup, @vlookup), and as the arguments of the relational operators. If strings are used as arguments of the relational operators (<, >, =, and so on), the ordering is determined by the standard ASCII values for characters. For example: "a" < "z" "a" > "A" Both relations are true (that is, they both result in a value of 1). If a string name appears in a math expression, DPL will generate a "Not a number" error message. 15.4.12 Named Constants A named numeric constant represents a number. When you define a named constant, you assign it an identifier and an initial value. DPL stores the initial value at the time it compiles a program, and it does not allow the value to change thereafter. The following statement defines a named numeric constant in DPL. const BaseYear = 2014; 410 Chapter 15: DPL Programs and Code Syncopation Software You can use a named numeric constant, or constant expressions containing named numeric constants, in places where a variable is not allowed. These include DPL statements that define the number of attributes associated with alternatives and outcomes, the number of alternatives for a decision, the number of outcomes for a chance event, and the number of elements in a series. Unlike values, named numeric constants cannot depend on events. Once you define a named numeric constant, you cannot change it with a DPL command or perform a sensitivity analysis with respect to it. However, you can change the definition of a named numeric constant in a DPL program file and then recompile the program. This allows you to consistently and easily change parameters of a decision analysis throughout a DPL program. 15.4.13 The Integer Keyword The DPL keyword integer can be used in the definition of constants, values, series, and arrays that must have integer values. Whenever DPL evaluates an expression that will be assigned to an integer variable, the expression result will be rounded to the nearest integer value. For example: integer value Years_Remaining = years * 1.83; integer Years_Remaining = years * 1.83; // same as above integer series index = from 2014: 1, from 2011 to 2016: 2.6 * factor; For most purposes, the integer keyword and the @round function have the same effect; the integer keyword is just a convenience. For example, if you want all the values in an array to be integers, you can use the @round function in the definition of each array item, or you can define the array to be an integer array, and the rounding will be automatic. If you have a variable that must be an integer and you are using the "dont" specification to remove lotteries from the sequence section, you must use the integer keyword in that value's definition. Don't confuse the integer keyword with the @int function: the @int function truncates an expression value to the next lower integer; the integer keyword rounds an expression value to the nearest integer. 411 Chapter 15: DPL Programs and Code Syncopation Software You cannot define the values associated with a chance, decision, or controlled event to be integers. The following code is incorrect: //incorrect code integer chance A.{3} = {.2, .3} = 1, 2, 3; If you wish to define integer values conditioned by a chance, decision or controlled event, do the following: //correct code chance A.{3} = {.2, .3}; integer value A given A = 1, 2, 3; 15.5 Defining Event Sequences in the Sequence Section The sequence section starts with the keyword sequence. sequence: If you are using multiple attributes, defining an objective, or defining a constraint function, the word sequence will be followed by the appropriate specifications. sequence (attributes = 2, objective = $1 * $2): There is one important limitation on the organization of the sequence section: keywords marking the states of a single decision or chance event must begin in the same column. Apart from this, you may define a sequence section with as many or as few lines as you like. 15.5.1 Decisions You specify a decision in the sequence of events with the keyword decide or the keyword phrases make a decision, make a max decision, or make a min decision. The first three are equivalent. You can use the one that makes the program easiest to read. Next, you identify each alternative (or group of alternatives) with the keywords on, to, or about. You can use whichever keyword makes the program easiest to read and you can use different keywords with different alternatives of the same decision. decide to Release_Product.Yes ... to Release_Product.No ... 412 Chapter 15: DPL Programs and Code Syncopation Software 15.5.2 Chance Events You specify a chance event in the sequence section of a program with the keywords chance or gamble or the keyword phrases take a chance or take a gamble. All of these keywords or keyword phrases are equivalent. You can use the one that makes the program easiest to read. Next, you identify each outcome (or group of outcomes) with the keywords on or of. You can use whichever keyword makes the program easiest to read, and you can use different keywords with different outcomes of the same chance event. gamble on Market_Forecast.High ... on Market_Forecast.Medium ... on Market_Forecast.Low ... 15.5.3 Branches If a decision or chance node is symmetric, DPL code provides a way to use schematic notation, as in a Decision Tree. The event name appears by itself, and the individual states are not listed. For example, gamble on Demand then ... The above code is equivalent to the node being placed in the Decision Tree as shown in Figure 15-1. Figure 15-1. Node Placed with Symmetric Grouping 413 Chapter 15: DPL Programs and Code Syncopation Software If a decision or chance node is asymmetric, then each state must be listed: gamble on Demand.High then on Demand.Medium then on Demand.Low then The above code is equivalent to the node being placed in the Decision Tree as shown in Figure 15-2. Figure 15-2. Node Placed with Asymmetric Grouping In the asymmetric case, DPL will generate an error message if you do not describe every alternative associated with a decision or chance event. If the name of a decision or chance event appears with the name of only one state, the names are separated by a period. If the name appears with the names of two or more states, the name is followed by a period and a list of the state names. The state names are enclosed in braces and separated by commas. gamble on Demand.{Low, Medium } then ... on Demand.High then ... The above code is equivalent to the node being placed in the Decision Tree as shown in Figure 15-3. 414 Chapter 15: DPL Programs and Code Syncopation Software Figure 15-3. Node Placed with Mixed Grouping The keywords representing a decision's alternatives or a chance event's outcomes must start in the same column. Also, they cannot start in the same column as the keywords representing states of another event if you specify states for that event both earlier and later in the sequence section. DPL uses the columns in which these keywords occur to distinguish the states of one event from those of another. If there is any ambiguity about which event is associated with an event state, DPL associates the state with the event that appeared most recently in the program. The following sequence section is incorrect: sequence: // incorrect code decide to Get_Info.Yes and pay Info_Cost then gamble on Market_Forecast then decide to Release_Product.Yes and gamble on Demand and get Profit to Release_Product.No to Get_Info.No then decide to Release_Product.Yes and gamble on Demand and get Profit to Release_Product.No The keywords for Get_Info and Release_Product should not start in the same column. The following is correct: 415 Chapter 15: DPL Programs and Code Syncopation Software sequence: // correct code decide to Get_Info.Yes and pay Info_Cost then gamble on Market_Forecast then decide to Release_Product.Yes and gamble on Demand and get Profit to Release_Product.No to Get_Info.No then decide to Release_Product.Yes and gamble on Demand and get Profit to Release_Product.No 15.5.4 Duplicating Parts of a Tree (Performing a Subtree) You can duplicate repeated sections of the sequence section with a perform link. You can define a perform link by defining labels in the sequence section of a DPL program and referring to them later in the program with the verb perform. A label is an identifier followed by a colon (:). DPL determines which identifiers represent labels from their context in the sequence section. All labels must be unique. These labels are the equivalent to Perform Targets discussed in Chapter Section 7.1. decide to Get_Info.Yes and pay Info_Cost then gamble on Market_Forecast then Rel: decide to Release_Product.Yes then gamble on Demand and get Profit to Release_Product.No to Get_Info.No then perform Rel A label must appear in a DPL program before a perform clause that references it. 15.5.5 Ending a Path in a Decision Tree DPL provides two equivalent keywords for ending a path through a Decision Tree. The keywords are quit and stop. You can use whichever keyword makes the program easier to read. In some circumstances, you must use quit or stop to end a path through a Decision Tree. In most circumstances, these keywords are optional. 416 Chapter 15: DPL Programs and Code Syncopation Software 15.5.6 Changing the Structure of a Tree with "Dont" Occasionally, you may wish to temporarily remove a lottery from the sequence section of your model by attaching a dont gamble specification. To "dont" a gamble, simply type the word dont (no apostrophe!) in front of the keywords gamble or take a chance on. chance A.{3} = {.2,.3} = 10, 20, 30; sequence: dont gamble on A and get A This tree now has one path. The expected value is 23. The dont prefix only applies to the lottery it precedes. It does not apply to other occurrences of the same lottery elsewhere in the sequence section. 15.5.7 Getting or Paying the Value of an Expression You can associate a gain or loss with each branch (event state) in a Decision Tree with a get/ pay expression. ... and get 20000 ... and pay @sum(Cost1, Cost2, Cost3) ... and receive Revenues - Costs ... and lose Damages If you tell DPL to keep track of several attributes throughout a decision problem, you must provide one expression for each attribute whenever you specify a gain or loss. (Multiple attributes are described later in this section.) The number of expressions following the keywords get, receive, pay, or lose must equal the number of attributes specified in the program. If more than one expression follows one of these keywords, the expressions are separated by commas. ... and get Cash_Flow1, Cash_Flow2 15.5.8 Setting the State of an Event At any point in the sequence of events, DPL allows you to set the state of an event with the keyword set. If you set the state (outcome) of a chance event, that outcome effectively has a probability of 1.0 at that point in the Decision Tree, regardless of the initial probabilities contained in the event's definition. If you set the state (alternative) of a decision, that alternative is selected regardless of the expected values associated with other alternatives. (DPL does not even explore the other alternatives to see if they are optimal.) The only way you can include a controlled event in the sequence section of a program is by setting its state. 417 Chapter 15: DPL Programs and Code Syncopation Software You can only set the state of a decision or chance event if it has not occurred previously along that path through the Decision Tree. Also, once you set the state of a decision or chance event, you cannot use keywords like decide or gamble to make the event occur at a subsequent point along the same path. In contrast, you can set the state of a controlled event several times along any path. decide to Advertise.Yes and pay Ad_Cost then set Demand.High and get Profit to Advertise.No then gamble on Demand and get Profit 15.5.9 Using a Utility Function to Describe Risk Attitude The expression for DPL's built-in exponential utility function is -exp(-V/T), where V is a value and T is the risk tolerance coefficient. To use it, you only need to specify the decision maker's risk tolerance coefficient. value RiskTolerance = 100; ... sequence: use tolerance RiskTolerance and decide to ... The expression for the risk tolerance coefficient cannot contain values that depend on events. Also, this expression cannot contain the state function. Because the specification occurred at the beginning of the sequence section, it applies to the entire tree. It is possible (albeit unusual) to specify different risk tolerance coefficients for different paths through the tree. You can define your own utility function for converting values into utiles. If you do so, you must also define the inverse utility function for converting utiles to values. The expressions for the utility function and inverse utility function use a dollar sign ($) to represent the arguments of these functions. For example, the following defines a utility function that is equivalent to the built-in exponential utility function. use utility -exp(-$/RiskTolerance), -RiskTolerance*log(-$) The expressions for the utility function and inverse utility function cannot contain values that depend on events. Also, these expressions cannot contain the state function. The utility function defined above is the same as the default exponential utility function provided by DPL. 418 Chapter 15: DPL Programs and Code Syncopation Software You are responsible for ensuring that the two functions are the inverse of each other. DPL will perform an analysis with functions that are not the inverse of each other, but the results may be meaningless. 15.5.10 Multiple Attributes, Objective Functions, and Constraints You specify the number of attributes and an objective function (if any) immediately following the keyword sequence at the beginning of the sequence section of a program. sequence (attributes = 2, objective = $1 * Cost1 + $2 * Cost2): The constant expression that represents the number of attributes must produce a number between 1 and 1024, after truncation to an integer. If the number is not an integer, DPL will truncate it. If you do not specify the number of attributes, DPL assumes there is only one attribute. DPL provides predefined identifiers for the attributes, which you can use in the expression for the objective function. In this expression, $1 represents the first attribute, $2 represents the second attribute, and so on. If you do not provide an expression for the objective function, DPL uses a default function equal to the sum of the attributes. If you provide an expression, it need not contain an identifier for each attribute, and any attribute identifier can appear more than once. When the identifier for an attribute is missing from the expression, that attribute does not affect the optimal decision policy. The predefined identifier $0 may be used to refer to the joint probability of the path for which the function is being evaluated. When you specify more than one attribute for a decision problem, you must provide an expression for each attribute whenever you associate a gain or loss with an event state. The expressions follow the keywords get, receive, pay, and lose. The expressions are separated by commas. 419 Chapter 15: DPL Programs and Code Syncopation Software The following is an example of a DPL program that specifies two attributes: value P = 0.02; value MeltCost = 1.0e6; decision Mode.{Normal,Emergency}; value OperatingCost | Mode = 20,50; chance SystemFailure = {0.01}; chance CoreMelt | SystemFailure,Mode = {0.1}, {P}, {0.01}, {P}; chance Warning.{Clear,Ambiguous,None} | = {0.75,0.2}, {0.05,0.2}; SystemFailure sequence (attributes = 2, objective = $1 * MeltCost + $2): gamble on Warning then decide on Mode and pay prob(CoreMelt.y),OperatingCost DPL compiles the expression for the objective function before it processes the Decision Tree. This means that the expression cannot depend on the states of any events. If the expression contains values, they cannot depend on the states of events. Also the expression cannot contain the state function, which returns a number equal to the state of an event. When there is only one attribute, DPL's default objective function is equal to that attribute. (The default objective function is the sum of the attributes, which is equal to the first attribute when there is only one.) However, you can specify an expression for the objective function even where there is only one attribute. This allows you to multiply all the gains and losses by a scale factor before DPL uses them in an analysis. It also lets you use any expression to transform the sum of the gains and losses before applying a utility function (if any) and determining the optimal policy. The phrases attributes =, objective = and constraint = are optional. sequence (2, $1*Cost1 + $2*Cost2): You can also specify a constraint function. sequence (attributes = 2, objective = $1*Cost1 + $2*Cost2, constraint = $1*Cost1 > 20000 ? halt(100000): $1*Cost1 + $2*Cost2): 420 Chapter 15: DPL Programs and Code Syncopation Software Because the constraint is only checked before evaluating a node in the tree, and not at the endpoints, you may also wish to put the constraint expression in the objective function and copy it in the constraint function with an asterisk: sequence (attributes = 2, objective = $1*Cost1 > 20000 ? halt(100000): $1*Cost1 + $2*Cost2, constraint = *) 15.6 Advanced Techniques for Programs If you do a lot of programming with DPL, you may find yourself working with many programs or copying some parts from one program to another. DPL offers several advanced techniques for working with your program files that can simplify this activity. One technique allows you to break your programs into multiple parts, which is especially convenient if you have certain definitions (constants, for example, or a converted spreadsheet model) that are used repeatedly. Another technique allows you to include several variations in a single program file and choose at compile time which variant should be compiled. All of these techniques involve the use of compiler directives, which are instructions for the compiler which you embed in a program file. If you are using these advanced DPL programming techniques and cannot find answers to your questions in this section or in DPL online Help, please contact technical support. 15.6.1 What is a Compiler Directive? DPL code is not procedural. This means that a DPL program simply describes a decision problem, but does not include instructions on how to solve the problem. In this way, DPL is more like a spreadsheet than C++ or Java, which are procedural. However, although a DPL program does not contain instructions for solving a decision analysis problem, it can contain directions to the compiler that control the process by which the compiler reads a DPL program and prepares it for analysis by the DPL engine. 421 Chapter 15: DPL Programs and Code Syncopation Software These instructions are called compiler directives. Every compiler directive begins with a # symbol in the first column of a line of a program file. There are compiler directives that: • Include additional programs in a compiled program • Leave parts of a program file out of the compiled version • Control optimization and spreadsheet evaluation 15.6.2 Including the Contents of One DPL Program in a Second Program DPL code includes a compiler directive that allows a DPL program to be broken into several parts. This can allow you to maintain a list of constants that you use in several models, or use a single value model in several programs, or update a spreadsheet model, convert it to code again, and run a program without editing the DPL models or program. The compiler directive to include a program is: #include programname The instruction may be coded in DPL programs and command procedures. As with all DPL compiler directives, this instruction must begin in the first column of the line. In addition, there can be only one space between #include and programname. When the compiler encounters the #include directive during compilation or command execution, it will suspend processing of the current input model or program and take its input from the program specified as the argument of the directive. When the compiler completes the processing of the included program, it will return to the suspended program and continue. Included programs may be nested to any level; however, recursive #include directives are not allowed. If the compiler encounters an error in an included program, DPL will place the cursor at the error location. When compiling a program, the DPL compiler will ignore duplicate variable definitions encountered in an included file and will use the first declaration of the variable found. 422 Chapter 15: DPL Programs and Code Syncopation Software 15.6.3 Conditional Compilation Conditional compilation involves an if-then-else instruction for the compiler. When the compiler encounters an #if expression statement, it evaluates the expression. If the expression is true (does not equal 0), it compiles the code immediately following until it encounters a #else or #endif statement. If it finds a #else statement, it skips the code that follows the #else and searches for a #endif statement. If the #if expression is false (equals 0), then the compiler searches for the first occurrence of a #else statement or a #endif statement. It skips the code between the #if statement and the #else or #endif statement. If it finds a #else statement first, it compiles the code between #else and the next #endif. Once the compiler finds a #endif statement, it starts compiling again. 15.6.4 Setting Compile-Time Options from Within a Program DPL allows you to control the settings of compile-time options from a DPL program file. Although these options can also be set using Model | Options, this feature can be very useful if forgetting to set an option results in long run times or unexpected results. Like all compiler directives, the #options option list directive must begin in the first column of a line. In general, this directive should be used only once and near the beginning of a program file. The option list consists of a sequence of letters separated by commas, indicating the options to be set. There are five compile-time options that can be set in an options directive: • e (for expression optimization) • s (for sequence optimization) • l (for lottery optimization) • x (Excel lookup function convention) • i (ignore case when comparing strings) If the letter is preceded by a minus sign, the option will be turned off. If the letter is preceded by a plus sign (or nothing) the option will be turned on. These settings override the settings in the Model | Options. DPL will use the settings in the Options menu to set options that are not included in the option list. The letters may be in either upper or lower case. 423 Chapter 15: DPL Programs and Code 15.6.5 Syncopation Software Command Window The Command Window allows you to view any number or calculation within any scenario in a model. You can view any number in a model, including values; probabilities; series and array elements; and expressions. You can also temporarily change any value in a model. These two capabilities provide a powerful and flexible environment for testing and debugging. To open a Command Window, select Home | Workspace | Add to WS | Command Program. You will see a blank window in which you can enter various types of commands to execute. A Command tab appears and becomes active on the ribbon as well. The results of your commands are displayed in the Session Log. Refer to the DPL online Help for detailed descriptions of specific commands. 424 Syncopation Software Chapter 16: Converting Spreadsheets to DPL Code 16 Converting Spreadsheets to DPL Code This chapter is intended mainly for experienced DPL users who have built large, Excel-linked DPL models, and who need to reduce model runtime. This chapter discusses how to convert a spreadsheet to DPL code, provides guidance on good spreadsheet practices if you intend to convert to code, and alerts you to pitfalls to be aware of. Chapters 2 and 3 discuss the basics of DPL-linked spreadsheets, how to build a model from Excel and how to modify it by adding linked nodes to the model. Throughout those chapters, the model uses Excel as its calculation engine for the cash flows that DPL rolls up in the decision tree. DPL communicates with Excel either via OLE Automation or DDE Messaging depending upon the communication protocol selected in the Settings tab of the Model | Links | Options dialog. If you have a large model, these communications protocols can be slow. Also, DPL's analytical engine is optimized for performance on decision trees with numerous paths, whereas Excel is designed for a single interactive recalculation. For these reasons, if you have a large model and wish to substantially reduce runtime, you may want to convert your spreadsheet to code. 16.1 How to Convert Spreadsheets Select File | Open. Select Software.da. Navigate to the Examples folder underneath where you installed DPL. If the default location was used for installing, the path is C:\Program Files (x86)\Syncopation\DPL8\Examples. DPL opens the Workspace as shown in Figure 16-1. 425 Chapter 16: Converting Spreadsheets to DPL Code Syncopation Software Figure 16-1. Software.da Workspace In the Home | Run group, in addition to the outputs already selected, check the checkbox next to Endpoints and select Full Tree Enumeration for the evaluation method. Run the model to see how long it takes to run linked to the Excel spreadsheet. After the model runs, look at the Session Log to see how long the model took to run. Near the bottom of the Session Log will be a line with "Elapsed time:". Note down the number. Double-click the item for the model in the Workspace Manager to activate the Model Window. The model is linked to an Excel spreadsheet called Cash Flow1.xls. To convert a linked model, you use the Model Links dialog. Select Model | Links | Options. The Model Links Dialog appears with the Link tab active as shown in Figure 16-2. 426 Syncopation Software Chapter 16: Converting Spreadsheets to DPL Code Figure 16-2. Model Links Dialog In the Linked Spreadsheets section, the Model Links dialog displays the list of Excel spreadsheets linked to the model. In most instances, there will only be one Excel spreadsheet linked to a model. However, you can have multiple spreadsheets linked to a model. To establish a link to another spreadsheet, you can click Create Link to New Spreadsheet. In this instance, there is only one spreadsheet link. Note if no path is specified for the spreadsheet name then DPL assumes the spreadsheet is in the same directory as the Workspace file. Make sure Cash Flow1.xls is selected in the Linked Spreadsheets list box. Click Convert to Calc Program. The Convert Spreadsheet to Program dialog appears as shown in Figure 16-3. 427 Chapter 16: Converting Spreadsheets to DPL Code Syncopation Software Figure 16-3. Convert Spreadsheet to Program Dialog The dialog has the spreadsheet name that you are about to convert in the Spreadsheet name box. If needed, you could change the spreadsheet by clicking the Browse button. Click Options. The Conversion Options dialog appears as shown in Figure 16-4. Figure 16-4. Conversion Options Dialog 428 Syncopation Software Chapter 16: Converting Spreadsheets to DPL Code You will rarely need to change any of the conversion options settings. Table 16-1 through Table 16-3 describe what each option does. Default Off Option Convert range names to lower case Off Convert labels to DPL strings Off Generate display command procedure Description Converts e.g., Growth_Rate to growth_rate. Should not be used with Convert to Calc Program from Model Links dialog. Converts cells which contain strings but are not used in calculations. Generates statements which can be used for (advanced) debugging in the Command Window. Table 16-1. Display Conversion Options definitions 429 Chapter 16: Converting Spreadsheets to DPL Code On Embed unnamed constants On Embed unnamed formulas Ignore unreferenced range names Off Off Suppress series generation On Always prefix names with sheet name Syncopation Software Cells which contain constants used in calculations will not normally be defined as DPL values. DPL normally prefers value B3 = 1 + 2; to value B1 = 1; value B2 = 2; value B3 = B1 + B2; Uncheck this option if you want the constant values. As above but pertaining to formulas. Check this to have DPL ignore (i.e., not convert) cells or ranges which are named but not used in other calculations. This saves some memory but can be annoying, as output cells like "Total_NPV" are often unreferenced. DPL series are designed for fast calculation of similar formulas, as are often found in spreadsheet rows. However, a whole series (row) must be evaluated at once, so DPL series can be recursive even though the source spreadsheet has no circular references. Check this option if you see the message "series definitions involving X are recursive". DPL will generate less efficient code using values and arrays. Convert e.g., NPV on the DCF sheet to DCF_NPV rather than just NPV. This should be on when using Convert to Calc Program from the Model Links dialog. Table 16-2. Code Generation Conversion Options definitions 430 Syncopation Software On Suppress warnings On Replace with "@na" rather than "0" Chapter 16: Converting Spreadsheets to DPL Code Uncheck to see a message box for every warning. Unsupported functions are normally replaced with @na. This is a safety feature: if the expression needs to be calculated, an error will stop the run. Uncheck this to have unsupported functions replaced with zero. Table 16-3. Unsupported Functions Conversion Options definitions If you change any of the options, your new settings will be used the next time you convert unless you change them again. You can click the Defaults button to revert to the default settings. Leave the settings as they are. Click Cancel. Click OK in the Convert Spreadsheet to Program dialog. DPL creates a DPL program file with the spreadsheet converted to DPL code in it. For large spreadsheets, this may take some time. While converting, DPL displays the Converting dialog, which allows you to cancel the process. The spreadsheet you just converted probably converted too quickly for you to even see the dialog. The DPL program with the converted spreadsheet code has the same name as the spreadsheet (i.e., Cash Flow1.xls in this instance). After conversion, DPL removes the spreadsheet from the Linked Spreadsheets list box and puts the name of the DPL program with the converted spreadsheet code in the DPL Calculation Program edit box. Click OK to close the Model Links dialog. Note that DPL has created an item in the Workspace Manager for the DPL program with the converted spreadsheet code. DPL places the item for the DPL program under the model that references it. See Figure 16-5. The icon for a referenced program has a link on it indicating that it is linked to the model beneath which it is displayed. 431 Chapter 16: Converting Spreadsheets to DPL Code Syncopation Software Figure 16-5. Workspace Manager with Item for Referenced Program A DPL program can be linked to more than one model. If you have programs in your Workspace that are not linked to any model, they are displayed beneath a Workspace Manager item called Unreferenced programs. Programs beneath the Unreferenced programs item in the Workspace Manager are displayed with an icon that does not have a link. Run the model with the converted spreadsheet. You should notice a marked improvement in runtime. Click the Log tab of the Workspace Window. Look for the "Elapsed time:" entry near the bottom. The reduction in run time is dramatic. This can be particularly useful for large models. Once a linked spreadsheet model has been converted to a DPL program, subsequent changes to the converted model can only be made by changing the DPL program. See Chapter 15 for a discussion of DPL programs and code. Usually, if you plan to continue modifying the linked spreadsheet and re-running the model, you will not want to modify the converted DPL program. Instead, you can save a copy of the linked model (either as a separate .da file, or by duplicating the model within your Workspace) and revert to the saved, linked model each time you wish to continue with changes to the spreadsheet. Then you can re-convert the spreadsheet to a DPL program each time you want to run the model with your most recent changes. 432 Syncopation Software Chapter 16: Converting Spreadsheets to DPL Code If you forget to save a version of the linked model, and you follow the steps above to convert to a DPL program, there is an easy way to "undo" this. You will "undo" the conversion now and re-link your DPL model to your spreadsheet. Switch back to the cash flow – decision model. Click OK for the warning. Select Model | Links | Options. In the DPL Calculation Program section, click the Revert to Linked button. You will need to indicate the location and name of the linked spreadsheet. DPL will re-link your model as it was originally. Locate the Cash Flow1.xls file when prompted by DPL. After you revert to the linked model, you will see in the Workspace Manager that the converted spreadsheet program has been moved to the Unreferenced programs section, because it is no longer used by any of the models in the Workspace Manager. See Figure 16-6. Figure 16-6. Workspace Manager with Unreferenced Programs If you prefer, you can delete an unreferenced program from the Workspace by clicking on it and deleting it. DPL will ask you to confirm that you wish to delete the item. 433 Chapter 16: Converting Spreadsheets to DPL Code Syncopation Software 16.2 Spreadsheet Practices for Easier Conversion While DPL supports the functions most commonly used in financial spreadsheets, Excel's functionality is vast, so it isn't practical for DPL to implement every Excel function. If you know in advance that the spreadsheet you are building will be linked to DPL, you can follow the guidelines in Table 16-4 to ease spreadsheet conversion. Be sure to contact Syncopation technical support if you have questions about these suggestions or other conversion issues. It is not uncommon for experienced DPL users to need a little help converting very large or complex Excel spreadsheets. Spreadsheet modeling issue Suggestion Table lookups Use VLOOKUP, HLOOKUP, INDEX. Don't use OFFSET. Dates Use numerical calculations. Excel date functions are not supported. Iteration Spreadsheets that iterate cannot be converted, and tend to be slow even when linked. Iteration is often used for recursive calculations such as interest, which can be solved explicitly. Rounding Don't use ROUNDUP, ROUNDDOWN; use ROUND. Miscellaneous Use array formulas in place of SUMIF, COUNTIF, RANK. Table 16-4. Spreadsheet Modeling Suggestions for Easier Conversion 434 Syncopation Software Chapter 16: Converting Spreadsheets to DPL Code While following these suggestions may represent a significant change of practice, keep in mind that a converted spreadsheet often runs 10-100 times as fast as a linked one, so for a large model it can be worth the effort. Syncopation sometimes makes enhancements to DPL's spreadsheet conversion between major releases. Check our website or contact technical support for the most up to date information on spreadsheet conversion and supported functions. 435 Chapter 16: Converting Spreadsheets to DPL Code 436 Syncopation Software Appendix A: Overview of Spreadsheet Linking Syncopation Software A Overview of Spreadsheet Linking DPL provides a complete set of features for linking to Excel spreadsheets. Most DPL analyses involve spreadsheet linking at some point. This appendix summarizes DPL's main spreadsheet linking features and gives suggestions on when and why to use each feature. A.1 Types of Spreadsheet Links in a DPL Model Calculation Links ( / ) are appropriate when the value measures being used for the analysis are calculated in a spreadsheet model, usually a financial model producing NPV, IRR, etc. Most DPL analyses employ calculation links, and there are several ways to set them up. Initialization Links ( / ) are used when it is more convenient to keep the numbers initializing DPL nodes (probabilities and values) in a spreadsheet, rather than within DPL node data. With initialization links, you can design your DPL model as a template to be used with several input data spreadsheets. A DPL model can have either or both types of links. DPL's linking features are intended to work with input and output cells that are named ranges in Excel. In general, when developing an Excel spreadsheet that you intend to link to DPL, you should make a habit of creating range names for any cells or ranges that may later become calculation- or initialization-linked to value, chance, or decision nodes in DPL. You may also find it helpful to adopt standard conventions for your range names, although DPL does not require this. When a DPL model is linked to a spreadsheet, DPL uses Excel to recalculate the outputs (e.g., NPV) in each scenario. This approach is easy and simple, and works well with spreadsheets of moderate complexity and size. Very large or complex spreadsheets may require a long time to recalculate. Solutions for using DPL with spreadsheets of advanced complexity, such as spreadsheet conversion, are described in the Chapter 16. 437 Appendix A: Overview of Spreadsheet Linking Syncopation Software A.2 Calculation Links There are three ways to establish calculation links between a DPL model and an Excel spreadsheet. A table summarizing the three methods is given at the end of this section. A.2.1 Method 1: Creating a New Calculation-linked Model from Excel When you are starting with a more or less complete Excel spreadsheet but have not yet developed a DPL model for the spreadsheet, you may want to use the command: Home | Add to WS | Excel Linked Model… This command creates a DPL Influence Diagram from the named cells in an Excel spreadsheet (all or a specified selection of them). DPL creates nodes for the selected cells and influence arcs between export nodes and import nodes. When you do this, you will typically select several export values and at least one import value (formula) from a list of cells/range names in your Excel spreadsheet. The basic steps are as follows: Click Home | Add to WS | Excel Linked Model…. Browse to locate the spreadsheet you wish to use. Select the names of the ranges you wish to use. DPL creates an Influence Diagram with arcs representing the relationships in your spreadsheet. This provides you a starting point for your linked model. See Figure A-1 and Figure A-2 below. Figure A-1. Create Model from Excel Dialog 438 Appendix A: Overview of Spreadsheet Linking Syncopation Software Figure A-2. Range Names Dialog for Creating Model from Excel When you use this method you will see that DPL includes all of the named cells in the Range Names dialog, so that you can choose to use any or all of the cells in your linked model. Also see Section 2.2 of this manual for an example of Method 1. A.2.2 Method 2: Adding Calculation-linked Nodes to an Existing Model Often you will build a model in DPL and a separate spreadsheet in parallel and link the two at some point in the process, adding new nodes to DPL that are linked to the spreadsheet. In this situation you may wish to use the command: Model | Link | Excel Calculation-linked… 439 Appendix A: Overview of Spreadsheet Linking Syncopation Software This command adds linked values to the Influence Diagram. The nodes are created as values, but (as with Method 1) they can be changed later to decision nodes or chance nodes as desired. The basic steps for this method are as follows: Select Model | Link | Excel Calculation-linked… Select the names of the cells for which you wish to add linked values. If you have not created any Excel linked nodes, browse to locate the spreadsheet you wish to use otherwise DPL uses the currently linked spreadsheet. See Figure A-3. Figure A-3. Range Names Dialog for Creating Linked Values from Excel 440 Appendix A: Overview of Spreadsheet Linking Syncopation Software DPL adds the new values to your model as value nodes, but does not add influence arcs. You may need to add influence arcs as well as changing the node type(s) to decision or chance nodes. See Section 2.1 for an example of this method. When you use this method you will notice that DPL lets you check whether to show cells that are already linked (the default is no), whether to show cells with formulas (the default is yes) and whether to create arrays based on range size. DPL assumes that since you are adding a new linked node, you probably do not want to choose a cell that is already linked to another node, and you probably do want to consider cells with formulas, since they could become new import nodes. You can check or uncheck these options if needed and the contents of the Range Names list will be updated. This method allows you to create linked series and one- or two-dimensional arrays. When creating the nodes, DPL examines the spreadsheet to see what each range contains. For single cell ranges that do not contain a formula, DPL creates export nodes initialized with data from the spreadsheet. For single cell ranges that do contain a formula, DPL creates import nodes with no data. For multiple cell, one-dimensional ranges that do not contain any formulae, DPL creates export array nodes initialized with data from the spreadsheet. For multiple cell, one-dimensional ranges that do contain a formula, DPL creates import series nodes with no data. For multiple-cell, two-dimensional arrays that do not contain any formulae, DPL creates export two-dimensional array nodes initialized with data from the spreadsheet. For multiple-cell, two-dimensional arrays that contain a formula, DPL creates import two-dimensional array nodes with no data. The Create Linked Values from Excel method can be used in conjunction with the Create Model from Excel method. You might start by using Create Model from Excel and subsequently decide that existing named cells within Excel need to be linked to DPL or you may modify the Excel spreadsheet and then need to link these new named ranges to DPL. 441 Appendix A: Overview of Spreadsheet Linking Syncopation Software A.2.3 Method 3: Establishing Calculation Links for an Existing Node You may already have a node created in your DPL model that needs to be linked to your spreadsheet. In this situation, edit the node as usual and switch to the Links tab of the Node Definition dialog. The Links tab of the Node Definition dialog allows you to link an existing Influence Diagram node to an Excel cell. From the Links tab: Specify Excel as the Calculation Link type; Click Cell Names; DPL automatically sets the spreadsheet to the current linked spreadsheet. If there isn't one, use the Browse button to select the spreadsheet; Select the desired cell from the list; Click OK. Alternatively, once you have specified Excel as the Calculation link type, you can copy the cell in Excel (using the Excel command Home | Clipboard | Copy or Ctrl+C), switch back to DPL and click the Paste Link button on the Links tab of Node Definition dialog. See Figure A-4 and Figure A-5. 442 Appendix A: Overview of Spreadsheet Linking Syncopation Software Figure A-4. Cell Names Dialog when Linking an Existing Node 443 Appendix A: Overview of Spreadsheet Linking Syncopation Software Figure A-5. Cell Names Dialog when Linking an Existing Node With this method, DPL will also adjust which cell names appear in the dialog depending on whether the node you are linking has data in it. If it has data, you will see that "Show cells with formulas" is not checked, because DPL assumes it will be an export node. Conversely, if the node has no data, by default DPL checks "Show cells with formulas" because DPL assumes the node will be an import node which is typically linked to a cell with a formula in it. You can check or uncheck these options to see the full set or restricted set of cell names if you need to. 444 Appendix A: Overview of Spreadsheet Linking Syncopation Software A.2.4 Summary of Calculation Links Methods Table A-1 summarizes when each method is appropriate. Situation Method Building a spreadsheet-linked DPL model from scratch Method 1 Adding a node to the DPL model for a new driver cell in the spreadsheet Method 2 Linking an existing or newly created node to a cell in the spreadsheet Method 3 Table A-1. Summary of Methods for Establishing Calculation Links A.3 Initialization Links Initialization links are appropriate when you wish to store probabilities and values for DPL node data in a spreadsheet. DPL uses the initialization links to set the probabilities and values for the linked node(s). Initialization links are different from calculation links in that DPL gets the data from the spreadsheet once at the beginning of a run to initialize the node's values (or probabilities) whereas calculation links exchange data to/from Excel during the entire course of the run. To use initialization links, first define a range in Excel that contains the probability or value data you wish to link to the node in DPL. The way you define the range will vary depending on the node and its conditioning. For a simple 3-state chance node, you define a 3-cell range containing the probabilities and/or another 3-cell range containing the values. Probabilities and values are initialized separately in chance nodes and must be stored in separate named ranges in Excel. For a chance node that is conditioned by another event, you define a twodimensional cell range (e.g., 3 by 3) in which the rows correspond to the states of the conditioning node, and the columns correspond to the probabilities or values for the states of the conditioned node. An example of this is given below for a conditioned 3-state chance node. There are two methods to create initialization-linked nodes. 445 Appendix A: Overview of Spreadsheet Linking Syncopation Software 1) If you have not created the node yet, use Model | Links | Add | Excel Initialization-Linked… See Figure A-6. Figure A-6. Range Names Dialog for Creating Initialization-Linked Valude from Excel Using this method, DPL creates value nodes for the selected ranges. If you have Create arrays based on range size. DPL will create one- or twodimensional arrays to match the range size. 2) To establish initialization links for an existing node, do the following. In the Influence Diagram pane, edit the node that you wish to link. Switch to the Links tab. Turn on initialization links by clicking Microsoft Excel in the Initialization Links section. 446 Appendix A: Overview of Spreadsheet Linking Syncopation Software If needed, browse for the spreadsheet workbook you wish to use for the link. Note that in the dialog shown in Figure A-7, the initialization link is established with a node that already has calculation links. The Same as calc links option is checked, so you are linking this node to the same workbook. However, if the node did not already have calculation links or if you want to link it to a different workbook for initialization, you would uncheck the Same as calc links option and use the Browse button to find the new workbook. Figure A-7. Node Definition: Initialization Links In the Excel spreadsheet, make sure that you have named a range containing the data you wish to initialize the node. In Figure A-8 the range Mkt_ph2_probs has been defined and it contains the probabilities 0.3, 0.4, 0.3. For unconditioned nodes, the range can be a row or a column. 447 Appendix A: Overview of Spreadsheet Linking Syncopation Software Figure A-8. Excel Range with 3 Probabilities In DPL, switch to the Data tab of the Node Definition dialog. Select the first branch of the node. Click the Links button ( ). DPL displays a list of the cell names in the spreadsheet that you selected on the Links tab. Select the appropriate range. Click OK. The range appears in the edit box as a reference in "=Sheet!Cell" notation. See Figure A-9. 448 Appendix A: Overview of Spreadsheet Linking Syncopation Software Figure A-9. Initialization Link for Three-State Chance Node Suppose in the example above that the node Marketing phase 2 is conditioned by the 3-state chance node, Marketing phase 1. In this case, you need to specify 9 probabilities and 9 values for the Marketing phase 2 node since it is conditioned. The Data tab for the Marketing phase 2 node would initially look like Figure A-10. 449 Appendix A: Overview of Spreadsheet Linking Syncopation Software Figure A-10. Data Tab for Conditioned Chance Node In Figure A-11, the range Mkt_ph2_cond_probs has been defined and it contains the probabilities for each state of Marketing Phase 2 conditioned on each state of Marketing Phase 1. Note that the probabilities sum to 1.0 across the rows. 450 Appendix A: Overview of Spreadsheet Linking Syncopation Software Figure A-11. Excel Range with 9 Probabilities for Conditioned Node To use this named range to initialize the Marketing phase 2 node, you follow the same steps as before, linking the first (top) branch of the node to the range Mkt_ph2_cond_probs. The Data tab of the Node Definition dialog will look like Figure A-12 once the initialization link has been established. 451 Appendix A: Overview of Spreadsheet Linking Syncopation Software Figure A-12. Initialization Link for Conditioned Chance Node As noted above, in a discrete chance node definition, probabilities and values are initialized separately, so if both will be initialized using links you need to define two range names in the spreadsheet: one for probabilities and one for values. In the examples above, only the probabilities are linked. Values can be linked in the same way; simply use the Links button to fill in the Value data in the Node Definition dialog. Initialization links can be very useful if you are developing large models, especially if you are using your DPL model as an "engine" for multiple Excel templates. A.4 Managing Spreadsheet Links Once you've established links for your individual nodes, you can make changes to all the links as a group using the Model Links dialog by selecting Model | Links | Options. See Figure A-13. From this dialog you can: • Change the spreadsheet name or location. • Remove all links to the spreadsheet. • Browse the nodes linked to the spreadsheet. • Create a link to a new spreadsheet. • Convert the spreadsheet to a DPL Calculation Program (DPL Professional and Enterprise only). 452 Appendix A: Overview of Spreadsheet Linking Syncopation Software Figure A-13. Model Links Dialog The Model Links dialog also tells you how many nodes are linked to the spreadsheet. The number of nodes with calculation links is displayed first in the Nodes column of the Linked Spreadsheets list. The number of nodes with initialization links is displayed second, and the total number of nodes is also given. The linked spreadsheet in Figure A-14 has 14 calculation links nodes and 2 initialization links nodes out of 14 nodes in the model. A couple of the nodes in this model have both calculation links and initialization links. After you've set up the links in your model, it's a good idea to use Show Nodes to check that all the nodes are linked to the correct cells; see Figure A-14. This is particularly true if you used Method 3 to establish the links, since you could have chosen the wrong cell by mistake. The dialog shows each linked node, the sheet and range name to which it is linked, the link type and node type. A node is shown twice if it is both calculation-linked and initialization-linked. 453 Appendix A: Overview of Spreadsheet Linking Syncopation Software Figure A-14. Show Linked Nodes Dialog 454 Syncopation Software Appendix B: System Requirements & Compatibility with Older Releases B System Requirements and Compatibility with Older Releases DPL 8 is compatible with Windows XP, Vista, 7 and 8. In order to be able to link to spreadsheets, you need to have Excel for Office 2003, 2007, 2010 or 2013. To use the Excel Side Interface, you need Excel 2007, 2010 or 2013. A minimum of 25 MB of free disk space is required. For a complete install with all documentation, approximately 45 MB is required. A display with resolution 1280 by 800 or higher is required. A larger, higher resolution screen gives a better modeling experience. DPL 8 is compatible with previous releases of DPL. Decision Analysis Workspace/Project files (.da) from DPL 4.0, 5.0, 6.0 and 7 can be loaded into DPL 8. Note that .da files are called Decision Analysis Workspace files in DPL 7 and 8, and are called Decision Analysis Project files in earlier versions. You can import DPL Influence Diagram files (.inf) from DPL 3.x into a DPL 8 Workspace using File | Import. You can also import DPL Program files (.dpl) in the same manner. You can "back save" a DPL 8 Workspace file to either a DPL 4.0, 5.0, 6.0 or 7 Project/Workspace file using File | Save As. Some information for new features in DPL 8 may be lost. 455 Appendix B: System Requirements & Compatibility with Older Releases 456 Syncopation Software Appendix C: Keyboard Shortcuts Syncopation Software C Keyboard Shortcuts Action Change Conditioning Change node type to most recently changed type Clear Memory (delete unsaved Endpoint Database™, Policy Tree™, Risk Profile, etc.) Clear All Output associated with Model Copy Cut Delete Find Go to most recently active model Go to Node Help New Workspace Open Workspace Paste Play Endpoints Print Redraw Repeat Find Replace Run Decision Analysis using most recent evaluation method (Monte Carlo simulation for continuous models) and produce outputs as specified on the ribbon Run Portfolio Analysis and produce most recently requested portfolio outputs Run most recently requested Tornado Save Workspace Select all Snap to Grid Switch between Influence Diagram/Decision Tree pane Toggle between Graphics/Text Mode in Policy Tree™ and Policy Summary™ Undo View Workspace Manager View Properties View Session Log Zoom Full Zoom In 457 Keyboard Shortcut Ctrl+Y Ctrl+T F9 Ctrl+Shift+F9 Ctrl+C; Ctrl+Insert Ctrl+X; Shift+Delete Delete Ctrl+F Ctrl+F12 F5 F1 Ctrl+N Ctrl+O Ctrl+V; Shift+Insert Alt+F10 Ctrl+P Ctrl+R F3 Ctrl+H F10 Shift+F10 F8 Ctrl+S Ctrl+A Ctrl+G Tab Tab Ctrl+Z; Alt+Backspace (Alt+<-) Alt+F12 Alt+Enter Shift+F12 Ctrl+L; Ctrl+Shift+R Ctrl+> Appendix C: Keyboard Shortcuts Syncopation Software Zoom Out Zoom Previous Ctrl+< Ctrl+E 458 Syncopation Software Appendix D: Glossary of DPL and Decision Analysis Terms D Glossary of DPL and Decision Analysis Terms A Alternative: A state of a decision node or decision event. DPL chooses among alternatives during tree rollback to maximize (or minimize) the objective function. The set of alternatives for a decision is the range of possible actions to take for that decision. Always Gamble: Tells DPL to always gamble on the outcome of a chance event overriding the "Don't Gamble" specification, which is used during the creation of an Event Tornado Diagram. Events with "Always Gamble" specified are never replaced by their expected values. See "Don't Gamble." Arc: See Influence Arc. Array: A one- or two-dimensional set of numbers. Arrays can be used to store related numbers, much as a look-up table is used in a spreadsheet. The syntax for a one-dimensional array is arrayname[column_subscript]. The syntax for a two dimensional array is arrayname[row_subscript][column_subscript]. Row and column subscripts start at zero, i.e., the first element of a two-dimensional array is arrayname[0][0]. Array Formulas: Operations in DPL ordinarily take scalars (single values) as operands and return scalars as results. When an operand that is ordinarily required to be a scalar is replaced with an array, the containing formula is said to be an array formula. An array formula must be enclosed in the special symbols { = and } (the notation used by Microsoft Excel). Array Subscripts: Numbers or formulas used to reference the elements of an array. For example, arrayname[1][3] has subscripts of 1 and 3. Array subscripts can also be formulas. Arrowheads: In the Influence Diagram, the color of an arc's arrowhead indicates the type of conditioning the arc implies. Black arrowheads indicate timing only; blue arrowheads indicate values only; green arrowheads indicate probabilities only; light orange arrowheads indicate both values and probabilities. Asymmetric Node: A decision tree node with branches that lead to different nodes. 459 Appendix D: Glossary of DPL and Decision Analysis Terms Syncopation Software Attribute: A measure of value (Profit, Health Effects, Environmental Effects) tracked for each path of a decision tree during an evaluation. Attributes are usually combined at each endpoint by an objective function, generating a single measure of value that is used during tree rollback. Probability distributions for each attribute and the objective function may be graphed separately. B Base Case Tornado Diagram: Used with probabilistic models; a diagram generated by evaluating the outcome of a model when each chance event is individually set to a high and a low state while all other chance events are set to a nominal state. The Base Case that the results are compared to is the result when all chance events are set to a nominal state. Base Result: The expected value (and certain equivalent, if risk tolerance is used) of the objective function for the initial run of the model in a Value Tornado before any of the sensitivity variables are tested, i.e., with the model as currently defined in the Model Window. The Base Result also establishes the optimal policy for the model. Bayes' Rule: A mathematical method for reversing the order of conditioning in chance events (e.g., used to assign probability when you have the probability of A given B, but need the probability of B given A). The formula for Bayes' Rule is: P(Ai|B)= P(Ai)xP(B|Ai ) / (P(A1)xP(B|A1)+P(A2)xP(B|A2)+…+P(An)xP(B|An)) Beta Distribution: A named distribution supported by DPL. For a detailed description see On-Line Help. Binomial Distribution: A named distribution supported by DPL. For a detailed description see On-Line Help. Branch: An element in a decision tree representing one state of an event. Decision node branches represent alternative choices and chance node branches represent possible outcomes. Branch Block: A modeling option that temporarily removes one or more alternatives from consideration in a given decision node instance. Branch Control: A modeling option that forces the outcome (or branch) of an event to a particular state in a decision tree. 460 Syncopation Software Appendix D: Glossary of DPL and Decision Analysis Terms C Certain Equivalent (CE): The certain amount equivalent to the expected utility of the model, taking risk attitude into account. Specifically, the minimum guaranteed amount a decision-maker would accept in place of an uncertain lottery. When a utility function is specified, the certain equivalent is provided in addition to the expected value. Chance Node: A node in the Influence Diagram or decision tree that represents an event whose outcomes are uncertain. Chance nodes can be either discrete or continuous. Chi Distribution: A named distribution supported by DPL. For a detailed description see On-Line Help. Chi-Square Distribution: A named distribution supported by DPL. For a detailed description see On-Line Help. Code: A model, or part of a model, written in the DPL programming language. Can be viewed in a Program Window. Command Window: A testing and debugging environment in which you can display or temporarily change any value or calculation in a model. Compilation: Before running an analysis on a model, DPL compiles the model. During compilation, DPL checks for syntax and other errors and prepares the model for evaluation by the DPL engine. Conditional Decision Policy: A policy containing decisions which will be made after initial uncertainties are resolved. The optimal alternative may depend on the state of the uncertainties, and may therefore be different in different parts of the decision tree. Conditioned: When a value or event has separate numbers or formulas for either its values or probabilities or both depending upon the states of one or more other events. For example, if Costs = 0 if Develop Drug is No and Costs = Development Costs + Launch Costs if Develop Drug is Yes, then Costs is conditioned by Develop Drug. See also Dependency. Constraint Function: An "if-then-else" expression that tests a condition and specifies different objective functions for true or false outcomes or prunes the tree, eliminating any further branches. 461 Appendix D: Glossary of DPL and Decision Analysis Terms Syncopation Software Continuous Chance Node: A node in an Influence Diagram or decision tree that represents an event whose outcomes are uncertain. A continuous chance node does not have a discrete number of states. To generate a distribution of outcomes for a continuous chance node, samples are continuously drawn from a named distribution. The graphical symbols for a continuous chance node are dark green ovals in the Influence Diagram and dark green circles in the Decision Tree. Control, Branch: See Branch Control. Controlled Node: A node in the Influence Diagram representing an event whose states are set as an action on a branch in a decision tree. Controlled nodes do not appear in the decision tree. The graphical symbol for a controlled node is a white rectangle in the Influence Diagram. A controlled node is different from a controlled branch on a node (see Branch Control). Conversion: DPL can convert spreadsheet models to blocks of DPL code. The resulting code can be included in DPL models or edited and run as a stand-alone DPL program. Cumulative Distribution: a graph generated by DPL whose Xcoordinates represent outcome values and whose Y-coordinates represent the sum of the probabilities of all possible outcomes less than or equal to the associated outcome value. In the Home | Run group, you can choose to have DPL generate and display cumulative distributions for the optimal policy or all initial decision alternatives. Also, if you have defined more than one attribute for the model, a separate cumulative distribution for each of the attributes can be generated. The cumulative distributions are displayed in a Risk Profile Chart. Current Model: The model that has been most recently run or compiled. The current model’s item in the Workspace Manager is indicated by bold face type. Cycle: A set of nodes and influence arcs that create a loop in which a node depends directly or indirectly on itself. An Influence Diagram may not include cycles. 462 Syncopation Software Appendix D: Glossary of DPL and Decision Analysis Terms D DDE: See Dynamic Data Exchange. Decision Alternative: See Alternative. Decision Node: A node in the Influence Diagram or decision tree representing an event that the decision-maker has control over, i.e., an event with alternative choices for the decision-maker to choose among. During evaluation, the alternative that maximizes (or minimizes) the objective function is chosen. The graphical symbols for a decision node are a yellow rectangle in the Influence Diagram and a yellow square in the decision tree. Decision Sensitive: A variable in a model such that when its value is changed, a different decision policy is optimal from that which is optimal for the variable at its current setting. Decision Tree: A graphical representation of a decision model that displays the sequence of events including the order of decisions and uncertainties and when get/pay expressions occur. Decision Tree pane: A pane of the Model Window that provides a graphical interface to manipulate the decision tree in a model. Default State: The state of an event that is user-defined as the "default" setting for purposes of linking to an Excel spreadsheet. If the state of an event is unknown for a particular path on an asymmetric tree, DPL assumes the event is in its default state. Default Tree: The decision tree that DPL builds automatically in the Decision Tree as you develop a model in the Influence Diagram. DPL builds the Default Tree based on the decision nodes, chance nodes, value nodes and influence arcs you define in the Influence Diagram. The Default Tree is always symmetric. DPL will continue to build the Default Tree until you edit the decision tree yourself directly in the Decision Tree. Definition Section: A section of a DPL program which specifies and initializes the elements of a decision model — decisions, uncertainties, variables, values, series, arrays, etc. The Influence Diagram is a graphical representation of a definition section. Dependency: Node B depends on node A if one of the data expressions for B includes A, but B does not have a separate data expression for each state of A. For example, if Revenues = Units * Price, then Revenues depends on Units and Price. See also Conditioned. 463 Appendix D: Glossary of DPL and Decision Analysis Terms Syncopation Software Deterministic Model: A model that only has deterministic relationships — there are no uncertainties. The model contains only value and decision variables, and yields a single output for a single set of inputs or setting of each variable. A spreadsheet is an example of a deterministic model. Discrete Chance Node: A node in the Influence Diagram or decision tree that represents an event whose outcomes are uncertain. A discrete chance node models the uncertainty of the event with a discrete number of states (or outcomes). Probabilities are specified for each state or a named distribution is given. The graphical symbols for a discrete chance node are bright green ovals in the Influence Diagram and bright green circles in the Decision Tree. Discrete Tree Simulation: Simulation method of evaluating models utilizing random sampling of discrete or discretized probability distributions (chance nodes) with a finite number of outcomes. See also Monte Carlo. Display Function: A function that enables you to write text or formatted numbers to the Session Log during an analysis, allowing the writing of custom reports. Distributed Sampling: A method of evaluating models based on Discrete Tree Simulation. In Distributed Sampling, the probabilities of nodes in the tree are represented exactly until the number of samples remaining at a node is small. At this point, normal Discrete Tree Simulation (selecting chance node outcomes randomly) is used for the rest of the tree. Distribution: There are two types of probability distributions in DPL: 1. Chance node data specified as set of discrete states and associated probabilities. 2. Chance node data specified as a named distribution. See Named Distributions. DLL: See Dynamic Link Library. Don't Gamble: A property assigned to a chance node that effectively reduces it to one branch. DPL replaces a chance event with its expected value if the "Don't Gamble" specification has been set. Subsequent variables depending on the state of this event will be assigned values calculated by taking the expected value over the event, where feasible. Downstream Decision: A decision which occurs in a decision tree after initial uncertainties are resolved. Downstream decisions are sometimes called real options. DPL Program: A description of a decision model in DPL's own language (i.e. DPL Code). It contains all the structure and data necessary to analyze a model and can be used in place of an Influence Diagram and decision tree, or as documentation for a graphic model. 464 Syncopation Software Appendix D: Glossary of DPL and Decision Analysis Terms Dummy Node: A node that represents an intermediate calculation in a model. It contains no data and is ignored during analysis. The graphical symbol for a dummy node is the same as a value node: a blue rounded rectangle in the Influence Diagram. Dummy nodes are included for clarity or communication only. Dummy nodes usually represent intermediate calculations in a linked spreadsheet. Dummy nodes do not appear in decision trees. Dynamic Data Exchange: A Microsoft Windows communications protocol that allows Windows applications to communicate with each other. DPL optionally uses DDE to communicate with Excel. See also OLE Automation. Dynamic Link Library: A file containing functions, instructions or programs for use by DPL during analysis. E Endpoint: The terminal point of each path through a decision tree. The number of endpoints (or leaf nodes) of a decision tree equals the number of paths through the tree. Endpoints are represented as blue triangles: 1. Each blue triangle in a Policy Tree™ is an endpoint. 2. In the Decision Tree because the decision tree is schematic, blue triangles can represent more than one endpoint. In the Decision Tree, an endpoint triangle serves as the point of connection when you add a node to the tree. Endpoint Database™: The complete set of endpoints that result from running a decision model. The Risk Profile for the best alternative of the initial decision of a model is created from the subset of endpoints in the Endpoint Database™ that are part of the optimal policy. Certain additional outputs can be created from the Endpoint Database™ without the need to re-run the entire model. Endpoint Database™, Displaying: The process of displaying a recorded Endpoint Database™ in a spreadsheet-like tabular report. Displaying of the Endpoint Database™ can take a significant amount of memory and may not be possible with very large models. Occasionally with large models, there is enough computer memory available to record, but not to display the Endpoint Database™. 465 Appendix D: Glossary of DPL and Decision Analysis Terms Syncopation Software Endpoint Database™, Recording: The process of saving the Endpoint Database™ from a model run in order to re-use it later. Recording of the Endpoint Database™ can take a significant amount of memory and may not be possible on some computers with very large models. Recording the Endpoint Database™ is most appropriate and useful with models that have complex value models, and therefore have relatively long runtimes per endpoint calculation. Erlang Distribution: A named distribution supported by DPL. For a detailed description see On-Line Help. Event: A node with a set of possible states (outcomes or alternatives). In DPL, decision nodes and chance nodes are events. Event Tornado Diagram: A sensitivity analysis that compares the range of uncertainty of each chance event in a model. Expected Value (EV): The probability-weighted average of all possible outcomes. Exponential Distribution: A named distribution supported by DPL. For a detailed description see On-Line Help. Export Node / Export Variable: A node linked to a specific cell in a spreadsheet to provide input for the spreadsheet model. DPL exports data to the cell. Data exported by DPL will overwrite any information contained in the cell. F Fast Sequence Evaluation: The default method of calculation DPL uses for an analysis. This is the fastest evaluation method that calculates the exact expected value. Certain model structures are not suitable for Fast Sequence Evaluation and should instead be analyzed using Enumerate Full Tree. Fat Policy™: The capability of DPL to display in the Policy Tree™ the expected values of all attributes in addition to the objective function at any point in the tree. Frequency Histogram: A view option in the Risk Profile Chart. It plots the probability of occurrence for intervals of outcome values as a vertical bar. Full Tree Enumeration: An evaluation method that evaluates each path of the tree completely. This is in contrast to Fast Sequence Evaluation. 466 Syncopation Software Appendix D: Glossary of DPL and Decision Analysis Terms G Gamble: An evaluation action taken by DPL for a chance event when evaluating a decision tree. When DPL gambles on a chance event, it creates the alternative outcomes of the chance event, assigns them a probability and determines the value of the objective function for each outcome. Gamma Distribution: A named distribution supported by DPL. For a detailed description see On-Line Help. Gaussian Distribution: (Also called Normal Distribution.) A named distribution supported by DPL. For a detailed description see On-Line Help. Geometric Distribution: A named distribution supported by DPL. For a detailed description see On-Line Help. Get/Pay Expressions: Expressions specified on branches of the decision tree to associate values with branches and endpoints. "Get" expressions are added to the value function and "Pay" expressions are subtracted. If a model has multiple attributes, the get/pay expression must contain expressions separated by commas for each attribute. H Hide Intermediates: An option when creating a model from Excel that prevents intermediate cells from being displayed in the Cell Names dialog used to select which spreadsheet cells to include in the model. If intermediate are included, the linked nodes will be Dummy Nodes. Hyperexponential Distribution: A named distribution supported by DPL. For a detailed description see On-Line Help. I Import Node / Import Variable: A node linked to a specific cell in a spreadsheet that retrieves the output of spreadsheet model calculations for use in DPL analysis. A DPL Import Node does not contain any data in DPL. Influence Arc: An arc drawn from one node to another in an Influence Diagram. An influence arc indicates timing or conditional dependence of nodes. An arc from node A to node B means A influences B. 467 Appendix D: Glossary of DPL and Decision Analysis Terms Syncopation Software Influence Diagram: a graphical representation of the components of a decision problem — decisions, uncertainties, and values — and the relationships among them. Comprised of nodes and influence arcs. Influence Diagram pane: A pane of the Model Window that provides a graphical interface to manipulate the Influence Diagram in a model. Initial Decision: A decision in a decision tree that occurs before any chance events. Initial Decision Alternatives Tornado: A diagram that displays a Base Case Tornado for each alternative of the first decision node in the decision tree. Initial Uncertainties: Chance events in a decision tree that occur before a downstream decision. Interval: A subset within a Series in which (one or more) elements are given by the same expression. For example, a series defining the number of days in each year from 2013-2016 would have an Interval from 2013– 2015 in which each element would have a value of 365. The Interval for 2016 would be a single element Interval with a value of 366. J Joint Probability: The probability associated with a particular set of outcomes for multiple separate events. The joint probability is calculated by taking the marginal probability for the selected outcome of each event and multiplying them together. L Laplace Distribution: A named distribution supported by DPL. For a detailed description see On-Line Help. Links: Connections to spreadsheets, databases or DPL programs that allow DPL to perform calculations or obtain data. Local Variables: Nodes that are not linked to a cell or cells in a spreadsheet; to a record in a database; nor to a DPL program. Logistic Distribution: A named distribution supported by DPL. For a detailed description see On-Line Help. Lognormal Distribution: A named distribution supported by DPL. For a detailed description see On-Line Help. 468 Syncopation Software Appendix D: Glossary of DPL and Decision Analysis Terms Lottery: An event whose outcome depends on chance. M Marginal Probability: The probability that a given outcome of a chance event will occur. For example, if there is an even chance of sun or rain, the Marginal Probability of rain is 0.5. Maximize: Instructs DPL to choose the decision policy that returns the maximum expected value for the Objective Function. Maxwell Distribution: A named distribution supported by DPL. For a detailed description see On-Line Help. Minimize: Instructs DPL to choose the decision policy that returns the minimum expected value for the Objective Function. Model Window: Graphical interface for designing decision models and running analyses. Contains both the Influence Diagram pane and the Decision Tree pane. Modified Monte Carlo Simulation: method of evaluating models based on Discrete Tree Simulation. In Modified Monte Carlo, samples are first allocated to branches of chance events using the branch probabilities rather than completely random sampling. Monte Carlo Simulation: Method of evaluating models utilizing random sampling of continuous probability distributions (chance nodes) with a set sample size. See also Discrete Tree Simulation. Multi-attribute Utility Analysis (abbreviated MUA or MAU): A method for making decisions where the value function depends on more than one factor, such as cost and schedule. DPL allows you to track multiple attributes using independent value expressions and combine them in a single utility function. Multidimensional Value Nodes: Value nodes that refer to one- or twodimensional arrays or a series in a DPL model. 469 Appendix D: Glossary of DPL and Decision Analysis Terms Syncopation Software N Name: A string of characters used to identify a node, string or constant. Nodes will be referenced by their names when used as variables. Named Distributions: Pre-defined probability distributions which can be assigned to chance events in DPL based on input for one or more parameters. DPL supports 21 different Named Distributions, such as the Normal Distribution and the Beta Distribution. Negative Binomial Distribution: A named distribution supported by DPL. For a detailed description see On-Line Help. Node: A graphical representation of a decision, value, uncertainty, strategy table, or controlled event. Normal Distribution: (Also called Gaussian Distribution.) A named distribution supported by DPL. For a detailed description see On-Line Help. O Objective Function: An expression defining the quantity to be optimized during the analysis. Generally used to express the relationship between multiple attributes. OLE Automation: A Microsoft Windows protocol that allows one Windows application to control another. DPL normally uses OLE Automation to communicate with Excel. OLE Automation may be slower than DDE but is more robust. Optimal Policy: A set of decision alternatives that optimize the Objective Function. Optimization: Allows DPL to take advantage of special structural properties of the model to reduce computation time. Option Value Chart: A chart that displays the "option value", or incremental value added by flexibility in each downstream decision in the tree. Outcome: A state of a chance node or chance event that DPL evaluates during rollback by combining together the probability associated with the outcome and the value associated with the outcome to calculate its expected value. 470 Syncopation Software Appendix D: Glossary of DPL and Decision Analysis Terms P Pascal Distribution: A named distribution supported by DPL. For a detailed description see On-Line Help. Perform Subtree: A technique allowing you to repeat a section of a decision tree in more than one place in the decision tree. Allows the subtree to be drawn once and performed several times. Poisson Distribution: A named distribution supported by DPL. For a detailed description see On-Line Help. Policy Summary™: An output generated by DPL which displays each event and its associated distribution under the optimal policy resulting from the analysis. You can also use the Policy Summary™ to compare the optimal policy distributions to distributions associated with a range of the Risk Profile or to when a decision or chance is in a particular state. Policy Tree™: A graphical representation of the optimal policy for every decision in a model given the outcomes of all the uncertainties in the model. Shows all possible paths through a decision tree and indicates the value of all expressions in the model, the probabilities associated with each chance event outcome, the rollback values (EV or CE) for each node, and the optimal policy choices for each decision. Prob Function: A function that returns the probability of an event at any point in an analysis at which the state of the event is unknown. This function is useful in decision problems in which the probability of an event is itself a major consideration in making decisions. Probabilistic Base Case Tornado Diagram: Used with probabilistic models; a diagram generated by evaluating the outcome of a model when each chance event is individually set to a high and a low state while all other chance events are allowed to vary across their states. The base run that the results are compared to will equal the expected value of the model as in a Risk Profile or a Policy Tree. Probabilistic Model: A model in which some inputs are described with probability distributions and which generates probability distributions as outputs. A probabilistic model in DPL has at least one chance event. If the model has been developed graphically in the Model Window then a probabilistic model will have either continuous or discrete chance nodes or both. 471 Appendix D: Glossary of DPL and Decision Analysis Terms Syncopation Software Program Window: Provides an interface for creating, editing and compiling DPL program files. Converted spreadsheets can be viewed in this window. Promoting Terms: Moving elements of get/pay expressions to nodes which are encountered earlier in the evaluation. The advantage to this approach is that terms can be calculated in the tree as soon as all conditioning events are in known states, rather than waiting until the end of the path to calculate all the terms at once. In general, promoting terms reduces run time. R Rainbow Diagram: An analysis tool which varies a single value over a user specified range and displays the impact on the expected value or certain equivalent and changes to the optimal decision policy. Rayleigh Distribution: A named distribution supported by DPL. For a detailed description see On-Line Help. Real Option: See Downstream Decision. Reduction: A DPL tool used to reduce an output probability distribution (Risk Profile) to a single chance event. The reduced event will be described by a discrete probability distribution with a user specified number of states. The output in the form of DPL code is written to the Session Log or pasted as a discrete chance node to a specified model. Risk Attitude: Decision-maker's willingness to gamble relative to the expected value. One who is not willing to gamble in the face of a positive expected value is "risk averse," while one who is willing to gamble in the face of a negative expected value is "risk seeking." One who makes decisions based on expected value is "risk neutral." Risk Profile: The probability distribution for a specified policy comprised of the entire range of outcomes that are possible given the policy. Risk Profile Chart: A window displaying a probability distribution for a specified policy. A Risk Profile Chart displaying a cumulative probability distribution of the optimal policy is a typical output of a DPL decision analysis. Risk Profile Dataset: The underlying probability distribution data for a specified policy, which is typically displayed in a Risk Profile Chart. Risk Profile Datasets may be saved in a Workspace without being displayed in a Risk Profile Chart. 472 Syncopation Software Appendix D: Glossary of DPL and Decision Analysis Terms Risk Tolerance Coefficient: Measure of the decision-maker's attitude towards risk. Common definition for risk tolerance r is the highest value for which you would accept a gamble in which you could win r or lose r/2 with equal probability. In DPL, the Risk Tolerance Coefficient describes the incorporation of risk when the built-in exponential utility function is used. Roll Forward: The first phase of a DPL decision analysis run, in which DPL calculates an outcome value and joint probability for each path in the decision tree. As each path is traversed, get or pay expressions are evaluated and combined to provide the path outcome value. If the model uses multiple attributes, each endpoint will have multiple outcome values. Roll Back: The third phase of a DPL decision analysis run, in which DPL uses the outcome values and joint probabilities of each endpoint to calculate expected values or expected utilities at each node in the decision tree. At each chance node in the Rollback procedure, DPL determines the expected utility/value by calculating the probability-weighted average of outcome values. At each decision node in the Rollback, DPL determines the alternative providing the maximum or minimum value, as appropriate. The aggregate of these optimal decision alternatives comprises the optimal decision policy. Rolled-back Expected Value: The value of the objective function at a node in the Policy Tree™ given the states of all preceding events on the path leading into the node, and the expected value of all subsequent outcomes of chance events and the optimal selection of alternatives for all subsequent decision events. Root Node: The node on the decision tree that does not have any branches leading into it (the first node on the far left of the decision tree). Every tree contains a root node. 473 Appendix D: Glossary of DPL and Decision Analysis Terms Syncopation Software S Sampling: Approximating a full range of outcomes by evaluating a subset number of paths. Scenario: A path through the tree, from the root to an endpoint, that is a combination of specific decision alternatives and chance event outcomes. This path, a Scenario, represents a single possible state of the world. Scenario Risk Profile™: A Risk Profile in which the scenarios included in the Risk Profile are restricted to a particular subset of the optimal scenarios, e.g., a particular combination of states of one or more events. A Scenario Risk Profile™ can be specified from either the Policy Tree™ or via a dialog. Schematic Diagram: A type of decision tree diagram that does not show a full representation of the tree. Most decision trees appear as schematic diagrams in the Model Window. Sensitivity Analysis: Allows you to investigate the impact of a node or group of nodes on the Expected Value and/or Optimal Policy of a model. There are many types of Sensitivity Analyses. See Rainbow Diagram, TwoWay Rainbow Diagram, Value Tornado Diagram, Base Case Tornado Diagram, Probabilistic Base Case Tornado Diagram, Initial Decision Alternatives Tornado Diagram, and Event Tornado Diagram. Separable Value Model: A model whose value function contains terms that are combined together by addition and subtraction. It is possible to promote terms in these models, which may allow for faster calculations. Sequence Section: Systematic English-language descriptions of decision tree structures written in DPL code. The Sequence Section tells DPL in what order to evaluate nodes and get/pay expressions. Series: A type of variable that allows you to define a one-dimensional set of values/formula using intervals. Subsequent elements of a series can depend upon earlier elements. Similar to a a set of formulas in a row in Excel where column n + 1 depends upon column n. Session Log: A pane located within the Workspace Window which maintains a record of the DPL session. Error messages and DPL commands performed in the Model Window will be automatically written to the Session Log. Information from an analysis can also be written to the Session Log (see Display Function). 474 Syncopation Software Appendix D: Glossary of DPL and Decision Analysis Terms Spreadsheet Model: A spreadsheet which contains a set of calculations which evaluates one scenario of a decision analysis. DPL links to the spreadsheet model in order to rapidly evaluate a wide range of scenarios based on specified levels of uncertainty. Spreadsheet Conversion: See Conversion. State: One of a discrete number of possible settings for an event. The states of a decision event are referred to as alternatives. The states of chance event are referred to as outcomes. Each branch of an event in the decision tree represents a state. State Function: A function that returns a numerical value representing the state of an event. It can be used to process and test any event's state. Statename Function: Returns the name of a state of an event as a string ("High", "Low", etc.) Strategy: A single set of alternatives for all of the decisions contained in a Strategy Node. Strategy Node: A node which represents a set of decisions to be made at one point in time. The different alternatives in a strategy node are called strategies. The complete set of strategies in a strategy node is referred to as a strategy table. Each strategy is defined by an alternative for each decision included in the strategy node. The graphical symbol for a strategy node is a yellow rectangle in the Influence Diagram with attached yellow rectangles for each decision node that is contained in the strategy node. In the Decision Tree, the graphical symbol is a yellow square. During evaluation a strategy node is evaluated in the same manner as a decision node, i.e., one alternative is chosen that maximizes (or minimizes) the objective function. Strategy Table: A collection of decision nodes and a set of defined strategies in a strategy node. Subscript: Used to reference particular elements of an array or series. For a series a subscript ranges between the lower and upper boundaries of the series. For using subscripts with arrays, see Array Subscripts. Subtree: A section of decision tree from a given node in the tree forward (i.e., to the right). Symmetric Node: A node in a decision tree whose branches all lead to the same subsequent event. Symmetric Tree: A decision tree in which every node is symmetric. 475 Appendix D: Glossary of DPL and Decision Analysis Terms Syncopation Software T Time Series Percentiles: A graph that displays the range of outcomes over several time periods (e.g., yearly cash flows over a 10 year period). Tolerance: See Risk Tolerance Coefficient. Tornado Diagram: A sensitivity analysis that displays the value and policy impacts of varying input values. See Value Tornado Diagram, Base Case Tornado Diagram, Probabilistic Base Case Tornado Diagram, Initial Decision Alternatives Tornado Diagram, and Event Tornado Diagram. Triangular Distribution: A named distribution supported by DPL. For a detailed description see On-Line Help. Two-Way Rainbow Diagram: An analysis tool which varies two values over user-specified ranges and displays the impact on the expected value, or certain equivalent, and changes to the optimal decision policy. U Uncertainty: See Chance Nodes. Uniform Distribution: A named distribution supported by DPL. For a detailed description see On-Line Help. User Library: A Dynamic Link Library (DLL) file which contains a set of functions or a program (to be run during a DPL analysis) and language that allows communication with DPL. User Libraries are called from commands in the decision tree or program file. User Library Function: An external set of commands which perform a routine or calculation during a DPL analysis. User Library Functions are stored in a User Library, which has a file extension of .DLL. Utiles: The unit of measurement for the transformation performed by the Utility Function. In a model incorporating risk tolerance, DPL selects the policy which maximizes the expected utility (i.e. greatest utile value). The inverse of the utility function converts utiles to certain equivalents. Utility Function: A mathematical expression which captures the decisionmaker's Risk Attitude. The Utility Function translates the outcomes of a value model into utiles. In DPL, the built-in exponential utility function is defined as: u(x)=-e(-x/r), where x is the value to be converted to utiles and r is the risk tolerance coefficient. Alternatively, you may specify a userdefined utility function. 476 Syncopation Software Appendix D: Glossary of DPL and Decision Analysis Terms V Value Correlations Chart: A chart that displays the correlation coefficient between each value in the model (including values associated with decision and chance events) and the objective function. Value Correlations Charts help you determine which variables may be driving your objective function in either a positive or negative direction. Value Model: A model that defines a particular value of interest (e.g., costs, profits, social welfare) from other data. A DCF (discounted cashflow) valuation spreadsheet is an example of a value model. Value Node: A node in the Influence Diagram representing a number or an expression. Its graphical symbol is a blue rounded rectangle. Value of Control: The difference between the expected value of the model and the expected value of the model when a particular uncertainty is changed into a decision. Value of Perfect Information: The difference between the expected value of the model and the expected value of the model when the outcome of a particular uncertainty is known before a decision is made. Value Tornado Diagram: Evaluates the outcome of a model when a selected set of variables are each set individually to high and low values while all other variables are treated in the way in which they are defined in the base model. If the model is deterministic than all other variables are held at their current value. If the model is probabilistic, then all other variables are allowed to take on their full range. The low and high results for each variable are compared to the results of the full model run (called the Base Result). When used on a deterministic model, the diagram is used to help determine which variables have the greatest effect on the objective function and/or are decision sensitive, if applicable. Those variables with the greatest impact or which are decision sensitive may subsequently be modeled as uncertainties. When used with probabilistic models, Value Tornado Diagrams can only be run on individual states of events or conditioned values. For probabilistic models, Value Tornado Diagrams may not be as useful as Event Tornado Diagrams or Base Case Tornado Diagrams. 477 Appendix D: Glossary of DPL and Decision Analysis Terms Syncopation Software W Weibull Distribution: A named distribution supported by DPL. For a detailed description see On-Line Help. Workspace Manager: A pane in DPL, located within the Workspace Window, which lists all documents and stored Risk Profile data associated with the current Workspace. The Workspace Manager can be used to rename or delete items, access saved data or switch to another window. 478 Index Syncopation Software Index alternative/outcome grouping asymmetric..............................187 mixed ......................................210 arrays ................................. 253, 408 asymmetric alternative/outcome grouping .................................187 asymmetric tree ...........................183 attachment points ........................189 Attributes, multiple.......... See multiple attributes Base Case Tornado ....................... 67 Bayesian revision .........................215 blue triangle ................................189 calculation links establishing .............................438 case sensitivity.............................394 certain equivalent ........................370 chance keyword ...........................400 chance node continuous ..............................159 discrete .................................... 59 change node types ....... See node types, changing Command window .......................424 comments ...................................393 Compare ............................ See Policy Summary™:Comparison compatibility ................................455 Conditioning via arc type .............................. 46 via Node Definition.................... 41 const keyword .............................410 constraint function .......................250 continuous chance node ...............159 controlled keyword .......................403 Conversion options.......................428 converting Models to Programs .................394 Spreadsheets to Programs ........425 data input tree selection in ............................... 42 decide keyword............................412 decision keyword .........................400 decision node ............................... 37 decision sensitive .......................... 58 decision tree attaching nodes .......................189 moving nodes ..........................189 Decision Tree pane ......................... 8 default arc types ..........................222 default state ................................194 Default Tree .......................... 39, 103 default...case ...............................405 Definition section ................. 393, 399 discrete chance node .................... 59 default probabilities................... 61 default values ........................... 61 Document Navigator ....................... 9 dont keyword ..............................417 downstream decision..................... 91 downstream decisions adding.....................................203 and real options .......................203 DPL Code ................. See DPL Program DPL Program ...............................391 DPL variable names....................... 43 DPLMC.DLL..................................401 edit undo .....................................317 Endpoint Database™ ....................305 Exporting ................................330 Filtering ...................................310 Importing ................................334 Merging...................................338 Playing ....................................315 Reconnecting ...........................327 Recording ................................306 Saving .....................................322 Sorting ....................................314 state names/numbers ..............331 error bars ....................................291 event tornadoes ...........................384 deterministic ............................384 probabilistic .............................384 excel clause .................................400 exit option ...................................203 expected value of perfect information / control ..................................107 Fat Policy ....................................245 479 Index Syncopation Software gamble keyword .......................... 413 get keyword ................................ 417 Get/Pay expressions adding to tree ......................... 192 copy and paste ........................ 287 deleting .................................. 209 using multiple.......................... 196 given keyword ............................. 402 if/then/else directive .................... 423 imperfect information................... 216 include directive .......................... 422 influence arcs ................................ 32 arrowhead colors ..................... 232 bending .................................... 46 changing types ........................ 223 create short cut ......................... 40 default types ........................... 222 summary................................. 232 timing ..................................... 103 Influence Diagram pane ...................8 Initial Decision Alternatives tornado 70 initialization links establishing ............................. 445 for conditioned nodes .............. 449 integer keyword .......................... 411 keyboard shortcuts ...................... 457 learning ...................................... 215 Learning events ........................... 319 mixed alternative/outcome grouping .............................................. 210 Model Window .................................8 splitter ........................................8 models building..................................... 23 Monte Carlo simulation................. 141 MUA ............... See multiple attributes multidimensional value nodes ....... 253 In Get/Pay expressions ............ 300 multiple attributes ....................... 235 adding attributes ..................... 241 in Get/Pay expressions ............. 243 Policy Tree™ with .................... 245 naming models .............................. 32 Node Definition dialog data input tree .......................... 28 node types changing ................................... 59 number of intervals...................... 290 Objective dialog ........................... 242 objective function ........................ 235 Option Value Chart™ ................... 361 default states in....................... 362 options directive .......................... 423 pay keyword ............................... 417 perform keyword ......................... 416 Perform Reference ....................... 228 perform subtree .......................... 227 Perform Target ............................ 228 policy dependent probability ......... 106 Policy Output Options .................... 76 Policy Summary™ ........... 91, 106, 352 Comparison ............................. 355 Policy Tree™ ......................... 78, 341 expand to level ........................ 190 Filtering .................................. 344 Format | Display ........................ 84 introduction............................... 52 predecessor................................. 100 quit keyword ............................... 416 Rainbow Diagrams ............... 113, 248 policy changes......................... 381 real option .................................. 203 reserved word ............................. 394 results View | EV(CE) ......................... 370 Risk Profile charts ....................................... 85 cumulative ................................ 86 datasets .................................... 85 frequency histogram .................. 88 initial decision alternatives ....... 231 number of intervals ................... 86 reading cumulative .................... 86 statistics ................................... 90 risk tolerance .............................. 365 coefficient ............................... 369 Scenario Risk Profiles™ ................ 348 sensitivity analysis comparison of types ................ 388 types ...................................... 375 Sequence section................. 393, 412 series .................................. 253, 406 Session Log .....................................7 set keyword ................................ 417 spreadsheet links ......................... 437 calculation ............................... 437 480 Index Syncopation Software initialization .............................437 managing ................................452 types.......................................437 stop keyword ...............................416 strategy table ..............................125 Adding decisions to ..................127 Creating strategies ...................133 Defining strategies ...................135 string keyword .............................410 subtree performing ..............................227 successor ....................................100 system requirements ....................455 time series percentiles ..................277 two-way rainbow diagram ............375 use tolerance/utility......................418 utility function..............................372 Value Correlations ........................110 value keyword .............................403 value node ................................... 23 value of perfect information / control ..............................................107 Value Tornado ......................... 53, 55 color changes ........................... 56 setup ....................................... 53 Workspace Manager ........................ 6 non-window items..................... 85 481