1
Optical Power and Energy Meter
PM200
Operation Manual
2011
Version: 1.0.0
Date:
29.07.2011
Copyright © 2011 Thorlabs
Contents
Foreword
3
1 General Information
4
1.1 Safety
1.2 Ordering Codes and Accessories
1.3 Requirements
1.3.1 Hardware Requirements
1.3.2 Software Requirements
1.3.3 Interface Requirements
2 Installation
4
5
7
7
7
7
8
2.1 Parts List
2.2 Operating Elements
2.3 Getting Started
8
9
10
3 Operating Instruction
11
3.1 Attenuation Correction
3.2 Wavelength Correction
3.3 Bandwidth
3.4 Range Control
3.5 Measurement Views
3.5.1 Numeric View
3.5.1.1 Subpanels
3.5.2 Needle View
3.5.3 Graph and Statistics Display
3.5.4 Calculator
3.5.5 File Manager
3.6 Zoom
3.7 Delta
3.8 Zeroing
3.9 Min/Max Marker Reset
3.10 Additional Measurement Settings
3.11 Settings
3.12 Analog Output
3.13 Auxiliary Input and Output
3.14 Charging the Battery
3.15 Sensor Dependent Functions
3.15.1 Photodiode Sensors
3.15.2 Thermal Sensors
3.15.3 Pyroelectric Sensors
3.16 Application Note
12
12
14
14
15
15
16
19
19
21
22
23
23
23
24
24
25
26
26
26
27
27
29
31
34
4 Computer Interface
4.1 PM200 Utility Software
4.2 PM200 Software Update
4.3 Using the Instrument Drivers
4.4 PM200 SCPI Commands
4.4.1 An Introduction to the SCPI language
4.4.2 IEEE488.2 Common Commands
4.4.2.1 Command Summary
4.4.2.2 Command Reference
4.4.2.3 PM200 specific SCPI Command Reference
4.4.3 Simple LabVIEW Example using SCPI commands
5 Maintenance and Service
5.1 Troubleshooting
6 Appendix
6.1 Sensor Connector Pinning
6.2 Technical Data
6.3 Certifications and Compliances
6.4 Warranty
6.5 Copyright
6.6 Thorlabs 'End of Life' Policy (WEEE)
6.7 Listings
6.7.1 List of Acronyms
6.7.2 Thorlabs Worldwide Contacts
39
39
43
44
44
44
49
49
50
51
58
62
62
63
63
64
67
68
69
70
71
71
72
We aim to develop and produce the best solution for your application
in the field of optical measurement technique. To help us to live up to
your expectations and improve our products permanently we need
your ideas and suggestions. Therefore, please let us know about
possible criticism or ideas. We and our international partners are
looking forward to hearing from you.
Thorlabs GmbH
WARNING
Sections marked by this symbol explain dangers that might result in
personal injury or death. Always read the associated information
carefully, before performing the indicated procedure.
ATTENTION
Paragraphs preceeded by this symbol explain hazards that could
damage the instrument and the connected equipment or may cause
loss of data.
NOTE
This manual also contains "NOTES" and "HINTS" written in this form.
Please read these advices carefully!
© 2011 Thorlabs
3
PM200
1
General Information
The PM200 Handheld Optical Power and Energy Meter is designed to measure
the optical power of laser light or other monochromatic or near monochromatic
light sources and the energy of pulsed light sources.
The space-saving, battery powered design and compatibility to all Thorlabs “CSeries” Photodiode, Thermal, Pyroelectric sensors, and custom Photodiode,
Thermal and Pyroelectric detectors, combined with a fast USB device interface
open a wide range of applications in Manufacturing, Quality Control, Quality
Assurance, and R&D for stationary and field use.
The provided software, including drivers and applications for LabVIEW and C
makes it easy to integrate the instrument in test and measurement systems.
The PM200 can be operated through its auto-detecting position sensor and the
rotatable kick-stand in both a bench-top style landscape view and a hand-held
style portrait view.
Please refer to the user manual on the data carrier supplied with the unit for
detailed function description.
1.1
Safety
Attention
All statements regarding safety of operation and technical data in this instruction
manual will only apply when the unit is operated correctly as it was designed for.
The power meter PM200 must not be operated in explosion endangered
environments!
All modules, sensors and externally connected devices must only be operated
with properly shielded connection cables.
Only with written consent from Thorlabs may changes to single components be
carried out or components not supplied by Thorlabs be used.
Do not remove covers!
This precision device is only serviceable if properly packed into the complete
original packaging including the plastic foam sleeves. If necessary, ask for a
replacement package.
4
© 2011 Thorlabs
1 General Information
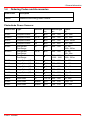
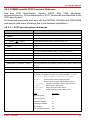
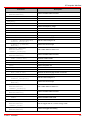
1.2
Ordering Codes and Accessories
Order Code
Description
PM200
Handheld Power/Energy Meter Console
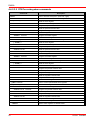
Photodiode Power Sensors:
Order Code
Type
Detector Aperture Wavelength
mm
nm
Power
W
S120C
Compact Sensor
Si
9.5
400 - 1100
50n - 50m
S120VC
Compact Sensor
UV-Si
9.5
200 - 1100
50n - 50m
S121C
Compact Sensor
Si
9.5
400 - 1100
500n - 500m
S122C
Compact Sensor
Ge
9.5
700 - 1800
50n - 40m
S130C
Slim Sensor
Dual Range
Si
9.5
400 - 1100
5n - 5m
500n - 500m
S130VC
Slim Sensor
Dual Range
UV-Si
9.5
200 - 1100
5n - 5m
50n - 50m
S132C
Slim Sensor
Dual Range
Ge
9.5
700 - 1800
1200 - 1800
5n - 5m
500n - 500m
S140C
Integr. Sphere (1”)
Si
5.0
350 - 1100
1µ - 500m
S144C
Integr. Sphere (1”)
InGaAs
5.0
800 - 1700
1µ - 500m
S142C
Integr. Sphere (2”)
Si
12
350 - 1100
10µ - 20
S145C
Integr. Sphere (2”)
InGaAs
12
800 - 1700
1µ - 3
S145C
Integr. Sphere (2”)
InGaAs
12
800 - 1700
10µ - 20
S150C
Fiber Head
Si
3.6 x 3.6
350 - 1100
100p - 5m
S151C
Fiber Head
Si
3.6 x 3.6
400 - 1100
1n - 20m
S154C
Fiber Head
InGaAs
2.0
700 - 1700
100p - 5m
S155C
Fiber Head
InGaAs
2.0
700 - 1700
1n – 20m
© 2011 Thorlabs
5
PM200
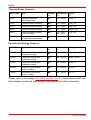
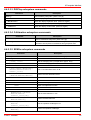
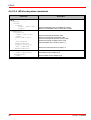
Thermal Power Sensors:
Order Code
Type
Aperture Wavelength
mm
nm
Power
W
S302C
Thermally Stabilized
Thermal Absorber
12
190 - 25000
100µ - 2
S310C
Thermal Surface Absorber
20
190 - 25000
10m - 10
S314C
Thermal Surface Absorber
25
190 - 10600
10m - 60
S322C
Thermal Surface Absorber
25
190 - 10600
100m - 250
S350C
Thermal Surface Absorber
Excimer Coating
40
190 - 1100
and 10600
10m - 60
S370C
Thermal Volume Absorber
for high peak power lasers
25
400 - 5200
10m - 15
Pyroelectric Energy Sensors:
Order Code
Type
Aperture Wavelength
mm
nm
Energy
J
ES111C
Pyroelectric Sensor with
broadband coating
11
185 - 25000
10µ - 150m
ES120C
Pyroelectric Sensor with
broadband coating
20
185 - 25000
100µ - 500m
ES145C
Pyroelectric Sensor with
broadband coating
45
185 - 25000
500µ - 2
ES220C
Pyroelectric Sensor with
ceramic coating
20
185 - 25000
500µ - 3
ES245C
Pyroelectric Sensor with
ceramic coating
45
185 - 25000
1m -15
Please visit our homepage http://www.thorlabs.com for various accessories like
fiber adapters, posts and post holders, data sheets and further information.
6
© 2011 Thorlabs
1 General Information
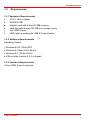
1.3
Requirements
1.3.1 Hardware Requirements
CPU:1 GHz or higher
RAM:256 MB
Graphic card with at least 32 MB memory
Hard disc with at least 100 MB free storage space
free USB2.0 port
USB cable according the USB 2.0 specification
1.3.2 Software Requirements
Operating System:
Windows ® XP (32-bit) SP3
Windows ® Vista (32-bit, 64-bit)
Windows ® 7 (32-bit, 64-bit)
VISA runtime (version 5.0.3 or higher)
1.3.3 Interface Requirements
A free USB2.0 port is required.
© 2011 Thorlabs
7
PM200
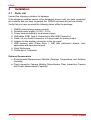
2
Installation
2.1
Parts List
Inspect the shipping container for damage.
If the shipping container seems to be damaged, keep it until you have inspected
the contents and you have inspected the PM200 mechanically and electrically.
Verify that you have received the following items within the package:
1.
2.
3.
4.
5.
6.
7.
PM200 power/energy meter console
Desktop power supply (5 VDC / 2.4 A)
Power cord according to local power supply
USB cable (USB Type A Connector to Mini USB Connector)
Cable 3.5 mm Audio Connector to Flying Leads for analog output
Adapter for the auxiliary connector in the top panel
USB memory stick (Flash Drive 1 GB) with instrument drivers, user
application and operation manual
8. Quick Reference
9. Certificate of Calibration
Optional Accessories
Environmental Measurement Module (Displays Temperature and Relative
Humidity)
Fiber Inspection Camera Module (Monochrome Fiber Inspection Camera
with Power Measurement Capability
8
© 2011 Thorlabs
2 Installation
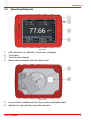
2.2
Operating Elements
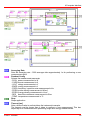
Front Panel
1.
2.
3.
4.
LED indicators for „Standby“ mode and „Charging“
Touch-pen
Touch-screen display
Removable protective silicone rubber boot
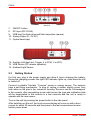
Rear Panel
5. Four position rotatable and two flap position adjustable stand
6. Adaptor for optional fiber inspection camera
© 2011 Thorlabs
9
PM200
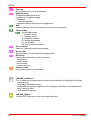
Side View
7.
8.
9.
10.
11.
ON/OFF button
DC Input (DC 5V/2A)
USB host (for flash drive and fiber inspection camera)
Analog Output (0...2V DC)
Optical head input
Top View
12. Auxiliary In/Output (ext. Trigger, 4 x GPIO, 2 x ADC)
13. USB Device (PC remote operation)
14. Ambient Light Sensor
2.3
Getting Started
For first use, plug in the power supply and allow 4 hours charging the battery.
During the charging process the right LED indicator lights up, even when the unit
is turned off.
Connect a suitable Thorlabs “C-series” power or energy sensor. The sensors
have a self-fixing mechanism. To plug or unplug a sensor slightly press from
both sides on the pins in the connector housing. Sensors can be ‘hot-swapped’
to the console, after recognizing a new valid sensor the type and calibration data
will be downloaded to the console in a few seconds and the unit is ready to
operate with the new sensor.
Turn on the unit by pressing the power button in the side panel.
After switching on the unit, the touch screen display will come up with a boot
screen for about 30 seconds and then jump to the last measurement screen
before power down.
10
© 2011 Thorlabs
2 Installation
3
Operating Instruction
The PM200 supports all Thorlabs ‘C-Series’ photodiode, thermal and
pyroelectric sensors. These can easily identified against older versions of
Thorlabs power or energy sensors by their red connector housing. The console
will not recognize sensors from the ‘A’ and ‘B’ series. Please contact Thorlabs
for upgrading of old sensors with ‘C-Series’ connectors.
To plug or remove a sensor slightly press the two bolts in the connector housing.
Sensors can be ‘hot-swapped’ to the console, after recognizing a new valid
sensor the type and download of the calibration data, the console is ready to
operate with the new sensor.
The PM200 also supports custom detectors, please refer to chapter Photodiode
Sensors 27 , Thermal Sensors 30 or Pyroelectric Sensors 32 and to the connector
pin-out 63 .
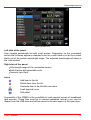
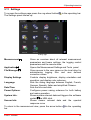
From the main menu all functions can be reached by clicking to the appropriate
icon:
Console Info (Type and serial number)
Opens external USB memory (File manager 22 )
Battery status
26
Measurement Views
15
Zooms In the actual display
Delta
© 2011 Thorlabs
23
measurement mode
11
PM200
Zeroing 23 the sensor
Resets min / max 24 labels
Settings 25 panel
3.1
Attenuation Correction
The attenuation menu can be used to apply an additional, external related
correction factor to the power or energy reading (e.g. filter). The handling is
similar to the wavelength correction, it is possible to create a list with dedicated
attenuation items in dB or loading complete spectral transmission curves in
comma separated format.
Note
Attenuation must be entered always as a positive value, e.g., (+)10dB. The
software allows to enter negative values as well,but this would be equivalent to an
amplification.
Note
If the attenuation curve e.g. of a filter is loaded and selected, it can be easily
displayed in the 'Sensor' panel. Comparing the graphics in tab 'curve' with the tab
'eff. curve', the superposition of the sensor's response curve and the filter curve
can be seen.
3.2
Wavelength Correction
The PM200 allows the creating and administering of a nearly unlimited number of
user wavelengths and spectral curves of light sources that will be used for
calculating the spectrally corrected power or energy value.
By clicking to the wavelength value, a drop down list appears with saved
wavelength value. The menu item ("Edit...") opens the editor panel. The editor
panel instantly appears when clicking to the Wavelength button:
12
© 2011 Thorlabs
3 Operating Instruction
Wavelength Editor Panel
Left side of the panel
User created wavelength list with scroll arrows. Depending on the connected
sensor the list items appear in standard color for a valid value or in red for a value
that is out of the sensor wavelength range. The selected wavelength will show in
the “edit window”.
Right side of the panel
Wavelength range of the connected sensor.
Edit Window with selectable units
Numeric input field.
Icons
Add item to the list
Delete item from the list
Overwrite item in the list with new value
Load spectral curve
Quit editor
A specialty of the PM200 is the possibility to load spectral curves of broadband
light sources. These files must be in comma separated format (.csv), can be
loaded from the USB drive and will be stored in the user space of the local drive.
© 2011 Thorlabs
13
PM200
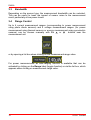
3.3
Bandwidth
Depending on the sensor type, the measurement bandwidth can be selected.
This can be useful to lower the impact of sensor noise to the measurement
result, particularly at low power levels.
3.4
Range Control
Up to 6 current measurement ranges (corresponding to power measurement
using photo diode sensors) and 4 voltage measurement ranges (for power
measurement using thermal sensors or energy measurement using pyroelectric
sensors) can be chosen manually with the
or
buttons near the
measurement unit
or by opening a list box when clicking on the measurement range value.
For power measurements an auto-ranging function is available that can be
activated by clicking on the Range label (toggle function) or via the list box, which
appears when clicking on measurement range value.
14
© 2011 Thorlabs
3 Operating Instruction
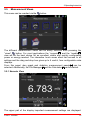
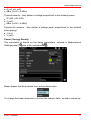
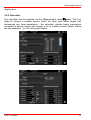
3.5
Measurement Views
This menu can be reached via the
button.
The different measurement views can be easily selected after pressing the
“views”
button. For most applications the “numeric 15 ” and the “needle 19 ”
view will be the best choice for an excellent visible and quickly configurable
power or energy readout. The interactive touch areas allow fast access to all
settings and the drag and drop box gives up to 6 useful, free configurable extra
displays.
From this panel, also graph and statistics measurement panels 19 can be
selected. Additionally, the File Manager 22 and the Calculator 21 can be started.
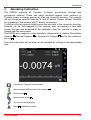
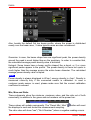
3.5.1 Numeric View
The upper part of the display important measurement settings are displayed.
© 2011 Thorlabs
15
PM200
These settings can be changed either in the Measurement settings menu 25 or
directly by clicking to the appropriate item.
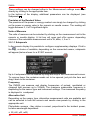
In the bottom of the display, additional parameters can be displayed (see
Subpanels 16 )
Precision of the Readout Value
The precision of the power or energy readout can simply be changed by clicking
on the power or energy value in the numeric or needle screen. The reading will
toggle between 3, 4 or 5 significant digits.
Units of Measure
The units of measure can be selected by clicking on the measurement unit in the
numeric or needle display. A list box will open and offer sensor depending
choices of the selectable measurement unit in W, dBm, J, A or V.
3.5.1.1 Subpanels
In the numeric display it is possible to configure supplementary displays. Click to
the
, a choice of available, depending on the connected sensor, subpanels
will appear (below shown for a S120C sensor):
Up to 6 subpanels can be enabled by drag and drop to the measurement screen.
To remove items, the container needs not to be opened, just pick the item and
drag it back to the container.
Frequency
The PM200 can measure and display frequencies of pulsed, modulated or
chopped light sources up to 100kHz. The maximum measurable frequency is
depending on the sensor type and instrument settings. The measured frequency
is displayed in a subpanel.
Alternative Unit
Depending on the sensor type, alternative measurement units are available and
can be selected in both the numeric and needle view panels by clicking to the
appropriate unit.
Photodiode sensors - they deliver a current, proportional to the incident power,
but also wavelength dependent:
W (nW, µW, mW)
16
© 2011 Thorlabs
3 Operating Instruction
A (nA, µA, mA)
dBm (1mW = 0 dBm)
Thermal sensors - they deliver a voltage proportional to the incident power:
W (nW, µW, mW)
V (mV)
dBm (1mW = 0 dBm)
Pyroelectric sensors - they deliver a voltage peak, proportional to the incident
pulse energy:
J (mJ)
V (mV)
Power / Energy Density
The calculation is based on the beam parameters, entered in Measurement
Settings panel (
and in the next panel
):
Beam shapes can be selected from a drop-down menu:
To change the beam dimension, click into the numeric field - an editor comes up:
© 2011 Thorlabs
17
PM200
Also, beside the default flat top beam profile, where the power is distributed
evenly over the beam area, 2 more typical cases are also considered:
Gaussian: In case, the beam shape has one significant peak, the power density
around the peak is much higher than on the periphery. In order to consider that,
the calculated average power density value is doubled.
Hotspot: Some lasers have a beam profile shaped like a donut, or 2 or more
significant peaks appear in the profile. The power density in these hot spots is
much higher than the average across the entire beam diameter. The calculated
average power density value is tripled.
Note
Power density is always displayed in W/cm², energy density in J/cm². Density is
measured correctly only if the connected sensor is calibrated. In case a
customer made sensor is used, please make sure that the correct calibration
coefficient is entered.
Min, Max and Ratio
These subpanels show the minimum, maximum value, and the ratio out of both
numerically, in addition to the green and red markers on the power bar:
These values will update permanently. The "Reset Min / Max"
the displays to zero and restart the measurement sampling.
button will reset
The ratio value will show "nan" ("No A Number") when a negative reading occurs.
18
© 2011 Thorlabs
3 Operating Instruction
Delta Reference is the reference power value, when the console measures the
deviation (Delta measurement)
Actual is the measured value. This display is useful when performing Delta
measurements - in this mode the main display shows the deviation from the delta
reference value, so in a subpanel the actual power can be displayed.
Sensor temperature: Most of Thorlabs photodiode and thermal sensors are
equipped with a NTC Thermistor to control the temperature of the sensor head.
To show the sensor temperature, pick the "Sensor Temperature" subpanel and
drop it to the main view.
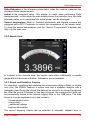
3.5.2 Needle View
In contrast to the numeric view, the needle view offers additionally a needle
gauge with min and max indicators. Subpanels are not available.
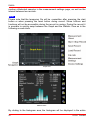
3.5.3 Graph and Statistics Display
For recording, visualizing and analyzing the measurement data in Watts or Joules
over time, the PM200 features a scope view and a statistics analysis with a
histogram view. During the record, the data will be stored to an internal temporary
file. After the record is finished or has been stopped, the measurement data can
be permanently stored to the internal logging drive or the USB drive. The data
format is comma separated (.csv) and contains
measurement value
time stamp
additional settings
sensor information.
The record stopping criteria can be selected to manually, elapsed time or
© 2011 Thorlabs
19
PM200
number ofdetected samples in the measurement settings page, as well as the
interval between two records.
Note
Please note that the temporary file will be overwritten after pressing the start
button or when pressing the reset button during record. Some buttons and
functions will not be accessible during the record is running. During the record it
is possible to quickly swap between the Graph and the Statistic View as in the
following screen shots.
Graph View
Statictics View
By clicking to the histogram area, the histogram will be displayed in the entire
20
© 2011 Thorlabs
3 Operating Instruction
display area.
3.5.4 Calculator
The calculator can be reached via the Measurement views 15 panel. This tool
helps to choose a suitable sensor. Enter the laser type, beam shape and
dimensions and laser parameters - the calculator derives beam parameters
essential for sensor choice and outputs a list of suitable sensor heads. Below
are two examples - for CW and pulsed lasers.
Beam Parameter Calculator for CW Lasers
Beam Parameter Calculator for Pulsed Lasers
© 2011 Thorlabs
21
PM200
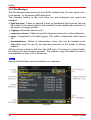
3.5.5 File Manager
The file manager gives access to the LOCAL system drive, the user space and if connected - to an external USB flash drive.
The following folders in the local drive are pre-configured and cannot be
changed:
light-sources: Tables of spectral curves of broadband light sources that can
be loaded to the wavelength list and selected for the wavelength correction of
the power or energy readout.
logging: Administer data records.
response-curves: Tables of spectral response curves for custom detectors.
temp: Temporary file for data logging. This folder contains the latest record
file.
transmissions: Tables of transmission curves that can be loaded to the
attenuation menu to use for the spectral correction of the power or energy
readout.
All files can be copied to and from the USB drive. To remove a custom folder,
the folder must be selected (opened). The rename, copy and paste function is
only available for files, not for directories.
Note
Above default folders cannot be deleted nor renamed.
File manager
22
© 2011 Thorlabs
3 Operating Instruction
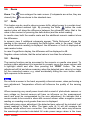
3.6
Zoom
Zoom: The
icon enlarges the main screen (if subpanels are active, they are
closed), the
icon returns to the standard view.
3.7
Delta
This feature can be used to observe power drifts, adjust power to a certain level,
or quickly subtract ambient light. By pressing the Delta
button the main
readout value will show the difference between the reference value (that is the
value in the moment of pressing the delta button) and the actual reading.
In needle view, both the needle scale and the additional numeric readout show
the difference.
In numeric view, 2 additional subpanels appear: "Delta Reference" shows the
reading in the moment of pressing the Delta button, while in the panel "Actual"
the actual absolute reading is displayed. the difference of both is displayed as
main readout value.
In case if logarithmic display, the difference will be displayed in dB.
Negative values indicate, that the actual value is less than the reference.
3.8
Zeroing
The zeroing function can be accessed in the numeric or needle view panel. To
perform a zero adjustment it is important to properly cover the power sensor with
a light-tight shield and after then pressing the "ZERO" button. The zero
adjustment will fail and show a warning, when the detected zero value is too large
for the connected sensor; e.g. when accidentally hitting the zero button under
light exposure to the sensor.
Note
Do not hold a sensor in the hand, especially a thermal sensor, when performing a
zero adjustment. Temperature effects will influence the quality of the zeroing
result!
When measuring very small power levels dark current of photodiode sensors or
zero voltage on thermal sensors will have an influence on the measurement
result and must be compensated by the zero adjustment. An indicator that a
sensor needs to be zeroed is when with covered sensor either a negative power
reading or a reading much greater than zero is displayed.
After performing a zero adjustment, the detected zero value will be included in all
power readings in Watts or dBm. The basic units (A, V) will still measure the
absolute values without zero correction. The detected zero value may influence
the wavelength corrected calculated full scale power range values in the lower
© 2011 Thorlabs
23
PM200
power ranges; also there might be a zero shift in the bar graph representation.
In logarithmic (dBm) representation the unit cannot display negative values. In
this case the display will show ‘nan‘ (Not A Number).
Photodiode sensors emit small current levels, even when no photons hit the
active area – the so called dark current, that is temperature dependent and in the
region of some nA for silicon and InGaAs sensors and up to some µA for
germanium sensors.
Thermopile sensors need to be zeroed when thermal differences between active
area (thermal disk) and the sensor heat sink appear when no light hits the active
area or when the heat sink gets hot under light exposure. The zero value will be
negative when the heat sink is hotter than the active area and positive, when the
active area is hotter than the heat sink. When both heat sink and active area are at
room temperature a zero voltage of some µV is normal.
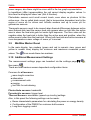
3.9
Min/Max Marker Reset
In the main display, two markers (green and red in numeric view, green and
yellow in needle view) display the minimum and maximum measured power
values. The
icon resets these two markers.
3.10 Additional Measurement Settings
The measurement settings page can beached via the settings page 25 (
),
then press
.
There are listed various sensor dependent configuration items:
Common for all sensors:
wave length correction
attenuation
measurement units
ranging
line filter for anti-aliasing
Photo diode sensors: bandwidth
Pyroelectric sensors: trigger level
Thermal Sensors: accelerator (speed-up circuitry) settings
Also, in this panel the following settings can be made:
Beam characteristic parameters for calculating the power or energy density
Configuration of the PM200 for customer built sensors
Long-term logging control
24
© 2011 Thorlabs
3 Operating Instruction
3.11 Settings
To access the settings page press the cog-wheel button
The Settings panel comes up:
in the operating bar.
Settings page
Measurement 24
Application 15
File Manager 22
Display Settings
Language
Date/Time
Power Options:
System Info:
Sensor Info:
Gives an overview about all relevant measurement
parameters and beam settings, the logging control
parameters and the remote state.
Opens the Measurement Settings and Tools panel
Gives access to the user space on the local drive for
administering logging files and user defined
correction curves.
Controls display brightness, display orientation and
operation, and display color schemes.
Sets the dialog language between English, French,
German, Spanish, Italian and simplified Chinese.
Sets the time and date.
Configures power saving schemes for both battery
and mains operation.
Shows system relevant data and triggers the software
update 43 via USB stick.
Shows sensor relevant data and the spectral
response curve
To return to the measurement view, press the arrow button
bar.
© 2011 Thorlabs
in the operating
25
PM200
3.12 Analog Output
The analog output provides the amplified photo-diode current or the amplified
thermal or pyroelectric sensor voltage.
The signals from the analog output are not wavelength and zero corrected. The
analog output voltage can range from -0.3V to +2.3V. It is is measurement range
dependent and can be calculated to:
3.13 Auxiliary Input and Output
This 12 pin connector in the top panel gives access to an external trigger input, 4
configurable general purpose input/output (GPIO) pins and two 10bit ADC inputs.
With the optional available environmental module that can be plugged into this
connector it is possible to monitor the room temperature and the relative humidity
in the status bar.
3.14 Charging the Battery
The PM200 is powered by a 2 cell LiPo+ battery that needs to be recharged
intermittently by plugging the AC adapter. To fully charge the battery it takes
approximately 4 hours. A built in charging circuit automatically regulates and
terminates the charging.
Note
Charging via the USB cable to a computer might not sufficiently compensate the
power consumption of the PM200.
Following battery icons in the display header show the charging state from empty
to full battery and line operation
The empty battery symbol starts blinking one minute prior to the automatic shutdown of the PM200..
When an external power supply is connected, the symbols above change
sequentially until the battery is fully charged; after then the power cord icon will
appear.
26
© 2011 Thorlabs
3 Operating Instruction
3.15 Sensor Dependent Functions
3.15.1 Photodiode Sensors
The PM200 works with all Thorlabs S1xxC series photodiode power sensors.
The sensor is ready to operate few seconds after plugging to the DB9
connector.
Attention
Refer to the sensor data sheet and pay attention to the optical damage threshold!
Exceeding these values will permanently destroy the sensor!
For the measurement of power levels from nano-watts up to 20 W Thorlabs
offers photodiode sensors that show big advantages in sensitivity, stability and
drift compared to thermal sensors. The sensors are built up in a combination of a
photodiode and a neutral density filter or a photodiode in combination with an
integrating sphere. They provide linearity over several decades and show a very
good sensitivity at smallest power levels down to the pW range. Handling fairly
small power levels the sensor size can be held small, further the response time
of such sensors is very fast down to the sub-microsecond range.
Photodiodes, neutral density filters and also integrating sphere materials show a
wavelength dependent behaviour and therefore each sensor is individually
calibrated over the whole spectral working range in 5 or 10nm steps. The
sensors spectral response data ("calibration data") get stored in a non-volatile
memory inside the DB-9 sensor connector and downloaded to the PM200 when
plugged to the unit. To perform an accurate measurement it is necessary to enter
the operating wavelength of the incident light. The PM200 then calculates the
light power from the measured photo current, using the correct responsivity value
from the wavelength calibration table.
Bandwidth Setting (Signal Filtering)
The analogue bandwidth setting influences the power reading and the analog
output. The bandwidth can be selected in the measurement settings panel or
directly in numeric / needle view panels as to 10Hz, 1kHz or 100kHz.
For measuring CW or average power from pulsed sources the bandwidth should
be set to 10Hz. When using the analog output to control external equipment or
measuring peak power levels the 100kHz setting is recommended so that the
meter can follow the signal.
Power Measurements using Photo Diodes
Common photo diodes can be used for power measurements with the PM200.
Therefore to the sensor input (see Sensor Connector Pinning 63 ) the photodiode
© 2011 Thorlabs
27
PM200
(cathode to pin 4) and an interlock (1..10 k between pin 7 and pin 3) must be
connected. In order to measure the power, a response curve of the used photo
diode must be loaded. If no responsivity curve is available, the PM200 uses a
default responsivity of 1A/W, and only photo current measurement is possible.
Note
Please take care for the correct polarity of the photo diode - the anode needs to
be connected to analog ground (pin 3)!
Set the Sensor Type to ‘Photodiode Detector’ in the ‘Measurement Settings’
panel. For correct power measurement, the response curve (*.csv file) of the
used photo diode must be loaded.
Note
It's important that the response curve file is a true comma separated values file the separator must be a comma (,) not a semicolon (;)! Less important is the file
extension - it can be a *.txt file as well. The response curve file must not contain a
header!
Copy the appropriate *.csv file from an external flash memory (e.g., USB stick)
to the folder LOCAL > response-curves, using the File Manager
Click to the 'PD Adapter' tab in the upper left corner of the display, click to the
'select curve' button on the screen bottom.
Select from the 'LOCAL > response-curves' folder the desired file and hit the
select
button.
The responsivity curve now will be displayed and used for calculations. If no
responsivity curve is available, the PM200 uses a default responsivity of 1A/W,
and only photo current measurement is possible.
Example
A Thorlabs FDS100-CAL calibrated photo diode, s/n 10112420, is used with
PM200.
The calibration data can be downloaded from Thorlabs' website - search for the
item FDS100-CAL, on the product site a table can be found.
Select the tab "Calibration Data", enter the serial number and download the
provided calibartion data file FDS100-CAL 2010112420_103280830.txt to a
USB memory stick.
Edit the file and remove the header lines.
Connect the USB memory stick to the PM200
Copy the file to the folder LOCAL > response-curves, using the File Manager
Click to the 'PD Adapter' tab in the right upper corner of the display, click to the
'select curve' button on the screen bottom.
28
© 2011 Thorlabs
3 Operating Instruction
Select from the 'LOCAL > response-curves' folder the desired file and hit the
select
button.
Now, the response curve is displayed and used for calculation. The last step is to
enter the correct wavelength.
3.15.2 Thermal Sensors
The PM200 is compatible to the Thorlabs S3xxC series thermal power sensors.
The sensor will be ready to operate few seconds after plugging to the DB9
connector.
Attention
Refer to the sensor data sheet and pay attention to the optical damage threshold!
Exceeding these values will permanently destroy the sensor!
Thermal sensors absorb the incident laser power and convert the developing
heat into a small voltage caused by heat flow through thermocouple elements
between absorbing area and sensor heat sink. Thorlabs S3xxC series thermal
sensors cover a wide range of applications. The sensors are available with
different coatings. Black broad band coating as absorber does not need a
wavelength correction because the response is nearly flat from UV to mid-IR
wavelengths. Special hard coatings can withstand high power levels and show
also a good spectral flatness. Further Thorlabs offers special heads with
coatings for very high peak power levels for Excimer lasers with large beam
diameters and short pulse lasers .
The output voltage of a thermal sensor is linear to the incident laser power, as
long the thermal system is properly zeroed. The main application for thermal
sensors is the measurement of high power levels from 100mW up. Thorlabs
offers also a special thermally isolated thermal head with flat response for
measurement of a power level starting in the µW range.
Readout acceleration
Thermal sensors show a fairly slow response. When laser power hits the active
area, it takes some time to reach the correct power indication. This settling time
may take, depending on the sensor type, from a few up to 20 seconds. As the
settling time (time constant) is well known for each sensor type, a special
electronic circuitry can shorten this time to approximately 1-3 seconds by
‘predicting’ the final power value.
The PM200 automatically uses the right adjustment of the electronics to the time
constant of the recognized thermal sensor. Nevertheless this circuitry has the
disadvantage of inducing some noise to the measurement value. Therefore the
acceleration circuit can be disabled / enabled in the 'Measurement Settings'
© 2011 Thorlabs
29
PM200
panel (Accelerator 'on / off / auto').
In ‘auto’ mode the accelerator will switch on when a power change larger than 5%
of the measurement range is detected and switch off after 5 times of the time
constant of the sensor. This feature provides a fast response and keeps the
noise level to a minimum on constant power levels.
Custom Thermal Elements
Custom thermal elements can be used for power measurements with the
PM200. Therefore to the sensor input (see Sensor Connector Pinning 63 ) the
thermal element ('+' to pin 8) and an interlock (1..10 k between pin 7 and pin 3)
must be connected. In order to measure the power, a response curve of the
used thermal element must be loaded. If no responsivity curve is available, the
PM200 uses a default responsivity of 1V/W, and only voltage measurement is
possible.
Note
Please take care for the correct polarity of the thermal element - the negative
contact needs to be connected to analog ground (pin 3)!
Note
It's important that the response curve file is a true comma separated values file the separator must be a comma (,) not a semicolon (;)! Less important is the file
extension - it can be a *.txt file as well. The response curve file must not contain a
header!
Set the Sensor Type to ‘Thermal Detector’ in the ‘Measurement Settings’ panel.
For correct power measurement, the response curve (*.csv file) of the used
thermal element must be loaded:
Copy the appropriate *.csv file from an external flash memory (e.g., USB stick)
to the folder LOCAL > response-curves, using the File Manager
Click to the 'Thermo Adapter' tab in the upper left corner of the display, click to
the 'select curve' button on the screen bottom.
Select from the 'LOCAL > response-curves' folder the desired file and hit the
select
button.
The responsivity curve now will be displayed and used for calculations.
If no responsivity curve is available, the PM200 uses a default responsivity of 1V/
W, and only voltage measurement is possible.
30
© 2011 Thorlabs
3 Operating Instruction
Accelerator settings
Different from S3xxC series, for a custom thermal element the time constant
'Tau' can be entered in the Measurement Settings panel. Accelerator modes are
the same, as for S3xxC sensors.
3.15.3 Pyroelectric Sensors
Pyroelectric sensors allow the energy measurement of short light pulses. The
PM200 works with Thorlabs ES1xxC and ES2xxC series pyroelectric power
sensors. The sensor will be ready to operate few seconds after plugging to the
DB9 connector.
Attention
Refer to the sensor data sheet and pay attention to the optical damage threshold!
Exceeding these values will permanently destroy the sensor!
A pyroelectric sensor converts the incident energy pulse into a voltage pulse,
largely independent of the incident radiation wavelength. The amplitude of this
voltage pulse is proportional to the laser pulse energy and is measured by a
peak detector circuit. The voltage peak decays in time, so the max. repetition rate
is limited.
When a pyroelectric sensor is connected the PM200 cannot be switched to autorange mode. The measurement value will be updated with each incoming pulse.
When no pulses appear the measurement display will be held on the last
measured value until the "Reset Min / Max"
button will be pressed.
Trigger Level
The trigger level can be set either directly by clicking to the value in the
measurement panel or from the 'Measurement Settings' panel.
When an incoming pulse exceeds the set trigger level, the peak detector circuit
gets armed and is waiting until the pulse peak is reached. After finding the
maximum voltage the level is kept and the microprocessor reads the AD
converted voltage for displaying the pulse energy. Finally the peak detector
circuit gets a reset and is ready for the next pulse.
The trigger level can be adjusted between 0% and 99% of each selected energy
range. Only pulses that are higher than the adjusted trigger level are recognized
by the PM200. The trigger level should be set between the noise level and the
expected pulse height.
Average Power Measurement
With continuously repeating pulses the PM200 calculates the average power
© 2011 Thorlabs
31
PM200
from the pulse energy and the repetition rate. For displaying the average power
drag and drop the appropriate subpanel to the numeric view panel.
Repetition Rate
The pulse repetition rate in Hz can be displayed in the 'Frequency' subpanel.
Power / Energy density
The precondition to measure the correct power and/or energy density is a well
known beam area. Therefore, select in 'Measurement Settings' panel the
applicable beam shape (square, rectangular or circular) and enter the beam size.
Average power density (in W/cm²) and energy density (in J/cm²) are then
displayed in the appropriate subpanels.
Custom Pyroelectric Sensors
Custom pyroelectric detectors can be used for energy measurements with the
PM200. Therefore to the sensor input (see Sensor Connector Pinning 63 ) the
pyroelectric sensor ('+' to pin 5) and an interlock (1..10 k between pin 7 and pin
3) must be connected. In order to measure the energy, a response curve of the
used pyroelectric sensor must be loaded. If no responsivity curve is available,
the PM200 uses a default responsivity of 1J/W, and only peak voltage
measurement is possible.
Note
Please take care for the correct polarity of the thermal element - the negative
contact needs to be connected to analog ground (pin 3)!
Note
It's important that the response curve file is a true comma separated values file the separator must be a comma (,) not a semicolon (;)! Less important is the file
extension - it can be a *.txt file as well. The response curve file must not contain a
header!
Set the Sensor Type to ‘Pyroelectric Detector’ in the ‘Measurement Settings’
panel. For correct energy measurement, the response curve (*.csv file) of the
used thermal element must be loaded:
Copy the appropriate *.csv file from an external flash memory (e.g., USB stick)
to the folder LOCAL > response-curves, using the File Manager
Click to the 'Pyro Adapter' tab in the upper left corner of the display, click to the
'select curve' button on the screen bottom.
Select from the 'LOCAL > response-curves' folder the desired file and hit the
select
button.
32
© 2011 Thorlabs
3 Operating Instruction
The responsivity curve now will be displayed and used for calculations.
If no responsivity curve is available, the PM200 uses a default responsivity of 1V/
J, and only peak voltage measurement is possible.
© 2011 Thorlabs
33
PM200
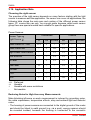
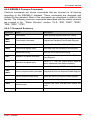
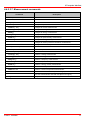
3.16 Application Note
Choosing the right sensor
The question of the right sensor depends on many factors starting with the light
source to measure and the application. No sensor can cover all applications; the
following table shows the main pros and contras of the different power sensor
types. Of course this can only be a rough guide because within each sensor
group there are special models best suitable for specific applications.
Power Sensors:
Photodiode
Sensor Type
Light Source
Thermal
Si
Ge
InGaAs
BB
HTC
Volume
+++
+
-
++
-
-
Laser Diode NIR
-
+
+++
++
-
-
High Power Fiber Lasers
-
-
++
++
++
-
ASE sources
-
-
++
++
-
-
fs Laser
-
+
++
++
+
-
++
-
-
++
+
-
Excimer
-
-
-
-
+++
+
YAG
-
-
-
-
+
+++
LED
+
-
-
+++
+
-
Laser Diode UV - NIR
Gas Laser
+++
++
+
-
Preferred
Useable
Useable with some restrictions
Not useable
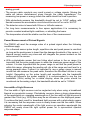
Reducing Noise for High Accuracy Measurements
Main disturbing influence on each measurement is induced by grounding noise,
the cable capacitance, temperature effects, stray and ambient light and detector
noise.
- The housing of power sensors are connected to the digital ground of the meter
and should be linked to earth ground (e.g. via a post); energy sensors should
be mounted isolated, because the housing is connected to the console's
34
© 2011 Thorlabs
3 Operating Instruction
analog ground.
- The sensor cable conducts very small current or voltage signals. Moving the
cable will induce disturbances given through the cable capacitance. For
measuring low power or energy levels the cable should be fixed in position.
- With photodiode sensors the bandwidth should be set to ‘LOW’ setting; with
thermal sensors the acceleration circuit should be shut off or set to ‘AUTO’.
- The detector noise is lowest with Silicon or InGaAs sensors.
- For long term measurements in free space applications it is necessary to
provide constant ambient light conditions, or shielding the beam.
- The temperature should be stable over the time of the measurement.
Power Measurement of Pulsed Signals
The PM200 will read the average value of a pulsed signal when the following
conditions apply:
For a thermal sensor pulse length, repetition rate and peak power is uncritical
as long as the peak power is lower than the damage threshold of the sensor. A
thermal sensor reacts very slow and will integrate the power incident on the
active area of the sensor.
With a photodiode sensor that can follow short pulses in the ns range it is
important that the pulse peak power is within the maximum power range of the
sensor. It is also important that the power range is set that the peak power is
within this range, otherwise the reading will clip at the range end and lead to a
wrong average value. Further it is important to use a power range in manual
mode that can measure the peak value, therefore the Min-Max function is very
helpful. Depending on the pulse length and repetition rate the bandwidth
setting will influence the power reading. It is recommended to use the low
bandwidth (10Hz) setting for a stable display; when the pulse should be
monitored via the analog output, the bandwidth should be set to ‘100kHz’.
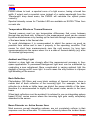
Line width of Light Sources
The line width of light sources can be neglected only when using a broadband
thermal or pyroelectric sensor. Photodiode sensors show a strong dependency
of the responsivity vs. operating wavelength so if the line width of light sources is
greater than 10nm (e.g. LED) there may be an influence on the displayed power.
To achieve the best result for broadband light sources with a photodiode sensor
it is necessary that the response curve is nearly linear over the line width. When
entering the center wavelength of the light source as operation wavelength the
PM200 will nearly show the right optical power for a symmetrical spectral
response shape.
© 2011 Thorlabs
35
PM200
Note
PM200 allows to load a spectral curve of a light source, having a broad line
width. If select such a spectral curve instead of a center wavelength from the
'Wavelength' drop down menu, the PM200 will calculate the optical power
correctly.
Spectral intensity curves for Thorlabs LED are available as EXCEL™files from
our web site.
Temperature Effects on Thermal Sensors
Thermal sensors react on any temperature differences that occur between
thermal disc and heat sink. Influence to the measurement result can be caused
by airflow disturbances or by heating up the heat sink through long term exposure
of the laser beam to the thermal disc.
To avoid disturbances it is recommended to shield the sensor as good as
possible from airflow and to zero it properly in the operating condition. That
means for short term measurements zero the cold sensor, for long term
measurements zero the sensor when it is in a state of thermal stability (e.g. after
10 minutes light exposure).
Ambient and Stray Light
Ambient or stray light can strongly affect the measurement accuracy in freespace applications. A permanent background light level can be subtracted by
conducting a zero adjustment. More complicated is varying ambient light like
daylight or turning on/off room light. In such cases the only solution is a proper
light shielding of the sensor.
Back Reflection
Photodiodes, ND filters and even black coatings of thermal sensors show a
certain kind of back reflection of the incoming light. For example, the back
reflection to a diode or HeNe laser can distort the power stability of the laser,
therefore it is recommended to slightly tilt the power meter sensor in the laser
beam.
When back reflection must be avoided it is advised to use an integrating sphere
based S14xC series sensor where the incoming light gets nearly completely
absorbed in the sensor.
Beam Diameter vs. Active Sensor Area
Most sensors, except integrating spheres, are not completely uniform in their
response over the active area. To overcome uniformity issues the incident beam
36
© 2011 Thorlabs
3 Operating Instruction
should have a diameter larger than 10% of the active sensor area diameter.
Another important parameters are the maximum allowed power and energy
densities of the sensor. The maximum ratings are given in the sensor spec
sheet. The PM200 can display the actual power or energy density for a known
beam diameter. For high power or high energy beams a good efficiency can be
reached to chose a detector that has a active area diameter about 20% - 30%
larger than the beam diameter.
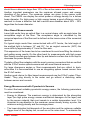
Fiber Based Measurements
Laser light emits from an optical fiber in a conical shape, with an angle twice the
acceptance angle of the fiber. The acceptance angle is calculated by the
numerical aperture of the fiber and is defined as the inverse sine of the numerical
aperture.
For typical single mode fiber connectorized with a PC ferrule, the total angle of
the emitted light is between 15° and 25°, for an angled connector (APC) the
cone shifts by approximately 4° from the fiber axis.
This expansion of the beam has to be considered to avoid overfilling the detector
and getting wrong results. On the other hand for measurements with high power
fiber lasers a certain gap between fiber tip and detector surface has to be kept to
decrease the power density.
Thorlabs offers fiber adapters with the most common connectors that are verified
with the S12xC series optical sensors and with most thermal sensors.
For large divergence angles or fiber measurements that are critical to backreflections it is recommended to use an integrating sphere based sensor from
the S14xC series.
Another good choice for fiber based measurements are the S15xC series ‘FiberHeads’. They plug directly to the meter and go without a disturbing cable
between sensor and console.
Energy Measurement with Pyroelectric Sensors
To select the best suitable pyroelectric energy sensor, the following parameters
must be considered:
– Energy to Measure: The maximum energy is determined by the absorption
layer (too high pulse energy causes mechanical damages on the layer) and
by the sensor material, that must remain in a certain temperature level. It is
important to pay attention to the maximum power density during a pulse, the
maximum energy density and the average power.
– The lower detection limit depends of the resolution and the minimum settable
trigger level of the display unit, as well as on the noise level. To minimize the
© 2011 Thorlabs
37
PM200
noise level and ground loops it is advisable to mount the detectors isolated
with the supplied isolation adapters.
– Beam Diameter: The active area of the detector should be chosen slightly
larger than the beam diameter. It is not a must that the beam should cover
most of the sensor area, but maximum allowed energy density has to be
considered.
– Repetition Rate: The maximum pulse repetition rate depends on the
combination of the internal capacitance of the detector and the load resistor.
The display unit has an input resistor of 1MΩ (like the typical input resistor of
an Oscilloscope).
– Pulse Length: Thorlabs energy sensors detect and measure pulses from sub
nano-seconds duration up to approximately 2 ms. Generally, the pyroelectric
effect allows just the measurement of a temperature change caused by
radiation pulses or modulated radiation. For shorter impulses there are no
restrictions, as the energy of the shortest impulse is converted into heat flow
in the absorption layer. The maximum impulse duration depends on several
factors: One is the electrical time constant, given by the detector capacity and
the load resistance, the other is the thermal time constant of the detector,
which must not influence the measurement result.
– Wavelength: The sensors are calibrated at one wavelength, for the entire
wavelengths a sensor specific correction curve is stored in the memory in the
sensor connector. The black coating is nearly linear flat over a wavelength
range from 185nm to > 25µm; the ceramic coating is also suitable for this
wavelength range, but is not linear.
38
© 2011 Thorlabs
3 Operating Instruction
4
Computer Interface
The PM200 optical power meter contains a USB 2.0 interface for remote
controlling the unit with an external PC. Connect the unit via the Mini-USB
connector in the top panel to a free USB port of your PC. When connecting the
PM200 first time, a new hardware will be found. For proper installing the PM200 it
requires a NI-VISA runtime version on the PC (available on the National
Instruments website www.ni.com) or from the data carrier that comes with the
instrument. Allow installing and follow the dialog instructions.
The PM200 comes with an utility software that easily enables remote operation of
the PM200 (and also PM100D, PM100A and PM100USB) and visualizing and
logging measurement data. Perform the setup.exe and follow the installing
instructions.
The LabVIEW source code of this application is included on the data carrier as
well and can be used to build own applications or to modify the utility program to
specific requirements (LabVIEW 8.5.1 or higher required).
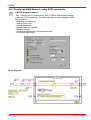
4.1
PM200 Utility Software
The PM200 comes with an utility software that easily enables remote operation of
the PM200 - as well as PM100D, PM100A and PM100USB - along with
visualizing and logging of measurement data. The software is written in LabVIEW
8.5.1 and can either be installed from the data carrier as executable where
LabVIEW isn’t required on the PC; or can be run with LabVIEW 8.5.1 or higher.
The source code of the application is included on the data carrier and can be
used to build own applications or to modify the utility program to specific
requirements.
The PM200 utility software does not require the installation of the instrument
drivers as described in section Using the Instrument Drivers 44 .
After launching the PM200 utility program it will automatically screen for
connected console devices. Select the desired device and press o.k. In case
that the connected console is not yet recognized, press Rescan to perform a
new search for connected devices.
© 2011 Thorlabs
39
PM200
The identification string contains the following items:
USB0
0x1313
0x80B0
P3000116
INSTR
USB Port number
Thorlabs Vendor ID
Product ID = PM200
Instrument serial number
Measurement instrument device
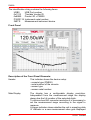
Front Panel
Description of the Front Panel Elements:
Header
This indicator shows the device setup:
- console type (PM200)
- serial number of the console
- sensor type
- sensor serial number
Main Display
The display has a configurable display resolution.
Independent from the measurement range the display
always has the full number of the selected digits.
To achieve best AD converter resolution it is necessary to
set the measurement range according to the signal to
measure.
A trigger indicator shows whether the unit is sampling data
‘A’ indicator or a new measurement value gets displayed
40
© 2011 Thorlabs
4 Computer Interface
‘T’ indicator and green light.
Left Sub Display
The display has the following configurable items:
- no display
- maximum value - sampling until reset
- ratio max/min value - sampling until reset
- power or energy density
- alternate unit depending on connected sensor
Available choices depend on the connected sensor
Right Sub Display
The display has the following configurable items, the
possible choices depend on the connected sensor:
- no display
- minimum value - sampling until reset
- frequency or repetition rate
- temperature
- resistance of temperature sensor
Bargraph indicator
The bargraph indicator shows the incidence or the used
measurement range.
Statistics screen
Statistical values in linear and logarithmic representation
Data logging screen
Shows the logging history data
Histogram Power /
Energy histogram
- displays histogram data
Chart display
Power/Energy Chart
Range button
Press to open a dialog box for setting the measurement
range.
The indicator in the button shows the currently used
measurement range in the chosen unit. A green light
indicates 'auto-ranging'
Shortcut: [Shift + F1]
Wavelength /
Response button
Press this button to open a dialog box for setting the
correction wavelength, or in adapter mode to enter the
responsivity value in A/W or V/W. The currently used
parameter is indicated in the button label.
Shortcut: [Shift + F2]
Measurement configuration button
Depending on the connected sensor the following
parameters can be set in the dialog box:
© 2011 Thorlabs
41
PM200
– display resolution - set number of digits
– averaging rate, a rate of 3000 averages the incoming
measurement values for approx. 1 second
– photodiode bandwidth HI and LO
– acceleration circuit for thermal sensors ON, AUTO and
OFF
– trigger level for pyroelectric sensors
– Zeroing for photodiode and thermal sensors
Shortcut: [Shift + F3]
Units / Display button A dialog box with the following items appears:
- configure unit of measure, depending on the connected
sensor [W, J, dBm, V and A]
- configure the left sub display
- configure the right sub display
Shortcut: [Shift + F4]
Logging configuration button - Opens a dialog box to:
- set averaging rate for logging
- set interval between samples
- set number of samples
- configure logging into data file
Shortcut: Shift + F5
Start/Stop log button - start and stop data logging
Shortcut: [Shift + F6]
Reset / Clear button
- reset min/max monitor
- clear power / energy graph
- clear power / energy histogram
- clear power / energy statistics
- clear log screen
Shortcut: [Shift + F7]
Quit button
- stops the PM200 application
- to restart press the white arrow in the tool bar
Shortcut: [Shift + F8]
Instrument Setup Save / Recall
- save / recall remote control specific parameters
Shortcut: [Shift + F9]
Long Term Measurement
- sets the device to local mode between the measurement
intervals
Shortcut: [Shift + F10]
42
© 2011 Thorlabs
4 Computer Interface
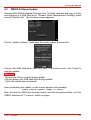
4.2
PM200 Software Update
Download the PM200 Update Package from Thorlabs' web site and copy it to the
root directory of a USB flash drive. Connect Open 'Measurement Settings' panel
and call 'System Info' - the following screen appears:
Click to 'update software', make sure the power supply is connected.
Connect the USB flash drive, then click 'next'. In the next screen, click 'Finish' to
start the update.
Warning
- Do not turn off the console during update!
- Do not remove the USB flash drive during update!
- Wait until update has completed!
Upon completing the update, on the screen appears the message
Please remove update jumper an reboot
Now, remove the USB flash drive and press and hold the power button, until the
PM200 switches off. To reboot, switch on again.
© 2011 Thorlabs
43
PM200
4.3
Using the Instrument Drivers
Instrument Driver Installation
The PM200 software package contains a set of instrument drivers that allow
conveniently remote controlling the instrument in most common programming
languages. The instrument drivers must be installed, please follow the setup
dialog instructions.
Note
To successfully complete the install of the PM200 USB driver you must have
Administrator privileges on the PC which you are performing the install.
Prior to connecting the PM200 with a PC, please check if NI-VISA is installed on
the PC, otherwise install NI-VISA that is available for free from the National
Instruments website www.ni.com or from the data carrier that came with the
instrument.
After successfully installing the drivers connect the PM200 to a USB port of your
PC. The PC will find a PM200 test and measurement device. Please follow the
instructions of the dialog screens and allow the installing.
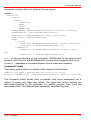
Instrument Driver Example
The following LabVIEW example demonstrates how to use the instrument
drivers for measurement tasks. The example is included on the data carrier that
came with the instrument.
4.4
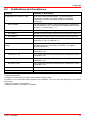
PM200 SCPI Commands
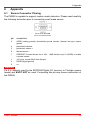
4.4.1 An Introduction to the SCPI language
The PM200 interface commands use the SCPI (Standard Commands for
Programmable Instruments), an ASCII-based command language that was
designed for test and measurement instruments.
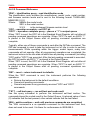
SCPI commands are based on a hierarchical structure, also known as a tree
system. In this system, associated commands are grouped together under a
common node or root, thus forming subsystems. A portion of the SENSE
44
© 2011 Thorlabs
4 Computer Interface
subsystem is shown below to illustrate the tree system.
[SENSe:]
CORRection
:COLLect
:ZERO
[:INITiate]
:ABORt
:STATe?
:MAGNitude?
:BEAMdiameter {MINimum|MAXimum|DEFault|<numeric_value>[mm]}
:BEAMdiameter? [{MINimum|MAXimum|DEFault}]
:WAVelength {MINimum|MAXimum|<numeric_value>[nm]}
:WAVelength? [{MINimum|MAXimum}]
:POWer
[:PDIode]
[:RESPonse] MINimum|MAXimum|DEFault|<numeric_value>[A]}
[:RESPonse]? [{MINimum|MAXimum|DEFault}]
:THERmopile
[:RESPonse] {MINimum|MAXimum|DEFault|<numeric_value>
[V]}
[:RESPonse]? [{MINimum|MAXimum|DEFault}]
SENSe is the root keyword of the command, CORRection is the second-level
keyword, and COLLect and BEAMdiameter are third-level keywords, and so on.
A colon ( : ) separates a command keyword from a lower-level keyword.
Command Format
The format used to show commands in this manual is shown below:
CURRent[:DC]:RANGe {MINimum|MAXimum|<numeric_value>[A]}
CORRection:BEAMdiameter {MINimum|MAXimum|DEFault|<numeric_value>[mm]}
The command syntax shows most commands (and some parameters) as a
mixture of upper- and lower-case letters. The upper-case letters indicate the
abbreviated spelling for the command. For shorter program lines, send the
abbreviated form. For better program readability, send the long form.
© 2011 Thorlabs
45
PM200
For example, in the above syntax statement, CURR and CURRENT are both
acceptable forms. You can use upper- or lower-case letters. Therefore,
CURRENT, current and Current are all acceptable. Other forms, such as CUR
and CURREN, will generate an error.
Braces ( { } ) enclose the parameter choices for a given command string. The
braces are not sent with the command string. A vertical bar ( | ) separates
multiple parameter choices for a given command string.
Triangle brackets ( < > ) indicate that you must specify a value for the enclosed
parameter. For example, the above syntax statement shows the range parameter
enclosed in triangle brackets. The brackets are not sent with the command string.
You must specify a value for the parameter (such as "CURR:DC:RANG 50E-6").
Some parameters are enclosed in square brackets ( [ ] ). The brackets indicate
that the parameter is optional and can be omitted. The brackets are not sent with
the command string. In this example [:DC] can be omitted, so the command
string can be shortened to “CURR:RANG 50E-6”. If you do not specify a value for
an optional parameter, the power/energy meter chooses a default value.
Command Separators
A colon ( : ) is used to separate a command keyword from a lower-level
keyword. You must insert a blank space to separate a parameter from a
command keyword. If a command requires more than one parameter, you must
separate adjacent parameters using a comma as shown below:
"SYST:TIME 10, 34, 48"
A semicolon ( ; ) is used to separate commands within the same subsystem,
and can also minimize typing. For example, sending the following command
string:
"CORR:BEAM 1; WAVE 1310"
... is the same as sending the following two commands:
"CORR:BEAM 1"
"CORR:WAVE 1310"
Use a colon and a semicolon to link commands from different subsystems. For
example, in the following command string, an error is generated if you do not use
both the colon and semicolon:
"CORR:BEAM 1;:AVER 300"
Using the MIN and MAX Parameters
You can substitute MINimum or MAXimum in place of a parameter for many
commands. For example, consider the following command:
CURRent[:DC]:RANGe {MINimum|MAXimum|<numeric_value>[A]}
46
© 2011 Thorlabs
4 Computer Interface
Instead of selecting a specific current range, you can substitute MIN to set the
range to its minimum value or MAX to set the range to its maximum value.
Querying Parameter Settings
You can query the current value of most parameters by adding a question mark (
?) to the command. For example, the following command sets the operating
wavelength to 1550 nm: "CORR:WAVE 1550"
You can query the operating wavelength by executing: "CORR:WAVE?"
You can also query the minimum or maximum operating wavelength allowed as
follows:
"CORR:WAVE? MIN"
"CORR:WAVE? MAX"
Caution
If you send two query commands without reading the response from the first,
and then attempt to read the second response, you may receive some data
from the first response followed by the complete second response. To avoid
this, do not send a query command without reading the response. When you
cannot avoid this situation, send a device clear before sending the second
query command.
SCPI Command Terminators
A command string sent to the power/energy meter must terminate with a <new
line> character. The IEEE-488 EOI (end-or-identify) message is interpreted as a
<new line> character and can be used to terminate a command string in place of
a <new line> character. A <carriage return> followed by a <new line> is also
accepted. Command string termination will always reset the current SCPI
command path to the root level.
IEEE488.2 Common Commands
The IEEE-488.2 standard defines a set of common commands that perform
functions like reset, self-test, and status operations. Common commands always
begin with an asterisk (*), are four to five characters in length, and may include
one or more parameters. The command keyword is separated from the first
parameter by a blank space. Use a semicolon (;) to separate multiple
commands as shown below:
"*RST; *CLS; *ESE 32; *OPC?"
SCPI Parameter Types
The SCPI language defines several different data formats to be used in program
messages and response messages.
© 2011 Thorlabs
47
PM200
Numeric Parameters Commands that require numeric parameters will accept
all commonly used decimal representations of numbers including optional signs,
decimal points, and scientific notation.
Special values for numeric parameters like MINimum, MAXimum and DEFault are
also accepted. You can also send engineering unit suffixes with numeric
parameters (e.g., M,K, or u). If only specific numeric values are accepted, the
power/energy meter will automatically round the input numeric parameters. The
following command uses a numeric parameter:
POWer:REFerence {MINimum|MAXimum|DEFault|<numeric_value>[W]}
Discrete Parameters Discrete parameters are used to program settings that
have a limited number of values (like W,DBM). They can have a short form and a
long form just like command keywords. You can mix upper- and lower-case
letters. Query responses will always return the short form in all upper-case
letters. The following command uses discrete parameters:
POW:UNIT {W|DBM}
Boolean Parameters Boolean parameters represent a single binary condition
that is either true or false. For a false condition, the power/energy meter will
accept “OFF” or “0”. For a true condition, the meter will accept “ON” or “1”. When
you query a boolean setting, the instrument will always return “0” or “1”. The
following command uses a boolean parameter:
CURRent:RANGe:AUTO {OFF|0|ON|1}
String Parameters String parameters can contain virtually any set of ASCII
characters. A string must begin and end with matching quotes; either with a
single quote or with a double quote. You can include the quote delimiter as part
of the string by typing it twice without any characters in between. The following
command uses a string parameter:
DIAG:CALString <quoted string>
48
© 2011 Thorlabs
4 Computer Interface
4.4.2 IEEE488.2 Common Commands
Common commands are device commands that are common to all devices
according to the IEEE488.2 standard. These commands are designed and
defined by this standard. Most of the commands are described in detail in this
section. The following common commands associated with the status structure
are covered in the “Status Structure” section: *CLS, *ESE, *ESE?, *ESR?,
*SRE, *SRE?, *STB?
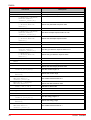
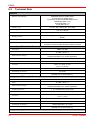
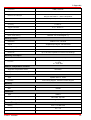
4.4.2.1 Command Summary
Mnemonic
Name
Description
*CLS
Clear status
Clears all event registers and Error Queue
*ESE
<NRf>
Event enable command
Program the Standard Event Enable Register
*ESE?
Event enable query
Read the Standard Event Enable Register
*ESR?
Event status register query
Read and clear the Standard Event Register
*IDN?
Identification query
Read the unit’s identification string
*OPC
Operation complete command
Set the Operation Complete bit in the Standard
Event Register
*OPC?
Operation complete query
Places a “1” into the output queue when all
device operations have been completed
*RST
Reset command
Returns the unit to the *RST default condition
*SRE
<NRf>
Service request enable command Programs the Service Request Enable Register
*SRE?
Service request enable query
Reads the Service Request Enable Register
*STB?
Status byte query
Reads the Status Byte Register
*TST?
Self-test query
Performs the unit’s self-test and returns the
result.
*WAI
Wait-to-continue command
Wait until all previous commands are executed
© 2011 Thorlabs
49
PM200
4.4.2.2 Command Reference
*IDN? – identification query - read identification code
The identification code includes the manufacturer, model code, serial number,
and firmware revision levels and is sent in the following format: THORLABS,
MMM,SSS,X.X.X
Where:
MMMis the model code
SSS is the serial number
X.X.X
is the instrument firmware revision level
*OPC – operation complete - set OPC bit
*OPC? – operation complete query – places a “1” in output queue
When *OPC is sent, the OPC bit in the Standard Event Register will set after all
pending command operations are complete. When *OPC? is sent, an ASCII “1”
is placed in the Output Queue after all pending command operations are
complete.
Typically, either one of these commands is sent after the INITiate command. The
INITiate command is used to take the instrument out of idle in order to perform
measurements. While operating within the trigger model layers, many sent
commands will not execute. After all programmed operations are completed, the
instrument returns to the idle state at which time all pending commands (including
*OPC and/or *OPC?) are executed. After the last pending command is executed,
the OPC bit and/or an ASCII “1” is placed in the Output Queue.
When *OPC is sent, the OPC bit in the Standard Event Register will set after all
pending command operations are complete. When *OPC? is sent, an ASCII “1”
is placed in the Output Queue after all pending command operations are
complete.
*RST – reset – return instrument to defaults
When the *RST command is sent, the instrument performs the following
operations:
Returns the instrument to the default conditions
Cancels all pending commands.
Cancels response to any previously received *OPC and *OPC?
commands.
*TST? – self-test query – run self test and read result
Use this query command to perform the instrument self-test routine. The
command places the coded result in the Output Queue. A returned value of zero
(0) indicates that the test passed, other values indicate that the test failed.
*WAI – wait-to-continue – wait until previous commands are completed
The *WAI command is a no operation command for the instrument and thus,
does not need to be used. It is there for conformance to IEEE488.2.
50
© 2011 Thorlabs
4 Computer Interface
4.4.2.3 PM200 specific SCPI Command Reference
See also SCPI Specification, Version 1999.0, May, 1999, http://www.
scpiconsortium.org . All commands with a ’SCPI’ checkmark are described in the
SCPI specification.
All described commands work also with the PM100D, PM100A and PM100USB
instruments (with some limitations due to the hardware capabilities).
4.4.2.3.1 SYSTem subsystem commands
Command
SYSTem
Description
Path to SYSTem subsystem. (SCPI Vol.2 §21)
:BEEPer
[:IMMediate]
Issue an audible signal. (SCPI Vol.2 §21.2.2)
:STATe {ON|1|OFF|0}
Activate/deactivate the beeper. (SCPI Vol.2 §21.2.3)
:STATe?
Return the state of the the beeper (SCPI Vol.2 §21.2.3)
:ERRor
[:NEXT]?
Returns the latest <error code, “message”>. (SCPI Vol.2 §21.8.8)
:VERSion?
Query level of SCPI standard (1999.0) . (SCPI Vol.2 §21.21)
:DATE <year>,<month>,<day>
Sets the instrument’s calendar. (SCPI Vol.2 §21.7)
:DATE?
Query the instrument’s calendar. (SCPI Vol.2 §21.7)
:TIME <hour>,<min>,<sec>
Sets the instrument’s clock. (SCPI Vol.2 §21.19)
:TIME?
Query the instrument’s clock. (SCPI Vol.2 §21.19)
:LFRequency <numeric value>
Sets the instrument’s line frequency setting to 50 or 60Hz. (SCPI Vol.2
§21.13)
:LFRequency?
Query the instrument’s line frequency setting. (SCPI Vol.2 §21.13)
:SENSor
:IDN?
Query information about the connected sensor. This is a query only
command. The response consists of the following fields: <name >,
<sn >,<cal_msg >,<type >,<subtype >,<flags >
<name>
Sensor name in string response format
<sn>
Sensor serial number in string response format
<cal_msg> calibration message in string response format
<type>
Sensor type in NR1 format
<subtype> Sensor subtype in NR1 format
<flags>
Sensor flags as bitmap in NR1 format.
© 2011 Thorlabs
Flag:
Dec.value:
Is power sensor
1
Is energy sensor
2
Response settable
16
Wavelength settable
32
Tau settable
64
Has temperature sensor
256
51
PM200
4.4.2.3.2 STATus subsystem commands
Command
STATus
:MEASurement
Path to STATus subsystem. (SCPI Vol.2 §20)
Path to control measurement event registers
[:EVENt]?
Read the event register
:CONDition?
Read the condition register
:PTRansition <value>
Program the positive transition filter
:PTRansition?
Read the positive transition filter
:NTRansition <value>
Program the negative transition filter
:NTRansition?
Read the negative transition filter
:ENABle <value>
Program the enable register
:ENABle?
Read the enable register
:AUXillary
Path to control measurement event registers
[:EVENt]?
Read the event register
:CONDition?
Read the condition register
:PTRansition <value>
Program the positive transition filter
:PTRansition?
Read the positive transition filter
:NTRansition <value>
Program the negative transition filter
:NTRansition?
Read the negative transition filter
:ENABle <value>
Program the enable register
:ENABle?
Read the enable register
:OPERation
Path to control operation event registers
[:EVENt]?
Read the event register
:CONDition?
Read the condition register
:PTRansition <value>
Program the positive transition filter
:PTRansition?
Read the positive transition filter
:NTRansition <value>
Program the negative transition filter
:NTRansition?
Read the negative transition filter
:ENABle <value>
Program the enable register
:ENABle?
Read the enable register
:QUEStionable
Path to control questionable event registers
[:EVENt]?
Read the event register
:CONDition?
Read the condition register
:PTRansition <value>
Program the positive transition filter
:PTRansition?
Read the positive transition filter
:NTRansition <value>
Program the negative transition filter
:NTRansition?
Read the negative transition filter
:ENABle <value>
Program the enable register
:ENABle?
Read the enable register
:PRESet
52
Description
Return status registers to default states.
© 2011 Thorlabs
4 Computer Interface
4.4.2.3.3 DISPlay subsystem commands
Command
Description
Path to DISPlay subsystem. (SCPI Vol.2 §8)
DISPlay
:BRIGhtness <value>
Set the display birghtness. (SCPI Vol.2 §8.2)
:BRIGhtness?
Return the display birghtness value. (SCPI Vol.2 §8.2)
:CONTrast <value>
Set the display contrast. (SCPI Vol.2 §8.4)
:CONTrast?
Return the display conrast value. (SCPI Vol.2 §8.4)
4.4.2.3.4 CALibration subsystem commands
Command
Description
Path to CALibration subsystem. (SCPI Vol.2 §5)
CALibration
Returns a human readable calibration string. This is a query only
command. The response is formatted as string response data.
:STRing?
4.4.2.3.5 SENSe subsystem commands
Command
Description
Path to SENSe subsystem. (SCPI Vol.2 §18)
[SENSe]
AVERage
[:COUNt] <value
Sets the averaging rate (1 sample takes approx. 3ms)
[:COUNt]?
Queries the averaging rate
CORRection
[:LOSS[:INPut[:MAGNitude]]]
{MINimum|MAXimum|DEFault|
<numeric_value>}
Sets a user attenuation factor in dB
[:LOSS[:INPut[:MAGNitude]]]?
[{MINimum|MAXimum|DEFault}]
Queries the user attenuation factor
COLLect
ZERO
[:INITiate]
Performs zero adjustment routine
ABORt
Aborts zero adjustment routine
STATe?
Queries the zero adjustment routine state
MAGNitude?
Queries the zero value
BEAMdiameter {MINimum|
MAXimum|DEFault|
<numeric_value>[mm]}
Sets the beam diameter in mm
BEAMdiameter? [{MINimum|
MAXimum|DEFault}]
Queries the beam diameter
WAVelength {MINimum|
MAXimum|
<numeric_value>[nm]}
Sets the operation wavelength in nm
WAVelength? [{MINimum|
MAXimum}]
Queries the operation wavelength
© 2011 Thorlabs
53
PM200
Command
Description
POWer
[:PDIOde]
Sets the photodiode response value in A/W
[:RESPonse] {MINimum|
MAXimum|DEFault|
<numeric_value>[A]}
[:RESPonse]?
[{MINimum|MAXimum|
DEFault}]
Queries the photodiode response value
:THERmopile
[:RESPonse] {MINimum|
MAXimum|DEFault|
<numeric_value>[V]}
Sets the thermopile response value in V/W
[:RESPonse]?
[{MINimum|MAXimum|
DEFault}]
Queries the thermopile response value
ENERgy
[:PYRO]
[:RESPonse] {MINimum|
MAXimum|DEFault|
<numeric_value>[V]}
Sets the pyro-detector response value in V/J
[:RESPonse]?
[{MINimum|MAXimum|
DEFault}]
Queries the pyro-detectro response value
CURRent[:DC]
RANGe
AUTO {OFF|0|ON|1}
Switches the auto-ranging function on and off
AUTO?
Queries the auto-ranging function state
[:UPPer] {MINmum|MAXimum|
<numeric_valuje>[A]}
Sets the current range in A
[:UPPer]? [{MINimum|
MAXimum}]
Queries the current range
REFerence {MINimum|
MAXimum|DEFault|
<numeric_value>[A]}
Sets a delta reference value in A
REFerence? [{MINimum|
MAXimum|DEFault}]
Queries the delta reference value
STATe {OFF|0|ON|1}
Switches to delta mode
STATe?
Queries the delta mode state
ENERgy
RANGe
[:UPPer] {MINmum|MAXimum|
<numeric_valuje>[J]}
Sets the energy range in J
[:UPPer]? [{MINimum|
MAXimum}]
Queries the energy range
REFerence {MINimum|
MAXimum|DEFault|
<numeric_value>[J]}
54
Sets a delta reference value in J
© 2011 Thorlabs
4 Computer Interface
Command
REFerence? [{MINimum|
MAXimum|DEFault}]
Description
Queries the delta reference value
STATe {OFF|0|ON|1}
Switches to delta mode
STATe?
Queries the delta mode state
FREQuency
Range
[UPPer]?
Queries the frequency range
LOWer?
POWer[:DC]
RANGe
AUTO {OFF|0|ON|1}
Switches the auto-ranging function on and off
AUTO?
Queries the auto-ranging function state
[:UPPer] {MINmum|MAXimum|
<numeric_valuje>[W]}
Sets the current range in W
[:UPPer]? [{MINimum|
MAXimum}]
Queries the current range
REFerence {MINimum|
MAXimum|DEFault|
<numeric_value>[W]}
Sets a delta reference value in W
REFerence? [{MINimum|
MAXimum|DEFault}]
Queries the delta reference value
STATe {OFF|0|ON|1}
Switches to delta mode
STATe?
Queries the delta mode state
UNIT {W|DBM}
Sets the power unit W or dBm
UNIT?
Queries the power unit
VOLTage[:DC]
RANGe
AUTO {OFF|0|ON|1}
Switches the auto-ranging function on and off
AUTO?
Queries the auto-ranging function state
[:UPPer] {MINmum|MAXimum|
<numeric_valuje>[V]}
Sets the current range in V
[:UPPer]? [{MINimum|
MAXimum}]
Queries the current range
REFerence {MINimum|
MAXimum|DEFault|
<numeric_value>[V]}
Sets a delta reference value in V
REFerence? [{MINimum|
MAXimum|DEFault}]
Queries the delta reference value
STATe {OFF|0|ON|1}
Switches to delta mode
STATe?
Queries the delta mode state
PEAKdetector
[:THReshold] {MINimum|
MAXimum|DEFault|
<numeric_value>
Sets the trigger level in % for the energy mode
[:THReshold]? [{MINimum|
MAXimum|DEFault}
Queries the trigger level setting
© 2011 Thorlabs
55
PM200
4.4.2.3.6 INPut subsystem commands
Command
INPut
[:PDIode]
:FILTer
[:LPASs]
[STATe] {OFF|0|ON|1}
[STATe]?
:THERmopile
:ACCelerator
[STATe] {OFF|0|ON|1}
[STATe]?
:AUTO {OFF|0|ON|1}
?
:TAU {MINimum|
MAXimum|DEFault|
<numeric_value>[s]}
:TAU? [{MINimum|
MAXimum|DEFault}]
:ADAPter
[:TYPE] {PHOTodiode|
THERmal|PYRo}
[:TYPE]?
56
Description
Sets the bandwidth of the photodiode input stage
Queries the bandwidth of the photodiode inut stage
Sets the thermopile accelerator state
Queries the thermopile accelerator state
Sets the thermopile accelerator to auto mode
Queries thermopile accelerator auto mode
Sets thermopile time constant 0-63% in s
Queries the thermopile time constant in s
Sets default sensor adapter type
Queries default sensor adapter type
© 2011 Thorlabs
4 Computer Interface
4.4.2.3.7 Measurement commands
Command
Description
INITiate[:IMMediate]
Start measurement
ABORt
Abort measurement
CONFigure[:SCALar]
[:POWer]
Configure for power measurement
:CURRent[:DC]
Configure for current measurement
:VOLTage[:DC]
Configure for voltage measurement
:ENERgy
Configure for energy measurement
:FREQuency
Configure for frequency measurement
:PDENsity
Configure for power density measurement
:EDENsity
Configure for energy density measurement
:RESistance
Configure for sensor presence resistance measurement
:TEMPerature
Configure for sensor temperature measurement
MEASure[:SCALar]
[:POWer]
Performs a power measurement
:CURRent[:DC]
Performs a current measurement
:VOLTage[:DC]
Performs a voltage measurement
:ENERgy
Performs a energy measurement
:FREQuency
Performs a frequency measurement
:PDENsity
Performs a power density measurement
:EDENsity
Performs a energy density measurement
:RESistance
Performs a sensor presence resistance measurement
:TEMPerature
Performs a sensor temperature measurement
FETCh?
Read last measurement data (SCPI Vol.2 §3.2)
READ?
Start new measurement and read data (SCPI Vol.2 §3.3)
CONFigure?
Query the current measurement configuration.
© 2011 Thorlabs
57
PM200
4.4.3 Simple LabVIEW Example using SCPI commands
PM100D Simple Example.vi
This VI shows how to communicate with a PM200 optical power/energy
meter with SCPI commands. The following steps are demonstrated within
this application:
- Initializing the instrument
- Getting system info
- Setting parameters
- Measurement configuration
- Measuring queue
- Fetching and displaying a measurement value
- Closing the application
Block diagram
58
© 2011 Thorlabs
4 Computer Interface
Averaging Rate
Sets the averaging rate - 3000 averages take approximately 1s for performing a new
measurement value
Readout Config
Selects the measurement parameter
- POW power measurement in W
- CURR current measurement in A
- VOLT voltage measuremetn in V
- ENER energy measurement in J
- FREQ frequency / repetition rate measurement in Hz
- PDEN power density measurement in W/cm²
- EDEN energy density measurement in J/cm²
- RES thermistor resistance measurement in Ohm
- TEMP temperature measurement in °C
Stop
Stops application
Timeout [ms]
Sets a timeout value in ms that allows the instrument to sample.
The timeout must be longer than it takes to perform a new measurement. This has
especially to be considered when performing single shot energy measurements.
© 2011 Thorlabs
59
PM200
Error log
Error indicator, 'no error' is suppressed
Readout string
Formatted measurement value
- limitation to 4 significant digits
- SI notation
- '.' decimal separator
- appended unit according readout configuration
New
Indicator lights up, when a new measurement value is processed
Sensor Flags
Sensor flag bitmap:
1 Is power sensor
2 Is energy sensor
16 Response settable
32 Wavelength settable
64 Tau settable
256 Has temperature sensor
Sensor Name
Name of connected power/energy sensor
Sensor SN
Serial number of connected power/energy sensor
IDN String
Answer from instrument on *idn? command:
- manufacturer
- model number
- serial number
- firmware version
Readout value
Plain readout value in full resolution
PM100D_Initialize.vi
This VI scans for connected devices, that can be selected in a dialog box. Next steps
- setting timeout
- performing identification query
- configuring the operation register to '512'; flag gets to HI when a new measurement
value is ready to fetch
- clear operation register
PM100D_Write.vi
Writes a SCPI command to the connected instrument
60
© 2011 Thorlabs
4 Computer Interface
PM100D_Read.vi
Reads data from the connected instrument. All query commands according the SCPI
command table are terminated by a question mark (?)
PM100D_SensorFlag.vi
This VI queries all relevant sensor info with SYST:SENS:IDN?
- sensor name
- sensor serial number
- calibration message
- sensor type
- sensor sub-type
- sensor flags
PM100D_ConfMeas.vi
- CONFigure measurement; CONF:<parameter> (POW, ENER, etc.)
- ABORt measurement
- Clear operation register with STAT:OPER?
- INITiate measurement
PM100D_SYST-ERR.vi
This VI lists all errors coming from the instrument with the command SYST:ERR?
'no error' is suppressed
PM100D_Close.vi
Closes the VISA session
Sets the connected instrument in local mode (default option)
© 2011 Thorlabs
61
PM200
5
Maintenance and Service
Protect the PM200 from adverse weather conditions. The PM200 is not water
resistant.
Attention
To avoid damage to the instrument, do not expose it to spray, liquids or solvents!
The unit does not need a regular maintenance by the user. It does not contain
any modules and/or components that could be repaired by the user himself. If a
malfunction occurs, please contact Thorlabs 72 for return instructions.
Do not remove covers!
5.1
Troubleshooting
Unit does not work at all (no display at the front)
PM100D turned on? Press On switch in the left side panel.
PM100D battery discharged / defect -> Plug in AC Adapter
Unit automatically switches off
Check auto-shutoff setting
Check battery charging symbol
Plug in AC Adapter
Power or Energy reading is negative
A photodiode or thermal sensor is connected
Check if the unit is in relative measurement mode
Conduct the dark current adjustment procedure
A photodiode is connected
Check the polarity of the connected photodiode
A thermal element is connected
Check the polarity of the connected thermal element
A pyro-electric element is connected
Check the polarity of the connected pyro element
Pulse energy measurement cannot be measured or is measured wrongly
Check for the right trigger level between noise level and expected pulse
height
Check if energy sensor can handle the laser pulse repetition rate
A connected USB stick is recognized, but not read out
Try another USB stick
If you cannot resolve your issue using above hints, please contact Thorlabs 72 .
62
© 2011 Thorlabs
6 Appendix
6
Appendix
6.1
Sensor Connector Pinning
The PM200 is capable to support custom made detectors. Please read carefully
the following instruction prior to connecting a self made sensor.
Pin-out of the 9pin DSUB
sensor connector (female)
pin
connection
3
AGND (analog ground): photodiode ground (anode), thermal and pyro sensor
ground
4
photodiode cathode
5
pyroelectric sensor +
8
thermal sensor +
7
PRESENT: Connect this pin via a 1kΩ – 10kΩ resistor to pin 3 (AGND) to enable
a custom sensor
1
+5V (max. current 50mA from this pin)
6
DGND (digital ground)
9
n.c.
Warning
Pin 2 is uniquely used for the EEPROM Digital I/O (memory in Thorlabs sensor
heads) and MUST NOT be used. Connecting this pin may cause malfunction of
the PM200.
© 2011 Thorlabs
63
PM200
6.2
Technical Data
Features
Detector Compatibility
Photodiode Sensors S100C Series
Thermal Sensors S300C Series
Pyroelectric Sensors ES100C/ES200C Series
Photodiodes (Max 5 mA)
Thermopiles (Max 1 V)
Pyros (Max 100 V)
Display Type
5.7" TFT, 640 x 480 Pixels, 18 bit Color
Viewing Area
118 mm x 88 mm
Display Update Rate (max)
Display Format
Backlight Display
Features
100 Hz
Numerical, Bargraph, Trendgraph, Statistics, Simulated Analog
Needle
LED, Adjustable
Rotatable Two Position Kickstand, Removable Rubberboot,
Touch-Pen, Fixture for Optional Fiber Inspection Camera
Current Input (Photodiode Sensors)
Connector
Units
Measurement Ranges
Display Resolution
AD Converter
DB9F, Left Side
W, dBm, W/cm², A
6 Decades; 50 nA - 5 mA
Ranges Selectable in W, Sensor Dependent
1 pA / Responsivity Value (A/W)
16 bit
Accuracy
±0.2% f.s. (5 µA - 5 mA)
±0.5% f.s. (50 nA)
Bandwidth
DC - 100 kHz, Dependent on Sensor and Settings
Wavelength Correction
Beam Area Setting
nm (A/W)
Diameter 1/e² or Rectangular x,y
Voltage Input (Thermopile Sensors)
Connector
Units
Measurement Ranges
Display Resolution
AD Converter
DB9F, Left Side
W, dBm, W/cm², V
4 Decades; 1 mV - 1 V
Ranges Selectable in W, Sensor Dependent
1 µV / Responsivity Value (V/W)
16 bit
Accuracy
±0.5% f.s. (10 mV - 1 V)
±1% f.s. (1mV)
Bandwidth
DC - 10 Hz, Dependent on Sensor and Settings
Time Constant Correction Range
Wavelength Correction
Beam Area Setting
1 s - 30 s
Sensor Dependent; nm, (V/W)
Diameter 1/e² or Rectangular x,y
Voltage Input (Pyro Sensors)
64
© 2011 Thorlabs
6 Appendix
Connector
Units
Measurement Ranges
Display Resolution
AD Converter
Accuracy
Trigger Threshold
Max. Repetition Rate
Wavelength Correction
Beam Area Setting
DB9F, Left Side
J, J/cm², W, W/cm², V
4 Decades; 200 mV - 2V - 20 V - 100 V
Ranges Selectable in J, Sensor Dependent
100 µV / Responsivity Value (V/J)
16 bit
± 0.5% f.s.
0.1% - 99.9% f.s.
3 kHz
Sensor Dependent [nm, V/J]
Diameter 1/e² or Rectangular x,y
Analog Output
Connector
Signal
Voltage Range
Audio 3.5 mm, Left Side
Amplified Input Signal - Not Corrected
0 to 2 V
Accuracy
±3%
Bandwidth
up to 100 kHz, Dependent on Sensor and Settings
Auxiliary In-/Output
Connector
Function
2 x 6 Pins, 0.1" Socket, Top Side
External Trigger Input
4 x GPIO
2 x 10 bit ADC
Sensor Temperature Control
Supported Temperature Sensor
Temperature Measurement Range
Thermistor
-10 °C to +80 °C
Sound
Type
Function
Speaker 300 Hz - 5 kHz
Laser Tuning Support, Console Function Support
Memory
Type
Nand Flash
Size
128 MB
Interfaces
Type
Connector (Host)
Connector (Device)
USB2.0
Mini USB, Top Side
USB Type A, Left Side
Power Management
Battery
LiPo 3.7 V 2600 mAh
Charger / DC Input
5V / 2A
Power Connector
Center Hole
© 2011 Thorlabs
65
PM200
General
Operating Temperature Range 1)
Storage Temperature Range
Dimensions (W x H x D)
Weight
0 - 40 °C
-40 to 70 °C
170 mm x 125 mm x 38 mm
0.57 kg
1
) non-condensing
All technical data are valid at 23 ± 5°C and 45 ± 15% rel. humidity (non condensing)
66
© 2011 Thorlabs
6 Appendix
6.3
Certifications and Compliances
Category
Standards or description
EC Declaration of Conformity - EMC
Meets intent of Directive 2004/108/EC 1) for Electromagnetic
Compatibility. Compliance was demonstrated to the following
specifications as listed in the Official Journal of the European
Communities:
EN 61326:2006
EMC requirements for Class A electrical equipment for measurement,
control and laboratory use, including Class A Radiated and Conducted
Emissions 2,3,4) and Immunity. 2,3,4)
IEC 61000-4-2
Electrostatic Discharge Immunity (Performance criterion B)
IEC 61000-4-3
Radiated RF Electromagnetic Field Immunity (Performance criterion A)
IEC 61000-4-4
Electrical Fast Transient / Burst immunity (Performance criterion B)
FCC EMC Compliance
Emissions comply with the Class A Limits of FCC Code of Federal
Regulations 47, Part 15, Subpart B 2,3,4).
EC Declaration of Conformity - Low
Voltage
Compliance was demonstrated to the following specification as listed in
the Official Journal of the European Communities: Low Voltage
Directive 2006/95/EC 5)
EN 61010-1:2001
Safety requirements for electrical equipment for measurement, control
and laboratory use.
UL 61010-1 2nd ed.
Safety requirements for electrical equipment for measurement, control
and laboratory use.
CAN/CSA C22.2 No. 61010-1 2nd ed. Safety requirements for electrical equipment for measurement, control
and laboratory use.
IEC 61010-1:2001
Safety requirements for electrical equipment for measurement, control
and laboratory use.
Equipment Type
Test and measuring
Safety Class
Class I equipment (as defined in IEC 60950-1:2001)
1
) Replaces 89/336/EEC
) Compliance demonstrated using high-quality shielded interface cables.
3
) Emissions, which exceed the levels required by these standards, may occur when this equipment is connected to
a test object.
4
) Minimum Immunity Test requirement.
5
) Replaces 73/23/EEC, amended by 93/68/EEC.
2
© 2011 Thorlabs
67
PM200
6.4
Warranty
Thorlabs warrants material and production of the PM200 for a period of 24 months starting with the
date of shipment. During this warranty period Thorlabs will see to defaults by repair or by
exchange if these are entitled to warranty.
For warranty repairs or service the unit must be sent back to Thorlabs. The customer will carry the
shipping costs to Thorlabs, in case of warranty repairs Thorlabs will carry the shipping costs back
to the customer.
If no warranty repair is applicable the customer also has to carry the costs for back shipment.
In case of shipment from outside EU duties, taxes etc. which should arise have to be carried by the
customer.
Thorlabs warrants the hard- and software determined by Thorlabs for this unit to operate fault-free
provided that they are handled according to our requirements. However, Thorlabs does not warrant
a fault free and uninterrupted operation of the unit, of the software or firmware for special
applications nor this instruction manual to be error free. Thorlabs is not liable for consequential
damages.
Restriction of warranty
The warranty mentioned before does not cover errors and defects being the result of improper
treatment, software or interface not supplied by us, modification, misuse or operation outside the
defined ambient stated by us or unauthorized maintenance.
Further claims will not be consented to and will not be acknowledged. Thorlabs does explicitly not
warrant the usability or the economical use for certain cases of application.
Thorlabs reserves the right to change this instruction manual or the technical data of the described
unit at any time.
68
© 2011 Thorlabs
6 Appendix
6.5
Copyright
Thorlabs GmbH has taken every possible care in preparing this Operation Manual. We however
assume no liability for the content, completeness or quality of the information contained therein.
The content of this manual is regularly updated and adapted to reflect the current status of the
software. We furthermore do not guarantee that this product will function without errors, even if the
stated specifications are adhered to.
Under no circumstances can we guarantee that a particular objective can be achieved with the
purchase of this product.
Insofar as permitted under statutory regulations, we assume no liability for direct damage, indirect
damage or damages suffered by third parties resulting from the purchase of this product. In no
event shall any liability exceed the purchase price of the product.
Please note that the content of this User Manual is neither part of any previous or existing
agreement, promise, representation or legal relationship, nor an alteration or amendment thereof.
All obligations of Thorlabs GmbH result from the respective contract of sale, which also includes
the complete and exclusively applicable warranty regulations. These contractual warranty
regulations are neither extended nor limited by the information contained in this User Manual.
Should you require further information on this product, or encounter specific problems that are not
discussed in sufficient detail in the User Manual, please contact your local Thorlabs dealer or
system installer.
All rights reserved. This manual may not be reproduced, transmitted or translated to another
language, either as a whole or in parts, without the prior written permission of Thorlabs GmbH.
Status: 2011
Copyright © Thorlabs GmbH. All rights reserved.
© 2011 Thorlabs
69
PM200
6.6
Thorlabs 'End of Life' Policy (WEEE)
As required by the WEEE (Waste Electrical and Electronic Equipment Directive) of the European
Community and the corresponding national laws, Thorlabs offers all end users in the EC the
possibility to return “end of life” units without incurring disposal charges.
This offer is valid for Thorlabs electrical and electronic equipment
sold after August 13th 2005
marked correspondingly with the crossed out “wheelie bin” logo (see Figure 58)
sold to a company or institute within the EC
currently owned by a company or institute within the EC
still complete, not disassembled and not contaminated
As the WEEE directive applies to self contained operational electrical and electronic products, this
“end of life” take back service does not refer to other Thorlabs products, such as
pure OEM products, that means assemblies to be built into a unit by the user (e. g. OEM
laser driver cards)
components
mechanics and optics
left over parts of units disassembled by the user (PCB’s, housings etc.).
Waste treatment on your own responsibility
If you do not return an “end of life” unit to Thorlabs, you must hand it to a company specialized in
waste recovery. Do not dispose of the unit in a litter bin or at a public waste disposal site.
WEEE Number (Germany) : DE97581288
Ecological background
It is well known that waste treatment pollutes the environment by releasing toxic products during
decomposition. The aim of the European RoHS Directive is to reduce the content of toxic
substances in electronic products in the future.
The intent of the WEEE Directive is to enforce the recycling of WEEE. A controlled recycling of
end-of-life products will thereby avoid negative impacts on the environment.
Crossed out
"Wheelie Bin" symbol
70
© 2011 Thorlabs
6 Appendix
6.7
Listings
6.7.1 List of Acronyms
The following acronyms and abbreviations are used in this manual:
ADC
CW
dB
DB-9
DC
GPIO
LED
NTC
USB
© 2011 Thorlabs
Analog-to-Digital Converter
Continuous Wave
Dezibel
Standard 9 pin D-SUB connector
Direct Currect
General Purpose Input / Output
Light Emitting Diode
Negative Temperature Coefficient
Universal Serial Bus
71
PM200
6.7.2 Thorlabs Worldwide Contacts
USA, Canada, and South America
Thorlabs, Inc.
435 Route 206
Newton, NJ 07860
USA
Tel: 973-579-7227
Fax: 973-300-3600
www.thorlabs.com
www.thorlabs.us (West Coast)
Email: [email protected]
Support: [email protected]
Europe
Thorlabs GmbH
Hans-Böckler-Str. 6
85221 Dachau
Germany
Tel: +49-8131-5956-0
Fax: +49-8131-5956-99
www.thorlabs.de
Email: [email protected]
UK and Ireland
Thorlabs Ltd.
1 Saint Thomas Place, Ely
Cambridgeshire CB7 4EX
Great Britain
Tel: +44-1353-654440
Fax: +44-1353-654444
www.thorlabs.com
Email: [email protected]
Support: [email protected]
France
Thorlabs SAS
109, rue des Côtes
78600 Maisons-Laffitte
France
Tel: +33-970 444 844
Fax: +33-811 381 748
www.thorlabs.com
Email: [email protected]
Scandinavia
Thorlabs Sweden AB
Box 141 94
400 20 Göteborg
Sweden
Tel: +46-31-733-30-00
Fax: +46-31-703-40-45
www.thorlabs.com
Email: [email protected]
Japan
Thorlabs Japan, Inc.
Higashi Ikebukuro
Q Building 1st Floor 2-23-2
Toshima-ku, Tokyo 170-0013
Japan
Tel: +81-3-5979-8889
Fax: +81-3-5979-7285
www.thorlabs.jp
Email: [email protected]
China
Thorlabs China
Oasis Middlering Centre
3 Building 712 Room
915 Zhen Bei Road
Shanghai
China
Tel: +86-21-32513486
Fax: +86-21-32513480
www.thorlabs.hk
Email: [email protected]
72
© 2011 Thorlabs