1
To our customers,
Old Company Name in Catalogs and Other Documents
On April 1st, 2010, NEC Electronics Corporation merged with Renesas Technology
Corporation, and Renesas Electronics Corporation took over all the business of both
companies. Therefore, although the old company name remains in this document, it is a valid
Renesas Electronics document. We appreciate your understanding.
Renesas Electronics website: http://www.renesas.com
April 1st, 2010
Renesas Electronics Corporation
Issued by: Renesas Electronics Corporation (http://www.renesas.com)
Send any inquiries to http://www.renesas.com/inquiry.
Notice
1.
2.
3.
4.
5.
6.
7.
All information included in this document is current as of the date this document is issued. Such information, however, is
subject to change without any prior notice. Before purchasing or using any Renesas Electronics products listed herein, please
confirm the latest product information with a Renesas Electronics sales office. Also, please pay regular and careful attention to
additional and different information to be disclosed by Renesas Electronics such as that disclosed through our website.
Renesas Electronics does not assume any liability for infringement of patents, copyrights, or other intellectual property rights
of third parties by or arising from the use of Renesas Electronics products or technical information described in this document.
No license, express, implied or otherwise, is granted hereby under any patents, copyrights or other intellectual property rights
of Renesas Electronics or others.
You should not alter, modify, copy, or otherwise misappropriate any Renesas Electronics product, whether in whole or in part.
Descriptions of circuits, software and other related information in this document are provided only to illustrate the operation of
semiconductor products and application examples. You are fully responsible for the incorporation of these circuits, software,
and information in the design of your equipment. Renesas Electronics assumes no responsibility for any losses incurred by
you or third parties arising from the use of these circuits, software, or information.
When exporting the products or technology described in this document, you should comply with the applicable export control
laws and regulations and follow the procedures required by such laws and regulations. You should not use Renesas
Electronics products or the technology described in this document for any purpose relating to military applications or use by
the military, including but not limited to the development of weapons of mass destruction. Renesas Electronics products and
technology may not be used for or incorporated into any products or systems whose manufacture, use, or sale is prohibited
under any applicable domestic or foreign laws or regulations.
Renesas Electronics has used reasonable care in preparing the information included in this document, but Renesas Electronics
does not warrant that such information is error free. Renesas Electronics assumes no liability whatsoever for any damages
incurred by you resulting from errors in or omissions from the information included herein.
Renesas Electronics products are classified according to the following three quality grades: “Standard”, “High Quality”, and
“Specific”. The recommended applications for each Renesas Electronics product depends on the product’s quality grade, as
indicated below. You must check the quality grade of each Renesas Electronics product before using it in a particular
application. You may not use any Renesas Electronics product for any application categorized as “Specific” without the prior
written consent of Renesas Electronics. Further, you may not use any Renesas Electronics product for any application for
which it is not intended without the prior written consent of Renesas Electronics. Renesas Electronics shall not be in any way
liable for any damages or losses incurred by you or third parties arising from the use of any Renesas Electronics product for an
application categorized as “Specific” or for which the product is not intended where you have failed to obtain the prior written
consent of Renesas Electronics. The quality grade of each Renesas Electronics product is “Standard” unless otherwise
expressly specified in a Renesas Electronics data sheets or data books, etc.
“Standard”:
8.
9.
10.
11.
12.
Computers; office equipment; communications equipment; test and measurement equipment; audio and visual
equipment; home electronic appliances; machine tools; personal electronic equipment; and industrial robots.
“High Quality”: Transportation equipment (automobiles, trains, ships, etc.); traffic control systems; anti-disaster systems; anticrime systems; safety equipment; and medical equipment not specifically designed for life support.
“Specific”:
Aircraft; aerospace equipment; submersible repeaters; nuclear reactor control systems; medical equipment or
systems for life support (e.g. artificial life support devices or systems), surgical implantations, or healthcare
intervention (e.g. excision, etc.), and any other applications or purposes that pose a direct threat to human life.
You should use the Renesas Electronics products described in this document within the range specified by Renesas Electronics,
especially with respect to the maximum rating, operating supply voltage range, movement power voltage range, heat radiation
characteristics, installation and other product characteristics. Renesas Electronics shall have no liability for malfunctions or
damages arising out of the use of Renesas Electronics products beyond such specified ranges.
Although Renesas Electronics endeavors to improve the quality and reliability of its products, semiconductor products have
specific characteristics such as the occurrence of failure at a certain rate and malfunctions under certain use conditions. Further,
Renesas Electronics products are not subject to radiation resistance design. Please be sure to implement safety measures to
guard them against the possibility of physical injury, and injury or damage caused by fire in the event of the failure of a
Renesas Electronics product, such as safety design for hardware and software including but not limited to redundancy, fire
control and malfunction prevention, appropriate treatment for aging degradation or any other appropriate measures. Because
the evaluation of microcomputer software alone is very difficult, please evaluate the safety of the final products or system
manufactured by you.
Please contact a Renesas Electronics sales office for details as to environmental matters such as the environmental
compatibility of each Renesas Electronics product. Please use Renesas Electronics products in compliance with all applicable
laws and regulations that regulate the inclusion or use of controlled substances, including without limitation, the EU RoHS
Directive. Renesas Electronics assumes no liability for damages or losses occurring as a result of your noncompliance with
applicable laws and regulations.
This document may not be reproduced or duplicated, in any form, in whole or in part, without prior written consent of Renesas
Electronics.
Please contact a Renesas Electronics sales office if you have any questions regarding the information contained in this
document or Renesas Electronics products, or if you have any other inquiries.
(Note 1) “Renesas Electronics” as used in this document means Renesas Electronics Corporation and also includes its majorityowned subsidiaries.
(Note 2) “Renesas Electronics product(s)” means any product developed or manufactured by or for Renesas Electronics.
User’s Manual
ID850QB Ver. 3.40
Integrated Debugger
Operation
Target Device
V850 Microcontrollers
Document No. U18604EJ1V0UM00 (1st edition)
Date Published March 2007 CP(K)
© NEC Electronics Corporation 2007
Printed in Japan
[MEMO]
2
User’s Manual U18604EJ1V0UM
IECUBE is a registered trademark of NEC Electronics Corporation in Japan and Germany.
MINICUBE is a registered trademark of NEC Electronics Corporation in Japan and Germany or a
trademark in the United States of America.
Windows is a registered trademark or a trademark of Microsoft Corporation in the United States and/or
other countries.
Pentium is a trademark of Intel Corporation.
MULTI is a trademark of Green Hills Software, Inc.
User’s Manual U18604EJ1V0UM
3
• The information in this document is current as of March, 2007. The information is subject to change
without notice. For actual design-in, refer to the latest publications of NEC Electronics data sheets or
data books, etc., for the most up-to-date specifications of NEC Electronics products. Not all
products and/or types are available in every country. Please check with an NEC Electronics sales
representative for availability and additional information.
• No part of this document may be copied or reproduced in any form or by any means without the prior
written consent of NEC Electronics. NEC Electronics assumes no responsibility for any errors that may
appear in this document.
• NEC Electronics does not assume any liability for infringement of patents, copyrights or other intellectual
property rights of third parties by or arising from the use of NEC Electronics products listed in this document
or any other liability arising from the use of such products. No license, express, implied or otherwise, is
granted under any patents, copyrights or other intellectual property rights of NEC Electronics or others.
• Descriptions of circuits, software and other related information in this document are provided for illustrative
purposes in semiconductor product operation and application examples. The incorporation of these
circuits, software and information in the design of a customer's equipment shall be done under the full
responsibility of the customer. NEC Electronics assumes no responsibility for any losses incurred by
customers or third parties arising from the use of these circuits, software and information.
• While NEC Electronics endeavors to enhance the quality, reliability and safety of NEC Electronics products,
customers agree and acknowledge that the possibility of defects thereof cannot be eliminated entirely. To
minimize risks of damage to property or injury (including death) to persons arising from defects in NEC
Electronics products, customers must incorporate sufficient safety measures in their design, such as
redundancy, fire-containment and anti-failure features.
• NEC Electronics products are classified into the following three quality grades: "Standard", "Special" and
"Specific".
The "Specific" quality grade applies only to NEC Electronics products developed based on a customerdesignated "quality assurance program" for a specific application. The recommended applications of an NEC
Electronics product depend on its quality grade, as indicated below. Customers must check the quality grade of
each NEC Electronics product before using it in a particular application.
"Standard": Computers, office equipment, communications equipment, test and measurement equipment, audio
and visual equipment, home electronic appliances, machine tools, personal electronic equipment
and industrial robots.
"Special": Transportation equipment (automobiles, trains, ships, etc.), traffic control systems, anti-disaster
systems, anti-crime systems, safety equipment and medical equipment (not specifically designed
for life support).
"Specific": Aircraft, aerospace equipment, submersible repeaters, nuclear reactor control systems, life
support systems and medical equipment for life support, etc.
The quality grade of NEC Electronics products is "Standard" unless otherwise expressly specified in NEC
Electronics data sheets or data books, etc. If customers wish to use NEC Electronics products in applications
not intended by NEC Electronics, they must contact an NEC Electronics sales representative in advance to
determine NEC Electronics' willingness to support a given application.
(Note)
(1) "NEC Electronics" as used in this statement means NEC Electronics Corporation and also includes its
majority-owned subsidiaries.
(2) "NEC Electronics products" means any product developed or manufactured by or for NEC Electronics (as
defined above).
M8E 02. 11-1
4
User’s Manual U18604EJ1V0UM
[MEMO]
User’s Manual U18604EJ1V0UM
5
[MEMO]
6
User’s Manual U18604EJ1V0UM
PREFACE
Target Readers
This manual is intended for user engineers who design and develop application
systems of the V850 microcontrollers.
Purpose
This manual is intended for users to understand the functions of the ID850QB in the
organization below.
Organization
This manual consists of the following chapters:
• OVERVIEW
• INSTALLATION
• STARTING AND TERMINATING
• ASSOCIATION WITH PM+
• DEBUG FUNCTION
• WINDOW REFERENCE
• COMMAND REFERENCE
How to Use This Manual
It is assumed that the readers of this manual have general knowledge of electrical
engineering, logic circuits, microcontrollers, C language, and assemblers.
To understand the functions of the V850 microcontrollers
→ Refer to Hardware User's Manual for each product.
To understand the instruction functions of the V850 microcontrollers
→ Refer to V850ES Architecture User’s Manual (U15943E) or V850E1
Architecture User’s Manual (U14559E).
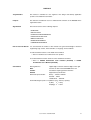
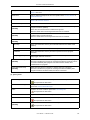
Conventions
Data significance:
Higher digits on the left and lower digits on the right
Note:
Footnote for item marked with Note in the text
Caution:
Information requiring particular attention
Remark:
Supplementary information
Numerical representation:
Binary … XXXX or XXXXB
Decimal ... XXXX
Hexadecimal … 0xXXXX
Prefix indicating the power of 2 (address space, memory capacity):
K (Kilo):
210 = 1024
M (Mega): 220 = 10242
User’s Manual U18604EJ1V0UM
7
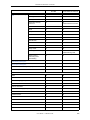
Related Documents
Refer to the documents listed below when using this manual.
The related documents indicated in this publication may include preliminary versions.
However, preliminary versions are not marked as such.
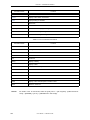
Documents related to development tools (User's Manuals)
Document Name
Document No.
IE-V850E1-CD-NW(PCMCIA Card Type On-Chip Debug Emulator)
U16647E
QB-V850ESSX2(In-circuit emulator for V850ES/SG2, V850ES/SJ2)
U17091E
QB-V850IA4(In-circuit emulator for V850ES/IK1, V850E/IA3, V850E/IA4)
U17167E
QB-V850ESKX1(In-circuit emulator for V850ES/Kx1, V850ES/Kx1+)
U17214E
CA850 Ver. 2.70 C Compiler Package
Operation
U16932E
C Language
U16930E
Assembly Language
U16931E
Link Directives
U16933E
Operation
U17293E
C Language
U17291E
Assembly Language
U17292E
Link Directives
U17294E
CA850 Ver. 3.00 C Compiler Package
PM+ Ver.6.00 Project Manager
U17178E
ID850QB Ver. 3.40 Integrated Debugger
Operation
This manual
SM+ System Simulator
Operation
U18010E
User Open Interface
U17663E
SM850 Ver. 2.50 System Simulator
Operation
U16218E
SM850 Ver. 2.00 or Later System Simulator
External Part User Open Interface
U14873E
Specifications
RX850 Ver. 3.20 Real-Time OS
RX850 Pro Ver. 3.20 Real-Time OS
Basics
U13430E
Installation
U17419E
Technical
U13431E
Task Debugger
U17420E
Fundamental
U13773E
Installation
U17421E
Technical
U13772E
Task Debugger
U17422E
AZ850 Ver. 3.30 System Performance Analyzer
U17423E
PG-FP4 Flash Memory Programmer
U15260E
TW850 Ver.2.00 Performance Analysis Tuning Tool
U17241E
8
User’s Manual U18604EJ1V0UM
CONTENTS
CHAPTER 1 OVERVIEW ... 18
1.1 Features ... 19
1.1.1 New functions, enhanced functions ... 19
1.1.2 Other functions ... 20
1.2 System Configuration ... 21
1.3 Operating Environment ... 23
1.3.1 Hardware environment ... 23
1.3.2 Software environment ... 23
1.4 Cautions During Debugging ... 24
1.4.1 When performing source level debugging ... 24
1.4.2 Security ID [MINICUBE] [MINICUBE2] ... 24
1.5 Notes on Using GHS Compiler ... 25
1.5.1 Supported version ... 25
1.5.2 Option added for debugging (debug option) ... 25
1.5.3 Cautions on Using DWARF2 Load Module ... 25
CHAPTER 2 INSTALLATION ... 26
2.1 Installing ... 26
2.2 Uninstalling ... 26
CHAPTER 3 STARTING AND TERMINATING ... 27
3.1 Cautions Before Starting [MINICUBE] [MINICUBE2] ... 27
3.2 Cautions on connecting Midas Lab emulator ... 28
3.3 Startup Option and Argument Specification ... 29
3.3.1 Specification method ... 29
3.3.2 Specification format and options ... 30
3.4 Starting ... 31
3.5 Terminating ... 32
3.6 Error Messages at Start Up ... 33
3.6.1 When the IECUBE is connected ... 33
3.6.2 When the N-Wire CARD or MINICUBE is connected ... 34
3.6.3 When the MINICUBE2 is connected ... 35
CHAPTER 4 ASSOCIATION WITH PM+ ... 36
4.1 Setting Build Mode ... 36
4.2 Registering Debugger to PM+ Project ... 36
4.2.1 Selecting debugger ... 36
4.2.2 Downloading multiple load module files ... 37
4.3 To Start ID850QB from PM+ ... 38
4.3.1 Restoring debugging environment ... 38
4.4 Auto Load ... 39
4.4.1 Auto load by correcting source code ... 39
4.4.2 Auto load by starting debugger ... 40
CHAPTER 5 DEBUG FUNCTION ... 41
5.1 Setting Debugging Environment ... 42
5.1.1 Setting operating environment ... 42
5.1.2 Setting option ... 42
5.1.3 Setting mapping ... 43
5.1.4 To change the value of a register required for access of an external memory ... 43
5.2 Download Function, Upload Function ... 44
5.2.1 Download ... 44
5.2.2 Downloading to External Flash Memory ... 45
5.2.3 Upload ... 46
5.3 Source Display, Disassemble Display Function ... 47
5.3.1 Source display ... 47
5.3.2 Disassemble display ... 47
User’s Manual
U18604EJ1V0UM
9
5.3.3 Mixed display mode (Source Window) ... 48
5.3.4 Convert symbol (symbol to address) ... 49
5.4 Break Function ... 50
5.4.1 Break types ... 50
5.4.2 Breakpoint setting ... 51
5.4.3 Setting breaks to variables ... 52
5.4.4 Hardware break and software break ... 52
5.4.5 Fail-safe break function [IECUBE] ... 54
5.4.6 Cautions ... 54
5.5 Program Execution Function ... 56
5.5.1 Execution types ... 56
5.5.2 Cautions ... 58
5.6 Watch Function ... 60
5.6.1 Displaying and changing data values ... 60
5.6.2 Displaying and changing local variable values ... 61
5.6.3 Registering and deleting watch data ... 61
5.6.4 Changing watch data ... 62
5.6.5 Temporarily displaying and changing data values ... 62
5.6.6 Callout watch function ... 62
5.6.7 Stack trace display function ... 63
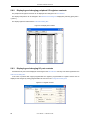
5.7 Memory Manipulation Function ... 64
5.7.1 Displaying and changing memory contents ... 64
5.7.2 Access monitor function [IECUBE] ... 65
5.7.3 Filling, copying, and comparing memory contents ... 65
5.7.4 Flash memory writing function [MINICUBE] [MINICUBE2] ... 66
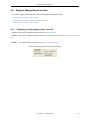
5.8 Register Manipulation Function ... 67
5.8.1 Displaying and changing register contents ... 67
5.8.2 Displaying and changing peripheral I/O registers contents ... 68
5.8.3 Displaying and changing I/O port contents ... 68
5.9 Timer Function [IECUBE] ... 69
5.9.1 Timer event conditions ... 70
5.9.2 Run-Break event ... 70
5.9.3 Cautions ... 71
5.10 Trace Function [IECUBE] ... 72
5.10.1 Trace memory ... 72
5.10.2 Setting trace data ... 73
5.10.3 Checking trace data ... 73
5.10.4 Mixed display mode (Trace View Window) ... 74
5.10.5 Tracer operation ... 74
5.10.6 Setting conditional trace ... 76
5.10.7 DMA point trace function ... 76
5.10.8 Cautions ... 77
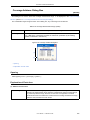
5.11 Coverage Measurement Function [IECUBE] ... 78
5.11.1 Coverage mesurement result display ... 79
5.11.2 Coverage measurement range ... 79
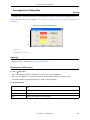
5.11.3 Display of locations for which coverage measurement is executed ... 80
5.11.4 RRM function, trace function, and coverage function used on a mutually exclusive basis ... 81
5.12 Event Function ... 82
5.12.1 Using event function ... 82
5.12.2 Creating events ... 83
5.12.3 Setting event conditions ... 83
5.12.4 Number of enabled events for each event condition ... 85
5.12.5 Managing events ... 86
5.12.6 Cautions [MINICUBE] [MINICUBE2] ... 87
5.13 RRM Function ... 89
5.13.1 Real-time monitor function [IECUBE] ... 89
5.13.2 Pseudo real-time monitor function (Break When Readout) ... 90
5.14 DMM Function ... 91
5.15 Load/Save Function ... 92
5.15.1 Debugging environment (project file) ... 92
5.15.2 Window display information (view file) ... 93
5.15.3 Window setting information (setting file) ... 94
5.16 Functions Common to Each Window ... 95
10
User’s Manual
U18604EJ1V0UM
5.16.1 Active status and static status ... 95
5.16.2 Jump function ... 96
5.16.3 Trace result with linking window [IECUBE] ... 98
5.16.4 Drag & drop function ... 98
5.16.5 Cautions ... 101
CHAPTER 6 WINDOW REFERENCE ... 102
6.1 Window List ... 102
6.2 Explanation of Windows ... 105
Main Window ... 106
Configuration Dialog Box ... 118
Extended Option Dialog Box ... 127
Fail-safe Break Dialog Box ... 133
RRM Setting Dialog Box ... 135
Flash Option Dialog Box ... 137
Data Flash Option Dialog Box ... 147
Debugger Option Dialog Box ... 150
Project File Save Dialog Box ... 156
Project File Load Dialog Box ... 157
Download Dialog Box ... 158
Upload Dialog Box ... 161
Load Module List Dialog Box ... 163
Source Window ... 165
Source Search Dialog Box ... 170
Source Text Move Dialog Box ... 172
Assemble Window ... 174
Assemble Search Dialog Box ... 178
Address Move Dialog Box ... 180
Symbol To Address Dialog Box ... 181
List Window ... 183
Watch Window ... 186
Quick Watch Dialog Box ... 191
Add Watch Dialog Box ... 193
Change Watch Dialog Box ... 196
Local Variable Window ... 198
Stack Window ... 200
Memory Window ... 203
Memory Search Dialog Box ... 208
Memory Fill Dialog Box ... 210
Memory Copy Dialog Box ... 211
Memory Compare Dialog Box ... 212
Memory Compare Result Dialog Box ... 213
DMM Dialog Box ... 214
Register Window ... 216
Register Select Dialog Box ... 219
IOR Window ... 221
IOR Select Dialog Box ... 225
Add I/O Port Dialog Box ... 227
Timer Dialog Box ... 229
Timer Result Dialog Box ... 232
Trace View Window ... 234
Trace Search Dialog Box ... 239
Trace Data Select Dialog Box ... 243
Trace Move Dialog Box ... 245
Trace Dialog Box ... 247
Delay Count Dialog Box ... 250
Code Coverage Window ... 252
Coverage-Address Dialog Box ... 255
Coverage-Color Dialog Box ... 257
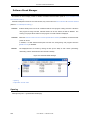
Software Break Manager ... 258
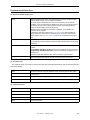
Event Manager ... 260
Event Dialog Box ... 264
Event Link Dialog Box ... 269
User’s Manual
U18604EJ1V0UM
11
Break Dialog Box ... 272
View File Save Dialog Box ... 276
View File Load Dialog Box ... 278
Environment Setting File Save Dialog Box ... 280
Environment Setting File Load Dialog Box ... 281
Reset Debugger Dialog Box ... 282
Exit Debugger Dialog Box ... 283
About Dialog Box ... 284
Console Window ... 285
Browse Dialog Box ... 286
CHAPTER 7 COMMAND REFERENCE ... 288
7.1 Command Line Rules ... 288
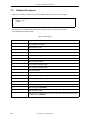
7.2 Command List ... 289
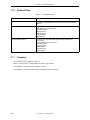
7.3 List of Aliases ... 291
7.4 List of Variables ... 291
7.5 List of Packages ... 292
7.6 Key Bind ... 292
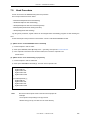
7.7 Expansion Window ... 292
7.7.1 Samples (calculator script) ... 293
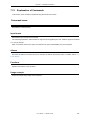
7.8 Callback Procedure ... 294
7.9 Hook Procedure ... 295
7.10 Related Files ... 296
7.11 Cautions ... 296
7.12 Explanation of Commands ... 297
address ... 298
assemble ... 299
batch ... 300
breakpoint ... 301
cache ... 303
dbgexit ... 304
dbgopt ... 305
download ... 306
efconfig ... 307
erase ... 309
extwin ... 310
finish ... 311
flop ... 312
go ... 313
help ... 314
hook ... 315
ie ... 316
inspect ... 317
jump ... 318
map ... 319
mdi ... 321
memory ... 322
module ... 323
next ... 324
refresh ... 325
register ... 326
reset ... 327
run ... 328
step ... 329
stop ... 330
tkcon ... 331
upload ... 332
version ... 333
watch ... 334
where ... 335
wish ... 336
xcoverage ... 337
xtime ... 338
12
User’s Manual
U18604EJ1V0UM
xtrace ... 339
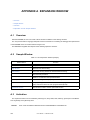
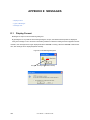
APPENDIX A EXPANSION WINDOW ... 340
A.1 Overview ... 340
A.2 Sample Window ... 340
A.3 Activation ... 340
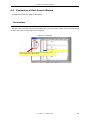
A.4 Explanation of Each Sample Window ... 341
List window ... 341
Grep window ... 342
RRM window ... 343
Hook window ... 344
Memory Mapped I/O window ... 346
Memory Mapped I/O dialog box ... 348
Sym Inspect window ... 349
Run Break Time window ... 350
OpenBreak window ... 351
APPENDIX B ADDITIONAL CAUTIONS ... 352
B.1 Cautions on using On-Chip Debug Emulator [MINICUBE] [MINICUBE2] ... 352
B.1.1 When MINICUBE or N-Wire CARD Is Connected [MINICUBE] ... 352
B.1.2 When MINICUBE2 Is Connected [MINICUBE2] ... 353
B.2 Cautions on using Midas Lab emulator RTE-2000H-TP ... 354
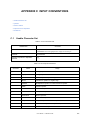
APPENDIX C INPUT CONVENTIONS ... 357
C.1 Usable Character Set ... 357
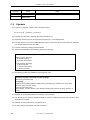
C.2 Symbols ... 358
C.3 Numeric Values ... 359
C.4 Expressions and Operators ... 360
C.5 File Names ... 362
APPENDIX D KEY FUNCTION LIST ... 363
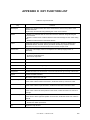
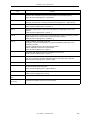
APPENDIX E MESSAGES ... 366
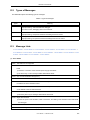
E.1 Display Format ... 366
E.2 Types of Messages ... 367
E.3 Message Lists ... 367
APPENDIX F INDEX ... 391
User’s Manual
U18604EJ1V0UM
13
LIST OF FIGURES
Figure No.
1-1
1-2
1-3
1-4
3-1
3-2
3-3
3-4
4-1
5-1
5-2
5-3
5-4
5-5
5-6
5-7
5-8
5-9
5-10
5-11
5-12
5-13
5-14
5-15
5-16
5-17
5-18
5-19
5-20
5-21
5-22
5-23
5-24
5-25
5-26
5-27
5-28
6-1
6-2
6-3
6-4
6-5
6-6
6-7
6-8
6-9
6-10
6-11
6-12
6-13
6-14
6-15
6-16
6-17
6-18
14
Title, Page
ID850QB ... 18
Example of ID850QB System Configuration (IECUBE) ... 21
Example of ID850QB System Configuration (N-Wire CARD, MINICUBE) ... 22
Example of ID850QB System Configuration [MINICUBE2] ... 22
Check RTE2 ... 28
Startup Option (Example) ... 29
Configuration Dialog Box ... 31
Exit Debugger Dialog Box ... 32
Downloading Multiple Files ... 37
Breakpoint Setting ... 51
Setting Break to Variable ... 52
Management of Software Breaks ... 53
Fail-safe Break Setting ... 54
Execution Button ... 56
[Run] Menu ... 56
Watch Window ... 60
Specification of the Display Format (Debugger Option Dialog Box) ... 60
Local Variable Window ... 61
Change Watch Dialog Box ... 62
Quick Watch Dialog Box ... 62
Callout Watch Function ... 62
Stack Window ... 63
Access Monitor Function (Memory Window) ... 65
Absolute Name/Function Name Switching ... 67
Display IOR contents ... 68
Register I/O Port ... 68
Sets and Displays Timer Event (Timer Dialog Box) ... 70
Setting Trace Data ... 73
Checking Trace Data ... 73
Coverage Mesurement Result Display ... 79
View of Locations for which Coverage Measurement is Executed ... 80
Setting of Various Event Conditions ... 83
Managing Events (the Event Manager) ... 86
RRM Setting Dialog Box ... 89
Specification of Interval for Sampling with Real-Time Monitor Function ... 89
Specification of Pseudo Real-Time Monitor Function ... 90
Modifying Memory Contents (DMM Dialog Box) ... 91
Main Window ... 106
Tool Bar (Picture Only) ... 115
Tool Bar (Picture and Text) ... 115
Status Bar ... 116
Configuration Dialog Box ... 118
Extended Option Dialog Box Extended Option Dialog Box ... 127
Fail-safe Break Dialog Box ... 133
RRM Setting Dialog Box ... 135
Flash Option Dialog Box ... 137
Data Flash Option Dialog Box ... 147
Debugger Option Dialog Box ... 150
[Add Source path] Dialog Box ... 151
[Font] Dialog Box ... 152
Project File Save Dialog Box ... 156
Project File Load Dialog Box ... 157
Download Dialog Box ... 158
Upload Dialog Box ... 161
Load Module List Dialog Box ... 163
User’s Manual
U18604EJ1V0UM
6-19
6-20
6-21
6-22
6-23
6-24
6-25
6-26
6-27
6-28
6-29
6-30
6-31
6-32
6-33
6-34
6-35
6-36
6-37
6-38
6-39
6-40
6-41
6-42
6-43
6-44
6-45
6-46
6-47
6-48
6-49
6-50
6-51
6-52
6-53
6-54
6-55
6-56
6-57
6-58
6-59
6-60
6-61
6-62
6-63
6-64
6-65
6-66
6-67
6-68
6-69
6-70
7-1
A-1
A-2
A-3
A-4
A-5
A-6
A-7
A-8
A-9
E-1
Source Window ... 165
Source Search Dialog Box ... 170
Source Text Move Dialog Box ... 172
Assemble Window ... 174
Assemble Search Dialog Box ... 178
Address Move Dialog Box (Example: When Memory Window Is Open) ... 180
Symbol To Address Dialog Box ... 181
List Window ... 183
Watch Window ... 186
Quick Watch Dialog Box ... 191
Add Watch Dialog Box ... 193
Change Watch Dialog Box ... 196
Local Variable Window ... 198
Stack Window ... 200
Memory Window ... 203
Memory Window (When RRM Function Is Selected) ... 204
Memory Search Dialog Box ... 208
Memory Fill Dialog Box ... 210
Memory Copy Dialog Box ... 211
Memory Compare Dialog Box ... 212
Memory Compare Result Dialog Box ... 213
DMM Dialog Box(Ex: When "Memory" is selected) ... 214
Register Window ... 216
Register Select Dialog Box ... 219
IOR Window ... 221
IOR Select Dialog Box ... 225
Add I/O Port Dialog Box ... 227
Timer Dialog Box ... 229
Timer Result Dialog Box ... 232
Trace View Window ... 234
Trace Search Dialog Box ... 239
Trace Data Select Dialog Box ... 243
Trace Move Dialog Box ... 245
Trace Dialog Box ... 247
Delay Count Dialog Box ... 250
Code Coverage Window ... 252
Coverage-Address Dialog Box ... 255
Coverage-Color Dialog Box ... 257
Software Break Manager ... 258
Event Manager (In Detailed Display Mode) ... 260
Event Dialog Box ... 264
Event Link Dialog Box ... 269
Break Dialog Box ... 272
View File Save Dialog Box ... 276
View File Load Dialog Box ... 278
Environment Setting File Save Dialog Box ... 280
Environment Setting File Load Dialog Box ... 281
Reset Debugger Dialog Box ... 282
Exit Debugger Dialog Box ... 283
About Dialog Box ... 284
Console Window ... 285
Browse Dialog Box ... 286
Execution Screen ... 293
List Window ... 341
Grep Window ... 342
RRM Window ... 343
Hook Window ... 344
Memory Mapped I/O Window ... 346
Memory Mapped I/O Dialog Box ... 348
Sym Inspect Window ... 349
RunBreakTime Window ... 350
OpenBreak Window ... 351
Error/Warning Dialog Box ... 366
User’s Manual
U18604EJ1V0UM
15
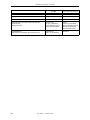
LIST OF TABLES
Table No.
2-1
3-1
3-2
5-1
5-2
5-3
5-4
5-5
5-6
5-7
5-8
5-9
5-10
5-11
5-12
5-13
5-14
5-15
5-16
5-17
5-18
5-19
5-20
5-21
5-22
5-23
5-24
5-25
6-1
6-2
6-3
6-4
6-5
6-6
6-7
6-8
6-9
6-10
6-11
6-12
6-13
6-14
6-15
6-16
6-17
6-18
6-19
6-20
6-21
6-22
6-23
6-24
7-1
16
Title, Page
Install... 26
Startup Options... 30
Error Message Output Pattern [IECUBE]... 33
Debug Function List (Flow of Debugging Operations)... 41
Mapping Attribute... 43
Type of File That Can Be Downloaded... 44
Type of File That Can Be Uploaded... 46
File Type Can Be Displayed... 47
Specifying Symbols... 49
Break Types... 50
The Number of Valid Software Break... 53
Type of Execution... 57
Trace Memory Size... 72
Type of Trace Modes... 74
Types of Tracer Control Mode... 75
Types of Conditional Trace... 76
Code Coverage Measurement Range... 79
Format of View of Locations for which Coverage Measurement is Executed... 80
Various Event Conditions... 82
Number of Enabled Events for Each Event Condition... 85
Event Icon... 86
Areas for Which Sampling Can Be Performed with Real-Time Monitor Function... 89
Contents Saved to Project File... 92
Type of View Files... 93
Type of Setting Files... 94
Details of Jump Source Address... 96
Details of Drag & Drop Function (Line/Address)... 99
Details of Drag & Drop Function (Character String)... 99
Window List... 102
CPU Status... 116
IE Status... 117
Break Cause... 117
Relationship Between Time Tag Counter Division Ratio and Maximum Measurement Time
(Time tag counter (Trace))... 128
Relationship Between Meaning of Trace Data to Be Collected and Trace Collection Mode... 129
Relationship Between Timer Count Division Ratio and Maximum Measurement Time
(Timer counter (Timer))... 130
Relationship Between Boot Swap Cluster Set Value and Target Range Set Value... 140
Flash Self Programming Emulation Supported Device... 141
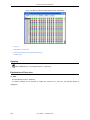
List of Availability of Emulation for Flash Function (Type1)... 141
List of Availability of Emulation for Flash Function (Type3)... 143
List of Availability of Emulation for Flash Function (Type4)... 144
Event Setting Status (Event Mark)... 166
Watch Window Input Format... 194
How Variable Is Handled When Scope Is Specified... 194
Measurable Values... 231
Settable Range of Address Condition (Trace)... 241
Frame Number Specification Format... 246
Number of Events Settable... 248
Coverage Measurement Range (Detail)... 255
Separator for Displaying Event Details... 261
Settable Range of Address Condition (Event)... 266
Number of Event Conditions in Event Link Dialog Box... 270
Number of Events Settable in Condition Setting Area... 273
Debugger Control Command List... 289
User’s Manual
U18604EJ1V0UM
7-2
7-3
7-4
7-5
7-6
7-7
7-8
A-1
B-1
C-1
C-2
C-3
C-4
C-5
C-6
D-1
E-1
List of Console/Tcl Commands... 290
Contents of File aliases.tcl... 291
List of Variables... 291
List of Packages... 292
Message ID... 294
List of Related Files... 296
Parameter Set Values (example)... 308
List of Expansion Window (Sample)... 340
Functional Differences Between V850-IECUBE and RTE-2000H-TP + PG2-IE... 354
List of Character Set... 357
List of Special Characters... 357
Input Format of Numeric Values... 359
List of Operators... 360
Operator Priority... 361
Range of Radixes... 362
Key Function List... 363
Types of Messages... 367
User’s Manual
U18604EJ1V0UM
17
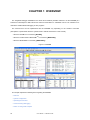
CHAPTER 1 OVERVIEW
CHAPTER 1 OVERVIEW
The Integrated Debugger ID850QB for the V850 microcontrollers (hereafter referred to as the ID850QB) is a
software tool developed for NEC Electronics V850 microcontrollers for embedded control. This software tool is
intended to enable efficient debugging of user programs.
The functions that can be implemented with the ID850QB vary depending on the emulator connected.
(descriptions in parentheses show the symbols used to indicate each device in this manual).
- When the IECUBETM is connected ( [IECUBE])
- When the N-Wire CARD or MINICUBETM is connected ( [MINICUBE])
- When the MINICUBE2 is connected ( [MINICUBE2])
Figure 1-1 ID850QB
This chapter explains the following items regarding the ID850QB.
- Features
- System Configuration
- Operating Environment
- Cautions During Debugging
- Notes on Using GHS Compiler
18
User’s Manual
U18604EJ1V0UM
CHAPTER 1 OVERVIEW
1.1
Features
The ID850QB has the following features:
- New functions, enhanced functions
- Other functions
1.1.1
New functions, enhanced functions
(1) Support of Midas Lab emulator
Midas Lab emulator RTE-2000H-TP is now supported (refer to "3.2 Cautions on connecting Midas Lab
emulator").
(2) Support of flash self programming for MF2 devices [IECUBE]
Flash self programming for MF2 devices is now supported (refer to " Flash Option Dialog Box").
(3) Support of VSB ROM and VSB RAM of V850/Dx3 [IECUBE] [MINICUBE]
VSB ROM and VSB RAM of the V850/Dx3 are now supported (refer to " Configuration Dialog Box" and "
Download Dialog Box").
(4) Support of high-speed download [IECUBE]
High-speed downloading is now supported. The target areas are internal ROM and internal RAM (including VSB
ROM and VSB RAM) (refer to " Download Dialog Box").
(5) Support of E2 core devices
E2 core devices are now supported (refer to " Download Dialog Box").
(6) Support of Motorola S type 16-bit record
Motorola Hex format S type 16-bit record files (S1 and S9) can now be downloaded.
(7) Downloading to external flash memory
Load module files and Hex format files can now be downloaded to a flash memory connected to an external bus
(refer to "5.2.2 Downloading to External Flash Memory").
(8) Selection of coverage colors
Colors used to distinguish the coverage of a user program code can now be selected (refer to " Coverage-Color
Dialog Box").
(9) Automatic source path setting
Source files stored in the folder where they were placed during building are automatically displayed (refer to "
Source Text Move Dialog Box").
User’s Manual
U18604EJ1V0UM
19
CHAPTER 1 OVERVIEW
1.1.2
Other functions
(1) Using function of in-circuit emulator
By using the event setting function of an in-circuit emulator, break events can be set, the user program can be
traced, and time can be measured, and so on. (Refer to "5.12 Event Function".)
(2) Support of on-chip debugging [MINICUBE]
A debugging function implemented by the on-chip debug unit of the Nx85ET (RCU0+TEU+TRCU) ,
Nx85E901 (RCU0), RCU1 is provided.
(3) Flash memory writing function [MINICUBE] [MINICUBE2]
The internal flash memory can be written and the load module can be downloaded by the same access
method as an ordinary memory operation. (Refer to "5.7.4 Flash memory writing function [MINICUBE]
[MINICUBE2]".)
(4) Security function [MINICUBE] [MINICUBE2]
The ID code stored in the internal ROM or internal flash memory of a product with a security unit can be
authenticated. (Refer to "(5) ID Code [MINICUBE] [MINICUBE2]" in the " Configuration Dialog Box".)
(5) Function expansion through Tcl
The batch processing and hook processing, and the creation of original user custom windows are possible
using the command line with Tcl/Tk (Tool Command Language). (Refer to "CHAPTER 7 COMMAND
REFERENCE", "APPENDIX A EXPANSION WINDOW".)
The latest Tcl/Tk core 8.4.12 and new console are supported.
(6) Function expansion through TIP or ToolLink
By associating with a task debugger (RD) and system performance analyzer (AZ) supporting TIP (Tool
Interface Protocol) or ToolLink, the debugging efficiency of the user program using a real-time OS (RX) can be
dramatically improved.
20
User’s Manual
U18604EJ1V0UM
CHAPTER 1 OVERVIEW
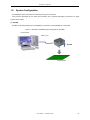
1.2
System Configuration
The ID850QB can be connected to the following three types of emulators.
User programs developed for the V850 microcontrollers and a pleasant debugging environment for target
systems are provided.
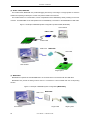
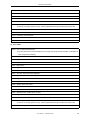
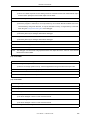
(1) IECUBE
IECUBE can be manipulated from the ID850QB by connected it to the ID850QB via a USB cable.
Figure 1-2 Example of ID850QB System Configuration (IECUBE)
Host machine
USB 1.1/2.0
IECUBE
Target system
User’s Manual
U18604EJ1V0UM
21
CHAPTER 1 OVERVIEW
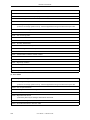
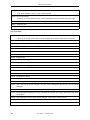
(2) N-Wire CARD, MINICUBE
The N-Wire CARD, MINICUBE can provide debugging functions by connecting it to a target system on which the
V850ES incorporating an RCU (Run Control Unit) and the V850E1 are mounted.
The N-Wire CARD a PC card emulator, can be manipulated from the ID850QB by directly inserting it to the host
machine. The MINICUBE can be manipulated from the ID850QB by connected it to the ID850QB via a USB cable.
Figure 1-3 Example of ID850QB System Configuration (N-Wire CARD, MINICUBE)
Host machine
N-Wire CARD
N-Wire cable
Target system
USB1.1/2.0
MINICUBE
OCD cable
Host machine
Target system
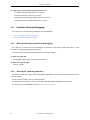
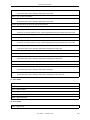
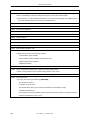
(3) MINICUBE2
MINICUBE2 is operated via the ID850QB when it is connected to the host machine with the USB cable.
MINICUBE2 can provide the debug function when it is connected to a microcontroller with the on-chip debug
function.
Figure 1-4 Example of ID850QB System Configuration [MINICUBE2]
USB1.1/2.0
Target cable
Host machine
22
MINICUBE2
User’s Manual
U18604EJ1V0UM
Target system
CHAPTER 1 OVERVIEW
1.3
Operating Environment
This section explains the following items regarding the operating environment.
- Hardware environment
- Software environment
1.3.1
Hardware environment
(1) Host machine (The machine by which the target OS operates)
CPU
Pentium® II 400 MHz or above
Main memory
256 MB or above
Caution:
When N-Wire CARD is connected, because it is assumed that the IECUBE is used with a notebook
PC, the host machine must have a PC card slot (TYPEII).
(2) In-circuit emulator
- IECUBE (QB-V850Exxxx)
- N-Wire CARD (IE-V850E1-CD-NW)
- MINICUBE (QB-V850MINI)
- MINICUBE2 (QB-MINI2)
- RTE-2000H-TP(PG2-IE)
1.3.2
Software environment
(1) OS (any of the following)
Windows® 2000, Windows XP(Home Edition, Professional)
Caution:
Regardless of which of the OS above is used, we recommend that the latest Service Pack is
installed.
(2) Device file (Individual acquisition)
- The device file of the target device to be used.
Remark:
This file is available from the following Web site of NEC Electronics (Version-up Service).
http://www.necel.com/micro/ods/eng/
User’s Manual
U18604EJ1V0UM
23
CHAPTER 1 OVERVIEW
(3) Supported tools (manufactured by NEC Electronics)
- C compiler package CA850 (Version 3.10 or later)
- Project manager PM+ (Version 6.10 or later)
- System performance analyzer AZ850 (Version 3.30 or later)
- Performance tuning tool TW850 (Version 2.10 or later)
1.4
Cautions During Debugging
The cautions to be observed during debugging are described below.
- When performing source level debugging
- Security ID [MINICUBE] [MINICUBE2]
1.4.1
When performing source level debugging
The object file for which source level debugging is performed must include symbol information or other
information for debugging (debugging information).
Therefore, perform the following processing during source file compiling.
(1) When using the PM+
Specify [Debug Build] when the Build mode is selected.
(2) When not using the PM+
Add the -g option.
1.4.2
Security ID
[MINICUBE] [MINICUBE2]
The object file used when N-Wire CARD, MINICUBE, MINICUBE2 is connected must include the security ID (ID
code) information.
For the security ID settings, refer to "CA850 Operation".
For details about the security ID, refer to the N-Wire CARD, MINICUBE, MINICUBE2 user's manual.
The security ID from the ID850QB is set in the Configuration Dialog Box.
24
User’s Manual
U18604EJ1V0UM
CHAPTER 1 OVERVIEW
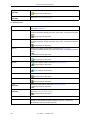
1.5
Notes on Using GHS Compiler
ID850QB V3.20 and later support Green Hills Software compiler that is compatible with the GHS Extended
DWARF2 format.
1.5.1
Supported version
The following versions of the GHS compiler are supported.
- Integrated development environment MULTI TM(V3.5.1, V4.0.5) (DWARF2 format)
Caution:
1.5.2
C++ is not supported. In addition, the V850E2R cores are not supported.
Option added for debugging (debug option)
The following option (debug option) should be added for debugging with the GHS compiler.
- -G -dual_debug
1.5.3
Cautions on Using DWARF2 Load Module
Note the following points when using a DWARF2-format load module file.
(1) GNU C expanded specifications are not yet supported.
(2) The profiling function is not yet supported.
(3) PM+ and TW850 cannot be used by linking to each other.
(4) The Stack Window is not yet supported.
(5) Execution cannot be stepped into functions defined in an include file.
(6) No breakpoints can be set to functions defined in an include file.
(7) In the function name list, the names of functions defined in an include file are displayed with the name used
by the side that references the include file.
(8) The FPU (floating-point operation unit) is not yet supported.
(9)
In the variable name list, global variable names are displayed at the defined locations and referencing
locations (extern locations). (This item depends on the GHS compiler specifications.)
(10) The watched variable value may be displayed incorrectly or the value may not be changed, because debug
information does not include valid period information of variables. (This item applies to cases where a
variable is optimized and deleted, or a value is temporarily assigned to a register).
(11) Floating point rounding accuracy differs between the compiler and debugger.
(12) Debugging of assembler sources is not possible.
(13) Step execution of include statement is not possible.
(14) Step execution of setjmp() and longjmp() is not possible.
User’s Manual
U18604EJ1V0UM
25
CHAPTER 2 INSTALLATION
CHAPTER 2 INSTALLATION
This chapter explains the following items about installation of ID850QB:
- Installing
- Uninstalling
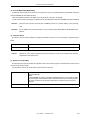
2.1
Installing
The following items must be installed, when the ID850QB is used.
Table 2-1 Install
Item
Procedure
ID850QB
When using the installer on the ID850QB Disk:
Install the contents of this disk according to the automatically executed
installer.
When using the installer downloaded from Version-up Service
webpage:
Run the downloaded executable file following the guidance of installer.
Device file
Install this file according to the DFINST.exe dedicated startup installer by
selecting [start] menu -> [All Programs] -> [NEC Electronics Tools] ->
[DeviceFile Installer].
2.2
Uninstalling
Perform uninstallation using [Add/Remove Programs] on the Control Panel.
26
User’s Manual
U18604EJ1V0UM
CHAPTER 3 STARTING AND TERMINATING
CHAPTER 3 STARTING AND TERMINATING
This chapter explains the following items related to the starting and terminating the ID850QB:
- Cautions Before Starting [MINICUBE] [MINICUBE2]
- Cautions on connecting Midas Lab emulator
- Startup Option and Argument Specification
- Starting
- Terminating
- Error Messages at Start Up
3.1
Cautions Before Starting [MINICUBE] [MINICUBE2]
When the N-Wire CARD, MINICUBE or MINICUBE2 is connected, start the following check tools before the
starting the ID850QB to check that the emulator and the target system can be normally debugged.
- N-Wire Checker [MINICUBE]
- OCD Checker [MINICUBE2]
Caution:
For the connection between the emulator and the target system and the power application
sequence, refer to the N-Wire CARD, MINICUBE or MINICUBE2 User's Manual.
Incorrect connection may damage the emulator and the target system.
User’s Manual
U18604EJ1V0UM
27
CHAPTER 3 STARTING AND TERMINATING
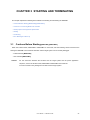
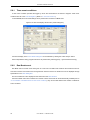
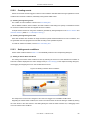
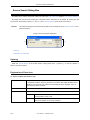
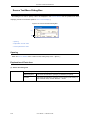
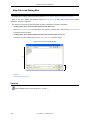
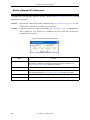
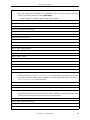
3.2
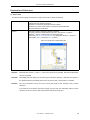
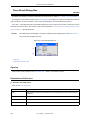
Cautions on connecting Midas Lab emulator
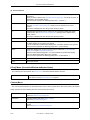
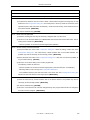
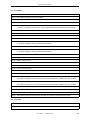
When Midas Lab emulator RTE-2000H-TP is connected, be sure to perform the following settings before starting
the ID850QB.
Set the type of the CPU that is controlled by Midas Lab rte4win32, using "Check RTE2".
For details, refer to documents related to rte4win32 and KIT.
Remark:
URL of Midas Lab Inc. download site
http://www.midas.co.jp/download/english/program.htm
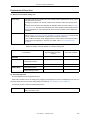
1) Select an in-circuit emulator such as PG2-IE in the "Products List" field (select the CPU name in the case of
OCD).
2) Select a USB port or LAN from "I/F-1:" in the "Setup RTE" field.
3) Click the <License> button to input the license code. In the case of OCD, also click the <Option> button to
input the ID code.
Figure 3-1 Check RTE2
Remark:
When using a Midas Lab emulator, the dedicated startup option must be specified (refer to "3.3.2
Specification format and options").
28
User’s Manual
U18604EJ1V0UM
CHAPTER 3 STARTING AND TERMINATING
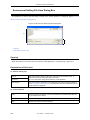
3.3
Startup Option and Argument Specification
The procedure for specifying the startup options and arguments for the ID850QB is described below.
By specifying the startup options and arguments, it is possible to specify the script file at startup and the project
file.
Remark:
When starting up the ID850QB from PM+, the startup option and argument settings are performed
in [Debugger Settings...] in the [Tool] menu of PM+. (Refer to "CHAPTER 4 ASSOCIATION WITH
PM+".) The debugger startup option can be set to the option column.
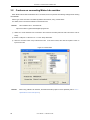
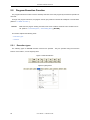
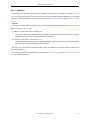
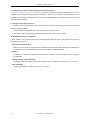
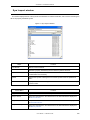
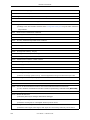
3.3.1
Specification method
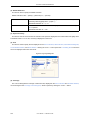
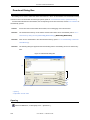
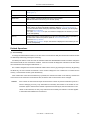
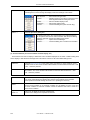
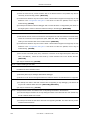
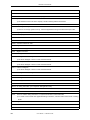
1) Create the ID850QB shortcut on the desktop.
The ID850QB execution file is located in the bin folder in the folder to which the installation was performed.
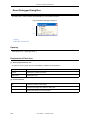
2) Open the properties of the created shortcut and after the execution file name displayed in [Target:], specify
the option and argument. (Refer to "3.3.2 Specification format and options".)
Figure 3-2 Startup Option (Example)
User’s Manual
U18604EJ1V0UM
29
CHAPTER 3 STARTING AND TERMINATING
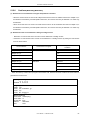
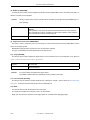
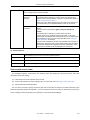
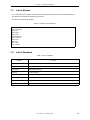
3.3.2
Specification format and options
(1) Specification format
xxxxx.exe ?options?
xxxxx.exe ?options? project
Each option and argument is separated by a space. The case is distinguished in the character string.
Arguments enclosed between '?' can be omitted.
When a project file is specified, that project file is read at startup.
However, during PM+ startup, the project file specification is ignored.
When there are spaces in the file names and paths, specify the project file names and script file names enclosed
in double quotation marks (" "). (Refer to " Example3) Specification when there are spaces in the path".)
Remark:
The emulator currently being connected is automatically detected by the automatic emulator detect
function when a debugger execution program is started. The user therefore does not need to
select the debugger execution program according to the emulator to be connected. (When using a
Midas Lab emulator, specify it using the startup option ("Table 3-1 Startup Options".)
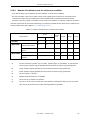
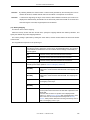
(2) Specification options
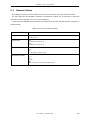
The following options can be specified.
Table 3-1 Startup Options
Options
Meaning
/sc
Change background color of window to system color.
/script:script file name
Specify the script file to be executed at startup.
/ICE:RTE /EXEC:EX850G32RTE
Specify N-EXEC for Midas Lab.
(3) Specification example
Example1) Specification of script file only
xxxxx.exe /script:c:\work\script.tcl
Example2) Specification of script file and project file
xxxxx.exe /script:c:\work\script.tcl c:\work\project.prj
Example3) Specification when there are spaces in the path
xxxxx.exe /script:"c:\work folder\script.tcl" "c:\work folder\project.prj"
30
User’s Manual
U18604EJ1V0UM
CHAPTER 3 STARTING AND TERMINATING
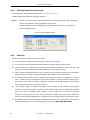
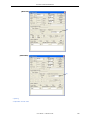
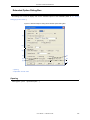
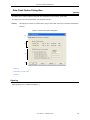
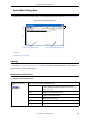
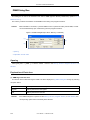
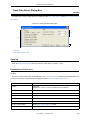
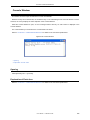
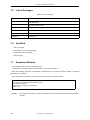
3.4
Starting
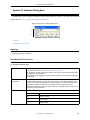
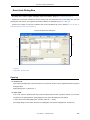
1) Start ID850QB from the [Start] menu of PM+ or by clicking the shortcut created on the desktop.
Refer to "4.3 To Start ID850QB from PM+" when starting from PM+.
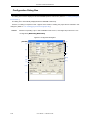
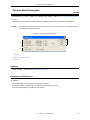
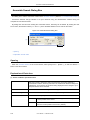
Start the ID850QB, the Configuration Dialog Box will be opened.
Caution:
In this case, the Configuration Dialog Box should not be displayed, but an error message should be
displayed, please cope with it with reference to "3.6 Error Messages at Start Up".
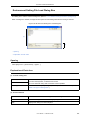
Figure 3-3 Configuration Dialog Box
2)
Set the items related to the operating environment of the ID850QB in the Configuration Dialog Box. After
setting each item, click the <OK> button in the dialog box.
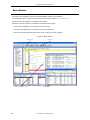
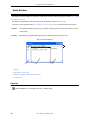
3) The Main Window will be opened and the ID850QB can be operated. Mainly use this window for debugging.
User’s Manual
U18604EJ1V0UM
31
CHAPTER 3 STARTING AND TERMINATING
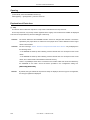
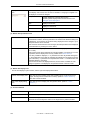
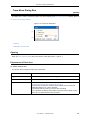
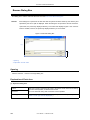
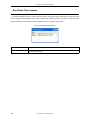
3.5
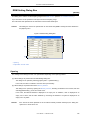
Terminating
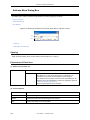
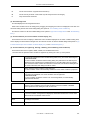
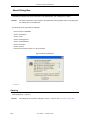
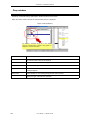
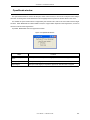
1) Select [File] menu -> [Exit] on the Main Window. The following the Exit Debugger Dialog Box will be opened:
(An execution stop confirmation message is displayed when stop operation is performed during program
execution.)
Figure 3-4 Exit Debugger Dialog Box
2)
To save the current debugging environment to a project file, click the <Yes> button. If the <No> button is
clicked, all the windows are closed the ID850QB terminated.
32
User’s Manual
U18604EJ1V0UM
CHAPTER 3 STARTING AND TERMINATING
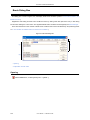
3.6
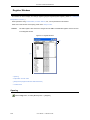
Error Messages at Start Up
Error messages that may be output when ID850QB starts up are listed below (by order of occurrence).
When these messages are output, refer to "APPENDIX E MESSAGES".
Caution:
When multiple emulators are connected, the emulator priority order is as follows.
IECUBE > MINICUBE > MINICUBE2 > N-Wire CARD
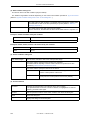
3.6.1
When the IECUBE is connected
The pattern of the output error message differs as follows depending on the connection status with the target and
the settings in the Configuration Dialog Box.
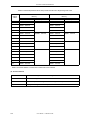
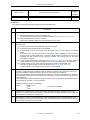
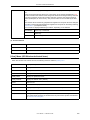
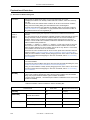
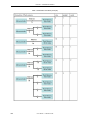
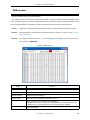
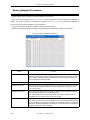
Table 3-2 Error Message Output Pattern [IECUBE]
Error
Message
[Target] Area in the
Configuration Dialog
Box
Connect
Ff606: Please
check
connection
with the target
board, and
power on it.
Not
Connect
Target
Connect
Not
Connect
Exchange Adapter
Used
Not
Used
Target Power Supply
ON
Selected
OFF
Selected
Wf607:
Please check
connection of
the exchange
adapter.
Selected
Ff608: Please
disconnect
the target
board.
Selected
Ff609: Please
power off the
target board,
and
disconnect it.
Selected
Selected
Selected
Selected
Selected
Selected
Selected
F0100: Can not communicate with ICE. Please confirm the installation of the device driver for the PC interface
board.
F0c43: Connection of emulator cannot be performed.
F0c70: DCU cannot be accessed.
F0c76: Initial state at the time of DCU access start is unusual.
User’s Manual
U18604EJ1V0UM
33
CHAPTER 3 STARTING AND TERMINATING
F0c77: DCU access is unusuall.
Ff606: Please check connection with the target board, and power on it.
Wf607: Please check connection of the exchange adapter.
Ff608: Please disconnect the target board.
A0105: Failed in reading device file (file name).
F0ca2: This device file does not include the on-chip debug information.
F0ca4: This device file does not include the IECUBE information.
F0c71: Reset cannot be performed.
F0c72: Monitor memory cannot be accessed.
F0c73: Monitor execution cannot be performed.
F0c74: CPU register cannot be accessed.
F0c23: Bus hold under continuation.
A0c01: During access of register, CPU did time out.
A0c02: During access of memory, CPU did time out.
F0c04: External flash memory database file was not found.
A01a0: No response from the evachip. Please confirm the signal of the CLOCK or RESET WAIT, HLDRQ and
so on. No response from the CPU. Please confirm the signal of the CLOCK or RESET WAIT, HLDRQ
and so on.
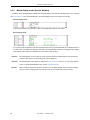
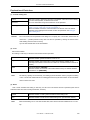
3.6.2
When the N-Wire CARD or MINICUBE is connected
F0100: Can not communicate with ICE. Please confirm the installation of the device driver for the PC interface
board.
F0c43: Connection of emulator cannot be performed.
F03a0: Target is not turned on.
F0c70: DCU cannot be accessed.
F0c76: Initial state at the time of DCU access start is unusual.
F0c77: DCU access is unusuall.
A0105: Failed in reading device file (file name).
F0ca2: This device file does not include the on-chip debug information.
F0ca3: Unsupported information is included in the on-chip debug information in the device file.
F0c24: It cannot shift to debug mode.
F0c72: Monitor memory cannot be accessed.
F0c73: Monitor execution cannot be performed.
F0c74: CPU register cannot be accessed.
F0c23: Bus hold under continuation.
A0c01: During access of register, CPU did time out.
34
User’s Manual
U18604EJ1V0UM
CHAPTER 3 STARTING AND TERMINATING
A0c02: During access of memory, CPU did time out.
F0c04: External flash memory database file was not found.
A01a0: No response from the evachip. Please confirm the signal of the CLOCK or RESET WAIT, HLDRQ and
so on. No response from the CPU. Please confirm the signal of the CLOCK or RESET WAIT, HLDRQ
and so on.
3.6.3
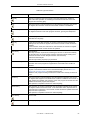
When the MINICUBE2 is connected
F0100: Can not communicate with ICE. Please confirm the installation of the device driver for the PC interface
board.
F0c43: Connection of emulator cannot be performed.
A01b2: The firmware of the emulator is old version. Please update it with utility to the latest firmware.
A0105: Failed in reading device file (file name).
F03a0: Target is not turned on.
F0ca2: This device file does not include the on-chip debug information.
F0ca3: Unsupported information is included in the on-chip debug information in the device file.
F0ca1: Monitor file not found.
F0c00: Monitor file read error.
F0c71: Reset cannot be performed.
F02a3: Reset under continuation.
F0c72: Monitor memory cannot be accessed.
F0c24: It cannot shift to debug mode.
F0c74: CPU register cannot be accessed.
F0c73: Monitor execution cannot be performed.
F0c33 : Disabling the on-chip debug function is prohibited.
F0c34 : Writing to the on-chip debug reserved area is prohibited.
A010a: Cannot run debugger and a utility at the same time.
A01a6: Executor is running.
User’s Manual
U18604EJ1V0UM
35
CHAPTER 4 ASSOCIATION WITH PM+
CHAPTER 4 ASSOCIATION WITH PM+
The ID850QB can automatically perform a series of operations in development processes, such as creating
source files -> compiling -> debugging -> correcting source files, in association with the PM+.
This chapter explains the following items related to association with the PM+.
For details of the PM+ functions, refer to the PM+ User's Manual.
- Setting Build Mode
- Registering Debugger to PM+ Project
- To Start ID850QB from PM+
- Auto Load
Caution:
If a load module file is created by using the Windows command prompt, the function to associate
the ID850QB with the PM+ cannot be used.
4.1
Setting Build Mode
To debug the load module file created by the PM+ on the ID850QB at the source level, build to output symbol
information for debugging must be performed to create a load module file. This setting can be performed by selecting [Debug Build] on the PM+.
4.2
Registering Debugger to PM+ Project
The debugger to be used or the load module files to be downloaded can be specified for each project in the
PM+.
4.2.1
Selecting debugger
The procedure for selecting the debugger is as follows:
The ID850QB is registered as the debugger of the active project. The ID850QB icon is displayed on the toolbar
of the PM+.
36
User’s Manual
U18604EJ1V0UM
CHAPTER 4 ASSOCIATION WITH PM+
(1) Creating a new workspace
1) Select [File] menu -> [New Workspace...] on the PM+.
-> This opens the dialog box to create a new workspace using the wizard format.
2) Creating the necessary settings for the workspace with the wizard, the [Select Debugger] dialog box will be
opened. Specify ID850QB in this dialog box.
For details of the setting, refer to the User's manual.
(2) Using an existing workspace
1) Select [Tool] menu -> [Debugger Settings...] on the PM+.
-> The [Debugger Settings] dialog box will be opened.
2) Specify ID850QB and click the <OK> button in this dialog box. For details of the setting, refer to the User's
manual.
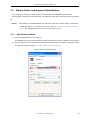
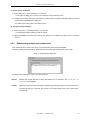
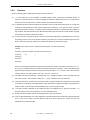
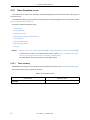
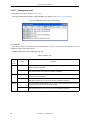
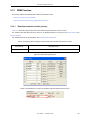
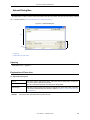
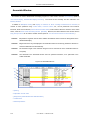
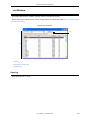
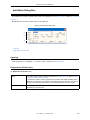
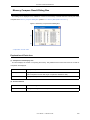
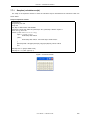
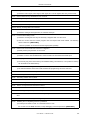
4.2.2
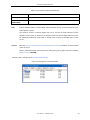
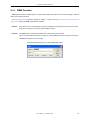
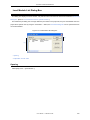
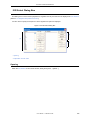
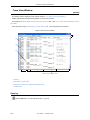
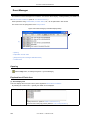
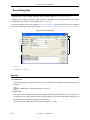
Downloading multiple load module files
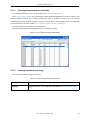
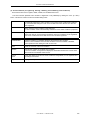
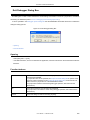
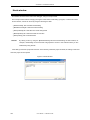
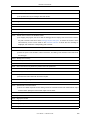
Load module files in the same project group can be downloaded when using the ID850QB.
Download multiple load module files by specifying items in the [Debugger Settings] dialog box of PM+.
Figure 4-1 Downloading Multiple Files
For details of the project group, refer to the "User's manual".
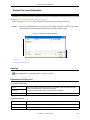
Remark:
Multiple load module files that are being downloaded can be selected in the Load Module List
Dialog Box of the ID850QB.
Caution:
If [Execute symbol reset after download] in the [Debugger Settings] dialog box of the product with a
internal flash memory is selected, the contents of the internal flash memory are erased before
downloading.
User’s Manual
U18604EJ1V0UM
37
CHAPTER 4 ASSOCIATION WITH PM+
4.3
To Start ID850QB from PM+
The ID850QB can be started from the PM+ as follows:
- Click the ID850QB starting button on the toolbar of the PM+.
- Select the [Build] menu -> [Debug] on the PM+.
- Select the [Build] menu -> [Build and Debug] on the PM+.
- Select the [Build] menu -> [Rebuild and Debug] on the PM+.
If the debugging environment of the ID850QB is saved to a project file currently being used by the PM+, it will be
started in the debugging environment saved in the project file.
If the debugging environment of the ID850QB is not saved to a project file being used by the PM+, the
Configuration Dialog Box is opened. At this time, the device type (chip name) cannot be changed.
Caution:
With PM+, if too many source files are registered in a project, the number of files may exceed the
upper limit of the source path length that can be registered to the ID850QB, the source files consequently may not be displayed automatically.
For details on the source path length, refer to "(1) Source Path" in the Debugger Option Dialog
Box.
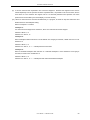
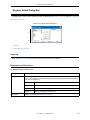
4.3.1
Restoring debugging environment
The previous debugging environment can be restored by the following procedure when the ID850QB is started
from the PM+:
1) Create a new workspace (project file: e.g., sample.prj) on the PM+Note.
2) Start the ID850QB from the PM+. Because a new project file is created, set items other than the device type
(chip name) in the Configuration Dialog Box in the same manner as when only the ID850QB is started.
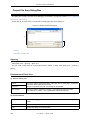
3) Download the load module file to be debugged with the Download Dialog Box of the ID850QB.
4) Debug the load module file on the ID850QB.
5) Click the <Yes> button on the Exit Debugger Dialog Box when the ID850QB is terminated.
-> The debugging environment will be saved to the project file (sample.prj) for the PM+ when the ID850QB
is terminated (the debug environment can also be saved to the sample.prj file by overwriting the project file
at times other than the completion of ID850QB debugging).
6) When the ID850QB is next started up after the sample.prj file is read by PM+, the debug environment at the
point when the project file was saved is automatically restored.
Note:
In the ID850QB and PM+, the environment information is saved to a project file and referenced.
The extension of the project file that can be used by the ID850QB and PM+ is "prj". For the information that is saved or restored by the project file, refer to the "User's manual" of each product.
38
User’s Manual
U18604EJ1V0UM
CHAPTER 4 ASSOCIATION WITH PM+
4.4
Auto Load
If a bug is found while the load module file is being debugged by the ID850QB, correct the source file using the
following procedure. Compiling and re-downloading the file can be automatically executed. (Refer to "4.4.1 Auto
load by correcting source code".)
The load module is downloaded again to the ID850QB by compiling and linking the file on the PM+ with the
activated ID850QB. (Refer to "4.4.2 Auto load by starting debugger".)
Caution:
This processing cannot be performed if it is selected that the standard editor (idea-L) is used with
the PM+.
4.4.1
Auto load by correcting source code
Correct the source file for auto load as follows:
1) Open the source file to be corrected in the Source Window. Select [File] menu -> [Open] and specify the file
to be corrected on the ID850QB (if the file is already open in the Source Window, that window is displayed
in the forefront).
-> The specified file will be opened in the Source Window.
2) Select [Edit] menu -> [Edit Source] on the ID850QB.
-> An editor will be opened and the specified source file will be read.
3) Correct the source file on the editor.
4) Terminate the editor.
Caution:
The CPU reset is not performed when the load module file is automatically downloaded. The debug
window that was opened when the editor was called, and each event setting will be restored. If the
previously used line or symbol has been deleted as a result of correcting the source file, the following happens:
- A variable that was displayed is dimmed.
- The event mark of an event condition is displayed in yellow.
- A software break point may be deleted.
5) Select [Build] menu -> [Build and Debug], or [Build] menu -> [Rebuild and Debug] on the PM+.
User’s Manual
U18604EJ1V0UM
39
CHAPTER 4 ASSOCIATION WITH PM+
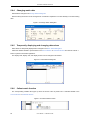
4.4.2
Auto load by starting debugger
If the following operation is performed on the PM+ with the ID850QB started, the load module will be
automatically downloaded to the ID850QB.
- Selecting the [Build] menu -> [Build and Debug] on the PM+.
- Selecting the [Build] menu -> [Rebuild and Debug] on the PM+.
Remark:
Specify whether to use a CPU reset after downloading from [Debugger Settings...] on the [Tool]
menu of PM+ (a CPU reset is performed by default).
40
User’s Manual
U18604EJ1V0UM
CHAPTER 5 DEBUG FUNCTION
CHAPTER 5 DEBUG FUNCTION
This chapter explains about debug function of ID850QB.
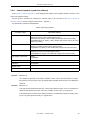
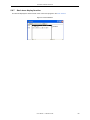
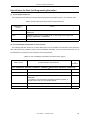
Table 5-1 Debug Function List (Flow of Debugging Operations)
Item
Refer To
To set the debugging environment
5.1 Setting Debugging Environment
To download the load module
5.2 Download Function, Upload Function
To display the source file and the disassemble result
5.3 Source Display, Disassemble Display Function
To set a break point
5.4 Break Function
To execute the user program
5.5 Program Execution Function
To check the variable value
5.6 Watch Function
To check and edit the memory contents
5.7 Memory Manipulation Function
To check and change the register variable
5.8 Register Manipulation Function
To check the execution time
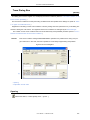
5.9 Timer Function [IECUBE]
To check the trace data
5.10 Trace Function [IECUBE]
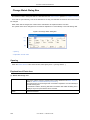
To check the code coverage measurement results
5.11 Coverage Measurement Function [IECUBE]
To manage the events
5.12 Event Function
RAM sampling
5.13 RRM Function
DMM function
5.14 DMM Function
To save the debug environment and window status
5.15 Load/Save Function
Jump function, linking window and cautions
5.16 Functions Common to Each Window
User’s Manual
U18604EJ1V0UM
41
CHAPTER 5 DEBUG FUNCTION
5.1
Setting Debugging Environment
This section explains the following items related to the setting debugging environment:
- Setting operating environment
- Setting option
- Setting mapping
- To change the value of a register required for access of an external memory
5.1.1
Setting operating environment
The in-circuit emulator operating environment settings are performed in the Configuration Dialog Box that is
automatically displayed when the ID850QB starts up.
If a project file already exists, the debugging environment can be restored by clicking the <Project...> button.
(Refer to "5.15.1 Debugging environment (project file)".)
5.1.2
Setting option
Perform setting related to the debugger or in-circuit emulator in the following setting dialog boxes.
- Configuration Dialog Box
- Extended Option Dialog Box
- Fail-safe Break Dialog Box
- RRM Setting Dialog Box
- Flash Option Dialog Box
- Data Flash Option Dialog Box
- Debugger Option Dialog Box
42
User’s Manual
U18604EJ1V0UM
CHAPTER 5 DEBUG FUNCTION
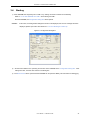
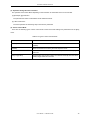
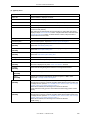
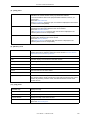
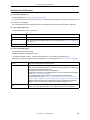
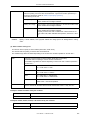
5.1.3
Setting mapping
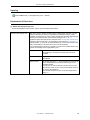
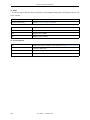
The mapping settings are performed in the Configuration Dialog Box.
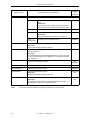
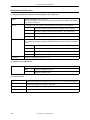
Table 5-2 Mapping Attribute
Attribute
Meaning
Emulation ROM [IECUBE]
(With memory board)
Emulation ROM
The memory area specified as the emulation ROM area is equivalent to the
memory area when the target device is connected to ROM.
The target device accesses the memory in the in-circuit emulator.
If the target device attempts writing to this memory area, a write protect
break occurs.
Emulation RAM [IECUBE]
(With memory board)
Emulation RAM
The memory area specified as the emulation RAM area is equivalent to the
memory area when the target device is connected to RAM.
The target device accesses the memory in the in-circuit emulator.
Target
User area mapping
The memory area specified for user area mapping becomes the area to
accesses the memory in the target system or memory incorporated in the
CPU.
Target ROM [IECUBE]
Target ROM
Areas specified as target ROM are subject to write protect for fail-safe
break. (Refer to " Fail-safe Break Dialog Box".)
I/O Protect
I/O protect area
An I/O Protect area can be set in the area specified for the "target".
The I/O protect area is displayed in the same manner as an area that is not
mapped (display symbol: ??), on the Memory Window. By mapping an area
with this attribute, data cannot be read or written from/to this area by the
Memory Window, on the area can therefore be protected from an illegal
access.To read or write the value of the area mapped with this attribute,
register the value in the IOR Window or Watch Window.
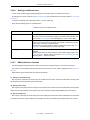
5.1.4
To change the value of a register required for access of an external
memory
When mapping has been performed for external memory, must change the values of the registers required for
accessing external memory prior to downloading, using the IOR Window or the hook procedure.
For how to change register values using the hook procedure, refer to "7.9 Hook Procedure".
For the registers to be changed, refer to the hardware manual of the CPU that is used.
User’s Manual
U18604EJ1V0UM
43
CHAPTER 5 DEBUG FUNCTION
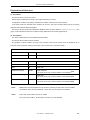
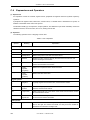
5.2
Download Function, Upload Function
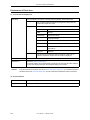
ID850QB allows downloading and uploading of object files in the formats listed in the following table: Table 5-3,
Table 5-4.
This section explains the following items:
- Download
- Downloading to External Flash Memory
- Upload
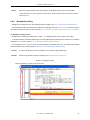
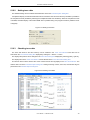
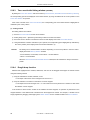
5.2.1
Download
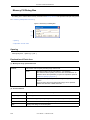
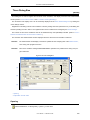
Object files are downloaded in the Download Dialog Box.
The corresponding source text file (Source Window) is displayed by downloading load module files with debug
information.
Remark:
Multiple load module files can be downloaded. Loaded files can be selected in the Load Module
List Dialog Box that is opened by selecting [File] menu -> [Load Module].
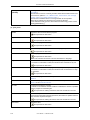
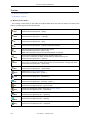
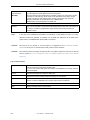
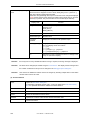
Format of file that can be downloaded is as follows:
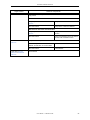
Table 5-3 Type of File That Can Be Downloaded
Format
Extension
Load module (ELF/CA850 (.out))
3rd Party Load module (ELF/GHS Extended DWARF2 (.out))Note1
Load Module (*.out)
Intel Hex format (Standard, extension, and extension linear)Note2
Hex Format (*.hex)
Motorola Hex format S type
(S0, S1, S2, S3, S5, S7, S8, S9 records)
Extended Tektronix Hex format
Hex format with ID tag for data flash
Hex Format with ID Tag (*.hex)
Binary data
Binary Data (*.bin)
Coverage result [IECUBE]
Coverage (*.cvb)
Note1:
Compatible with GHS compiler V3.5.1, V4.0.x
Note2:
Addresses of 1 MB or more can be downloaded. (Intel Hex Format)
Remark:
The format of a *.hex file is automatically determined.
44
User’s Manual
U18604EJ1V0UM
CHAPTER 5 DEBUG FUNCTION
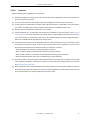
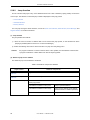
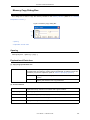
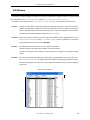
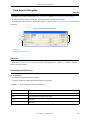
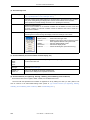
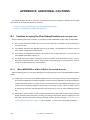
5.2.2
Downloading to External Flash Memory
The ID850QB can download load modules and HEX files to a flash memory connected to the external bus of the
target microcontroller.
To correctly download modules and files to the flash memory, be sure to read the following.
(1) Confirm supported emulators
The following emulators are supported.
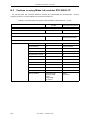
IECUBE, MINICUBE, N-Wire CARD, RTE-2000H-TP
Caution:
Whether downloading programs to an external flash memory using MINICUBE2 is possible
depends on the specifications of the debug monitor program. Support is under discussion.
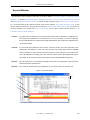
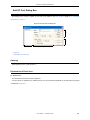
(2) Prepare a flash information file (FDB file) and confirm the supported flash memory
An FDB file is necessary for downloading to the flash memory. Download the FDB file from the following website
(Development Tools Download webpage). A readme file exists in the compressed folder storing the FDB file. The
supported flash memories are shown in this file. Be sure to read this file and check if the flash memory to be used
is supported.
http://www.necel.com/micro/ods/eng/
(3) Downloading procedure
Download data to the flash memory in the following procedure.
1) Mapping
Map the target flash memory in the mapping area of the Configuration Dialog Box. Specify the mapping
attribute as "Target".
2) Registering flash memory information
Open the Console Window and register flash memory information on the command line. For how to register
the information, refer to the description of the efconfig command.
3) Setting of external bus
Change the peripheral I/O register setting so as to use external buses, which enables accessing from the
target device to flash memory.
This setting can be changed in the IOR Window, but use of the Hook window (an expansion window) is
recommended, because the setting must be changed for individual registers.
Register settings can be changed at a time before downloading programs, by performing the setting in the
[BeforeDownload] tab in the Hook window. Processing will be made more efficient by including command
processing performed in step 2 into the code.
4) Downloading programs
Download programs via the Download Dialog Box.
When using an E2 core device, addresses in internal instruction RAM and external spaces may overlap. To
handle such a case, select "to external FlashROM" to give priority to downloading flash memory in the
external space.
User’s Manual
U18604EJ1V0UM
45
CHAPTER 5 DEBUG FUNCTION
(4) Cautions
• Data cannot be written to the external flash memory from the Memory Window or the like (can be read,
however).
• Sectors that are protected cannot be erased or written.
• If the device has a function to prohibit erasing and writing when power is turned on/off, it cannot be erased or
written, because a dedicated unlock command is not supported.
• Special sectors such as Secured Silicon Sector area that can permanently hold Electric Serial Numbers which
can be randomly assigned cannot be accessed (read, erased, or written), because no dedicated command is
supported.
5.2.3
Upload
Uploading of memory contents, etc., is performed in the Upload Dialog Box. The saving range can be set.
Format of file that can be uploaded is as follows:
Table 5-4 Type of File That Can Be Uploaded
Format
Extension
Intel Hex formatNote1
Hex Format (*.hex)Note2
Motorola Hex format S type (S0, S3, S7 - 32 bit-address)
Extended Tektronix Hex format
Binary data
Binary Data (*.bin)
Coverage results [IECUBE]
Coverage (*.cvb)
Note1:
Standard (16-bit addresses), extension (20-bit addresses), and extension linear (32-bit addresses)
Addresses of 1 MB or more can be uploaded. (Intel Hex Format)
Note2:
46
One of the formats can be specified when saving a *.hex file.
User’s Manual
U18604EJ1V0UM
CHAPTER 5 DEBUG FUNCTION
5.3
Source Display, Disassemble Display Function
Source file display is performed in the Source Window. Disassemble display and line assembly are performed in
the Assemble Window.
This section explains the following items:
- Source display
- Disassemble display
- Mixed display mode (Source Window)
- Convert symbol (symbol to address)
Remark:
The locations for which coverage measurement is executed in the user program are displayed in
the Source Window and Assemble Window. (Refer to "5.11.3 Display of locations for which
coverage measurement is executed".)
5.3.1
Source display
The corresponding text file is displayed in the Source Window by downloading a load module file having debug
information.
The display start position can be changed in the Source Text Move Dialog Box displayed by selecting [View]
menu -> [Move...].
Specifications related to the tab size, display font, etc., and specification of the source path are made in the
Debugger Option Dialog Box. Specify a searching method in the Source Search Dialog Box opened by clicking the
<Search...> button. The search result is highlighted in the Source Window.
Table 5-5 File Type Can Be Displayed
File Type (Extension)
Meaning
Source (*.c, *.s)
Source file
(The extension can be changed in the Debugger Option Dialog Box.)
Text (*.txt)
Text file
All (*.*)
All files
5.3.2
Disassemble display
Disassemble display is performed in the Assemble Window.
The display start position can be changed in the Address Move Dialog Box opened by selecting [View] menu ->
[Move...].
Offset display and register name display are specified in the Debugger Option Dialog Box.
Specify a searching method in the Assemble Search Dialog Box opened by clicking the <Search...> button. The
search result is highlighted in the Assemble Window.
User’s Manual
U18604EJ1V0UM
47
CHAPTER 5 DEBUG FUNCTION
5.3.3
Mixed display mode (Source Window)
Programs can be disassembled and displayed combined with the source file by selecting [View] menu -> [Mix] in
the Source Window. The contents displayed in the mixed display mode can be saved as a view file.
Normal display mode
In the normal display mode, general text files can be displayed as well as source files.
Mixed display mode
If a program code corresponds to the line of the displayed source file, the disassembly line is displayed next to
the source line. The label of the address, code data, and disassembled mnemonic are displayed (the display
start position of the mnemonic is adjusted by the set value of the tab size).
Caution1:
The mixed display mode is valid only when the load module is downloaded and the symbol information is read, and the corresponding source file is displayed.
Caution2:
The disassembled code cannot be edited in the Source Window, even if it is in the mixed display
mode. To edit the disassembled code, use the Assemble Window.
Remark:
When scrolling is performed using the cursor keys in the Mixed display mode, excessive scrolling
may occur. Also, scrolling down to the last line may not be possible using the cursor keys.
48
User’s Manual
U18604EJ1V0UM
CHAPTER 5 DEBUG FUNCTION
5.3.4
Convert symbol (symbol to address)
In the Symbol To Address Dialog Box, can be displayed the address of the specified variable or function, or the
value of the specified symbol.
Convert symbol is performed by selecting the character string to be converted in the Source Window or
Assemble Window, and then selecting context menu -> [Symbol...].
The Specification symbols is indicated below.
Table 5-6 Specifying Symbols
Conversion Target
Specification Method
Variable
var
file#var (to specify a static variable with file name)
file#func#var (to specify a static variable with file name and function name)
prog$file#func#var (to specify a static variable with program name, file name
and function name)
Function
func
file#func (to specify a static function with file name)
prog$file#func (to specify a static variable with program name and file name)
Label
label
file#label (to specify a local label with file name)
prog$file#label (to specify a local label with program name and file name)
Line number of source file
file#no
prog$file#no
I/O port name
portname
IOR name
I/O regname
Register name
regname
PSW flag name
pswname
Remark1:
Separator "#"
"#" is used as a separator for file names, variables, function names, and line numbers. If a specified symbol is not found in the scope, all symbols (static variables, static functions, local labels) are
searched.
Remark2:
Separator "$"
To specify a load module name when two or more load modules are read, use "$" as a separator to
delimit the load module name from a file name, variable, function name, or symbol name.
In the default status, a symbol name takes precedence. To temporarily change the priority, prefixing "$" to a symbol gives the priority to a register name.
User’s Manual
U18604EJ1V0UM
49
CHAPTER 5 DEBUG FUNCTION
5.4
Break Function
The break function is used to stop execution of the user program by the CPU and operation of the tracer.
This section explains the following items:
- Break types
- Breakpoint setting
- Setting breaks to variables
- Hardware break and software break
- Fail-safe break function [IECUBE]
- Cautions
5.4.1
Break types
The ID850QB has the following break functions.
Table 5-7 Break Types
Item
Contents
Hardware break Note1
(Event detection break)
Function to stop user program execution upon detection of the
set break event condition.
-> Refer to "5.4.2 Breakpoint setting".
Software break Note1
Function to replace the instruction at the specified address
software break instruction and stop the user program executed.
(Refer to "5.4.4 Hardware break and software break".)
-> Refer to "5.4.2 Breakpoint setting".
[Come Here] break Note2
(Simple break)
Function to stop user program execution selected by selecting
[Run] menu -> [Come Here] upon detection of address specified in the Source Window or Assemble Window.
Break on satisfaction of condition of step
execution
Function to stop execution upon satisfaction of the stop condition of each command ([Step In], [Next Over], [Return Out],
[Slowmotion]).
Forced break
Function to forcibly stop execution by selecting [Run] menu
-> [Stop], or selecting the STOP button.
It is valid for all the execution commands.
Fail-safe break [IECUBE]
Function to forcibly stop execution when the user program
performs an illegal operation in relation to the memory or
registers. (Refer to "5.4.5 Fail-safe break function [IECUBE]".)
-> Refer to " Fail-safe Break Dialog Box".
Time-out break [IECUBE]
Function to stop user program execution when the measurement time exceeds the specified time-out time. (Refer to "5.9
Timer Function [IECUBE]".)
-> Refer to " Timer Dialog Box".
Note1:
This break is valid for [Go], [Go & GO], [Come Here] and [Restart]. (Refer to "Table 5-9 Type of
Execution".)
50
User’s Manual
U18604EJ1V0UM
CHAPTER 5 DEBUG FUNCTION
Note2:
After user program execution has been stopped, the breakpoint by this function is eliminated.
During execution of a user program by this function, break events set before the cursor position
does not occur.
5.4.2
Breakpoint setting
Breakpoints can simply be set to the desired location by clicking in the Source Window or Assemble Window.
Since breakpoints are set as break event conditions and managed using the Event Function, restrictions apply to
the number of breakpoints that can be set. (Refer to "5.12.4 Number of enabled events for each event condition".)
(1) Breakpoint setting method
Breakpoints are executed by clicking lines in which " * " is displayed (lines where program code exists).
In the default setting, software breakpoint (B) is set, but if [Breakpoint] is selected in the context menu, hardware
breakpoint (B, or B) is set. (Refer to "5.4.4 Hardware break and software break".)
If a breakpoint is set on a line on which an event breakpoint has already been set, "A" indicating that multiple
events have been set is marked. (Refer to "Table 6-13 Event Setting Status (Event Mark)".)
Caution:
A software breakpoint cannot be set/delete in an externally mapped ROM area.
Remark:
Breaks set by default can also be changed in the Extended Option Dialog Box.
Figure 5-1 Breakpoint Setting
Click the asterisk (*; program code) in this area.
User’s Manual
U18604EJ1V0UM
51
CHAPTER 5 DEBUG FUNCTION
(2) Deleting a breakpoint method
Click the position at which the breakpoint to be deleted is set.
At the same time as setting is performed, in the default setting, software breakpoint (B) is deleted, but if
[Breakpoint] is selected in the context menu, hardware breakpoint (B, or B) is deleted.
As a result of deletion, If another event remains, however, the mark of that event is displayed.
5.4.3
Setting breaks to variables
Access breaks can easily be set to variables from the context menu in the Source Window or Watch Window.
Figure 5-2 Setting Break to Variable
5.4.4
Hardware break and software break
(1) Hardware break
Hardware breaks are breaks that are set using one hardware resource per event condition.
Therefore, in the ID850QB, they are managed using "5.12 Event Function" as break event conditions.
The number of valid break points varies depending on the device (Refer to "5.12.4 Number of enabled events for
each event condition".)
(2) Software break
Software breaks are breaks that are set by rewriting instructions of specified addresses to software break
instructions. Settings to external ROM, stopping at variable access timing, etc., cannot be specified.
The number of valid software break is as follows:
52
User’s Manual
U18604EJ1V0UM
CHAPTER 5 DEBUG FUNCTION
Table 5-8 The Number of Valid Software Break
Connected IE
Valid Number
[IECUBE]
2000
[MINICUBE]
[MINICUBE2]
2000Note
Note:
Software breaks in relation to internal ROM and internal flash memory are automatically set by the
ROM collection function.
The maximum number of software breaks that can be set with the ROM collection function
depends on the product (4). Moreover, the software breaks set with the ROM collection function
are temporarily disabled by target reset or internal reset, but they are enabled when a break
occurs.
Caution:
When the Pseudo real-time monitor function (Break When Readout) is enabled, no software break
points can be set.
When a valid software break point has been set, writing during user program execution is disabled
(DMM Function). [IECUBE]
Software break is managed by the Software Break Manager.
Figure 5-3 Management of Software Breaks
User’s Manual
U18604EJ1V0UM
53
CHAPTER 5 DEBUG FUNCTION
5.4.5
Fail-safe break function [IECUBE]
The fail-safe break settings are performed in the Fail-safe Break Dialog Box.
Individual settings are possible by selecting checkboxes.
Remark:
However, the protect setting for the internal RAM area is performed through verify processing by
software, and therefore a warning is displayed during breaks.
During IOR Illegal and internal RAM verify checks, the address is displayed on the status bar.
Verify is performed at 0x00.
Figure 5-4 Fail-safe Break Setting
5.4.6
Cautions
Note the following points regarding the break functions.
(1) The PC indicates the address after halt if a break occurs in the HALT status.
(2) The access event break is delayed (the specified address is passed before execution stops).
(3)
When a download or project file load is performed, the hardware breakpoints or events may shift in the
middle of an instruction. Delete the hardware breakpoints or events and re-set them.
(4)
When a software breakpoint has been set in a module file with no debug information and a download or
project file load is performed, the software breakpoint will be deleted. Re-set the breakpoint.
(5)
A reset signal from the target system is masked during a break and the CPU or peripheral I/O cannot be
reset. In addition, the CPU or peripheral I/O is not reset normally if a reset signal from the target system or
internal reset occurs when the memory contents are overwritten with the DMM function or read with the
pseudo RRM function during user program execution.
(6)
When setting, changing or deleting a breakpoint, trace conditions or timer conditions during program
execution, the execution is stopped. Therefore, the break does not take effect if an event break or software
break occurs when a breakpoint, trace conditions, or timer conditions are set during user program
execution.A break also does not occur if an event break or software break occurs when rewriting the
memory contents using the DMM function or reading the memory contents using the pseudo RRM function.
(7) When NMI2 is input in a device with NMI2, the NMI2 interrupt routine of the user program is executed even
if a break is taking effect. Do not input NMI2 during a break period. [MINICUBE] [MINICUBE2]
54
User’s Manual
U18604EJ1V0UM
CHAPTER 5 DEBUG FUNCTION
(8) If a breakpoint is set in the vicinity of address 0 in the D70F3166, the error message " F0c25: Flash macro
service ROM was accessed or stepped in." will be displayed as a result of target reset or internal reset
generated by the watchdog timer. [MINICUBE] [MINICUBE2]
User’s Manual
U18604EJ1V0UM
55
CHAPTER 5 DEBUG FUNCTION
5.5
Program Execution Function
The program execution function is used to start/stop execution of the user program by the CPU and operation of
the tracer.
Through user program execution, the program counter (PC) advances until the set breakpoint or forced break.
(Refer to "5.4 Break Function".)
Remark:
While the user program is being executed, trace event condition and timer event condition can be
set. (Refer to " Trace Dialog Box", " Timer Dialog Box".) [IECUBE]
This section explains the following items:
- Execution types
- Cautions
5.5.1
Execution types
The following types of ID850QB execution functions are provided. They are operated using the execution
buttons on the toolbar , or from the [Run] menu.
Figure 5-5 Execution Button
Figure 5-6 [Run] Menu
56
User’s Manual
U18604EJ1V0UM
CHAPTER 5 DEBUG FUNCTION
Table 5-9 Type of Execution
Items
Contents
[Restart]
The CPU is reset and the user program is executed starting from address 0.
This is the same operation as "resetting the CPU before execution of the user
program and executing [Go]".
[Go]
The user program is executed starting from the address indicated by the current
PC register, and execution continues until a break condition is established.
[Ignore break points and
Go]
The user program is executed starting from the address indicated by the current
PC register Execution of the user program continues, ignoring set breakpoints.
[Return Out]
The user program is executed until execution returns to the calling function
described in C language.
[Step In]
In the source mode,Step execution of one line of the source text is performed
starting from the current PC register value and the contents of each window are
updated.
In the instruction mode,One instruction is executed from the current PC register
value and the contents of each window are updated.
[Next Over]
jarl instruction:
Next step execution is performed, assuming the function or subroutine called by
the jarl instruction as one step (step execution continues until the nesting level
becomes the same as when the jarl instruction was executed).
Instruction other than jarl:
The same processing as [Step In] is performed.
[Start From Here]
This command executes the user program starting from the specified address.
Execution of the user program is stopped when a set break event condition is
satisfied.
[Come Here]
The user program is executed from the address indicated by the current PC
register to the address selected in the line/address display area of the Source
Window or Assemble Window, and then a break occurs.
While the user program is being executed, the break event currently set does not
occur.
[Go & Go]
The user program is executed starting from the address indicated by the current
PC register and stopped if a set break event condition is satisfied. The contents of
each window are updated, and execution of the user program is resumed from the
address at which the program was stopped.
This operation is repeated until the user executes [Stop].
[Slowmotion]
Step execution of one line is performed from the address indicated by the current
PC register value in the source mode. In the instruction mode, step execution of
one instruction is performed. The contents of each window are updated each time
step execution is performed.
This operation is repeated until the user executes [Stop].
[CPU Reset]
CPU is reset.
[Stop]
Forcibly stops program execution.
User’s Manual
U18604EJ1V0UM
57
CHAPTER 5 DEBUG FUNCTION
5.5.2
Cautions
Note the following points regarding the program execution functions.
(1)
If a write instruction for the PRCMD or PHCMD register, which is performed immediately before an
instruction, is performed one by one with I/O registers that require a specific sequence, or if an instruction is
executed from such instructions, the write instruction is not performed normally.
(2) If a software break or hardware break before execution is set to an instruction located at the PC, a step-wise
execution is first performed and then real-time execution is performed. This causes an error in the time
measurement result in the timer. In addition, when the program operation is checked using the oscillator or
logic analyzer, the measured timing may differ between when [Go] is executed at a certain location and [Go]
is executed one instruction before that location.
(3)
If return execution is performed when a function is recursively called (stack is generated by the recursive
processing), the PC moves to the position where the processing of the function called last (leaf function)
ended. Even if this symptom appears, the subsequent operation is performed normally.
Example If the same function is called five times because of recursive processing
1:main()
2:fnuc01() Function is called. Execution exits from function.
3:func01()
↓ (*)
↑
4:func01()
5:func01()
6:func01()
If return execution (that generates the stack) is performed when functions are called in the order of 2, 3, 4,
5, and 6 (*), the address moves the position at which processing 6 is completed. If return execution (which
deletes the stack) is performed when execution exits from functions 6, 5, 4, 3, and 2, in that order, execution
correctly returns to the main function, from 5 to 4, from 3 to 2, and so on.
(4) Assembler instructions enclosed by “#pragma asm” and “#pragma endasm” can be executed step-wise
in the source mode. The instructions written in a “_asm()” statement cannot be executed.
(5) If step-wise execution is performed in the source mode, it is judged whether an interrupt is serviced, based
on the NP, EP, and ID flags of the PSW register. If the above flags or registers have been changed because
nesting is used, return execution and stack display may not be correctly executed.
(6)
The static functions described in the header file cannot be stepped into by step-wise execution. An
#include statement cannot be stepped into nor can breakpoints be set.
(7) An NMI and other interrupts are not acknowledged during step-wise execution.
(8) In the conditional statement of an if-else statement, a line that should not be executed may be passed.When
such a case occurs, select the mixed display mode in the Source window and confirm that the else
statement has not been executed.
58
User’s Manual
U18604EJ1V0UM
CHAPTER 5 DEBUG FUNCTION
(9)
A function that has been expanded in-line cannot be stepped in. Because the original function code is
created separately from the part that has been expanded inline, it is possible to set an event there, but the
event does not occur because the original code is not executed (whether inline expansion has been
performed can be checked by the mixed display on source window).
(10) When two instructions are executed simultaneously in a program, be aware of step-wise executions and
breaks based on the breakpoint setting.
Refer to examples 1 to 3 below.
<Example 1>
Two instructions are stepped from Address A, where one instruction should be stepped.
Address A: MOV r1, r2
Address A+2: XOR r1, r2
<Example 2>
When a breakpoint before execution is set at address A+2 and [Go] is executed, a break does not occur at
address A+2.
Address A: MOV r1, r2
Address A+2: XOR r1, r2 <--- A breakpoint before execution
<Example 3>
When a hardware breakpoint after execution or a software breakpoint is set at address A+2 and [Go] is
executed, a break occurs at address A+2.
Address A: MOV r1, r2
Address A+2: XOR r1, r2 <--- A breakpoint after execution/software breakpoint
User’s Manual
U18604EJ1V0UM
59
CHAPTER 5 DEBUG FUNCTION
5.6
Watch Function
This section explains the following items related to the watch function:
- Displaying and changing data values
- Displaying and changing local variable values
- Registering and deleting watch data
- Changing watch data
- Temporarily displaying and changing data values
- Callout watch function
- Stack trace display function
5.6.1
Displaying and changing data values
Data values are displayed and changed in the Watch Window. Shifts in data values can be checked by
registering watch data.
The display format is specified in the Debugger Option Dialog Box.
Figure 5-7 Watch Window
Figure 5-8 Specification of the Display Format (Debugger Option Dialog Box)
60
User’s Manual
U18604EJ1V0UM
CHAPTER 5 DEBUG FUNCTION
5.6.2
Displaying and changing local variable values
Local variables are displayed and changed in the Local Variable Window.
Local variables within the current function are automatically displayed in this window. (Variable addition/deletion
is not possible.)
Figure 5-9 Local Variable Window
5.6.3
Registering and deleting watch data
Data can be registered to the Watch Window from the Source Window or Assemble Window. This is simply
done by selecting the variable or symbol name in the respective window, and then clicking the <Watch> button.
Registration is also possible with the following method.
- Drag and drop the selected variable or symbol name directly on the Watch Window. (Refer to "5.16.4 Drag &
drop function".)
- Click the <Add> button in the Quick Watch Dialog Box or Add Watch Dialog Box.
To delete watch data, click the variable name or symbol name (multiple selections can also be made using the
Shift key or Ctrl key), and then click the <Delete> button. However, lines with an expanded hierarchy, such as
elements of an array, and members of structures and unions, cannot be deleted.
User’s Manual
U18604EJ1V0UM
61
CHAPTER 5 DEBUG FUNCTION
5.6.4
Changing watch data
Watch data is changed in the Change Watch Dialog Box.
Note that the symbol name can be changed even if it results in duplication of a name already in use with existing
data.
Figure 5-10 Change Watch Dialog Box
5.6.5
Temporarily displaying and changing data values
Data values are temporarily displayed and changed in the Quick Watch Dialog Box.
Select the desired variable or symbol name in the Source Window or Assemble Window and click the <Quick...>
button to perform watch data registration.
The display radix, display size, and display number can be changed in this window.
Figure 5-11 Quick Watch Dialog Box
5.6.6
Callout watch function
The corresponding variable value pops up when the mouse cursor is placed over a selected variable in the
Source Window or Assemble Window.
Figure 5-12 Callout Watch Function
62
User’s Manual
U18604EJ1V0UM
CHAPTER 5 DEBUG FUNCTION
5.6.7
Stack trace display function
This function displays the stack contents of the current user program in the Stack Window.
Figure 5-13 Stack Window
User’s Manual
U18604EJ1V0UM
63
CHAPTER 5 DEBUG FUNCTION
5.7
Memory Manipulation Function
This section explains the following items related to the memory manipulation:
Verify check, etc., is specified in the Extended Option Dialog Box.
- Displaying and changing memory contents
- Access monitor function [IECUBE]
- Filling, copying, and comparing memory contents
- Flash memory writing function [MINICUBE] [MINICUBE2]
5.7.1
Displaying and changing memory contents
In the Memory Window, the memory contents can be displayed or changed by using mnemonic codes,
hexadecimal codes, and ASCII codes. Searching is done in the Memory Search Dialog Box displayed by clicking
the <Search...> button. The results of search is highlighted in the Memory Window.
The display start position can be changed in the Address Move Dialog Box displayed by selecting [View] menu > [Move...].
The variables and data allocated to the sampling range can be displayed in real time even during program
execution. (Refer to "5.13 RRM Function".)
64
User’s Manual
U18604EJ1V0UM
CHAPTER 5 DEBUG FUNCTION
5.7.2
Access monitor function
[IECUBE]
The access monitor function displays the access status (read, write, read & write) for the sampling range of the
The RRM Function using different colors in the Memory Window. The access monitor view is available only when
"Byte" is selected for the display units. Colors are not displayed in the ASCII display area. Cumulative display
setting and access status display can be cleared by selecting [View] menu -> [Access Monitoring].
Caution1:
The value of memory rewritten via DMA during program execution, and the value of memory rewritten from the debugger cannot be displayed on the access monitor.
Caution2:
This function is enabled only when [Option] menu -> [RRM Function] is selected.
Figure 5-14 Access Monitor Function (Memory Window)
5.7.3
Filling, copying, and comparing memory contents
Memory contents are Filled, copied, and compared in the Memory Fill Dialog Box, Memory Copy Dialog Box, and
Memory Compare Dialog Box displayed by selecting [Edit] menu -> [Memory] -> [Fill.../Copy.../Compare...].
The comparison results are displayed in the Memory Compare Result Dialog Box.
User’s Manual
U18604EJ1V0UM
65
CHAPTER 5 DEBUG FUNCTION
5.7.4
Flash memory writing function [MINICUBE] [MINICUBE2]
With the ID850QB, the internal flash memory can be written and the load module can be downloaded by the
same access method as an ordinary memory operation.
The data on the internal flash memory can be changed from the Memory Window, Assemble Window, Watch
Window, Memory Fill Dialog Box and Memory Copy Dialog Box, without having to be aware that the data is that of
the internal flash memory. The load module can also be downloaded to the internal flash memory by using the flash
self programming function. (Refer to " Flash Option Dialog Box" and " Data Flash Option Dialog Box".)
Caution1:
No data can be written to the internal flash memory during user program execution.
Caution2:
Downloading data to the on-chip flash memory cannot be cancelled when it is in progress.
Caution3:
If the [Execute Symbol Reset after Download] check box is selected in the Debugger Settings dialog box of PM+ when downloading data from PM+ to the on-chip flash memory, the data in the
flash memory will be erased before downloading data.
Remark:
With the ID850QB, the remaining area contents after the load module was downloaded to the internal flash memory are erased.
66
User’s Manual
U18604EJ1V0UM
CHAPTER 5 DEBUG FUNCTION
5.8
Register Manipulation Function
This section explains the following items related to the register manipulation function.
- Displaying and changing register contents
- Displaying and changing peripheral I/O registers contents
- Displaying and changing I/O port contents
5.8.1
Displaying and changing register contents
Register contents can be displayed and changed in the Register Window.
Register name display switching (absolute name/function name) can be done in the Debugger Option Dialog
Box.
Remark:
The display register is selected in the Register Select Dialog Box.
Figure 5-15 Absolute Name/Function Name Switching
User’s Manual
U18604EJ1V0UM
67
CHAPTER 5 DEBUG FUNCTION
5.8.2
Displaying and changing peripheral I/O registers contents
The peripheral I/O registers contents can be displayed and changed in the IOR Window.
The display start position can be changed in the Address Move Dialog Box displayed by selecting [View] menu > [Move...].
The display register is selected in the IOR Select Dialog Box.
Figure 5-16 Display IOR contents
5.8.3
Displaying and changing I/O port contents
User-defined I/O ports can be displayed and changed in the IOR Window once they have been registered in the
Add I/O Port Dialog Box.
In the case of products that support programmable I/O registers, programmable I/O register contents can be
displayed and changed by setting programmable I/O area use in the Configuration Dialog Box.
Figure 5-17 Register I/O Port
68
User’s Manual
U18604EJ1V0UM
CHAPTER 5 DEBUG FUNCTION
5.9
Timer Function [IECUBE]
The timer function measures the execution time (run-break time) from the start of user program execution until a
break, or the execution time in a specific user program interval using timer events.
The ID850QB timer function performs measurements using an external clock. Therefore, the measurable time
differs based on the setting in "Table 6-7 Relationship Between Timer Count Division Ratio and Maximum
Measurement Time (Timer counter (Timer))".
The Run-break time is also displayed in the status bar in the Main Window.
Caution1:
The time measured using the time measurement function is illegal in the following cases.
- The PRM window of the Expansion window is open during program execution.
- A hardware break or software break is set during program execution.
- A value is written to the memory using the DMM function during program execution.
Caution2:
If time is measured with a resolution lower than the one determined by the division ratio, the
measurement result is not displayed.When time is measured with a 4K-division ratio and a
resolution lower than 81,920 ns, the measurement result is not displayed in the case of section
measurement. In the case of Run-Break, the measurement "pass = 1 and total = 0" is displayed.
This section explains the following items:
- Timer event conditions
- Run-Break event
- Cautions
User’s Manual
U18604EJ1V0UM
69
CHAPTER 5 DEBUG FUNCTION
5.9.1
Timer event conditions
A timer event condition specifies the trigger by which time measurement is started or stopped. Timer event
conditions are set in the Timer Dialog Box. (Refer to "5.12 Event Function".)
In the ID850QB, time-out break settings can be performed in the Time Out Break area.
Figure 5-18 Sets and Displays Timer Event (Timer Dialog Box)
Continuous display in the Timer Result Dialog Box can be selected by clicking the <View Always> button.
Timer manipulations during program execution are performed by selecting [Run] -> [Timer Start/Timer Stop].
5.9.2
Run-Break event
Run-Break event is a timer event name given to a timer event condition that measures the execution time from
execution to break. Run-break events are registered in advance and the run-break time can be displayed through
specification in the Timer Dialog Box.
The Run-break time is also displayed in the status bar in the Main Window.
Since Run-Break events are included in the number of timer events that can be simultaneously enabled (refer to
"5.12.4 Number of enabled events for each event condition"), they can be used added to the number of valid timer
event conditions.
70
User’s Manual
U18604EJ1V0UM
CHAPTER 5 DEBUG FUNCTION
5.9.3
Cautions
For IECUBE, the same timer count rate value is applied to all timer events. Therefore, the time set in (3) Time
Out Break changes when the timer count rate at the time of the event creation (the value displayed in "Count Rate"
is different from the current timer count rate value (the value set in (2) Timer [IECUBE] in the Extended Option Dialog Box).
Example:
In the case of a timer event whose timer count rate value at the time of the event creation is set to "16" and
whose timeout time is set to "1 sec"
(1) When the current timer count rate value is "32"
->The current timer count rate value is two times higher than the value at the time of the event creation.
This leads to the occurrence of a Timer Over Break in 2 seconds.
(2) When the current timer count rate value is "4"
->The current timer count rate value is a quarter of the value at the time of the event creation. This leads to
the occurrence of a Timer Over Break in 250 m seconds.
Therefore, do not set the timeout break in the above case. (No problems occur when the timeout break is set to
"OFF" or "Overflow.")
To set the timeout break, change the timer count rate value in (2) Timer [IECUBE] in the Extended Option Dialog
Box, and reset the timer event.
User’s Manual
U18604EJ1V0UM
71
CHAPTER 5 DEBUG FUNCTION
5.10
Trace Function [IECUBE]
The trace function is used to save the history of the data indicating the execution process of the user program to
the trace memory.
The DMA (Direct Memory Access) start point and end point are traced regardless of the trace condition. (Refer
to "5.10.7 DMA point trace function".)
This section explains the following items:
- Trace memory
- Setting trace data
- Checking trace data
- Mixed display mode (Trace View Window)
- Tracer operation
- Setting conditional trace
- DMA point trace function
- Cautions
Caution:
RRM Function, Trace Function [IECUBE] and Coverage Measurement Function [IECUBE] are
functions that are used on a mutually exclusive basis. (Refer to "5.11.4 RRM function, trace
function, and coverage function used on a mutually exclusive basis".)
To switch between the three functions, go to the [Option] menu.
5.10.1
Trace memory
ID850QB has trace memory with a ring structure. Size specification is done in the Extended Option Dialog Box.
The maximum trace memory capacity is as follows.
Table 5-10 Trace Memory Size
Connected IE
Maximum Value
256 KB
[IECUBE]
72
User’s Manual
U18604EJ1V0UM
CHAPTER 5 DEBUG FUNCTION
5.10.2
Setting trace data
The detailed settings for the collected traced data are done in the Extended Option Dialog Box.
Complement display of instructions between branch instructions that cannot be traced by hardware is possible in
the complement mode (enabled by selecting the Complement Data area checkbox). When the complement mode
is enabled, assemble display of the internal ROM area is possible during user program execution (while the tracer
is stopped).
Figure 5-19 Setting Trace Data
5.10.3
Checking trace data
The trace data saved to the trace memory can be checked in the Trace View Window.Trace data can be
searched in the Trace Search Dialog Box displayed by clicking the < Search...> button.
The display start position can be changed in the Trace Move Dialog Box displayed by selecting [View] -> [Move].
The display items in the Trace View Window can be selected in the Trace Data Select Dialog Box.
This area is used to set the division ratio of the counter used for time tag display in the Trace View Window. The
division ratio is set in the Extended Option Dialog Box. Setting a time tag counter, count rate, and total time tag are
performed in the Extended Option Dialog Box.
Figure 5-20 Checking Trace Data
User’s Manual
U18604EJ1V0UM
73
CHAPTER 5 DEBUG FUNCTION
5.10.4
Mixed display mode (Trace View Window)
Source file display combined with trace results can be done by selecting [View] -> [Mix] in the Trace View
Window (mixed display mode).
If a program code corresponds on the program fetch address to be displayed, a source file line is displayed
before the line indicating the result of tracing that program fetch address.
The source file line is displayed, emphasized in green.
Mixed display mode
Caution:
The mixed display mode is valid only when the load module has been downloaded and symbol
information is read, and when a fetch address, fetch data, fetch status, or result of disassembly is
displayed.
5.10.5
Tracer operation
The trace operation differs as follows according to the user program execution format and the tracer control
mode.
Tracer manipulations during program execution are performed by selecting [Run] -> [Tracer Start/Tracer Stop].
(1) Operation during execution
The tracer operation differs as follows according to [Run] -> [Cond. Trace ON/Uncond. Trace ON] selection.
Table 5-11 Type of Trace Modes
Item
Contents
Unconditional trace
Trace is started when execution of user program, and ends when a break
occurs.
At this time, the set trace event conditions are ignored.
Conditional trace
Trace is started or stopped by the condition set in the Trace Dialog Box.
(Refer to "5.10.6 Setting conditional trace".)
If a break occurs while a trace is being executed, however, trace is stopped
immediately.
(2) Operation during Step In execution
The tracer operates every step execution, and trace data of one step is successively added to the trace memory.
74
User’s Manual
U18604EJ1V0UM
CHAPTER 5 DEBUG FUNCTION
(3) Operation during Next Over execution
The operation of the tracer differs depending on the instruction to which Next Over is to be executed.
(a) jarl disp22, [lp] instruction
The jarl instruction and the subroutine that was called are traced.
(b) Other instructions
The same operation as that during Step In execution is performed.
(4) Tracer Control Mode
There are the following types of trace control mode. These trace mode settings are performed from the [Run]
menu.
Table 5-12 Types of Tracer Control Mode
Mode
Contents
Non Stop
Goes around the trace memory and overwrites data from the oldest frame
(default).
Full Stop
Goes around the trace memory and then stops the tracer.
Full Break
Goes around the trace memory and then stops the tracer and program
execution
Delay Trigger Stop
Traces data by the number of delay count frames and stops the tracer when
a delay trigger event has occurred.
User’s Manual
U18604EJ1V0UM
75
CHAPTER 5 DEBUG FUNCTION
5.10.6
Setting conditional trace
A trace event condition triggers starting/stopping trace execution when a conditional trace is set.
By setting a trace event condition in the Trace Dialog Box, the conditional trace can be set. (Refer to "5.12 Event
Function".)
To use the conditional trace, select [Run] menu -> [Cond. Trace ON].
There are the following types of conditional trace.
Table 5-13 Types of Conditional Trace
Item
Contents, Setting method
Section trace
Executes a trace between two specified conditions (in a specific zone).
A section trace can be executed by setting a trace start event and trace end
event in the Trace Dialog Box and selecting [Run] -> [Cond. Trace ON].
Qualify trace
Executes a trace only when a condition is satisfied.
If two or more events are set as qualify trace events, a qualify trace can be
executed by executing a conditional trace.
A qualify trace can be executed by setting a qualify trace event in the Trace
Dialog Box and selecting [Run] -> [Cond. Trace ON].
Delay trigger trace
Executes a trace by the number of delay counts after a condition has been
satisfied.
A delay trigger trace can be executed by setting a delay trigger event in the
Trace Dialog Box, setting a delay count in the Delay Count Dialog Box and
selecting [Run] -> [Cond. Trace ON].
5.10.7
DMA point trace function
The DMA point trace (Direct Memory Access Trace) function is performed prior to normal trace functions.
For frames to be accessed using the DMA point trace function, the "M" mark is displayed in the Trace View
Window.
Below are the types of DMA point trace function operations.
(1) During unconditional trace
Not only all the points that are traced using the normal all trace function but also the DMA start and end points
are always traced using the DMA point trace function.
(2) During section trace
Not only the points that are traced using the normal section trace function but also the DMA start and end points,
which may be located outside of the section-trace area, are always traced using the DMA point trace function.
(3) During qualify trace
Not only the points that are traced using the normal qualify trace function but also the DMA start and end points
are always traced even when conditions for the qualify trace are not satisfied using the DMA point trace function.
76
User’s Manual
U18604EJ1V0UM
CHAPTER 5 DEBUG FUNCTION
5.10.8
Cautions
Note the following points regarding the trace functions.
(1) Disassemble display is not output in the Trace window when trace complement mode is off and execution of
the user program is in progress.
(2) The read access frame and write access frame may be displayed in reverse in the Trace window.
(3)
A large amount of invalid frames are output when step-wise execution is performed in the Trace window.
The number of invalid frames can be reduced by setting the trace complement mode to ON.
(4) The RETI instruction allocated to address 0x7c is not traced.
(5) If the items Branch PC, Access DATA, and Access PC are selected for the trace function of the Extended
Option Dialog Box, the same instruction (e.g. prepare, dispose, callt) is displayed two frames in succession
in the Trace window. The frequency of this bug can be reduced by setting the trace complement mode to
ON.Use a combination other than Branch PC and Access PC.
(6) A time measurement clock of 20 ns (50 MHz) is used for counting the time tag in the Trace window, and is
not related to the actual CPU clock. An error of up to 32 CPU clocks occurs. In addition, an error occurs in
the time tag in the following cases, because the CPU is stopped for a moment.
- When the RAM monitor function is used during program execution
- When a hardware break or software break is set during program execution
- When a value is written to the memory with the DMM function during program execution
- When the real-time monitor area is set or modified during program execution
(7) The time tag value in the Trace window is the integrated value, but the value may be smaller than the actual
value, though this is unlikely. The frequency of this error can be reduced by raising the timer count rate with
the Extended Option Dialog Box.
(8) When a break occurs at a software breakpoint, the instruction that sets the software breakpoint is traced as
the executed instruction even though it has not been executed.Similarly, an unexecuted instruction is traced
as it is executed when the coverage measurement function is used.
User’s Manual
U18604EJ1V0UM
77
CHAPTER 5 DEBUG FUNCTION
5.11
Coverage Measurement Function [IECUBE]
Although there are several types of coverage measurement, the ID850QB performs measurement for C0
coverage.
C0 coverage (instruction coverage): A percentage that all statements in a code are executed at least once
Download or upload the coverage measurement result (coverage data) via the Download Dialog Box or Upload
Dialog Box, respectively.
This section explains the following items:
- Coverage mesurement result display
- Coverage measurement range
- Display of locations for which coverage measurement is executed
- RRM function, trace function, and coverage function used on a mutually exclusive basis
Caution1:
This function is disabled when no coverage boards are incorporated.
Caution2:
RRM Function, Trace Function [IECUBE] and Coverage Measurement Function [IECUBE] are
functions that are used on a mutually exclusive basis (refer to "5.11.4 RRM function, trace function,
and coverage function used on a mutually exclusive basis").
To switch between the three functions, go to the [Option] menu.
78
User’s Manual
U18604EJ1V0UM
CHAPTER 5 DEBUG FUNCTION
5.11.1
Coverage mesurement result display
The coverage measurement result can be checked in the Code Coverage Window.
In the Code Coverage Window, the measurement result is displayed individually for functions, sections, and
interrupt handlers (vectors). The coverage measurement result is updated at a break (it is not updated
automatically during user program execution). Clear the coverage data by selecting [Option] menu. Coverage data
can be saved in the CSV format. (Refer to "5.15.2 Window display information (view file)".)
The saved contents vary depending on the tab selected.
Clear the coverage data by selecting [Option] menu ->[Coverage] ->[Clear].
Figure 5-21 Coverage Mesurement Result Display
5.11.2
Coverage measurement range
The coverage measurement range is as follows.
Table 5-14 Code Coverage Measurement Range
Connected IE
[IECUBE]
Code Coverage Measurement Range
Internal ROM space + any 1 MB space (selectable by Coverage-Address Dialog
Box)
User’s Manual
U18604EJ1V0UM
79
CHAPTER 5 DEBUG FUNCTION
5.11.3
Display of locations for which coverage measurement is executed
The locations for which coverage measurement is executed in the user program are displayed in the Source
Window and Assemble Window based on the coverage measurement information.
The display result can be saved as view files for the Source Window and Assemble Window. (Refer to "5.15.2
Window display information (view file)".)
The numbers of line or addresses for which coverage measurement is executed are highlighted as shown in the
table below. In the view file, the marks in the table below are appended to the relevant line number or address
instead of using the background color.
Table 5-15 Format of View of Locations for which Coverage Measurement is Executed
Source Window
Coverage
Background
Color
Mark
Code on this line has been executed by
100%
Yellow
@
Code on this line has been executed by
1 to 99%
Orange
+
Code on this line has been executed by
0% (not yet executed)
Red
!
Remark
Assemble Window
Background
Color
Mark
@
Yellow
---
Red
These are default colors.
They can be changed in the Coverage-Color Dialog Box.
Figure 5-22 View of Locations for which Coverage Measurement is Executed
80
User’s Manual
U18604EJ1V0UM
!
CHAPTER 5 DEBUG FUNCTION
5.11.4 RRM function, trace function, and coverage function used on a mutually
exclusive basis
RRM Function, Trace Function [IECUBE] and Coverage Measurement Function [IECUBE] are functions that are
used on a mutually exclusive basis.
Accordingly, the trace and coverage functions cannot be used when the RRM function is selected; the RRM and
coverage functions cannot be used when the trace function is selected; and the RRM and trace functions cannot
be used when the coverage function is selected.
To switch between the three functions, go to the [Opiton] menu, and select one of the [RRM Function/Trace
Function/Coverage Function].
Basically, the three functions are used on a mutually exclusive basis; however the operations below are possible.
- The switching of the functions does not clear coverage data.
- Even when a function other than the coverage function is selected, coverage data can be downloaded,
uploaded, and cleared.
- When the coverage function is selected, it is possible to perform traces, with the trace mode fixed at "All PC."
(Conditional traces cannot be performed.)
- When the RRM function is selected, the trace data displayed in the Trace View Window indicates only branch
information and access information in the sampling range of Real-time monitor function [IECUBE]. (Traces are
performed, with the trace mode fixed at "Branch PC.")
User’s Manual
U18604EJ1V0UM
81
CHAPTER 5 DEBUG FUNCTION
5.12
Event Function
Events specify specific states of the target system during debugging, such as "fetched address 0x1000" or
"Wrote data to address 0x2000".
In ID850QB, such events are used as action triggers for each debugging function, such as break and trace.
This section explains the following items:
- Using event function
- Creating events
- Setting event conditions
- Number of enabled events for each event condition
- Managing events
- Cautions [MINICUBE] [MINICUBE2]
5.12.1
Using event function
Events (event conditions and event rink conditions) consist of the event conditions listed in the following table, by
assigning various debugging functions. As a result, event conditions can be utilized according to the debugging
purpose.
Table 5-16 Various Event Conditions
Event Condition
Contents
->Setting Dialog Box
Mark
Break event
B
Condition in which the execution of the user program or
operation of a tracer is stopped. (Refer to "5.4 Break Function".)
->Break Dialog Box
Trace event [IECUBE]
T
Condition in which the process of user program execution is
saved to the trace memory. (Refer to "5.10 Trace Function
[IECUBE]".)
->Trace Dialog Box
Timer event [IECUBE]
Ti
Condition for specifying the time measurement start timing and
stop timing. (Refer to "5.9 Timer Function [IECUBE]".)
->Timer Dialog Box
82
User’s Manual
U18604EJ1V0UM
CHAPTER 5 DEBUG FUNCTION
5.12.2
Creating events
Events can be used as action triggers of various event conditions described before through registration of event
conditions and event link conditions, individually naming states called events.
(1) Creating and registering events
The creation of event conditions is done in the Event Dialog Box.
Set an address condition, status condition, and data condition in this dialog box. Specify a combination of these
as one event condition and name and register this event condition.
A simple method consists in using event conditions generated by setting breakpoint in the Source Window and
Assemble Window. (Refer to "5.4.2 Breakpoint setting".)
(2) Creating and registering event links
Event link conditions are conditions for single events that provide ordered restrictions for event conditions, and
are generated when user programs are executed according to the specified sequence.
To create an event link condition, use the Event Link Dialog Box.
5.12.3
Setting event conditions
Various event conditions listed in Table 5-16 are individually created in the corresponding dialog box.
(1) Setting of Various Event Conditions
The setting of the various event conditions is done by selecting the event icon of the desired event condition or
event link condition displayed in the event manager area (or Event Manager) in the respective setting dialog box,
and dragging and dropping this icon in the condition area to be set.
Figure 5-23 Setting of Various Event Conditions
The shape of the mouse cursor changes to "OK" when it is dragged over a settable condition area.
Regarding the created event conditions, the event icon mark becomes red and the setting is enabled by clicking
the <Set> button or the <OK> button in the Setting dialog box. After the event has been set, a debugging action
occurs as various event conditions.
User’s Manual
U18604EJ1V0UM
83
CHAPTER 5 DEBUG FUNCTION
(2) Settings using selection mode (settings after checking contents)
The Event Dialog Box or Event Link Dialog Box are open in the selection mode by placing the focus on the
condition area to be set and then clicking the <Add Event...> button or the <Add Link...> button. Because when a
condition set in the dialog box is selected, the corresponding detailed condition is displayed, conditions can be set
after checking the contents.
(3) Copying and moving event icons
In the event condition setting area, event conditions can be copied and moved through drag & drop operation
using the following methods.
- If event condition was dropped using only the mouse, move event condition.
- If the event condition was dropped while pressing the Ctrl key, copy the event condition.
(4) Manipulation in event manager area
Event conditions can be set by clicking the <Add> button after placing the focus on the condition area to be set
and selecting an event icon.
Event setting content display
Select an event and click the <Open> button or double-click the event. The setting dialog box corresponding to
the selected event will be opened and the set contents of the event will be displayed.
Deletion
An event can be deleted by selecting the event and then clicking the <Remove / Delete> button or pressing
the Delete key.
Changing display mode and sorting
The display mode of and sorting in the event manager area can be selected by clicking the <Info...> button.
Area non-display
An area can be hidden by clicking the <Shrink<<< > button.
84
User’s Manual
U18604EJ1V0UM
CHAPTER 5 DEBUG FUNCTION
5.12.4
Number of enabled events for each event condition
Up to 256 conditions can be registered as event conditions or various event conditions.
One event condition or link event condition can be set for multiple types of events such as break and trace.
However, the number of event conditions that can be simultaneously set (enabled) is limited as follows.
Therefore, if the valid number is exceeded or if the used event conditions or event link conditions exceed the
maximum number that can be used simultaneously, it is necessary to disable the set various event conditions once
and then register them again. (Refer to "5.12.5 Managing events".)
Table 5-17 Number of Enabled Events for Each Event Condition
Event
Connected IE
Execution
[MINICUBE2]
Trace
1
10+6
Nx85ET
(RCU0+TEU+TRCU)
10*a
4*c
1*d
10+4
-
-
Nx85E901 (RCU0),
RCU1
2*e
1*f
2*e
-
-
With debug function
2*e
1*f
2*e
-
-
-
-
-
-
-
1
Timer
6*b
Without debug
function
*a
Break
10*a
[IECUBE]
[MINICUBE]
Access
Event
Link
7*g
2 before executions (usable only for breaks, address range not specifiable), 8 post-execution
events (4 when address range is specified, because 2 events are used for range specification)
*b
3 when address range is specified, because 2 events are used for range specification
*c
2 when address range is specified, because 2 events are used for range specification
*d
Use from Phase 1 to Phase 4
*e
Address range specification is not possible.
*f
Can be set only for Phase 1 and Phase 2
*g
Can not be set the event condition that range address is specified for Start Event or End Event
area. Can be set the event link condition that range address is specified.
User’s Manual
U18604EJ1V0UM
85
CHAPTER 5 DEBUG FUNCTION
5.12.5
Managing events
Managing events is done with the Event Manager.
The Event Manager allows display, enabling/disabling, and deletion of the Various Event Conditions.
Figure 5-24 Managing Events (the Event Manager)
(1) Event icon
Event icons consist of a mark and an event name indicating the type of event. The color of each event icon
indicates the setting status of that event.
Enable/disable is switched by clicking the mark part.
Table 5-18 Event Icon
Charac
ter
Color
Red
Black
Yellow
86
Mark
Meaning
E.L.
Indicates that the event condition or event link condition which is used for various
event conditions is enabled.
B.T.Ti.
Indicates that the Various Event Conditions is valid.
The various events occur when its condition is satisfied.
E.L.
Indicates that the event condition or event link condition which is used for various
event conditions is disabled.
B.T.Ti.
Indicates that the Various Event Conditions is invalid.
The various events do not occur even when its condition is satisfied.
E.L.
Indicates that the symbol specified for an event is held pending because it cannot
be recognized by the program currently loaded.
B.T.Ti.
Indicates that the Various Event Conditions is held pending.
The various events do not occur even when its condition is satisfied.
User’s Manual
U18604EJ1V0UM
CHAPTER 5 DEBUG FUNCTION
5.12.6
Cautions [MINICUBE] [MINICUBE2]
(1) Restrictions on event detection using bit manipulation instruction
- When the access size of an event is set to Byte and the event is set at an address other than a multiple of 4, if
the address is accessed by a bit manipulation instruction, an incorrect event may be detected or no event may
be detected.
- When the access size of an event is set to Bit and the event is set at an address other than a multiple of 4, if
the address is accessed by a bit manipulation instruction, an incorrect event may be detected or no event may
be detected.
(2) Restrictions exist in event detection during a misalign access.
- Restriction on write access event: No events can be detected in a misalign access.
- Restriction on read access event: Events can be detected in a misalign access by setting the read access
event as shown below.
Access Address
(Multiple of 4) + 0
Access Size in Program
Word
Access Size Specified with Event
Condition
Word
(Multiple of 4)+1
Byte
(Multiple of 4)+2
Half Word
(Multiple of 4)+3
Byte
(Multiple of 4)+0
Half Word
Half Word
(Multiple of 4)+1
Byte
(Multiple of 4)+2
Half Word
(Multiple of 4)+3
Byte
When the memory contents and a program shown below exist, describe the event conditions as shown below to
generate the access event.
[Memory contents]
+0 +1 +2 +3
3FF8000 11 22 33 44
[Program]
00FFE nop
01000 mov 0x3FF8001, gp
01006 nop
01008 ld.w 0x0[gp], r6
[Event condition]
Event Name :Evt0001(any)
Event Status :R
Access Size :Byte
Address
:0x3FF8001
Data
:0x22
User’s Manual
U18604EJ1V0UM
87
CHAPTER 5 DEBUG FUNCTION
(3) Events may not be detected with the event link function. The conditions differ for execution events and
access events.
Execution events
If the address of an execution event satisfies the conditions shown below, the second event cannot be
detected normally. This condition does not apply when the event at the second address is executed again
using a branch, etc.
- The interval between the first and second instruction is within 4 bytes (internal ROM, internal RAM)
- The first and second instruction are executed consecutively (target)
A detailed example for a program and the event setting is shown below. If events are set as shown in the
example, events with the event link function do not occur because the second execution event cannot be
detected.
[Example when events are set to program in target system]
00FFFFE nop
0100000 nop <---1st execution event
0100002 nop <---2nd execution event
0100004 nop
Access events
If the address of an access event satisfies the conditions shown below, the second event cannot be detected
normally. This condition does not apply when the event at the second address is executed again using a
branch, etc.
- The interval between the first and second instruction is within 4 bytes (accessing the internal ROM or internal
RAM)
- The interval between the first and second instruction is within 28 bytes (target)
A detailed example for a program and the event setting is shown below. If events are set as shown in the
example, events with the event link function do not occur because the second access event cannot be
detected.
[Example when events are set to program in internal ROM]
0100 mov 0x1000, gp
0106 ld.b 0x10[gp], r6 <----- 1st access event
010a nop
010c ld.b 0x12[gp], r7 <----- 2nd access event
0110 nop
88
User’s Manual
U18604EJ1V0UM
CHAPTER 5 DEBUG FUNCTION
5.13
RRM Function
This section explains the following items related to the RRM function.
- Real-time monitor function [IECUBE]
- Pseudo real-time monitor function (Break When Readout)
5.13.1
Real-time monitor function [IECUBE]
Table 5-19 shows the range of data that can be loaded using the real-time monitor function.
The variables and data allocated to this area can be displayed always in real time in the Watch Window and
Memory Window.
The sampling interval can be specified in the Extended Option Dialog Box.
Table 5-19 Areas for Which Sampling Can Be Performed with Real-Time Monitor Function
Connected IE
[IECUBE]
Sampling Range
Areas specified in the RRM Setting Dialog Box
Figure 5-25 RRM Setting Dialog Box
Figure 5-26 Specification of Interval for Sampling with Real-Time Monitor Function
User’s Manual
U18604EJ1V0UM
89
CHAPTER 5 DEBUG FUNCTION
Caution1:
RRM Function, Trace Function [IECUBE] and Coverage Measurement Function [IECUBE] are
functions that are used on a mutually exclusive basis. (Refer to "5.11.4 RRM function, trace
function, and coverage function used on a mutually exclusive basis".)
To switch between the three functions, go to the [Option] menu. [IECUBE]
Caution2:
Data that is overwritten with the DMM function during RUN and overwritten via DMA is not reflected
in the real-time RAM monitor area. In addition, output of the access monitor function is not displayed in color. [IECUBE]
Caution3:
The RRM function reads data bit-wise as hardware, illegal values may be displayed for variables of
two or more bytes in the Watch Window. [IECUBE]
5.13.2
Pseudo real-time monitor function (Break When Readout)
To read areas that cannot be read using the real-time monitor function, the pseudo real-time monitor function can
be used instead.
The memory area is read by software simulation while the pseudo real-time monitor function is executed, so
execution of the user program momentarily breaks upon a read.
The variables and data allocated to this area can be displayed in close to real-time in the Watch Window and
Memory Window.
Specify turning on/off of the pseudo real-time monitor function and the sampling range in the Extended Option
Dialog Box.
Figure 5-27 Specification of Pseudo Real-Time Monitor Function
Caution:
The pseudo real-time monitor function and software break function are exclusive of each other.
When the pseudo real-time monitor function is enabled (item other than "Off" is selected), no software break points can be set. All the valid software break points that have been set are also made
invalid.
90
User’s Manual
U18604EJ1V0UM
CHAPTER 5 DEBUG FUNCTION
5.14
DMM Function
DMM (Dynamic Memory Modification) is a function that rewrites the contents of the memory (RAM) in real-time
during user program execution.
The DMM Dialog Box is opened by clicking the <DMM... > button on the Memory Window, Register Window, or
IOR Window. Specify the DMM target address and data.
Caution1:
Since this function is implemented by software simulation, user program execution stops momentarily when rewriting to the memory (pseudo DMM function).
Caution2:
The DMM function and software break function are exclusive of each other.
When a valid software break point has been set, writing (DMM) during user program execution is
disabled (if attempted, an error results).
Figure 5-28 Modifying Memory Contents (DMM Dialog Box)
User’s Manual
U18604EJ1V0UM
91
CHAPTER 5 DEBUG FUNCTION
5.15
Load/Save Function
ID850QB allows saving and loading the following types of information as files. As a result, recovery of these
various types of information is possible.
- Debugging environment (project file)
- Window display information (view file)
- Window setting information (setting file)
Remark:
The simple window status can be maintained by selecting [Window] menu -> [Static]. (Refer to
"5.16.1 Active status and static status".)
5.15.1
Debugging environment (project file)
A project file (*.prj) is a file that records the debugging environment.
A project file is created when the debugging environment at a particular point in time is saved, and that
debugging environment can be restored by loading this file at a subsequent time.
Project files are loaded and saved in the Project File Save Dialog Box and Project File Load Dialog Box,
respectively. To load a project file at startup, press the <Project...> button in the Configuration Dialog Box.
The following contents are saved to the project file:
Table 5-20 Contents Saved to Project File
Window Name
Saved Contents
Configuration Dialog Box
All items (target device, clock setting, pin mask setting, mapping
information)
Main Window
Display position, tool bar/status bar/button display information,
execution mode information
Download Dialog Box
File information to be downloaded
Extended Option Dialog Box
Debugger Option Dialog Box
Fail-safe Break Dialog Box
Flash Option Dialog Box
Data Flash Option Dialog Box
RRM Setting Dialog Box
Set information
Assemble Window
Memory Window
Display information of window, display start address
Source Window
Stack Window
IOR Window
Local Variable Window
Trace View Window
Code Coverage Window
Event Manager
Console Window
Expansion Window
Register Window
Display information of window
92
User’s Manual
U18604EJ1V0UM
CHAPTER 5 DEBUG FUNCTION
Window Name
Saved Contents
Event Dialog Box
Event Link Dialog Box
Break Dialog Box
Trace Dialog Box
Timer Dialog Box
Display information of window, event information
List Window
Display position of window
Watch Window
Display information of windowNote, watch registration information
Add I/O Port Dialog Box
Added I/O port information
DMM Dialog Box
DMM information
Delay Count Dialog Box
Delay count value
Software Break Manager
Display information of window, software break information
Note:
The display status of members of a structure pointer, array pointer and so on, and radix for displaying individual member are not saved.
5.15.2
Window display information (view file)
A view file is a file that records window display information.
View files can be loaded and saved for each window.
When a view file is loaded, a reference window (Source Window in the static status) is displayed and the display
information at the time of saving is displayed.
View files are loaded and saved in the View File Load Dialog Box and View File Save Dialog Box, respectively.
Table 5-21 Type of View Files
File Type
Current Window Name, File Name
Source Text (*.svw)
Source WindowNote1
Assemble (*.dis)
Assemble WindowNote1
Memory (*.mem)
Memory Window
Watch (*.wch)
Watch Window
Register (*.rgw)
Register Window
I/O Register (*.ior)
IOR Window
Local Variable (*.loc)
Local Variable Window
Stack Trace (*.stk)
Stack Window
Trace (*.tvw)
Trace View Window
Code Coverage (*.csv)
Code Coverage Window
(Data is saved separately for the tab selected)
List (*.csv)
List Window
(Data is saved separately for the tab selected)
User’s Manual
U18604EJ1V0UM
93
CHAPTER 5 DEBUG FUNCTION
File Type
Current Window Name, File Name
Console (*.log)
Console Window
All (*.*)
All files
Source (*.c, *.s)
Source fileNote2
Text (*.txt)
Text file
Note1:
The mark for indicating the code coverage measurement result (executed/not yet executed) is
added to the contents of the displayed file. (Refer to "Table 5-15 Format of View of Locations for
which Coverage Measurement is Executed".) [IECUBE]
Note2:
5.15.3
The extension of the source file can be changed in the Extended Option Dialog Box.
Window setting information (setting file)
A setting file is a file that records the window setting information (watch data settings, peripheral I/O registers
settings, and event settings).
Setting files can be loaded and saved for each window.
When a setting file is loaded, the target window is displayed and the setting information that was saved is
restored.
Setting files are loaded and saved in the Environment Setting File Load Dialog Box and Environment Setting File
Save Dialog Box, respectively.
Table 5-22 Type of Setting Files
File Type
Current Window Name
Watch (*.wch)Note
Watch Window
I/O Register (*.ior)Note
IOR Window
Event (*.evn)
Event Manager
Note:
94
A variable value can not be loaded.
User’s Manual
U18604EJ1V0UM
CHAPTER 5 DEBUG FUNCTION
5.16
Functions Common to Each Window
The windows have the following common functions.
- Functions Common to Each Window
- Jump function
- Trace result with linking window [IECUBE]
- Drag & drop function
- Cautions
5.16.1
Active status and static status
Each of the Windows below has two statuses: The Active status and Static status.
- Source Window (that is displaying the source file to which symbol information is read)
- Assemble Window
- Memory Window
Only one window can be opened in the active status. However, because two or more windows in the static status
can be opened, the current status of the windows can be temporarily held.
Select this status by the [Window] menu.
(1) Active status
The display position and contents of the window in the active status are automatically updated in association
with the current PC value.
This window is also the jump destination of the Jump function. If this window is linked with the Trace View Window, the contents displayed in the active window are updated in association with the Trace View Window.
Only one window can be opened in the active status.
(2) Static status
The display position of the window in the static status does not move in association with the current PC value,
but the displayed contents are updated.
The static window is not used as the jump destination of the Jump function. In addition, it is not linked with the
Trace View Window.
If an active window is already open, the next window is opened in the static status.
Two or more static windows can be opened at the same time.
User’s Manual
U18604EJ1V0UM
95
CHAPTER 5 DEBUG FUNCTION
5.16.2
Jump function
This is a function that jumps to any of the Windows below from a line or address (a jump pointer) on which the
cursor is put. The Window to which the jump is made is displayed on the jump pointer.
- Source Window
- Assemble Window
- Memory Window
You can jump among the above windows, or from the Trace View Window, Stack Window, Event Manager and
Register Window to the above windows.
(1) Jump method
The jump method is as follows:
1)
Move the cursor to the line or address that is to be used as the jump pointer, on the window from which
jumping is possible (select an event icon on the Event Manager).
2) Select the following menu item to which execution is to jump from the [Jump] menu.
Caution:
If a program code does not exist on the line at the cursor position, the first address of the line with
a program code above or below that line is used as the jump pointer.
(2) Details of jump source address
The details of jump source address is as follows:
Table 5-23 Details of Jump Source Address
Target Window
Details of Jump Pointer
From the Register
Window
Registers selected
From the Memory
Window
Address at the cursor position
From the Event Manager
If the selected event icon is that of an event condition, an address condition is used
as the jump pointer.
96
If the address condition is set in point
Jump to specified address
If the address condition is set in range
Jump to lower address (point address
before the mask if a mask is specified)
If the address condition is set in bit
Jump to address at the bit position
User’s Manual
U18604EJ1V0UM
CHAPTER 5 DEBUG FUNCTION
Target Window
From the Stack Window
Details of Jump Pointer
A function at the cursor position that stack flame number indicates is used as the
jump pointer.
With current function
If the jump destination is the Source
Window
Jumps to the current PC line
Other than above
Jumps to the current PC address
With function other than current function
From the Trace View
Window
Jump to the Source
Window or Assemble
Window
If the jump destination is the Source
Window
Jump to the line that calls a nested
function.
Other than above
Jump to the address next to the instruction that calls a nested function.
Jump to the Memory Window
If the cursor position is at an access
address, access data, or access status
Access address
Other than above
Fetch address
Fetch address
User’s Manual
U18604EJ1V0UM
97
CHAPTER 5 DEBUG FUNCTION
5.16.3
Trace result with linking window
[IECUBE]
By linking the Trace View Window with each window (Source Window, Assemble Window or Memory Window),
the corresponding part can be displayed on the linked window, by using the address at the cursor position on the
Trace View Window as a pointer.
If the cursor is moved on the Trace View Window, the corresponding part on the linked window is highlighted or
indicated by the cursor position.
(1) Linking method
The linking method is as follows:
1) Set the Trace View Window as the current window.
2) Select [View] menu -> [Window Synchronize] to select a window to be linked.
3) Move the cursor to the line to be linked in the trace result display area of the Trace View Window.
4) Using the address of the line selected in 3) as a pointer, the corresponding part is highlighted (or indicated by
the cursor position) in the display area of the window selected in 2).
Remark:
The linking source address differs as follows depending on the cursor position in the trace result
display area if the Memory Window is linked.
- Access address, access data, access status -> Access address
- Others -> Fetch address
When the Source Window or Assemble Window is linked, the fetch address is always used as the
pointer.
5.16.4
Drag & drop function
Selected and highlighted line numbers, addresses, and text can be dragged and dropped in another window
using the following method.
1) Drag the selected line number, address, or text.
-> The shape of the mouse cursor changes from an arrow to "-".
2) Drop the selection in a window or area where it can be dropped.
-> The shape of the cursor changes from "-" to "OK" when the cursor is placed over a window or area where
the selection can be dropped.
In the window in which the line number of the address has been dropped, an operation is performed on the
dropped address or the address that is obtained from the dropped line number. For example, a variable can be
simply registered by dragging and dropping in the Watch Window such a variable located in the Source Window.
98
User’s Manual
U18604EJ1V0UM
CHAPTER 5 DEBUG FUNCTION
(1) Drag & drop details
The operation to be performed after dropping the line number or address differs, depending on the window or
area in which the line number or address has been dropped.
Table 5-24 Details of Drag & Drop Function (Line/Address)
Window/Area to Drop to
Operation After Drop
The Event Manager or the event
manager area in each various event
setting dialog box
Automatically creates an execution event condition by using the
dropped line number or address as an address condition.
Event condition names are automatically created as Evt00001,
Evt00002, and so on. A path count is not specified.
The address condition is set for the closest symbol in the format of
symbol name + offset value.
Condition setting area in each
various event setting dialog box
(other than address and data setting
areas)
Automatically creates an execution event condition by using the
dropped line number or address as an address condition.
The automatically created event condition is set in each condition
setting area in which the line number or address has been dropped.
Event condition names are automatically created as Evt00001,
Evt00002, and so on. A path count is not specified.
The address condition is set for the closest symbol in the format of
symbol name + offset value.
Condition setting area in each
various event setting dialog box
(address and data setting areas)
The text of the dropped line number or address is set in the area in
which the line number or address has been dropped.
The address condition is set for the closest symbol in the format of
symbol name + offset value.
Table 5-25 Details of Drag & Drop Function (Character String)
Window/Area to Drop to
The Event Manager or
the event manager area
in each various event
setting dialog box
Operation After Drop
If the dropped text can be converted as a symbol into an address value, an event
condition in the R/W status or Execute status is automatically created, using the
converted address value as an address condition.
Event condition names are automatically created as Evt00001, Evt00002, and so
on. A data condition and path count are not specified.
The address condition is set by the dropped text.
The relationship between the event condition to be created and the symbol is as
follows:
Symbols
Status
Variable
R/W
Function
Execute
Symbol in data section
R/W
Symbol in code section
Execute
Others
R/W
User’s Manual
U18604EJ1V0UM
99
CHAPTER 5 DEBUG FUNCTION
Window/Area to Drop to
Condition setting area in
each various event
setting dialog box (other
than address and data
setting areas)
Operation After Drop
If the dropped text can be converted as a symbol into an address value, an event
condition in the R/W status or Execute status is automatically created, using the
converted address value as an address condition.
The automatically created event condition is set in each condition setting area in
which the line number or address has been dropped.
Event condition names are automatically created as Evt00001, Evt00002, and so
on. A data condition and path count are not specified.
The address condition is set by the dropped text.
The relationship between the event condition to be created and the symbol is as
follows:
Symbols
Status
Variable
R/W
Function
Execute
Symbol in data section
R/W
Symbol in code section
Execute
Others
R/W
Condition setting area in
each various event
setting dialog box
(address and data setting
areas)
The dropped text is set in the area.
Watch Window
If the dropped text is recognizable as a symbol, the contents of the symbol are
displayed.
Remark:
Each various event setting dialog box are as follows.
- Event Dialog Box
- Event Link Dialog Box
- Break Dialog Box
- Trace Dialog Box
- Timer Dialog Box
100
User’s Manual
U18604EJ1V0UM
CHAPTER 5 DEBUG FUNCTION
5.16.5
Cautions
(1) If the width of the display area is narrow, the display may become corrupted. In this case, increase the width
of the window.
(2) Redrawing may not successfully be performed in a window with a <Refresh> button when the cursor position
is changed while the window is active. Click the <Refresh> button to perform redrawing.
(3) The help that is opened using the F1 key is the help corresponding to the window on which the cursor is
placed. Consequently, because the cursor cannot be placed on the Trace View Window in which no trace
results are displayed, such as immediately after startup, the help may not open even if the F1 key is
pressed. In this case, open the help by selecting [Current Window Help] from the [Help] menu.
(4) Do not select [Slowmotion] from the [Run] menu during Go & Go execution. [Slowmotion] on the [Run] menu
is usually dimmed during Go & Go execution, but there is a moment when it can be selected, so if
[Slowmotion] is selected at this time, the program will not be able to be stopped even if [Stop] is selected
from the [Run] menu (or the STOP button is clicked).
(5) If for some reason or other the application switches while event icons are in the process of being dragged,
the icons will no longer be able to be dropped.
Use the ESC key to escape from drag, then reattempt the drag.
(6) The 400th character and those that follow cannot be displayed if one line in a window contains more than
400 characters (ANK characters).
(7) Arrays with five dimensions or more are not supported.
(8) The Search menu of each window is dimmed during program execution.
(9) Big endian is not supported.
User’s Manual
U18604EJ1V0UM
101
CHAPTER 6 WINDOW REFERENCE
CHAPTER 6 WINDOW REFERENCE
This chapter explains in detail the functions of the windows and dialog boxes of ID850QB.
- Window List
- Explanation of Windows
6.1
Window List
The list is the windows of the ID850QB.
Table 6-1 Window List
Window Name
Contents
Main Window
This window is displayed first, when the ID850QB is started.
It controls execution of the user program. Various windows are
opened from this window.
Configuration Dialog Box
Displays and sets the ID850QB operation environment.
Extended Option Dialog Box
Displays and sets the extended options of the ID850QB.
Fail-safe Break Dialog Box
Sets the fail-safe breaks.
RRM Setting Dialog Box
Sets the RRM sampling range.
Flash Option Dialog Box
Sets the flash self programming emulation. [IECUBE]
Data Flash Option Dialog Box
Sets the data flash error emulation. [IECUBE]
Debugger Option Dialog Box
Displays and sets other options.
Project File Save Dialog Box
Saves the current debug environment to project file.
Project File Load Dialog Box
Loads the debug environment.
Download Dialog Box
Downloads.
Upload Dialog Box
Uploads.
Load Module List Dialog Box
Lists the names of the downloaded load module files.
Source Window
Displays a source file and text file.
Source Search Dialog Box
Searches in the Source Window.
Source Text Move Dialog Box
Specifies a file to be displayed in the Source Window and the
position from which displaying the file is to be started.
Assemble Window
Disassembles the program and executes line assembly.
Assemble Search Dialog Box
Searches in the Assemble Window.
Address Move Dialog Box
Specifies the start address to display the contents of the Memory
Window, Assemble Window or IOR Window.
102
User’s Manual
U18604EJ1V0UM
CHAPTER 6 WINDOW REFERENCE
Window Name
Contents
Symbol To Address Dialog Box
Displays the address of the specified variable or function, or the
value of the specified symbol.
List Window
Lists functions, variables, symbols, sections, and interrupt
requests.
Watch Window
Displays and changes specified watch data.
Quick Watch Dialog Box
Displays temporarily specified watch data.
Add Watch Dialog Box
Registers watch data todisplay in the Watch Window.
Change Watch Dialog Box
Changes watch data todisplay in the Watch Window.
Local Variable Window
Displays and changes the local variable in the current function.
Stack Window
Displays the current stack contents.
Memory Window
Display the contents of memory.
Memory Search Dialog Box
Searches in the Memory Window.
Memory Fill Dialog Box
Fills the memory contents with specified data.
Memory Copy Dialog Box
Copies the memory.
Memory Compare Dialog Box
Compares the memory.
Memory Compare Result Dialog Box
Displays the results of comparing the memory.
DMM Dialog Box
Sets addresses and data subject to DMM.
Register Window
Displays the contents of registers.
Register Select Dialog Box
Selects registers to be displayed in the Register Window.
IOR Window
Displays the contents of IOR.
IOR Select Dialog Box
Selects peripheral I/O registers and I/O ports to be displayed in the
IOR Window.
Add I/O Port Dialog Box
Registers an I/O port to be displayed in the IOR Window.
Timer Dialog Box
Registers and sets timer event conditions, and displays execution
time measurement result. [IECUBE]
Timer Result Dialog Box
Displays execution time measurement results. [IECUBE]
Trace View Window
Displays trace results. [IECUBE]
Trace Search Dialog Box
Searches trace data. [IECUBE]
Trace Data Select Dialog Box
Selects items to be displayed in the Trace View Window. [IECUBE]
Trace Move Dialog Box
Specifies the start address to display the contents of the Trace
View Window. [IECUBE]
Trace Dialog Box
Registers and sets trace event conditions. [IECUBE]
Delay Count Dialog Box
Sets the delay count of a delay trigger trace event. [IECUBE]
Code Coverage Window
Display of code coverage results. [IECUBE]
Coverage-Address Dialog Box
Selects the code coverage measurement range. [IECUBE]
User’s Manual
U18604EJ1V0UM
103
CHAPTER 6 WINDOW REFERENCE
Window Name
Contents
Coverage-Color Dialog Box
Selects color to distinguish the coverage of executed code.
[IECUBE]
Software Break Manager
Display, enable or disable, and delete software breaks.
Event Manager
Displays, enables/disables, and deletes each event condition.
Event Dialog Box
Registers event conditions.
Event Link Dialog Box
Registers event link conditions.
Break Dialog Box
Registers and sets break event conditions.
View File Save Dialog Box
Saves the display information of the current window to a view file.
View File Load Dialog Box
Loads the view file of each window.
Environment Setting File Save Dialog Box
Saves the setting information of the current window to a setting file.
Environment Setting File Load Dialog Box
Loads the setting file of each window.
Reset Debugger Dialog Box
Initializes the ID850QB,CPU, and symbol information.
Exit Debugger Dialog Box
Terminate the ID850QB.
About Dialog Box
Displays the version of the ID850QB.
Console Window
Inputs commands.
Browse Dialog Box
Selects the file to be set.
104
User’s Manual
U18604EJ1V0UM
CHAPTER 6 WINDOW REFERENCE
6.2
Explanation of Windows
This section explains each window or dialog box as follows:
Window Name / Dialog Box Name
Briefly explains the function of the window or dialog box and points to be noted.
If an invalid window/dialog box exists due to a connected IE, the name of the valid connected IE is indicated at
the lower right of the window/dialog box name.
In addition, the display image of the window or dialog box is also illustrated.
Items of related operation are also explained.
Opening
Explains how to open the window or dialog box.
Explanation of Each Area
Explains items to be set to or displayed in each area of the window or dialog box.
Context Menu
Explains the context menu that is displayed in the window when the right mouse button is clicked. From the
context menu, convenient functions often used in this window can be selected with a single action (window only).
Related operations
Explains the operation of a window or dialog box related to this window or dialog box.
User’s Manual
U18604EJ1V0UM
105
CHAPTER 6 WINDOW REFERENCE
Main Window
This window is automatically opened when the ID850QB is started up and initialized.
In the ID850QB, other windows are manipulated from this window. (Refer to "6.1 Window List".).
Execution of the user program is controlled in this window.
Execution of the user program is controlled in the following three modes:
- Source mode (Debugs the user program at the source level.)
- Instruction mode (Debugs the user program at the instruction level.)
- Auto mode (Automatically selects the source mode or instruction mode.) (default)
Figure 6-1 Main Window
Menu bar
Window display area
106
Tool bar
Status bar
User’s Manual
U18604EJ1V0UM
CHAPTER 6 WINDOW REFERENCE
Menu bar
(1) [File] menu
(2) [Edit] menu
(3) [View] menu
(4) [Option] menu
(5) [Run] menu
(6) [Event] menu
(7) [Browse] menu
(8) [Jump] menu
(9) [Window] menu
(10) [Help] menu
(1) [File] menu
Open...
Loads a view file, source file, or text file. Opens the View File Load Dialog Box.
The operation differs depending on the extension of the file selected in the dialog
box.
Save As...
Saves the contents displayed on the current window to the file whose name is
specified.
Opens the View File Save Dialog Box.
Close
Closes the current window.
Download...
Downloads a file. Opens the Download Dialog Box.
Load Module...
Lists the names of the files that have been downloaded.
Opens the Load Module List Dialog Box.
Upload...
Uploads a program. Opens the Upload Dialog Box.
Project
Manipulates a project file.
Open...
Opens a project file.
Opens the Project File Load Dialog Box.
Save
Overwrites the current status to the project file currently being read to the
ID850QB.
Save As...
Saves the current status to a specified project file.
Opens the Project File Save Dialog Box.
Environment
Manipulates a setting file.
Open...
Opens a setting file.
Opens the Environment Setting File Load Dialog Box.
Save As...
Saves the setting in the current window to the setting file.
Opens the Environment Setting File Save Dialog Box.
Debugger Reset...
Initializes the CPU, symbols, and ID850QB.
Opens the Reset Debugger Dialog Box.
Exit
Terminate the ID850QB. (Refer to "3.5 Terminating".)
Opens the Exit Debugger Dialog Box.
(Open file)
Lists the names of the files opened.
User’s Manual
U18604EJ1V0UM
107
CHAPTER 6 WINDOW REFERENCE
(2) [Edit] menu
Cut
Cuts a selected character string and saves it to the clipboard buffer.
Copy
Copies a selected character string and saves it to the clipboard buffer.
Paste
Pastes the contents of the clipboard buffer to the text cursor position.
Write in
Writes the modified contents to the target.
Restore
Cancels the modification.
Memory
Manipulates the memory contents.
Fill...
Fills the memory contents with specified codes.
Opens the Memory Fill Dialog Box.
Copy...
Copies the memory. Opens the Memory Copy Dialog Box.
Compare...
Compares the memory. Opens the Memory Compare Dialog Box.
DMM...
Rewrites the memory contents in real time during user program execution.Opens
the DMM Dialog Box.
Edit Source
Opens the source file displayed in the active Source Window with the editor
specified by the PM+ when the PM+ runs.
(3) [View] menu
The [View] menu contains common parts as well as dedicated parts added according to the active window. For
details about the dedicated parts, refer to the description of each window.
(a) Common items
Search...
Performs a search.
Opens the search dialog box corresponding to the current window.
Same operation as the <Search> button.
Move...
Moves the display position.
Opens the specification dialog box corresponding to the current window.
Quick Watch...
Temporarily displays the contents of the specified data.
Opens the Quick Watch Dialog Box.
Add Watch...
Registers the specified data to the Watch window.
Opens the Add Watch Dialog Box.
View Watch
Adds the selected data to the Watch window.
If the data is a symbol, it is added in accordance with the setting of the
Debugger Option Dialog Box.
Change Watch...
Changes the data on the line selected by the Watch window.
Opens the Change Watch Dialog Box.
This menu is valid only when a variable is selected in Watch Window.
Delete Watch
Deletes the selected watch point from the Watch Window.
This menu is valid only when a variable is selected in Watch Window.
Symbol...
Displays the address of the specified variable or function, or the value of the
specified symbol.
Opens the Symbol To Address Dialog Box.
108
User’s Manual
U18604EJ1V0UM
CHAPTER 6 WINDOW REFERENCE
(4) [Option] menu
Tool Bar
Switches whether to display the tool bar.
Status Bar
Switch whether to display the tool bar.
Button
Switch whether to display the buttons on each window.
Source Mode
Executes step execution at the source level (in line units).
Instruction Mode
Executes step execution at the instruction level (in instruction units).
Auto Mode
Automatically selects step execution at the source level or step execution at the
instruction level (default).
Step execution is performed at the source level (in a mode other than mixed
display mode) if Source Window is active. It is performed at the instruction level
if Assemble Window is active. If neither window is active, step execution is
performed at the source level.
Configuration...
Sets the environment. Opens the Configuration Dialog Box.
Extended Option...
Sets extended options. Opens the Extended Option Dialog Box.
RRM Setting...
[IECUBE]
Sets the sampling range for RRM function.
Opens the RRM Setting Dialog Box.
Flash Option...
[IECUBE]
This dialog box is used to make the flash self programming emulation settings.
Opens the Flash Option Dialog Box.
Data Flash Option...
[IECUBE]
This dialog box is used to make the data flash error emulation settings.
Opens the Data Flash Option Dialog Box.
Debugger Option...
Sets ID850QB options. Opens the Debugger Option Dialog Box.
Add I/O Port...
Adds user-defined I/O ports. Opens the Add I/O Port Dialog Box.
Trace Clear
[IECUBE]
Clears the trace data.
This item is displayed only when Trace View Window is active.
Coverage
[IECUBE]
Opens the following dialog boxes related to coverage measurement.
Clear
[IECUBE]
Clears the coverage measurement results.
Select...
[IECUBE]
Selects the coverage measurement range as a space of 1 MB or more.
Opens the Coverage-Address Dialog Box.
RRM Function
[IECUBE]
Select the RRM function. (Refer to "5.13 RRM Function".)(default)
This function is used on a mutually exclusive basis with the Trace function and
coverage function. (Refer to "5.11.4 RRM function, trace function, and coverage
function used on a mutually exclusive basis".)
When this is selected, the following menu cannot be selected.
[Trace start/Trace end], [Uncond. Trace ON/Cond.Trace ON], [Tracer Control
Mode]
Trace Function
[IECUBE]
Trace function is selected. (Refer to "5.10 Trace Function [IECUBE]".)
This function is used on a mutually exclusive basis with the RRM function and
coverage function. (Refer to "5.11.4 RRM function, trace function, and coverage
function used on a mutually exclusive basis".)
When this is selected, the following menu cannot be selected.
[RRM Setting...]
User’s Manual
U18604EJ1V0UM
109
CHAPTER 6 WINDOW REFERENCE
Coverage function
[IECUBE]
Coverage function is selected. (Refer to "5.11 Coverage Measurement Function
[IECUBE]".)
This function is used on a mutually exclusive basis with the RRM function and
trace function. (Refer to "5.11.4 RRM function, trace function, and coverage
function used on a mutually exclusive basis".)
This function is disabled when no coverage boards are incorporated.
When this is selected, the following menu cannot be selected.
[Trace start/Trace end], [Uncond. Trace ON/Cond.Trace ON], [Tracer Control
Mode], [RRM Setting...]
(5) [Run] menu
Restart
Resets the CPU and executes the program.
Same operation as this button.
Stop
Forcibly stops program execution.
Same operation as this button.
Go
Executes the program from the current PC.
Same operation as this button.
Ignore break points and Go
Ignores break points being set, and executes the program. (Both hard and soft.)
Same operation as this button.
Return Out
The user program is executed until execution returns
Same operation as this button.
Note: This command is used for a function described in C language.
Step In
Executes the instructions in the program one by one (step execution).
If a function or subroutine is called, its instructions are executed one by one.
Same operation as this button.
Next Over
Executes the instructions in the program one by one (Next step execution).
If a function or subroutine is called, its instructions are not executed on a stepby-step basis.
Same operation as this button.
Start From Here
Executes the program from the cursor position on Source Window or Assemble
Window.
Come Here
Executes the program from the current PC to the cursor position in the Source
Window or the Assemble Window.
Go & Go
Continues executing the program.
If a break occurs because a break condition is satisfied, the window is updated
and the program is executed again.
Same operation as clicking this button each time a break has occurred.
Slowmotion
Continues step execution.
Each time step execution has been performed, the window is updated and then
step execution is performed again.
Same operation as clicking this button each time a break has occurred.
CPU Reset
Resets the CPU.
Same operation as this button.
110
User’s Manual
U18604EJ1V0UM
CHAPTER 6 WINDOW REFERENCE
Change PC
Sets the address at the cursor position in the Source Window or Assemble
Window to the PC.
Break Point
Sets or deletes a breakpoint at the cursor position in the Source Window or
Assemble Window.
Software Break Point
Sets or deletes a software breakpoint at the cursor position in the Source
Window or Assemble Window.
Delete All Breakpoints
Deletes all the set break events.
Uncond. Trace ON
[IECUBE]
Validates unconditional trace so that trace can always be executed during
program execution. (default)
At this time, the set trace event conditions are ignored.
The trace mode cannot be changed while the tracer is activated.
Cond. Trace ON
[IECUBE]
Validates conditional trace and traces in accordance with the trace event
condition during program execution.
The trace mode cannot be changed while the tracer is activated.
Tracer Control Mode
[IECUBE]
Sets trace control mode.
Non Stop
Goes around the trace memory and overwrites data from the oldest frame
(default).
Full Stop
Goes around the trace memory and then stops the tracer.
Full Break
Goes around the trace memory and then stops the tracer and program
execution
Delay Trigger Stop
Traces data by the number of delay count frames and stops the tracer when a
delay trigger event has occurred.
Timer Start/Timer Stop
[IECUBE]
Starts timer measurement when it is stopped, or stops it when it is in progress.
This item is invalid if the program is not being executed and if a timer event is
not used.Immediately after program execution has been started, timer
measurement is in progress.
Tracer Start/Tracer Stop
[IECUBE]
Starts the tracer when it is stopped, or stops it when it is in progress.
This item is invalid if the program is not being executed.Immediately after
program execution has been started, the tracer is executed.
(6) [Event] menu
Event Manager
Manages various event conditions. Opens the Event Manager.
Same operation as this button.
Software Break Manager
Manages software break event conditions.
Opens the Software Break Manager.
Event...
Registers an event condition. Opens the Event Dialog Box.
Same operation as this button.
Event Link...
Registers an event link condition. Opens the Event Link Dialog Box.
Break...
Registers and sets a break event condition. Opens the Break Dialog Box.
Same operation as this button.
Trace...
[IECUBE]
Registers and sets a trace event condition. Opens the Trace Dialog Box.
Same operation as this button.
User’s Manual
U18604EJ1V0UM
111
CHAPTER 6 WINDOW REFERENCE
Timer...
[IECUBE]
Registers and sets a timer event condition. Opens the Timer Dialog Box.
Delay Count...
[IECUBE]
Sets the delay count.
Opens the Delay Count Dialog Box.
Same operation as this button.
(7) [Browse] menu
List
Lists functions, variables, symbols, sections, and interrupt requests.
Opens the List Window.
Source Text
Displays a source text. Opens the Source Window.
If there is this window already open in the active status, it is opened in the static
status.
Same operation as this button.
Assemble
Displays the disassemble results. Opens the Assemble Window.
If there is this window already open in the active status, it is opened in the static
status.
Same operation as this button.
Memory
Displays the contents of the memory. Opens the Memory Window.
If there is this window already open in the active status, it is opened in the static
status.
Same operation as this button.
Watch
Displays the watch contents. Opens the Watch Window.
Same operation as this button.
Register
Displays the register contents. Opens the Register Window.
Same operation as this button.
I/O Register
Displays the contents of the Peripheral I/O registers. Opens the IOR Window.
Same operation as this button.
Local Variable
Displays the local variable. Opens the Local Variable Window.
Same operation as this button.
Stack Trace
Displays the stack trace results. Opens the Stack Window.
Same operation as this button.
Trace
[IECUBE]
Displays the trace results. Opens the Trace View Window.
Code Coverage
[IECUBE]
Displays code coverage measurement results.
Opens the Code Coverage Window.
Same operation as this button.
Same operation as this button.
Console
Opens the Console Window.
Others
Displays other windows. (Refer to "APPENDIX A EXPANSION WINDOW".)
Displays a user-defined window list. Displays a name of *.tcl file in the
bin\idtcl\tools\ folder (except the extension)
112
User’s Manual
U18604EJ1V0UM
CHAPTER 6 WINDOW REFERENCE
(8) [Jump] menu
Source Text
Displays the corresponding source text and source line, using the data value
selected in the current window as the jump destination address.
If no line information exists at the jump destination address, however, you
cannot jump.
Opens the Source Window.
If the Source Window in active is open, that window is displayed in the forefront
(so that it can be manipulated).
Assemble
Disassembles and displays the results from the jump destination address
specified by the data value selected in the current window.
Opens the Assemble Window.
If the Assemble Window in active is open, that window is displayed in the
forefront (so that it can be manipulated).
Memory
Displays the memory contents from the jump destination address specified by
the data value selected in the current window.
Opens the Memory Window.
If the Memory Window in active is open, that window is displayed in the
forefront (so that it can be manipulated).
(9) [Window] menu
New Window
Opens a new window displaying the same contents as those of the current
window.This menu is valid only when the current window is Source Window,
Assemble Window or Memory Window.
Cascade
Cascade display of the windows in the Main window.
Tile
Cascade display of the windows in the Main window.
Arrange Icons
Rearranges the icons in the Main window.
Close All
Closes all windows, except the Main window.
Refresh
Updates the contents of the window with the latest data.
Active
Sets the window in the active status.
Static
Sets the window in the static status.
(Open Window)
Lists the windows that are open.
The window with the check mark shown on the side of the figure is the current
window. By selecting a window name, the selected window is used as the
current window.
(10) [Help] menu
ID850QB Help
Displays the help.
Command Reference
Opens the Help window of COMMAND REFERENCE.
Main Window
Displays the help of the Main window.
Current Window
Displays the help of the current window.
About...
Displays the version of the ID850QB.
Opens the About Dialog Box.
User’s Manual
U18604EJ1V0UM
113
CHAPTER 6 WINDOW REFERENCE
Tool bar
(1) Meaning of each button
(2) Operation of tool bar
(1) Meaning of each button
The meaning of each button on the toolbar is as follows.When the mouse cursor is placed on a button of the
toolbar, a tool hint pops up several seconds later.
Stop
Stops execution of the user program.
Same function as [Run] menu -> [Stop].
ReGo
Resets the CPU and executes the user program.
Same function as [Run] menu - > [Restart].
Go
Executes the user program from the current PC without resetting the CPU.
Same function as [Run] menu -> [Go].
Go
Ignores break points being set, and executes the user program.
Same function as [Run] menu -> [Ignore break points and Go].
Ret
Step
Over
Step execution (executes instructions in the program one by one.)
If a function or subroutine is called, its instructions are executed one by one.
Same function as [Run] menu -> [Step In].
Next step execution (executes the program, assuming a function/call statement as one step.)
If a function or subroutine is called, its instructions are not executed on a step-by-step basis.
Same function as [Run] menu -> [Next Over].
Res
Resets the CPU.
Same function as [Run] menu -> [CPU Reset].
Open
Opens the View File Load Dialog Box.
Same function as [File] menu -> [Open...].
Load
Opens the Download Dialog Box.
Same function as [File] menu -> [Download...].
Proj
Opens the Project File Load Dialog Box.
Same function as [File] menu -> [Project] -> [Open...].
Src
Displays the source text. Opens the Source Window.
Same function as [Browse] menu -> [Source Text].
Asm
Displays the disassemble results. Opens the Assemble Window.
Same function as [Browse] menu -> [Assemble].
Mem
Displays the contents of the memory. Opens the Memory Window.
Same function as [Browse] menu -> [Memory].
Wch
Reg
114
The user program is executed until execution returns
Same function as [Run] menu - [Return Out].
Note: This command is used for a function described in C language.
Displays the watch contents. Opens the Watch Window.
Same function as [Browse] menu -> [Watch].
Displays the register contents. Opens the Register Window.
Same function as [Browse] menu -> [Register].
User’s Manual
U18604EJ1V0UM
CHAPTER 6 WINDOW REFERENCE
IOR
Displays the contents of the peripheral I/O registers. Opens the IOR Window.
Same function as [Browse] menu -> [I/O Register].
Loc
Displays the local variable contents. Opens the Local Variable Window.
Same function as [Browse] menu -> [Local Variable].
Stk
Displays the stack trace results. Opens the Stack Window.
Same function as [Browse] menu -> [Stack Trace].
TrW
[IECUBE]
Cov
[IECUBE]
Displays the trace results. Opens the Trace View Window.
Same function as [Browse] menu -> [Trace].
Displays code coverage measurement results. Opens the Code Coverage Window.
Same function as [Browse] menu -> [Code Coverage].
Mgr
Opens the Event Manager.
Same function as [Event] menu -> [Event Manager...].
Evn
Registers and sets events. Opens the Event Dialog Box.
Same function as [Event] menu -> [Event...].
Brk
Registers and sets break events. Opens the Break Dialog Box.
Same function as [Event] menu -> [Break...].
Trc
[IECUBE]
Tim
[IECUBE]
Registers and sets trace events. Opens the Trace Dialog Box.
Same function as [Event] menu -> [Trace...].
Registers and sets timer events. Opens the Timer Dialog Box.
Same function as [Event] menu -> [Timer...].
(2) Operation of tool bar
Whether the toolbar is displayed or not can be specified by selecting [Option] menu -> [Tool Bar].
This toolbar can be displayed in the following two modes. The modes are selected in the Debugger Option
Dialog Box.
Figure 6-2 Tool Bar (Picture Only)
Figure 6-3 Tool Bar (Picture and Text)
Window display area
This area displays various debug windows.
The displayed window can be changed in size or an icon can be created in this area.
User’s Manual
U18604EJ1V0UM
115
CHAPTER 6 WINDOW REFERENCE
Status bar
The status bar displays the status of the ID850QB and in-circuit emulator.
While the user program is being executed, the status bar is displayed in red.
Whether the toolbar is displayed or not can be specified by selecting [Option] menu -> [Status Bar].
Remark:
If the screen resolution is low (800 - 600, etc.), all the statuses may not be displayed on the status
bar.
Figure 6-4 Status Bar
(1) Program name
Displays the program file name indicated by the PC value.
Source name
Displays the source file name indicated by the PC value.
Line number
Displays the line number indicated by the PC value.
(2) Function name
Displays the function name indicated by the PC value.
(3) PC value
Displays the current PC value.
(4) CPU status
Refer to "Table 6-2 CPU Status".
(5) IE status
Refer to "Table 6-3 IE Status".
(If there are two or more the statuses, they delimited with '|' and displayed.)
(6) Break Cause
Refer to "Table 6-4 Break Cause".
(7) STEP mode
Displays the step execution mode.
Displays that the following modes are selected from the [Option] menu:
SRC:............. Source mode
INST:............. Instruction mode
AUTO: .......... Automatic mode
(8) Key input mode
Displays the key input mode.
INS: .............. Insertion mode
OVR:............. Overwrite mode
The Memory Window is fixed to OVR mode.
Table 6-2 CPU Status
Display
Meaning
HALT
Halt mode
STOP/IDLE
Software stop mode, hardware stop mode, Idle mode
HOLD
Bus hold mode
WAIT
Wait mode
RESET
Reset mode
POW OFF
Power is not supplied to the target
116
User’s Manual
U18604EJ1V0UM
CHAPTER 6 WINDOW REFERENCE
Table 6-3 IE Status
Display
Meaning
RUN
User program execution in progress (the color of the status bar changes).
STEP
Step execution in progress.
TRC
Tracer operating [IECUBE]
TIM
Timer operating [IECUBE]
COV
Coverage operating [IECUBE]
BREAK
Break occurring.
Time
Displays the result of measuring the time from the start of user program execution
to the occurrence of break. (Run-Break time)Note
TIMER OVERFLOW
Measurement result overflowed.
Note:
It is possible to measure for 20 ns or more until 195.2 hours. (4K division) [IECUBE]
It is possible to measure for 200 ns or more until 7 minutes. (DCK=10MHz) [MINICUBE]
It is possible to measure for 100 us or more until 100 hours. [MINICUBE2]
Caution:
If the target power supply is turned off during a break when using MINICUBE and N-Wire CARD,
RUN state is displayed.
This state is released when the target power supply is turned on.
This is not an abnormal operation.
Do not turn off the target power supply during debugging using MINICUBE2.
Table 6-4 Break Cause
Display
Meaning
Manual Break
Forced break
Temporary Break
Temporary break
Software Break
Software break
Trace Full Break
Break due to trace full [IECUBE]
Non Map Break
Non-mapped area is accessed. [IECUBE]
Write Protect
An attempt has been made to write to a write-protected area. [IECUBE]
IOR Illegal
An illegal access is made to a peripheral I/O register. [IECUBE]
Timer Over Break
Execution time-over detected [IECUBE]
Flash Macro Service
Flash macro service in progress [MINICUBE]
IRAM Write Protect (xxx xxx)
During break, performed verify check of IRAM guarded area and rewrote value.
[IECUBE] xxx xxx indicates the relevant address and data (in case of multiple
items, only first item is displayed).
Illegal Opcode Trap
Break due to illegal opcode trap [IECUBE]
Event Break "Event name or
Event link name"
Stopped due to event cause of displayed event name or event link name.
User’s Manual
U18604EJ1V0UM
117
CHAPTER 6 WINDOW REFERENCE
Configuration Dialog Box
This dialog box is used to display and set the ID850QB operation environment. (Refer to "5.1 Setting Debugging
Environment".)
This dialog box is automatically displayed after the ID850QB is started up.
However, no setting is required to read a project as the results of reading the project file are reflected in this
dialog box. (Refer to "5.15.1 Debugging environment (project file)".)
Caution:
Devices incorporating a pin to switch ROMless mode 0 and 1, and single-chip mode 0 and 1 are
not supported. [MINICUBE] [MINICUBE2]
Figure 6-5 Configuration Dialog Box
[IECUBE]
(3)
(1)
(14)
(2)
(5)
(4)
(10)
(6)
(11)
(7)
(12)
(13)
118
User’s Manual
U18604EJ1V0UM
CHAPTER 6 WINDOW REFERENCE
[MINICUBE]
(8)
[MINICUBE2]
(9)
- Opening
- Explanation of Each Area
User’s Manual
U18604EJ1V0UM
119
CHAPTER 6 WINDOW REFERENCE
Opening
(Automatically when the ID850QB is started up)
Select [Option] -> [Configuration...] from the menu bar.
Explanation of Each Area
(1) Chip
This area is used to select the chip name. A chip name is selected from the drop-down list.
On the drop-down list, only the chip names registered to the registry from the device file installer are displayed.
This area can be specified only when the debugger is started up.
Caution1:
The device selected at the ID850QB activation cannot be changed after activation. The device
specified by the project file is not used even if the project file of a device different from the target
device is downloaded.
Caution2:
The error message " F0c2e : There is no response from flash macro service." may be displayed in
the following cases.
- If the ID850QB is started up after selecting a device file that does not correspond to the actual
device.
- If the ID850QB is started up after selecting a device file that does not correspond to the actual
device, and a load module is downloaded to the flash memory.
There is a possibility that the device connected to the N-Wire CARD and the device selected by
the ID850QB do not match. Check the device specified in the Configuration dialog box.
[MINICUBE] [MINICUBE2]
Remark:
By default, the type selected at the previous startup is displayed, but if that type is not registered,
the first type registered is displayed.
120
User’s Manual
U18604EJ1V0UM
CHAPTER 6 WINDOW REFERENCE
(2) Internal Memory
This area is used to set the each size of the internal memory of the CPU. It is selected from the drop-down list, or
input from the key board.
The default size is obtained from the device file through selection in "Chip" , and displayed (value with '*').
This area is not available when using [MINICUBE2] or [MINICUBE]. The value is fixed to the one defined in
the device file.
Area
Meaning
Settable Range
ROM:
Sets the Internal ROM size
0, 8, 32, 64, 128, 256, 512, 1024 (KB)
RAM:
Sets the Internal RAM size
4096, 12288, 28672, 61440 (Bytes)
Data Flash:
Displays the data flash memory (when using a device incorporating the data
flash memory).
To use the data flash memory area, select the "Use Data Flash:" checkbox.
When using the V850ES microcontrollers, specify Chip Select that is used for
mapping of the data flash memory, in the "Chip Select area".
Use Data Flash:
Chip Select area
Remark:
When using a device with VSB Flash or VSB RAM, each area is added to the default internal ROM
size and internal RAM size.
When using the V850E/Dx3, for example, the maximum internal ROM size is shown as 2 MB, and
the maximum internal RAM size is shown as 84 KB.
If the internal RAM area and the peripheral I/O register area become contiguous as a result of changing the
internal RAM size, fix the end address and then change the start address of the internal RAM size (see the table
below). [IECUBE]
64M device
256M device
Internal RAM size (bytes)
Internal RAM start address
4096
0x3ffe000
12288
0x3ffc000
28672
0x3ff8000
61440
0x3ff0000
Internal RAM size (bytes)
Internal RAM start address
4096
0xfffe000
12288
0xfffc000
28672
0xfff8000
61440
0xffff000
User’s Manual
U18604EJ1V0UM
121
CHAPTER 6 WINDOW REFERENCE
If there is a space between the internal RAM and the peripheral I/O register area, fix the internal RAM start
address and then change the end address of the internal RAM size (see the figure below). If the internal RAM area
overlaps the peripheral I/O register area, fix the internal RAM end address and then change the start address.
(3) Clock
Settings related to the main clock and subclock are performed here.
Main OSC (MHz)
Specifies a frequency before the main clock is multiplied.
A frequency can be selected from the drop-down list (5.000, 8.000, 13.500, or
18.000) or directory input.
Multiply rate
Specifies the main clock multiplication rate.
This value can be selected from the drop-down list (1 to 10), or directly input.
Sub OSC (KHz)
Specifies the subclock frequency (setting this parameter is disabled for types that
do not have a subclock).
A frequency can be selected from the drop-down list or directory input.
(4) Programmable I/O Area
This area is used to specify use of the programmable I/O area and the start address.
The start address of the programmable I/O area can be specified, only if the device selected by "Chip" supports
the programmable I/O area. The start address of the programmable I/O area can be input by selecting the
checkbox when the programmable I/O area is used. The address is aligned to 16 KB.
Remark:
In the case of a device with an extended I/O area with fixed addresses, the device selected by
"Chip", Setting of this area is performed automatically.
122
User’s Manual
U18604EJ1V0UM
CHAPTER 6 WINDOW REFERENCE
(5) ID Code [MINICUBE] [MINICUBE2]
This area is used to input the ID code to be used when the code on the internal ROM or internal flash memory is
read by ID850QB (ID code authentication)
Input a hexadecimal number of 20 digits (10 bytes) as the ID code (all 'F' by default).
The ID code is saved to the registry. If inputting the ID code fails three times, the ID850QB is forcibly terminated.
Remark1:
This area does not have to be set with a ROMless product or a product without a RCU (security
unit).
Remark2:
For the details of ID code authentication, refer to N-Wire CARD, MINICUBE or MINICUBE2 User's
Manual.
(6) Peripheral Break
This area is used to specify whether the peripheral emulation function of in-circuit emulator is stopped during a
break.
Break
Stopped
Non Break
Not stopped (default)
Caution:
Whether or not to stop the peripheral I/O functions during a break can be selected only when the
peripheral I/O has that function.
(7) Monitor Clock [IECUBE]
This area is used to specify whether the operation clock of the monitor program is switched from the sub clock to
the main clock during a break.
This area does not have to be set with a product without a sub clock.
System
The operation clock is switched to the main clock and the monitor program is
executed (default).
Note:
In the ID850QB, the clock is changed by manipulating PCC, but not while the main
clock is stopped. If the operation clock is switched to the main clock during a break,
the clock is returned to the previous setting when execution returns to the user
program.
User
The monitor program is executed with the clock selected by the user program.
User’s Manual
U18604EJ1V0UM
123
CHAPTER 6 WINDOW REFERENCE
(8) N-Wire I/F [MINICUBE]
This area is used to select a clock supplied form N-Wire CARD or MINICUBE to the on-chip debug unit (DCU). In
default, a 10 MHz clock is supplied.
Caution:
Usually, 10 MHz clocks must be selected. When a 20 MHz clock is selected, the ID850QB may not
start operating.
DCK=10MHz
The DCK clock is 10 MHz (in default).
Remark:
During selection, the maximum value of the measurement time of the execution
time measurement function is doubled, and that of the resolution of the execution
time measurement function is reduced by half.
DCK=20MHz
In this case, the DCK clock is 20 MHz.
(9) Target Device Connection [MINICUBE2]
This area is used to select the port to be connected for serial communication between MINICUBE2 and the
device on the target system.
MINICUBE2 supports UART and CSI-H/S as a communication interface.
The type of selectable ports varies depending on the device used.
(10) Target [IECUBE]
This area is used to select whether the target board is to be connected to the in-circuit emulator or not. (Refer to
"Table 3-2 Error Message Output Pattern [IECUBE]".)
Connect
Be connected
Not Connect
Not be connected
Remark:
It is used to detect an illegal power supply status.
The default is determination by detecting the power (TVDD) of the target.
(11) Fail-safe Break [IECUBE]
This area is used to select the fail-safe break function. Clicking the <Detail...> button opens the Fail-safe Break
Dialog Box, so that the fail-safe break function can be individually set.
(12) Mask
This area is used to mask the signal sent from the target.
The signal of a masked pin is not input to the in-circuit emulator.
Mask a pin only when the operation of the target system is not stable at the debugging stage.
124
User’s Manual
U18604EJ1V0UM
CHAPTER 6 WINDOW REFERENCE
Remark1:
By selecting RESET, the external reset or internal reset generated by the watchdog timer can be
masked. At this time, whether internal reset can be masked or not depends on the device.
Remark2:
If a device file supporting TM tag is used, however, select Mode00 to Mode1F (the modes to be
displayed are determined by the definition of the device file). When the IECUBE is connected and
when the target is connected, Target Depend can be selected.
(13) Memory Mapping
This area is used to set the mapping.
Select the memory access size with "Access Size", specify the mapping attribute with "Memory Attribute", and
specify the address range with "Mapping Address".
The memory setting is performed by clicking the <Add> button, and the result is listed in the area at the bottom
of the window.
The mappable area depends on the product type.
Access Size
Memory Attribute
Selects memory access size.
This setting is used to specify the access size on the ID850QB software; the operation
of the external bus hardware is set in accordance with the settings of the MODE pin
and I/O register.
8Bit
Accesses memory with ld.b instruction/st.b instruction.
16Bit
Accesses memory with ld.h instruction/st.h instruction.
32Bit
Accesses memory with ld.w instruction/st.w instruction.
The following mapping attributes can be selected. Select a mapping attribute
according to the usage. (Refer to "Table 5-2 Mapping Attribute".)
Emulation ROM
[IECUBE]
(With memory board)
Selects the in-circuit emulator alternate ROM. The mapping unit
is 1MB.
Emulation RAM
[IECUBE]
(With memory board)
Selects the in-circuit emulator alternate RAM. The mapping unit
is 1MB.
Target
Selects the target memory.
The mapping unit is 1byte.
Target ROM
[IECUBE]
Selects the target ROM.
I/O Protect
Selects the I/O protect area.
The I/O protect area can be set in the area that is specified in the
Target field.
Since the area set as the I/O protect area is displayed with
symbol "??" in the Memory Window like unmapped areas, read/
write to this area cannot be performed freely in the Memory
Window, which protects this area from being erroneously read or
writte. The mapping unit is 1 byte.
User’s Manual
U18604EJ1V0UM
125
CHAPTER 6 WINDOW REFERENCE
Mapping Address &
Chip SelectNote
[IECUBE]
Specify the address to be mapped.
Input the higher and lower addresses from the keyboard.
Since the areas that are specified in the emulation memory are composed of 16 MB
(16 banks of 1 MB memory), those areas can be allocated to any location in CS0
through CS7 with the chip select function. (Select one from the drop-down list.)
Allocation addresses can be allocated to any 1 MB boundary.
Multiple banks can be assigned to one single CS.
<Add>
<Delete>
These buttons are used to set and delete mapping. By clicking the <Add> button, mapping is set as specified in each area and the result is listed in the area at the bottom of
the window. To delete a mapped item, select the item from the list and click the
<Delete> button.
Note:
In the case of the V850ES microcontrollers, the allocation of chip selection is fixed, or no chipselection functions are provided, no selection can be made. No selections can be made if the
option board is not installed when the IECUBE is connected.
Caution1:
The area set as "I/O Protect" is not read unless it is registered to the IOR Window or Watch
Window as an I/O port. To read this area, forcibly read it on these windows.
Caution2:
If the external memory is mapped, change the value of a register required for access of an external
memory. (Refer to "5.1.4 To change the value of a register required for access of an external
memory".)
(14) Function buttons
OK
Validates the current environment.
Sets the environment and closes this dialog box.
If an error occurs after clicking the <OK> button, the ID850QB can no longer continue
and is terminated.
Cancel
Cancels the changes and closes this dialog box.
Restore
Restores the previous settings before this dialog box was opened.
Project...
Opens the Project File Load Dialog Box. If an error occurs while a project file is being
opened or read, the ID850QB can no longer continue and is terminated.
About...
Opens the About Dialog Box.
Help
Displays the help window of this window.
126
User’s Manual
U18604EJ1V0UM
CHAPTER 6 WINDOW REFERENCE
Extended Option Dialog Box
This dialog box is used to display and set the extended options of the ID850QB. (Refer to "5.1 Setting
Debugging Environment".)
Figure 6-6 Extended Option Dialog Box Extended Option Dialog Box
(1)
(2)
(3)
(4)
(7)
(5)
(8)
(6)
(9)
- Opening
- Explanation of Each Area
Opening
Select [Option ] menu -> [Extended Option ...].
User’s Manual
U18604EJ1V0UM
127
CHAPTER 6 WINDOW REFERENCE
Explanation of Each Area
(1) Trace [IECUBE]
This area is used to set about trace (refer to "5.10 Trace Function [IECUBE]") (when the IECUBE is connected).
(a) Timetag Count Rate:
This area is used to set the division ratio of the counter used for time tag display in the Trace View Window.
This division ratio is selected from a drop-down list.
If the division ratio is set, the number of clocks necessary for counting up the counter displayed for time tag is
changed.
The relationship between the time tag counter division ratio and maximum measurement time is as follows.
Table 6-5 Relationship Between Time Tag Counter Division Ratio and Maximum Measurement Time
(Time tag counter (Trace))
Division Ratio
Resolution (ns)
Measurable Maximum
Time
TMCLK (1/1)
20
1.4 minutes
TMCLK (1/2)
40
2.8 minutes
TMCLK (1/4)
80
5.7 minutes
TMCLK (1/8)
160
11.4 minutes
TMCLK (1/16)
320
22.8 minutes
TMCLK (1/32)
640
45.6 minutes
TMCLK (1/64)
1280
1.5 hours
TMCLK (1/128)
2560
3 hours
TMCLK (1/256)
5120
6 hours
TMCLK (1/512)
10240
12.2 hours
TMCLK (1/1024)
20480
24.4 hours
TMCLK (1/2048)
40960
48.8 hours
TMCLK (1/4096)
81920
97.6 hours
Remark
Time tag counter 32 bits,
In case of 50 MHz
external clock
(b) Memory Size:
Set the size of the trace memory (buffer).
In other words, specify a memory size by dragging the knob. The sizes that can be specified are 8K (min.),
32K, 64K, 128K, and 256K (max).
Caution: The larger the value that is set, the greater the number of trace data that are recorded. However,
the response when reading trace data becomes correspondingly slower.
(c) Clear trace memory before run
Select this checkbox to clear the trace memory prior to program execution.
128
User’s Manual
U18604EJ1V0UM
CHAPTER 6 WINDOW REFERENCE
(d) Trace Data:
Select the trace data to be collected.
Remark: When [Options] menu -> [RRM Function] is selected, the setting is fixed to Branch PC.
When [Option] menu -> [Coverage Function] is selected, the setting is fixed to All PC.
Table 6-6 Relationship Between Meaning of Trace Data to Be Collected and Trace Collection Mode
Traced Range
Item
Branch PC
Branch PC
Collects PC
values of
branch origin
and branch
destination
instructions
All PC
Collects PC
values of all
instructions
Access PC
Collects PC
values of
instructions
that caused
access
Access Data
Collects
access
address and
access data
Traced
--
--
--
All PC
Access Data
Branch PC + Access Data
--
--
--
TracedNote2
Traced
--
--
TracedNote2
All PC + Access Data
TracedNote1
Access Data + Access PC
Branch PC + Access Data + Access PC
Note1:
--
TracedNote1
TracedNote2
--
--
Traced
TracedNote2
Traced
--
Traced
TracedNote2
When trace data that contains "All PC" is selected, the unconditional trace mode is enabled. In this
case, the qualify trace mode and the section trace mode cannot be set at the same time. (The conditional trace setting is disabled.)
Note2:
When trace data that contains "Access Data" is selected, when the high-speed priority mode (select
Speed Priority in (e) Mode:) is selected, and when access to the internal RAM area is performed 32
times in succession, data may be missed.
(e) Mode:
Specify the trace collection mode.
Remark: When [Option] menu -> [RRM Function / Coverage Function] is selected, the setting is fixed to
Speed Priority.
User’s Manual
U18604EJ1V0UM
129
CHAPTER 6 WINDOW REFERENCE
Speed Priority
This mode performs tracing by prioritizing speed (real-time operation).
In this mode, data may be missed depending on the trace data to be collected.
(Refer to "Table 6-6 Relationship Between Meaning of Trace Data to Be Collected
and Trace Collection Mode".)
Trace Priority
This mode performs tracing by prioritizing data collection (non-real-time).
Since, in order to reliably collect all the trace data, the CPU's execution pipeline is
momentarily stopped when data is likely to be missed, the real-time characteristic
of operation in relation to the user program is lost.
Trace Priority cannot be selected when Branch PC or All PC is selected in (d)
Trace Data:.
(f) Complement Data
Select this checkbox to perform complementary display of trace data (default: selected).
(g) Add DMA Point
Select this checkbox to perform the DMA point trace function. (The checkbox is selected in default.)
When the checkbox is selected, the DMA start and end frames are marked.
(2) Timer [IECUBE]
Set the rate value for the timer counter.
Count RateThe values set in this area are displayed in "Count Rate" of the Timer Dialog Box.
The rate value is selected from a drop-down list.
The relationship between the timer counter division ratio and maximum measurement time is as follows.
Table 6-7 Relationship Between Timer Count Division Ratio and Maximum Measurement Time
(Timer counter (Timer))
Division Ratio
Resolution (ns)
Measurable Maximum
Time
TMCLK (1/1)
20
2.8 minutes
TMCLK (1/2)
40
5.7 minutes
TMCLK (1/4)
80
11.4 minutes
TMCLK (1/8)
160
22.8 minutes
TMCLK (1/16)
320
45.6 minutes
TMCLK (1/32)
640
1.5 hours
TMCLK (1/64)
1280
3 hours
TMCLK (1/128)
2560
6 hours
TMCLK (1/256)
5120
12.2 hours
TMCLK (1/512)
10240
24.4 hours
TMCLK (1/1024)
20480
48.8 hours
TMCLK (1/2048)
40960
97.6 hours
TMCLK (1/4096)
81920
195.2 hours
130
User’s Manual
U18604EJ1V0UM
Remark
Timer counter 33 bits,
In case of 50 MHz
external clock
CHAPTER 6 WINDOW REFERENCE
(3) RAM Monitor
(a) Break When Readout:
Select this item to specify the target range of RAM sampling by instantaneously generating a break in the user
program execution. (Refer to "5.13.2 Pseudo real-time monitor function (Break When Readout)".)
Whole
Whole memory space.Note
Remark:
The user program execution is stopped for a long time when a large number
of windows are opened because the range from which memory is read out
is wid.
IRAM + IOR
Internal RAM area and IOR area
Off
Disables the Pseudo real-time monitor function (Break When
Readout)(default).
Note:
The range specified in the RRM Setting Dialog Box is excluded.
(b) Redraw Interval:
Specify the sampling time (ms) of the RAM sampling.
It can be specified in 100-ms units from 0 to 65500.
If 0 is specified, or if this area is blank, the data is not displayed in real time.
(4) On Mouse Click:
This area is used to select whether a software breakpoint or hardware breakpoint is set as the default breakpoint
if a breakpoint is set in the point mark area by clicking the mouse button in the Source Window or Assemble
Window (refer to "5.4.2 Breakpoint setting").
Soft break
Sets a software breakpoint.
Hard break
Sets a hardware breakpoint.
(5) Break Sound
If the checkbox is selected, a beep sound is issued when a break occurs.
(6) Verify Check
This area is used to specify whether a verify check is performed when data has been written to memory.
A verify check is performed when download, memory fill, or memory copy is executed. A verify check is also
performed when a variable or data is changed in the Watch Window or Memory Window and is written to memory.
Caution:
During write to the internal flash memory (including download), verify check is not performed
whether or not the checkbox in this area is selected, and internal verify of flash self-write is always
performed (read verify is not performed). [MINICUBE]
User’s Manual
U18604EJ1V0UM
131
CHAPTER 6 WINDOW REFERENCE
(7) Clear register when reset
Select this checkbox in order to clear the program registers (r1 to r31) and registers EIPC, EIPSW, FEPC,
FEPSW, CTPC, CTPSW, and CTBP upon CPU reset.
Under the default setting, the registers are not cleared.
(8) Check monitor overwriting when downloading [MINICUBE2]
Select this checkbox to output an error (F0c34) when overwriting to an area reserved for use by MINICUBE2 is
attempted (default : selected).
(9) Function buttons
OK
Validates the settings and closes this dialog box.
Cancel
Cancels the changes and closes this dialog box.
Restore
Restores the previous settings before this dialog box was opened.
Help
Displays the help window of this window.
132
User’s Manual
U18604EJ1V0UM
CHAPTER 6 WINDOW REFERENCE
Fail-safe Break Dialog Box
[IECUBE]
This dialog box is used to perform the fail-safe break settings. (Refer to "5.4.5 Fail-safe break function
[IECUBE]".)
When a project file is read, the results obtained by reading this project file are reflected in this dialog box.
Remark:
For details on the fail-safe break function, refer to the user's manuals of the in-circuit emulator and
the emulation board that are used.
Figure 6-7 Fail-safe Break Dialog Box
(3)
(1)
(2)
- Opening
- Explanation of Each Area
- Cautions
Opening
Click the <Detail...> button in the Configuration Dialog Box.
Explanation of Each Area
(1) Protect
The fail-safe break protect settings are performed in this area.
The fail-safe breaks corresponding to the selected checkboxes are protected.
Under the default setting, all checkboxes are selected.
User’s Manual
U18604EJ1V0UM
133
CHAPTER 6 WINDOW REFERENCE
Internal ROM:
Internal RAM:
This area is used to perform the protect settings for the internal ROM area.
Non Map
Access to access prohibited area
Write
Write to write prohibited area
This area is used to perform the protect settings for the internal RAM area.
Non Map
I/O Register:
External Memory:
Access to access prohibited area
This area is used to perform the protect settings for the peripheral I/O registers area.
Non Map
Access to access prohibited area
Read
Read to read prohibited area
Write
Write to write prohibited area
This area is used to perform the protect settings for the external memory area.
Non Map
Access to access prohibited area
Write
Write to write prohibited area
(2) Verify
This area is used to perform the verify settings for fail-safe breaks.
Verify check is performed during access to the items corresponding to the selected checkboxes.
Internal RAM:
This area is used to perform the verify check setting in the internal RAM area.
Non Map Write
Write to write prohibited area
(3) Function buttons
OK
Validates the settings and closes this dialog box.
Cancel
Closes this dialog box.
Help
Displays this dialog box online help files.
Cautions
(1) Usually a Non Map Break (fail-safe break) occurs in the emulator when a program is fetched from the area
not used by the program, but it does not occur in the 16-byte space at the beginning of the unused
area.When the V850ES/SG2 with a 256 KB internal ROM is used, for example, the Non Map Break does
not occur in the 16-byte area from 0x40000 to 0x4000F.
134
User’s Manual
U18604EJ1V0UM
CHAPTER 6 WINDOW REFERENCE
RRM Setting Dialog Box
[IECUBE]
This dialog box is used to set the sampling range for the RRM function. (Refer to "5.13 RRM Function".)
Up to 8 locations can be specified in 256-byte units as the sampling range.
The total of the sizes specified for the 8 locations cannot exceed 2048 bytes.
Caution:
This dialog box cannot be opened when an item other than [RRM Function] has been selected in
the [Option] menu.
Figure 6-8 RRM Setting Dialog Box
(3)
(1)
(2)
- Opening
- Explanation of Each Area
Opening
The settings of this dialog box when it is opened differ depending on the opening method.
(a) When settings are performed from RRM Setting Dialog Box
The dialog box is opened by selecting [Option] menu -> [RRM Setting...].
In this case, the data in "Address" and "Size" are input manually.
(b) When settings are performed from the Memory Window
This dialog box is opened by opening the Memory Window, selecting an address in the window, and then
selecting [RRM Setting...] from the context menu.
In this case, the selected address is displayed in an empty row in "Address", "256" is displayed in an
empty row in "Size", and the value obtained by converting the address to a symbol is displayed in an
empty row in "Symbol".
Remark:
If the total of the sizes specified for the 8 locations already exceeds 2048 bytes, the dialog box
opens but no value can be set.
User’s Manual
U18604EJ1V0UM
135
CHAPTER 6 WINDOW REFERENCE
(c) When settings are performed from the Watch Window
This dialog box is opened by opening the Watch Window, selecting a variable in the window, and then
selecting [RRM Setting...] from the context menu.
In this case, the value obtained by converting the variable into an address is displayed in an empty row in
"Address", "256" is displayed in an empty row in "Size", and the value obtained by converting the variable
to a symbol is displayed in an empty row in "Symbol".
Remark:
If the total of the sizes specified for the 8 locations already exceeds 2048 bytes, the dialog box
opens but no value can be set.
Explanation of Each Area
(1) Sampling range setting area
Address
This area is used to specify the sampling start address for the RRM function.
The default radix for inputting a numeric value is hexadecimal. An address can be also
specified by a symbol or expression. (Refer to "Table 5-6 Specifying Symbols".)
Following input, click the <Set> button to enable the settings.
Size
This area is used to specify the sampling range from "Address".
The values that can be selected are 256, 512, 768, 1024, 1280, 1536, 1792, 2048.
However, the total of the sizes specified for the 8 locations cannot exceed 2048 bytes.
Symbol
This area displays the symbols of the addresses specified in "Address" .
The specified addresses are displayed as a symbol or as a symbol + offset.
If the address has not been set, nothing is displayed.
Remark:
When the settings are enabled, the addresses are aligned in 256-byte units, but if an address is
duplicate, it is not enabled.
(2) Size Total
This area displays the total of the sizes specified in "Size". If the total exceeds 2048 bytes, it is displayed in red.
(3) Function buttons
Set
Determine the specified sampling range.
Close
Closes this dialog box.
Restore
Restores the previous settings before this dialog box was opened.
Default
Clears the current setting and sets the internal RAM start address in the first row in
Address, and "2048" in the first row in Size.
Delete
Deletes the setting for the numbers with a focus.
Jump
Opens the Memory Window and displays the addresses in "Address" whose numbers
have a focus. Jump is performed for Memory Window that are in the active status.
If multiple memory windows are to be opened, they must be set in the static status.
(Refer to "5.16.1 Active status and static status".)
Help
Displays this dialog box online help files.
136
User’s Manual
U18604EJ1V0UM
CHAPTER 6 WINDOW REFERENCE
Flash Option Dialog Box
[IECUBE]
This dialog box is used to make the flash self programming emulation function settings. (Code flash)
This dialog box cannot be opened during user program execution.
For the list of supported devices, the list of availability of emulation for flash function, and the cautions, refer to "
Special Notes On Flash Self Programming Emuration".
Caution:
This dialog box cannot be opened when using a device that does not incorporate the flash memory.
Figure 6-9 Flash Option Dialog Box
(1)
(2)
(3)
(4)
(5)
(6)
(7)
(8)
- Opening
- Explanation of Each Area
- Special Notes On Flash Self Programming Emuration
Opening
Select [Option] menu -> [Flash Option...].
User’s Manual
U18604EJ1V0UM
137
CHAPTER 6 WINDOW REFERENCE
Explanation of Each Area
(1) Enable Flash Self Programming
If this item is selected, flash self programing emulation function is enabled.
This enables setting of (3) Advanced. This item is not selected by default.
(2) Flash Macro Service Spec
Select the flash macro service specification type in this area when flash self programing emulation function is
enabled.
This area is valid only when the flash memory process is "Type1".
If "New Spec" is selected, "Disable Read" and "Reset Vector" become selectable in (5) PG-FP4 Security Flag
Settings Emulation. Input an address within the address range of the internal flash in the "Reset Vector:" field for
the reset vector address.
Old Spec
Flash self programming Ver. 2.00 or earlier (default)
New Spec
Flash self programming Ver. 3.00 or later
(3) Advanced
If this item is selected, detailed settings for flash self programing emulation function are enabled.
This enables setting of (4) Flash Macro Service Error Emulation and (5) PG-FP4 Security Flag Settings
Emulation. This item is not selected by default.
(4) Flash Macro Service Error Emulation
These items set the operation of the self library function.
When this checkbox is selected, an error value that is returned when flash memory is damaged can forcibly be
returned. (The error values that are returned when flash memory is damaged are not returned in normal
emulation.)
The settable items are as follows: All items are not selected by default.
Generate FlashBlockErase Error
Returns error values in FlashBlockErace functions.
Generate FlashBlockIVerify Error
Returns error values in FlashBlockIVerify functions.
Generate FlashWordWrite Error
Returns error values in FlashWordWrite functions.
Generate FlashBlockBlankCheck Error
Returns error values in FlashBlockBlankCheck functions.
Generate FlashSetInfo Error
Returns error values in FlashSetInfo functions.
Generate FlashFLMDCheck ErrorNote
Returns error values in FlashFLMDCheck functions.
Note:
The IECUBE cannot read the values of the FLMD0 pin. (Normally, with an assumption that a high
level is input to the FLMD0 pin, the FlashFLMDCheck functions always return a normal completion.) Check the "Generate FlashFLMDCheck Error" checkbox when errors, which occur when a
low level is input to the FLMD0 pin in the case of the FlashFLMDCheck functions, need to forcibly
be returned.
138
User’s Manual
U18604EJ1V0UM
CHAPTER 6 WINDOW REFERENCE
(5) PG-FP4 Security Flag Settings Emulation
The initial value of the security flag is emulated when the security has been set to the flash memory using flash
memory programmer PG-FP4.
The settable items are as follows: All items are not selected by default.
Disable Chip Erase
Disables/enables chip erase
Disable Block Erase
Disables/enables block erase
Disable Program
Disables/enables write
Disable ReadNote1
Disables/enables read
Disable Boot Block Cluster ReprogrammingNote2
Disables/enables boot area rewrite
Note1:
Available only when the flash memory process is Type1 (new specification), Type3 or Type4.
Note2:
This item is selectable only when the flash memory process is "Type2" or "Type3".
(6) Reset Vector:
Set the reset vector address (default: 0).
If 0 is specified, the actual reset vector address is set to address 4. If a value other than 0 is specified, the
specified value is set as the actual reset vector address.
When using an MF2 device, reset vector addresses higher than the end address of the block specified in the
Block Protection area cannot be specified (refer to "Table 6-8 Relationship Between Boot Swap Cluster Set Value
and Target Range Set Value").
Caution:
This area is available only when the flash memory process is Type1 (new specification) or Type4.
(7) Block Protection
This area is used to change the target area of boot swap clusters (default: 0).
The value set in this field is reflected to the target area in a boot block cluster (refer to "Table 6-8 Relationship
Between Boot Swap Cluster Set Value and Target Range Set Value").
Prohibition of boot area rewriting can be set to the target area of boot swap clusters by using the device's
security function.
Caution1:
Since the ID850QB does not support the boot swap function, settings related to the boot swap
function are invalid.
Caution2:
This area is available only when the flash memory process is Type4.
User’s Manual
U18604EJ1V0UM
139
CHAPTER 6 WINDOW REFERENCE
Table 6-8 Relationship Between Boot Swap Cluster Set Value and Target Range Set Value
Setting
Value
In Products with 256 KB or Smaller Flash
Memory
Boot block clusters
In Products with 384 KB or Larger Flash
Memory
Boot swap clusters
0
00000H - 007FFH
1
RESV - 00FFFH
RESV - 01FFFH
2
RESV - 017FFH
RESV - 027FFH
3
RESV - 01FFFH
RESV - 03FFFH
4
RESV - 027FFH
:
00000H - 01FFFH
Boot block clusters
00000H - 03FFFH
00000H - 007FFH
RESV - 04FFFH
:
7
RESV - 03FFFH
8
RESV - 047FFH
:
RESV - 07FFFH
16
RESV - 087FFH
:
00000H - 07FFFH
RESV - 08FFFH
RESV - 0FFFFH
:
RESV - 0FFFFH
00000H - 0FFFFH
RESV - 10FFFH
RESV - 1FFFFH
:
31
RESV - 0FFFFH
RESV - 1FFFFH
32
RESV - 107FFH
RESV - 20FFFH
:
127
RESV - 07FFFH
RESV - 07FFFH
:
:
RESV - 03FFFH
:
:
15
Boot swap clusters
:
RESV - 3FFFFH
RESV - 7FFFFH
RESV: The lowest address in a block that includes reset vector address
(8) Function buttons
OK
Validates the settings and closes this dialog box.
Cancel
Closes this dialog box.
Restore
Restores the previous settings before this dialog box was opened.
Help
Displays this dialog box online help files.
140
User’s Manual
U18604EJ1V0UM
CHAPTER 6 WINDOW REFERENCE
Special Notes On Flash Self Programming Emuration
(1) List of Supported Devices
The following lists the devices that support flash self programming emulation function, as of February 2007.
Table 6-9 Flash Self Programming Emulation Supported Device
Flash Memory
Process
Device
Type1
V850ES/Sx2, V850ES/Fx2, V850E/RS1, V850E/IA4, μPD70F3229Y, V850ES/Hx2,
V850ES/Jx2
Type3
V850ES/Kx1 (Only for microcontrollers with on-chip single-power-supply flash
memory), V850ES/Kx1+, V850ES/Kx2
Type4
V850ES/Sx3, V850ES/Fx3, V850ES/Jx3, V850E/Dx3
(2) List of Availability of Emulation for Flash Function
The following table lists whether or not each flash function can be emulated, and restrictions when performing
flash self programming emulation function with the ID850QB. (Emulated: Can be emulated, Restriction: Can be
emulated with some restrictions, Not emulated: Cannot be emulated)
Table 6-10 List of Availability of Emulation for Flash Function (Type1)
Flash Function
Functional Outline and Restriction
Availability
of
Emulation
Type1 (V850ES/Sx2, V850ES/Fx2, V850E/RS1, V850E/IA4, μPD70F3229Y, V850ES/Hx2, V850ES/Jx2)
FlashEnv
Flash environment initialization/end function
Emulated
FlashBlockErase
One block erasure function
Emulated
FlashWordWrite
One word writing function
Restriction:
If an address in the guard area is specified as the third argument, a
fail-safe break occurs at an unexpected address.
Restriction
FlashBlockIVerify
One block internal verify processing function
Emulated
FlashBlockBlankCheck
One block blank check function
Emulated
User’s Manual
U18604EJ1V0UM
141
CHAPTER 6 WINDOW REFERENCE
Flash Function
FlashGetInfo
Functional Outline and Restriction
Availability
of
Emulation
Flash information acquisition function
Option = 2
CPU number and total number of blocks held by
CPU
Restriction:
The device name (four-digit number) set in the Configuration dialog box is returned as the CPU number.
Restriction
Option = 3
Security information
Emulated
Option = 4
Acquisition of boot area swapping information
Restriction:
Boot area swapping information is not reflected.
Restriction
Option = 5 +
Block number
Acquisition of last address of block
Emulated
FlashSetInfo
Flash information setting function
Restriction:
The boot area swapping setting is ignored.
Restriction
FlashStatusCheck
Function for checking operation status of flash function that was executed most recently
Restriction:
For FlashBlockErase and FlashBlockBlankCheck, the timing at which
the return value changes from FE_BUSY to FE_OK differs from that in
the actual device.
Restriction
FlashBootSwap
Boot area block swapping function
Not
emulated
FlashSetUserHandler
User interrupt handler registration function
Emulated
FlashFLMDCheck
FLMD0 pin status check function
Emulated
FlashSetInfoEx
Flash information setting function
Restriction:
The boot area swapping setting is ignored.
Restriction
Function for reading n words
Restriction:
If an address in the guard area is specified as the third argument, a
fail-safe break occurs at an unexpected address.
Restriction
FlashNWordRead
Note:
142
This function has been added in flash self programming Ver. 5.00 and later.
User’s Manual
U18604EJ1V0UM
Note
Note
CHAPTER 6 WINDOW REFERENCE
Table 6-11 List of Availability of Emulation for Flash Function (Type3)
Flash Function
Functional Outline and Restriction
Availability
of
Emulation
Type3 (V850ES/Kx1(Only for microcontrollers with on-chip single-power-supply flash memory), V850ES/
Kx1+, V850ES/Kx2)
FlashEnv
Flash environment initialization/end function
Emulated
FlashBlockErase
One block erasure function
Emulated
FlashWordWrite
One word writing function
Restriction:
If an address in the guard area is specified as the third argument, a failsafe break occurs at an unexpected address.
Restriction
FlashBlockIVerify
One block internal verify processing function
Emulated
FlashBlockBlankCheck
One block blank check function
Emulated
FlashGetInfo
Flash information acquisition function
Option = 2
CPU number and total number of blocks held by CPU
Restriction:
The device file name (four-digit number) is returned as
the CPU number.
Restriction
Option = 3
Security information
Emulated
Option = 4
Acquisition of boot area swapping information
Restriction:
Boot area swapping information is not reflected.
Restriction
Option = 5 +
Block number
Acquisition of last address of block
Emulated
FlashSetInfo
Flash information setting function
Restriction:
The boot area swapping setting is ignored.
FlashBootSwap
Boot area block swapping function
Not
emulated
FlashFLMDCheck
FLMD0 pin status check function
Emulated
FlashWordRead
Data reading function
Restriction:
If an address in the guard area is specified as the third argument, a failsafe break occurs at an unexpected address.
Restriction
FlashlVerify
Internal verify function (for EEPROM)
Not
emulated
FlashBlankCheck
Blank check function (for EEPROM)
Not
emulated
EEPROM_Init
EEPROM area initialization function (for EEPROM)
Not
emulated
EEPROM_Write
EEPROM write function (for EEPROM)
Not
emulated
User’s Manual
U18604EJ1V0UM
Restriction
143
CHAPTER 6 WINDOW REFERENCE
Flash Function
Functional Outline and Restriction
Availability
of
Emulation
EEPROM_Read
EEPROM read function (for EEPROM)
Not
emulated
EEPROM_Copy
EEPROM copy function (for EEPROM)
Not
emulated
EEPROM_VChK
EEPROM valid area check function (for EEPROM)
Not
emulated
EEPROM_Erase
EEPROM erase function (for EEPROM)
Not
emulated
Table 6-12 List of Availability of Emulation for Flash Function (Type4)
Flash Function
Functional Outline and Restriction
Availability
of
Emulation
Type4 (V850ES/Sx3, V850ES/Fx3, V850ES/Jx3, V850E/Dx3)
FlashInit
Self library initialization function
Emulated
FlashEnv
Flash environment start/end function
Emulated
FlashBlockErase
One block erasure function
Emulated
FlashWordWrite
One word writing function
Emulated
FlashBlockIVerify
One block internal verify processing function
Emulated
FlashBlockBlankCheck
One block blank check function
Emulated
FlashGetInfo
Flash information acquisition function
Option = 2
Device information (total number of blocks and
device number)
Emulated
Option = 3
Security flag, last block number of boot block
Emulated
Option = 4
Device information
Emulated
Option = 5
Reset vector address
Emulated
Option = 6
+block number n
Last address of block number n
Emulated
FlashSetInfo
Flash information setting function
Restriction:
Nothing but information setting is performed. The boot area swapping setting is ignored.
Restriction
FlashStatusCheck
Checking of flash function operation that was performed last
Restriction:
SELFLIB_BUSY is not returned.
Restriction
FlashBootSwap
Boot area block swapping function
Restriction:
Functions can be called but boot swapping is not executed.
Not
emulated
144
User’s Manual
U18604EJ1V0UM
CHAPTER 6 WINDOW REFERENCE
Flash Function
FlashFLMDCheck
Functional Outline and Restriction
FLMD0 pin status check function
Availability
of
Emulation
Emulated
(3) Cautions
The cautions on performing flash self programming are described below.
No.
1
Description
Flash self emulation function in the following case.
(a) The internal ROM size is not set to the default size
Workaround: Set the default size to the internal ROM size in the Configuration Dialog Box.
(b) When two breaks before execution are used
Workaround: Disable or delete one of the breaks before execution.
2
When flash self programming emulation function is enabled, the following restrictions are applied to the
debug function.
(a) The internal ROM and internal RAM sizes cannot be changed.
(b) The DMM and pseudo RRM functions are disabled.
(c) An illegal break occurs in the program if the SP register value is 0 (not pointing to the internal
RAM).
If a break such as an event occurs before the SP register value is initialized to point to a relevant
location (such as internal RAM), then it causes an illegal break for the stack area. If there is a
possibility that such a break will occur during this period, set a relevant value to SP before
executing the program.
(d) If "Clear register when reset" is selected in the Extended Option Dialog Box, the values of the R3
register that have been changed by a flash macro service are cleared during reset emulation.
(e) An illegal break may occur if the restriction shown below applies to the IECUBE used.
Clear the Non Map checkbox for the Internal RAM in the Fail-safe Break Dialog Box.
- An illegal break occurs during program execution in internal RAM
3
When flash self programming emulation function is enabled, the 4-byte area starting from address 0 is
reserved, a 4-byte instruction jr 0xfffd6 is written to address 0.Therefore, when using this function at a
reset vector address 0, allocate a startup routine to the area starting from address 4.
If flash self programming emulation is disabled, 0 is written to the four bytes area starting from address 0.
Do no describe codes in which execution branches to address 0, even if this function is used as a reset
vector address 0.
It is recommended to perform description as shown below in order to operate the same program as the
one generated by emulation, in the actual device.
# RESET handler (in the case of address 0)
.section
"RESET", text
jr
__start
jr
__start
--Overwritten by jr 0xfffd6
4
If address 0 is specified as the reset vector handling specification address, the reset vector is set to
address 4. If an address other than address 0 is specified, then the specified address is set as the reset
vector without incrementing the value by four.
5
Regarding the operation of FlashStatusCheck() after FlashBlockErase() and FlashBlockBlankCheck()
during emulation, the timing at which the return value of FlashStatusCheck() changes from FE_BUSY to
FE_OK differs from that in the actual device.
User’s Manual
U18604EJ1V0UM
145
CHAPTER 6 WINDOW REFERENCE
No.
Description
6
If the address specified as the third argument of FlashWordWrite, FlashWordRead, or FlashNWordRead
is located in the guard area, then an illegal memory address is accessed, and a fail-safe break occurs at
an unexpected address.
Correct the address to a relevant one for FlashWordWrite, FlashWordRead, or FlashNWordRead.
7
To enable the settings made in the Flash Option Dialog Box, be sure to reset the CPU and reexecute the
program; otherwise, the setting may not take effect.
8
Secure a stack area of at least 84 (54H) bytes for the debugger's workspace.
The debugger consumes a stack area of at least 84 (54H) bytes when a break occurs or during
emulation processing of flash memory writing.When interrupts are enabled, a stack area of another 84
(54H) bytes is required as the debugger's workspace.
If multiple interrupts are enabled, a stack area of 84 (54H) bytes must be secured per stage.
9
The data in the internal RAM is corrupted after a CPU reset. Normally, the internal RAM data after reset
is not guaranteed in the actual device, but note that the operation may vary.
10
If a flash function is not used in accordance with the specifications or an unsupported flash function is
called, "1" is returned.
11
The following restrictions apply to emulation of Type4.
(1) An area of 48 bytes from the internal RAM end address is reserved for use by the debugger.
(2) When using a device with a 1 MB internal flash memory, the internal flash area starting from
address 0xFF300 or higher will be used by the debugger.
(3) If a flash function is executed stepwise in assemble mode, the debugger code for emulation will be
executed, which is different from the code actually executed by the device. During debugging,
therefore, perform stepwise execution in source mode.
146
User’s Manual
U18604EJ1V0UM
CHAPTER 6 WINDOW REFERENCE
Data Flash Option Dialog Box
[IECUBE]
This dialog box is used to make the data flash error emulation function settings. (Data flash)
This dialog box cannot be opened during user program execution.
Caution:
This dialog box cannot be opened when using a device that does not incorporate the data flash
memory.
Figure 6-10 Data Flash Option Dialog Box
(1)
(2)
(3)
(4)
- Opening
- Explanation of Each Area
- Cautions
Opening
Select [Option] menu -> [Data Flash Option...].
User’s Manual
U18604EJ1V0UM
147
CHAPTER 6 WINDOW REFERENCE
Explanation of Each Area
(1) Enable Data Flash Error Emulation
If this item is selected, data flash error emulation function is enabled.
This enables setting of (2) Writing Time Emulation and (3) EEPROM Library Error Emulation.
This item is not selected by default.
(2) Writing Time Emulation
These items specify the time for writing to and erasing the data flash memory.
Select the write time (Writing Time:) and erase time (Erasing Time:) from the following.
Min
No retry
Typ
Typical number of times that is assumed by flash macro
specifications (default)
Typ-worst
Maximum number of times that is assumed by flash macro
specifications
Max
Retries for the maximum times specified
(3) EEPROM Library Error Emulation
These items set the operation of the EEPROM library function.
When this checkbox is selected, the error value that are not returned in normal emulation can forcibly be
returned.
An address in the data flash memory, at which a certain error is to be generated, can be specified by selecting
the corresponding checkboxes.
The settable items are as follows: All items are not selected by default.
Generate WordWrite Error
Returns error values in WordWrite functions.
Generate BlockErase Error
Returns error values in BlockErase functions.
Generate BlockIVerify Error
Returns error values in BlockIVerify functions.
Generate BlockBlankCheck Error
Returns error values in BlockBlankCheck functions.
(4) Function buttons
OK
Validates the settings and closes this dialog box.
Cancel
Closes this dialog box.
Restore
Restores the previous settings before this dialog box was opened.
Help
Displays this dialog box online help files.
148
User’s Manual
U18604EJ1V0UM
CHAPTER 6 WINDOW REFERENCE
Cautions
(1) The Data Flash Option dialog box cannot be opened if the "Use Data Flash" checkbox is not selected in the
Configuration Dialog Box.
(2) The Data Flash Option dialog box is made unavailable if the "Use Data Flash" checkbox is cleared after the
"Enable Data Flash Error Emulation" checkbox is selected in the Configuration Dialog Box.
(3) If an RRM area is set to the data flash memory in the RRM Setting Dialog Box, the written values are not
reflected during user program execution because writing to the data flash memory is always performed via
the library. Due to the same reason, the written values are not reflected to highlighting of addresses by the
access monitor function (Read/Write, Read and Write) in the Memory Window.
(4) Writing to the data flash memory via the DMM Dialog Box is disabled during user program execution.
(5) An unexpected break may occur if a data flash area is accessed via a library when using IECUBE. To
prevent this, clear the Non Map check box for Internal RAM and Non Map, Read, and Write check boxes for
I/O register in the Fail-safe Break Dialog Box.
(6) If a target memory is mapped to a 1 MB area that includes a data flash area and write-access is performed
for the data flash area, no guard breaks occur.
(7) If no target memory is mapped to a 1 MB area that includes a data flash area and read-access is performed
for the 1 MB area other than the data flash area, no guard breaks occur.
(8) No software breaks can be set to the data flash area.
User’s Manual
U18604EJ1V0UM
149
CHAPTER 6 WINDOW REFERENCE
Debugger Option Dialog Box
This dialog box is used to display and set the various options of the ID850QB.
Figure 6-11 Debugger Option Dialog Box
(1)
(10)
(2)
(3)
(11)
(4)
(5)
(12)
(6)
(7)
(13)
(8)
(9)
(14)
- Opening
- Explanation of Each Area
Opening
Select [Option] menu -> [Debugger Option...].
150
User’s Manual
U18604EJ1V0UM
CHAPTER 6 WINDOW REFERENCE
Explanation of Each Area
(1) Source Path
This area is used to specify the directory in which a source file or text file is searched.
Base:
The directory is the basis of a relative path is displayed. The base directory is
determined in the following sequence:
1) Directory to which the project file has been loaded
2) Directory to which a load module or hex file has been loaded last
3) Current directory of Windows
Text box
This area is used to specify the directory searched.
To specify a directory, either directly input one to the text box, or click the
<Browse...> button. A relative path can also be specified.
Opens the [Add Source path] Dialog Box by clicking the <Browse...> button. To
delimit paths, use ";" (semicolon) or "," (comma).
Figure 6-12 [Add Source path] Dialog Box
Remark1:
Directories that contain ";" and/or "," in the source path can be specified. Non-existent directories
cannot be specified.
Remark2:
Immediately after this dialog box has been opened, the base directory is selected and opened. If
the selected directory has already been set for the source path, a source path is not added.
Remark3:
Up to 8,191 characters can be set for the source path length in total, including a dot (.) before
extension.
If more than 8,191 characters are used to specify a source path, the valid paths until the 8,191th
character are set as a source path and characters that follow are ignored.
User’s Manual
U18604EJ1V0UM
151
CHAPTER 6 WINDOW REFERENCE
(2) Default Extension
This area is used to specify the default extension.
Delimit extensions with " " (blank),";" (semicolon) or "," (comma).
Source File:
Set the extension of a source file that is displayed when the Browse Dialog Box is
opened by selecting [File] menu -> [Open...].
The default extension is " *.c, *.s".
Load Module:
Set the extension of a load module that is displayed when the Download Dialog
Box is opened.
The default extension is " *.out".
(3) Open File History
This area is used to set the number of histories of the open file displayed in the bottom field of the [File] menu.
The default value is 4. If 0 is set, no history is displayed on the menu.
(4) Font
This area is used to specify the font displayed on the Source Window, Watch Window, Quick Watch Dialog Box,
Local Variable Window, and Stack Window. Clicking the <Font...> button opens the Font Dialog Box in which the
font to be displayed and its size can be set.
Figure 6-13 [Font] Dialog Box
(5) Coverage
The color to distinguish the coverage of executed code, displayed in the Source Window and Assemble Window,
can be changed in the Coverage-Color Dialog Box, which is opened by clicking the <Color...> button.
152
User’s Manual
U18604EJ1V0UM
CHAPTER 6 WINDOW REFERENCE
(6) Project File
This area is used to set automatic saving of the project file. (Refer to "5.15.1 Debugging environment (project
file)".)
Auto Save:
Sets whether the project file is automatically saved at the ID850QB termination.
On
Automatically saves the project file.
Off
Does not Automatically saves the project file.
Query
Displays the Exit Debugger Dialog Box at the ID850QB termination.
(default)
(7) Source Option
This area is used to set the Source Window operation at a break.
By selecting this checkbox, a Source Window that is active at a break is displayed at the front.
If there is no active Source Window or no debug information in the load module file, the active Assemble Window
is displayed at the front.
(8) Tool Bar Pictures
This area sets the buttons to be displayed on the toolbar. (Refer to "(2) Operation of tool bar".)
Pictures and Text
Displays a button on which a graphic and character are displayed.
Pictures only
Displays a button with only graphic. (default)
(9) Kanji
Cannot be selected in this area.
(10) Tab Size
This area is used to set the tab size for each extension when files are displayed.
Extension:
Set an extension. Input an extension from the keyboard, or select one from the dropdown list.
Tab Size:
Select the tab size. Select how many spaces are displayed as a tab code (2, 4, or 8).
Tab List:
Displays the tab size set for each extension.
<Add>
To change the tab size setting, select "Extension:" and "Tab Size:", and click this
button.
<Delete>
To delete the tab size setting, select the setting from "Tab List:" and click this button.
User’s Manual
U18604EJ1V0UM
153
CHAPTER 6 WINDOW REFERENCE
(11) Startup Routine
This area is used to specify the first address , end address, and display start symbol of the text area (code area)
of the start-up routine by symbols.
By specifying these items, a source file can be opened immediately after the load module format object file is
downloaded in the Download Dialog Box. (If the PC locates the address between "Begin label:" and "End label:" at
this time, the ID850QB displays the code starting from the address specified in "main() label:").
Begin label:
Specifies the symbol of the first address (default: _start)
End label:
Specifies the symbol of the end address (default: _startend)
main() label:
Specifies the display start symbol (default _main)
Caution1:
If the specified symbol is not correct, the source file cannot be opened until the PC reaches the
address range of the corresponding source file. In addition, the start-up routine cannot be skipped
by step execution.
Caution2:
Be sure to specify this area. If this area is blank, the dialog box cannot be closed.
(12) DisAssemble
This area is used to set for disassemble display.
Show Offset:
Register Name:
154
Specifies whether an offset (symbol + offset) is displayed during disassemble
display.
When the offset is not displayed, only a symbol that matches a numeric value is
displayed, if any. If no matching symbol is found, the numeric value is displayed as
a hexadecimal number unchanged.
Label
Specifies whether the offset is displayed in the Label field. In
the default condition, the offset is not displayed.
Mnemonic
Specifies whether the offset is displayed in the Mnemonic
field. In the default condition, the offset is displayed.
This area is used to select the method of displaying register names in mnemonics
during disassemble display.
Function Name
Displays register names as function names or nicknames.
(default)
Absolute Name
Displays register names as absolute names.
User’s Manual
U18604EJ1V0UM
CHAPTER 6 WINDOW REFERENCE
(13) Watch Default
This area is used to specify a symbol to be watched in the Watch Window etc..
Size:
Selects the default display size of data if [Adaptive] is specified from the drop-down
list.
Radix:
Sets the default radix in which data is to be displayed if [Proper] is specified from
the drop-down list.
The item selected from this list is also reflected in the subscript for watch data such
as array variables (or labels) in the Watch Window (hexadecimal by default), which
are registered in the Watch Window after this setting is changed.
Show Variable Type:
Language:
Hex
Displays in hexadecimal numbers. (default)
Dec
Displays in decimal numbers.
Oct
Displays in octal numbers.
Bin
Displays in binary numbers.
String
Displays as a character string.
Select the display/non-display of variable type is specified.
On
Displays the type of a variable.
Off
Does not display the type of a variable. (default)
Select the display/non-display of type of variable is specified.
C
Displays a C-like base number.(default).
ASM
Cannot be selected.
(14) Function buttons
OK
Validates the settings and closes this dialog box.
Cancel
Cancels the changings and closes this dialog box.
Restore
Restores the previous settings before this dialog box was opened.
Help
Displays this dialog box online help files.
User’s Manual
U18604EJ1V0UM
155
CHAPTER 6 WINDOW REFERENCE
Project File Save Dialog Box
This dialog box is used to save the current debugging environment to a project file. (Refer to "5.15.1 Debugging
environment (project file)".)
Project files can be newly saved or saved under an existing file name in this dialog box.
Figure 6-14 Project File Save Dialog Box
(1)
(2)
- Opening
- Explanation of Each Area
Opening
Select [File] menu -> [Project] -> [Save As...].
(To save a file of same name as a project file previously loaded or saved, select [File] menu -> [Project] ->
[Save].)
Explanation of Each Area
(1) Save file setting area
Save in:
File name:
Save as type:
This area is used to specify a file name. A file name can be directly input, or selected
from the list at the upper part of this area.
Up to 257 characters string with a extension can be specified.
This area is used to specify the extension (*.prj) of the project file to be saved.
If the extension is omitted, "*.prj" is appended as the default extension.
(2) Function buttons
Save
Saves the debugging environment to the selected file. After saving, the dialog box is
closed.
Cancel
Closes this dialog box without saving the file.
Help
Displays this dialog box online help files.
156
User’s Manual
U18604EJ1V0UM
CHAPTER 6 WINDOW REFERENCE
Project File Load Dialog Box
This dialog box is used to restore the debugging environment to the debugging environment saved to the project
file. (Refer to "5.15.1 Debugging environment (project file)".)
If there is an active Source Window after a project file has been loaded, it is displayed at the top.
Caution:
Following the ID850QB startup, if a project file with settings that differ from those of the target
device at startup has been loaded, the target device specified at startup is used.
Figure 6-15 Project File Load Dialog Box
(1)
(2)
- Opening
- Explanation of Each Area
Opening
Click the Proj button, or select [File] menu -> [Project] -> [Open...].
Explanation of Each Area
(1) Load file setting area
Look in:
File name:
This area is used to specify the file name to be loaded. A file name can be directly
input from the keyboard, or selected from the list.
Up to 257 characters string with a extension can be specified.
Files of type:
This area is used to specify the extension (*.prj) of the file to be loaded.
(2) Function buttons
Open
Loads the selected file. After loading the file, this dialog box is closed.
Cancel
Closes this dialog box without executing anything.
Help
Displays this dialog box online help files.
User’s Manual
U18604EJ1V0UM
157
CHAPTER 6 WINDOW REFERENCE
Download Dialog Box
This dialog box is used to select the name and format of a file to be downloaded, and downloads memory
contents to the in-circuit emulator and the target system. (Refer to "5.2 Download Function, Upload Function".)
If a load module file has been downloaded, the corresponding source file is searched, and the Source Window is
automatically opened.
Caution:
If a file other than a load module file is loaded, source debugging cannot be executed.
Remark1:
The internal flash memory can be written and the load module can be downloaded (refer to "5.7.4
Flash memory writing function [MINICUBE] [MINICUBE2]"). [MINICUBE] [MINICUBE2]
Remark2:
Files can be downloaded to the external flash memory (refer to "5.2.2 Downloading to External
Flash Memory").
Remark3:
The following dialog box appears while downloading and the downloading can be can celled at any
time.
Figure 6-16 Download Dialog Box
(1)
(7)
(4)
(5)
(2)
(6)
(3)
- Opening
- Explanation of Each Area
Opening
Click the Load button, or select [File] menu -> [Download...].
158
User’s Manual
U18604EJ1V0UM
CHAPTER 6 WINDOW REFERENCE
Explanation of Each Area
(1) Load file setting area
Look in:
This area is used to specify the file name to be loaded. A file name can be directly
input from the keyboard, or selected from the list.
Up to 257 characters string with a extension can be specified.
File name:
Files of type:
Remark:
This area is used to specify the extension (*.prj) of the file to be loaded. (Refer to
"Table 5-3 Type of File That Can Be Downloaded".)
These are default extensions; other extensions can also be used. The default
extension of the displayed load module can also be specified in the Debugger
Option Dialog Box.
Two or more files can be specified in this dialog box. To specify two or more files, delimit each file
name with " " (double quotation mark). Files can also be specified by clicking the mouse button
while holding down the Shift or Ctrl key.
Up to 20 load module files can be downloaded.
(2) Load
Sets a load condition.
This setting is valid only if a file in the load module format is specified.
Symbol
Specifies whether symbol information is read or not.Note
Object
Specifies whether object information is read (when selected, default) or not.
(The object information is read even if this button is not selected when a HEX file is
loaded.)
Erase
Cannot be selected. [IECUBE]
Specifies whether the contents of the internal flash memory are erased all before
download or not. [MINICUBE]
Note:
The memory capacity can be saved by not reading symbol information when a program consisting
of two or more load module files is to be debugged and if the symbol information of some modules
does not have to be read.
(3) Reset
Sets a reset condition.This setting is valid only if a file in the load module format is specified (CPU reset is
enabled for files other than coverage result files, however.).
Symbol
Specifies whether to reset symbol information while loading a file.Note
CPU
Specifies whether to reset the CPU while loading a file. (Not selected, default.)
Note:
When downloading two or more load module files, take care that location addresses do not overlap.
User’s Manual
U18604EJ1V0UM
159
CHAPTER 6 WINDOW REFERENCE
(4) to external FlashROM
If the addresses of the internal instruction RAM and those of the flash memory in the external space overlap (this
applies to the V850E2 core), specify which takes precedence for downloading.
If this area is checked, the flash memory in the external space takes precedence.
This area is not checked, by default, and therefore, the internal instruction RAM takes precedence.
Note that, before downloading data to the flash memory in the external space, flash information must be set by
using the efconfig command on the console window (refer to "5.2.2 Downloading to External Flash Memory",
"CHAPTER 7 COMMAND REFERENCE").
(5) at High Speed
This check box is used to select whether to perform high-speed downloading.
If this check box is selected, the clock is switched to the highest one during downloading. (CPU reset occurs
when switching the clock.)
It is not selected by default (normal clock is used for downloading).
The target areas are the internal ROM and internal RAM (including VSB ROM and VSB RAM).
An error message will be displayed if the object file includes the code regarding the external memory area,
emulation memory area or data flash area.
Remark:
Downloading of the coverage result is not subject to high-speed downloading.
(6) Offset Address:
This area is used to specify the offset address that is used when a file is loaded (for binary data, specify the start
address). An address can be also specified by a symbol or expression. (Refer to "Table 5-6 Specifying Symbols".)
The default radix for inputting a numeric value is hexadecimal.
(7) Function buttons
Open
Loads the selected file. After loading the file, this dialog box is closed.
Cancel
Closes this dialog box without loading the file.
Help
Displays this dialog box online help files.
Restore
Restores the input data to the original status.
160
User’s Manual
U18604EJ1V0UM
CHAPTER 6 WINDOW REFERENCE
Upload Dialog Box
This dialog box is used to set the name and format of the file to be saved, and save the set memory contents,
etc., to that file. (Refer to "5.2 Download Function, Upload Function".)
Figure 6-17 Upload Dialog Box
(1)
(3)
(2)
- Opening
- Explanation of Each Area
Opening
Select [File] menu -> [Upload...].
Explanation of Each Area
(1) Upload file setting area
Save in:
This area is used to specify a file name. A file name can be directly input, or selected
from the list at the upper part of this area.
Up to 257 characters string with a extension can be specified.
File name:
Save as type:
Remark:
This area is used to specify the extension of the file to be saved.The format of the data
to be saved is determined by the extension. (Refer to "Table 5-4 Type of File That Can
Be Uploaded".)
Extensions other than those listed can also be used.
User’s Manual
U18604EJ1V0UM
161
CHAPTER 6 WINDOW REFERENCE
(2) Save Address:
This area is used to specify the range of address to be saved.
All the ranges are saved (this area cannot be set) when coverage data (*.cvb) is selected.
An address can be also specified by a symbol or expression. (Refer to "Table 5-6 Specifying Symbols".) The
default radix for inputting a numeric value is hexadecimal.
(3) Function buttons
Save
Saves the file according to the setting.
Cancel
Closes this dialog box without executing anything.
Help
Displays this dialog box online help files.
Restore
Restores the status before this dialog box was opened.
162
User’s Manual
U18604EJ1V0UM
CHAPTER 6 WINDOW REFERENCE
Load Module List Dialog Box
This dialog box displays the list of the files, file paths and file format that have been downloaded from Download
Dialog Box. (Refer to "5.2 Download Function, Upload Function".)
The listed files (excluding the coverage data files) are saved in the project file; they are downloaded when the
project file is opened next. By using the <Download...> button, the Download Dialog Box can be opened and a file
can be downloaded.
Figure 6-18 Load Module List Dialog Box
(2)
(1)
- Opening
- Explanation of Each Area
Opening
Select [File] menu -> [Load Module...].
User’s Manual
U18604EJ1V0UM
163
CHAPTER 6 WINDOW REFERENCE
Explanation of Each Area
(1) Load module file display area
Module list
This area displays the names of the files that have already been downloaded.
No.
The numbers displayed indicate the sequence in which the load
module file names were read.
Format
The file formats are displayed
File name
BIN
Binary file
HEX
Hex file
HEX/IDTAG
Hex file with ID tag
COV
Coverage data file
ELF/CA850
Load module file (ELF/CA850)
ELF/DWARF2
Load module file (ELF/GHS extended DWARF2)
ELF
ELF load module file (ELF without symbol
information)
unknown
Unknown
The file names are displayed with the full path if "Add Path" is
selected; otherwise, only the file names will be displayed.
Add Path
This should be selected to specify file names are displayed with the path.
<Download...>
Opens the Download Dialog Box.
A new load module can be downloaded. The file name of the newly file will be added to
the file name display area when the Download dialog box is closed.
Caution:
If symbol information has been reset in the Reset Debugger Dialog Box, or if symbol information
has been reset in the Download Dialog Box, the file names downloaded before that are cleared.
(2) Function buttons
Close
Closes this dialog box.
Help
Displays this dialog box online help files.
164
User’s Manual
U18604EJ1V0UM
CHAPTER 6 WINDOW REFERENCE
Source Window
This window is used to displays source files or text files. (Refer to "5.3 Source Display, Disassemble Display
Function".)
In addition to Breakpoint setting , Display of locations for which coverage measurement is executed
and Mixed display mode (Source Window), a number of other operations using Context Menu, Function buttons,
etc., can be performed in this window. Moreover, there are two statuses, Active status and static status, for this
window. When the window is in the active status, it has the Trace result with linking window [IECUBE]. Moreover,
the items selected in the window with Drag & drop function can be used in another window. (Refer to "5.16
Functions Common to Each Window".)
Caution1:
If program codes is described in an include file and these codes are included in multiple files, the
line numbers and addresses do not correspond on a one-to-one bases. In such an include file,
function that indicates the correspondence relationship between line numbers and addresses dose
not correctly operate.
Caution2:
If a source file that includes the "main" function cannot be found in the source path after a load
module file is downloaded, or if the source file cannot be found during step execution, ID850QB
opens a dialog box to select the source file and prompt the user to select the source path for the
source file displayed in the dialog box. If the <Cancel> button is clicked, the displayed file name is
memorized, so the source file name will no longer be asked, until ID850QB is terminated.
Remark1:
Up to 65,535 lines of C and assembly language source files can be displayed. If the source files
exceed 65,535 lines, partition them.
Remark2:
The number of characters that can be displayed on 1 line in each area of a window is 319.
Figure 6-19 Source Window
(5)
(1)
(2)
(3)
(4)
User’s Manual
U18604EJ1V0UM
165
CHAPTER 6 WINDOW REFERENCE
- Opening
- Explanation of Each Area
- [View] Menu (Source Window-dedicated items)
- Context Menu
Opening
Click the Src button, or select [Browse] menu -> [Source Text].
(This window is automatically opened if the corresponding source file exists after the download module file has
been downloaded.)
Explanation of Each Area
(1) Point mark area
This area is used for the Event Setting Status (Event Mark) and program codes (*) display, as well as Breakpoint
setting.
Breakpoints can be set or deleted by clicking with the mouse on this program code.
(if "*" is not displayed for the line, the breakpoint is set on the line above or below the line, whichever has "*"
displayed.)
The program code is displayed only when the symbol information downloaded by the load module file is read.
If an event has been set for the corresponding line, one of the marks listed in the following table is displayed. The
color of the "B" mark differs according to the breakpoint type and status. (When a breakpoint is set in this area, it is
enabled at the same time that it is set.)
Table 6-13 Event Setting Status (Event Mark)
Mark
Meaning
B (blue)
Software breakpoint is set.
B (red)
Valid hardware breakpoint (after execution) is set.
B (green)
Valid hardware breakpoint (before execution) is set.
Note: Breaks before execution are set with priority.
B (black)
Invalid hardware breakpoint is set.
This hardware breakpoint can be validated on the Event Manager or in the Break
Dialog Box.
E
Event condition is set.
L
Event link condition is set.
T
Trace event is set.
Ti
Timer event is set.
A
Multiple events are set.
166
User’s Manual
U18604EJ1V0UM
CHAPTER 6 WINDOW REFERENCE
Remark:
If an address range is specified as the address condition of the event, the lower addresses of the
range are displayed. The mask specification of the address condition is not reflected.
(2) Current PC mark area
The mark ">", which indicates the current PC value (PC register value), is displayed in this area.
Clicking this mark with the mouse displays a pop-up window that shows the PC register value.
By double-clicking the current PC mark area, the program can be executed up to a specified line. (Refer to "
[Come Here]".)
(3) Line number/address display area
This area displays the line numbers of a source file or text file.
Red indicates line numbers for which corresponding program code exists, and black indicates line numbers for
which corresponding program code does not exist. In the Mixed display mode (Source Window), disassemble
display addresses are displayed in gray.
In addition, executed addresses are highlighted based on code coverage measurement information. (Refer to
"5.11.3 Display of locations for which coverage measurement is executed".)
(4) Source text display area
This area displays the line numbers of a source file or text file.The following line is emphasized.
Current PC line ((yellow)Note
Yellow indicates the current PC line (or disassemble line)(’>’).
If there is no line number information at the PC position when a break occurs,
the execution automatically jumps to the Assemble Window.
In the Mixed display mode (Source Window), the color of only the disassemble
display line is changed (the source line is displayed in the normal color).
Break point setting line (red)
Red indicates lines where a valid breakpoint is set.
In the Mixed display mode (Source Window), the color of only the disassemble
display line is changed (the source line is displayed in the normal color).
Moreover, this area also provides the following functions for lines (start address of program code) and addresses
where the cursor has been placed.
- [Come Here], [Start From Here] (Refer to "Table 5-9 Type of Execution".)
- Drag & drop function
- Context Menu
Caution:
If a Program code does not exist on the source line, the top address of the line above or below the
line on which a program code exists is manipulated by these functions.
These functions cannot be performed in the following cases. The corresponding menu will be
dimmed and cannot be selected.
- If a file other than a source file is displayed
- While the user program is being executed
User’s Manual
U18604EJ1V0UM
167
CHAPTER 6 WINDOW REFERENCE
(5) Function buttons
Search...
Opens the Source Search Dialog Box and searches a character string of the source
text. If a character string is selected in the source text display area, the Source Search
Dialog Box is opened to search the character string.
If no character string is selected, the Source Search Dialog Box is opened with nothing
specified to be searched.
Specify a search method in the Source Search Dialog Box.
The results of search is highlighted in the Source window.
This is the same operation as selecting [View] menu -> [Search...].
<<
Searches forward (upward on screen) for the text that satisfies the search condition set
in the Source Search Dialog Box, starting from the address at the cursor position.
This button is displayed as the <Stop> button during a search.
>>
Searches backward (downward on screen) for the text that satisfies the search
condition set in the Source Search Dialog Box, starting from the address at the cursor
position.
This button is displayed as the <Stop> button during a search.
Stop (during a
search)
Stops searching.
Watch
Adds the variables selected in the source text display area to the Watch Window.
If the Watch Window is not opened, it is opened.
If no text is selected in the source text display area, the Watch Window is only opened.
This is the same operation as selecting [View] menu -> [View Watch].
Quick...
Temporarily displays the contents, such as a variable, selected in the source text
display area in the Quick Watch Dialog Box. If no text is selected in the source text
display area, the Quick Watch Dialog Box is only opened.
This is the same operation as selecting [View] menu -> [Quick Watch...].
Refresh
Updates the contents of the window with the latest data.
Close
Closes this window.
[View] Menu (Source Window-dedicated items)
The following items are added in the [View] menu, when the Source Window is active.
Create Break Event
Sets a break event that occurs if the selected variable is accessed.
Break when Access to
this Variable
Sets a break event that occurs if the selected variable is accessed for read/
write.
Break when Write to this
Variable
Sets a break event that occurs if the selected variable is accessed for write.
Break when Read from
this Variable
Sets a break event that occurs if the selected variable is accessed for read.
Clear
Deletes a break event corresponding to the selected variable.
Event Information
Displays the event information of a line at the cursor position or a selected
variable name.
If an event is set, the Event Dialog Box is opened.
Mix
Turns on/off Mixed display mode (Source Window).
168
User’s Manual
U18604EJ1V0UM
CHAPTER 6 WINDOW REFERENCE
Context Menu
Move...
Moves the display position.
Opens the Source Text Move Dialog Box.
Mix
Turns on/off Mixed display mode (Source Window).
Add Watch...
Adds the specified data to the Watch Window.
Opens the Add Watch Dialog Box.
Symbol...
Displays the address of the specified variable or function, or the value of the
specified symbol.
Opens the Symbol To Address Dialog Box.
Break when Access to this
Variable
Sets a break event that occurs if the selected variable is accessed for read/
write.
Break when Write to this
Variable
Sets a break event that occurs if the selected variable is accessed for write.
Break when Read from this
Variable
Sets a break event that occurs if the selected variable is accessed for read.
Clear
Deletes a break event corresponding to the selected variable.
Event Information
Displays the event information of a line at the cursor position or a selected
variable name.
If an event is set, the Event Dialog Box is opened.
Come Here
Executes the program from the current PC to the cursor position. (Refer to
"Table 5-7 Break Types".)
Change PC
Sets the address at the cursor position to the PC.
Break Point
Sets or deletes a hardware breakpoint at the cursor position.
Note: Breaks before execution (B) are set with priority.
Software Break Point
Sets or deletes a software breakpoint at the cursor position.
Assemble
Disassembles and displays starting from the jump destination address specified
by the data value at the cursor position. (Refer to "5.16.2 Jump function".)
Opens the Assemble Window.
If an active Assemble Window is open, that window is displayed in the forefront
(so that it can be manipulated).
Memory
Displays the memory contents starting from the jump destination address
specified by the data value at the cursor position. (Refer to "5.16.2 Jump
function".)
Opens the Memory Window.
If an active Memory Window is open, that window is displayed in the forefront
(so that it can be manipulated).
User’s Manual
U18604EJ1V0UM
169
CHAPTER 6 WINDOW REFERENCE
Source Search Dialog Box
This dialog box is used to search the contents of a file in the Source Window. (Refer to "5.3.1 Source display".)
By setting each item and then clicking the <Find Next> button, searching can be started. By clicking the <Set
Find> button, the direction buttons ("<<" and ">>") in the Source Window can be used for the search.
Remark:
The maximum length of the character string that can be searched for in the Source Window is 150
(ANK characters).
Figure 6-20 Source Search Dialog Box
(1)
(2)
- Opening
- Explanation of Each Area
Opening
When the Source Window is the current window, select [View] menu -> [Search...], or click the <Search...>
button in the same window.
Explanation of Each Area
(1) Search conditon specification area
Find What:
This area is used to specify the data to be searched. (Up to 256 characters.)
In the default condition, the string selected in the window that called this dialog box is
displayed. As necessary, the character string displayed can be changed. Up to 16
input histories can be recorded.
Match Case
This should be selected to distinguish between uppercase and lowercase.
Direction
This area is used to specify the direction of the search.
170
Up
Forward search. Searches data forward (upward on screen) from the
current position of the cursor.
Down
Backward search. Searches data backward (downward on screen) from
the current position of the cursor. (default)
User’s Manual
U18604EJ1V0UM
CHAPTER 6 WINDOW REFERENCE
(2) Function buttons
Find Next
Searches the specified data in accordance with a given condition.If the specified
character string is found as a result of a search, it is highlighted.
To continue searching, click this button again.
Set Find
Sets the specified condition as the search condition and closes this dialog box.
Stop (during
searching)
Stops searching.
Close
Closes this dialog box.
(During searching, this button is replaced by the <Stop> button.)
Help
Displays this dialog box online help files.
User’s Manual
U18604EJ1V0UM
171
CHAPTER 6 WINDOW REFERENCE
Source Text Move Dialog Box
This dialog box is used to specify a file to be displayed in the Source Window and the position from which
displaying the file is to be started. (Refer to "5.3.1 Source display".)
Figure 6-21 Source Text Move Dialog Box
(1)
(2)
- Opening
- Explanation of Each Area
- Source path search order
Opening
When the Source Window is the current window, select [View] menu -> [Move...].
Explanation of Each Area
(1) Source file setting area
Option
172
Selects the input mode when the display start position is specified.
Address/Symbol
This should be selected to specify by an address (or symbol).
Line/File
This should be selected to specify by a line number (or file name). To
search the file name, use the <Browse...> button.
User’s Manual
U18604EJ1V0UM
CHAPTER 6 WINDOW REFERENCE
To:
Specifies the file name or address to be displayed.
Up to 16 input histories can be recorded.
When "Address/
Symbol" is
selected
Specifies the address from which display is to be started.
The default radix for inputting a numeric value is hexadecimal. An
address can be also specified by a symbol or a expression. (Refer to
"Table 5-6 Specifying Symbols".)
Clicking the <OK> button displays the source text so that the source
line corresponding to the specified address value can be viewed.
When "Line/File"
is selected
Specifies the line number (or a file name) from which display is to be
started.
The line number is specified by [[path name] file name]# line
number.
The default radix for inputting a numeric value is decimal.
The file name can be specified just bythe file name, or using the
absolute path and relative path. If just the file name or the relative path
was specified, the file in the source path specified in the Debugger
Option Dialog Box is searched.
The file whose specified line number was specified as the first line is
displayed by clicking the <OK> button. When the file name is omitted,
the currently displayed file is displayed from the specified line. If the
line number is omitted, the file is displayed from the first line.
(2) Function buttons
OK
Starts displaying the source text from the specified position.
Cancel
Closes this dialog box.
Restore
Restores the status before this dialog box was opened.
Help
Displays this dialog box online help files.
Source path search order
The debugger searches source files in the following order and displays the file that has been found first
(automatic source path setting).
(1) Folder where source file is placed when it is built
(2) Source path passed from project manager PM+ or source path set on Debugger Option Dialog Box
(3) Folder where load module file exists
The user does not need to specify the source path if the source files are stored in the folder where they were
placed during build by project manager PM+. If no source files are found even if they are searched for in the above
order, a dialog box that prompts the user to specify the source path will be displayed.
User’s Manual
U18604EJ1V0UM
173
CHAPTER 6 WINDOW REFERENCE
Assemble Window
This window is used to disassemble and display programs. It is also used to execute Line assembly. (Refer to
"5.3 Source Display, Disassemble Display Function".) The results of line assembly are also reflected in the
Memory Window.
In addition to Breakpoint setting and Display of locations for which coverage measurement is executed, a
number of other operations using Context Menu, Function buttons, etc., can be performed in this window.
Moreover, there are two statuses, Active status and static status, for this window. When the window is in the active
status, it has the Trace result with linking window [IECUBE]. Moreover, the items selected in the window with the
Drag & drop function can be used in another window. (Refer to "5.16 Functions Common to Each Window".)
Caution1:
Peripheral I/O registers with the same address but different names cannot be distinguished in the
disassemble display.
Caution2:
Illegal mnemonics may be displayed if the Assemble window is scrolled up (toward the direction in
which the addresses are decremented).
Caution3:
The maximum length of the character string that can be searched for in the Assemble window is
150 (ANK).
Caution4:
Line assemble in the Assemble window does not optimize instructions, as is performed in the
CA850 assembler
Figure 6-22 Assemble Window
(5)
(1)
(2)
(3)
(4)
- Opening
- Explanation of Each Area
- [View] Menu (Assemble Window-dedicated items)
- Context Menu
- Related Operations
174
User’s Manual
U18604EJ1V0UM
CHAPTER 6 WINDOW REFERENCE
Opening
Click the Asm button, or select [Browse] menu -> [Assemble].
Explanation of Each Area
(1) Point mark area
This area is used for Event Setting Status (Event Mark) and Breakpoint setting.
(2) Current PC mark area
The mark ">", which indicates the current PC value (PC register value), is displayed in this area.
By double-clicking the current PC mark area, the program can be executed up to a specified line. (Refer to "
[Come Here]".)
(3) Address specification area
This area displays the disassembly start address.
In addition, executed addresses are highlighted based on code coverage measurement information. (Refer to
"5.11.3 Display of locations for which coverage measurement is executed".)
Remark:
The end address is not display. The end address is 0xFFFFFFFE.
(4) Disassemble display area
This area displays the labels and code data of addresses, and disassembled mnemonics.
It can be Line assembly in the mnemonic field.
The following line is emphasized.
Current PC line ((yellow)
Yellow indicates the current PC line (’>’).
Break point setting line (red)
Red indicates lines where a valid breakpoint is set.
This area also provides the following functions:
- [Come Here], [Start From Here] (Refer to "Table 5-9 Type of Execution".)
- Drag & drop function
- Context Menu
User’s Manual
U18604EJ1V0UM
175
CHAPTER 6 WINDOW REFERENCE
(5) Function buttons
Search...
Opens the Assemble Search Dialog Box and searches for a character string of
mnemonics.
Specify a search method in the Assemble Search Dialog Box. The results of search is
highlighted in the Assemble Window.
This is the same operation as selecting [View] menu -> [Search...].
<<
Searches forward (upward on screen) for the contents that satisfy the search condition
set in the Assemble Search Dialog Box, starting from the address at the cursor
position.
This button is displayed as the <Stop> button during a search.
>>
Searches backward (downward on screen) for the contents that satisfy the search
condition set in the Assemble Search Dialog Box, starting from the address at the
cursor position.
This button is displayed as the <Stop> button during a search.
Stop(during a search)
Stops searching.
Watch
Adds the symbols selected in (4) Disassemble display area to the Watch Window. If
the Watch Window is not opened, it is opened.
If no text is selected in "Disassemble display area", the Watch Window is only opened.
This is the same operation as selecting [View] menu -> [View Watch].
Quick...
Temporarily displays the contents, such as symbols, selected in (4) Disassemble
display area on the Quick Watch Dialog Box.
Opens the Quick Watch Dialog Box. If no text is selected in "Disassemble display
area", the Quick Watch Dialog Box is only opened.
This is the same operation as selecting [View] menu -> [Quick Watch...].
Refresh
Updates the contents of the window with the latest data.
Close
Closes this window.
[View] Menu (Assemble Window-dedicated items)
The following items are added in the [View] menu, when the Assemble Window is active.
Event Information
Displays the event information of the address at the cursor position.
If an event is set, the Event Dialog Box is opened.
Context Menu
The menu items are effective for the selected line or item, not the position where the mouse pointer was clicked
(same operation as when selecting the main menu with the same name).
Move...
Moves the display position.
Opens the Address Move Dialog Box.
Add Watch...
Adds the specified data to the Watch Window.
Opens the Add Watch Dialog Box.
Symbol...
Displays the address of the specified variable or function, or the value of the specified
symbol.
Opens the Symbol To Address Dialog Box.
176
User’s Manual
U18604EJ1V0UM
CHAPTER 6 WINDOW REFERENCE
Come Here
Executes the program from the current PC to the cursor position. (Refer to "Table 5-7
Break Types".)
Change PC
Sets the address at the cursor position to the PC.
Break Point
Sets or deletes a hardware breakpoint at the cursor position.
Note: Breaks before execution (B) are set with priority.
Software Break Point
Sets or deletes a software breakpoint at the cursor position.
Source Text
Displays the corresponding source text and source line, using the data value at the
cursor position as the jump destination address. (Refer to "5.16.2 Jump function".)
If no line information exists at the jump destination address, however, you cannot jump.
Opens the Source Window.
If an active Source Window is open, that window is displayed in the forefront (so that it
can be manipulated).
Memory
Displays the memory contents starting from the jump destination address specified by
the data value at the cursor position. (Refer to "5.16.2 Jump function".)
Opens the Memory Window.
If an active Memory Window is open, that window is displayed in the forefront (so that
it can be manipulated).
Related Operations
(1) Line assembly
To change the disassembled contents, move the cursor to the mnemonic field (the overwrite and insertion modes
are alternately selected by pressing the Insert key).
If an attempt is made to move the cursor to another line after the disassembled contents have been changed in
the mnemonic field, the new contents are checked. If the new contents are illegal, the code data on the line where
the contents have been changed is indicated as "*".
The contents changed in the mnemonic field are written into the memory by pressing the Enter key. By pressing
the Enter key, the new contents are checked. If even one line is illegal, the new contents are not written into the
memory. To discard the contents, press the ESC key.
If the contents are correct and if the Enter key is pressed, the contents are written to the memory, and then the
cursor moves to the next line in the mnemonic field, so that the data on the next line can be changed.
Caution:
If the number of new instruction bytes is less than the number of previous instruction bytes as a
result of changing, as many "nop" instructions as necessary are inserted. If the number of new
instruction bytes is more than the number of previous instruction bytes, the next instruction is overwritten. In this case also, as many "nop" instructions as necessary are inserted. The same applies
to instructions that straddle over source lines.
User’s Manual
U18604EJ1V0UM
177
CHAPTER 6 WINDOW REFERENCE
Assemble Search Dialog Box
This dialog box is used to search the contents in the Assemble Window. (Refer to "5.3.2 Disassemble display".)
Successive character strings included in an input character string and disassembler character string are
compared as one blank character.
By setting each item and then clicking the <Find Next> button, searching can be started. By clicking the <Set
Find> button, the direction buttons ("<<" and ">>") in the Assemble Window can be used for the search.
Figure 6-23 Assemble Search Dialog Box
(1)
(2)
- Opening
- Explanation of Each Area
Opening
When the Assemble Window is the current window, select [View] menu -> [Search...], or click the <Search...>
button in the same window.
Explanation of Each Area
(1) Search condition specification area
Find What:
This area is used to specify the data to be searched. (Up to 256 characters.)
In the default condition, the string selected in the window that called this dialog box
is displayed. As necessary, the character string displayed can be changed. Up to
16 input histories can be recorded.
Match Case
This should be selected to distinguish between uppercase and lowercase.
Scan Whole Region
This should be selected to search the entire specified range.
Direction
This area is used to specify the direction of the search.
178
Up
Forward search. Searches data forward (upward on screen) from the
current position of the cursor.
Down
Backward search. Searches data backward (downward on screen)
from the current position of the cursor. (default)
User’s Manual
U18604EJ1V0UM
CHAPTER 6 WINDOW REFERENCE
Address:
This area is used to specify the address to be searched.
The default radix for inputting a numeric value is hexadecimal. An address can be
also specified by a symbol or expression. (Refer to "Table 5-6 Specifying
Symbols".)
(2) Function buttons
Find Next
Searches the specified data in accordance with a given condition.
If the specified character string is found as a result of a search, it is highlighted.
To continue searching, click this button again.
Set Find
Sets the specified condition as the search condition and closes this dialog box.
Stop (searching)
Stops searching.
Close
Closes this dialog box. (During searching, this button is replaced by the <Stop>
button.)
Help
Displays this dialog box online help files.
User’s Manual
U18604EJ1V0UM
179
CHAPTER 6 WINDOW REFERENCE
Address Move Dialog Box
This dialog box is used to specify the start address from which displaying, as follows.
- Memory Window
- Assemble Window
- IOR Window
Figure 6-24 Address Move Dialog Box (Example: When Memory Window Is Open)
(1)
(2)
- Opening
- Explanation of Each Area
Opening
When the target window is the current window, select [View] menu -> [Move...].
Explanation of Each Area
(1) Address specification area
Address
This area is used to specify the start address from which displaying.
To:
In the default condition, the string selected in the window that called
this dialog box, or the current PC value etc. is displayed. As
necessary, the character string displayed can be changed.
The default radix for inputting a numeric value is hexadecimal. An
address can be also specified by a symbol or expression. (Refer to
"Table 5-6 Specifying Symbols".)
Up to 16 input histories can be recorded.
(2) Function buttons
OK
The corresponding window is displayed from the address.
Cancel
Closes this dialog box.
Restore
Restores the status before this dialog box was opened.
Help
Displays this dialog box online help files.
180
User’s Manual
U18604EJ1V0UM
CHAPTER 6 WINDOW REFERENCE
Symbol To Address Dialog Box
This dialog box is used to display the address of the specified variable or function, or the value of the specified
symbol. (Refer to "5.3.4 Convert symbol (symbol to address)".)
Figure 6-25 Symbol To Address Dialog Box
(1)
(2)
- Opening
- Explanation of Each Area
Opening
Select [View] menu -> [Symbol...].
Explanation of Each Area
(1) Symbol conversion area
Symbol:
This area is used to specify the variable, function name, symbol name, or line number
to be converted. (Refer to "Table 5-6 Specifying Symbols".)
To change the contents of this area, click the <OK> button. The conversion result will
be displayed in the area below.
The default radix for inputting a numeric value is decimal. Up to 16 input histories can
be recorded.
Conversion result
display area
If bit symbol have been specified, they are converted to the Address.bit format. Also,
equations that include bit symbols cannot be specified. The variable, address of the
function, value of the symbol, address of the line number, or value of the expression
specified in "Symbol:" is displayed. The address value of an I/O port name or
peripheral I/O registers name, the register contents of a register name, or flag value of
a PSW flag name is displayed.
Radix:
This area is used to select the radix of the converted data to be displayed.
Hex
Hexadecimal number (default)
Dec
Decimal number
Oct
Octal number
Bin
Binary number
User’s Manual
U18604EJ1V0UM
181
CHAPTER 6 WINDOW REFERENCE
(2) Function buttons
OK
If the contents of "Symbol:" have been changed, converts the symbol. After
conversion, closes the dialog box if the contents of "Symbol:" have not been changed.
Close
Closes this dialog box.
Restore
Restores the input data to the original status.
If the <OK> button has already been clicked, the data is restored to the status
immediately after the <OK> button was clicked.
Help
Displays this dialog box online help files.
182
User’s Manual
U18604EJ1V0UM
CHAPTER 6 WINDOW REFERENCE
List Window
This window lists functions, variables, symbols, sections, and interrupt requests.
Display data can be saved in the CSV format, independently for a selected tab. (Refer to "5.15.2 Window display
information (view file)".)
Figure 6-26 List Window
(1)
(3)
(2)
- Opening
- Explanation of Each Area
- Context Menu
Opening
Select [Browse] menu -> [List].
User’s Manual
U18604EJ1V0UM
183
CHAPTER 6 WINDOW REFERENCE
Explanation of Each Area
(1) Load Module:
This area is used to select the load module file that has been downloaded.
This area is blank when no load module file has been downloaded.
(2) List view area
The items such as names, sizes, and addresses of functions, variables, symbols, sections, and interrupt
requests are listed, by each tab. The displayed contents are updated automatically after a load module file is
downloaded.
This area is blank when no load module file has been downloaded.
(a) When [Function] tab is selected
Name
Function name
(displayed as function in file units in case of assembler source file)
File
Name of file in which the function is defined
Address
Function start address
Size
Function size (unit: bytes)
(b) When [Variable] tab is selected
Name
Variable name
File
Name of file in which the variable is defined
Address
Variable start address
Size
Variable size (unit: bytes)
(c) When [Symbol] tab is selected
Name
Symbol name
Address
Symbol address
(d) When [Section] tab is selected
184
Name
Section name
Type
Section type (code, data)
Address
Section start address
Size
Section size (unit: bytes)
User’s Manual
U18604EJ1V0UM
CHAPTER 6 WINDOW REFERENCE
(e) When [Interrupt] tab is selected
Name
Interrupt request name
Type
Interrupt type
(nonmaskable, maskable, software, security id, flash mask option)
Status
Utilization status in the program (use, nonuse)
---- : Unknown
Address
Starting address of the interrupt handler
Size
Size of the interrupt handler (unit: bytes)
Maximum size for statuses other than "use"
The pointer can also jump to any of the above windows just by double-clicking the jump source address.
The display jumps from this tab to the Source Window, Assemble Window or Memory Window using the start
address value of the selected line as a jump pointer. The jump destination window will be displayed from the jump
pointer.
The jump function is executed by selecting a jump source line then selecting [Source Text/Assemble/Memory] in
the [Jump] menu.
Remark:
The displayed items are sorted by clicking the title (on the label) in each column (ascending/
descending order is switched each time the title is clicked).The width of each column can be
changed, but the change is lost when the data in the window is saved as the CSV file.
(3) Function buttons
Close
Closes this window.
Context Menu
Source Text
Displays the corresponding source text and source line, using the data value at the
cursor position as the jump destination address. (Refer to "5.16.2 Jump function".)
If no line information exists at the jump destination address, however, you cannot jump.
Opens the Source Window. If an active Source Window is open, that window is
displayed in the forefront (so that it can be manipulated).
Assemble
Disassembles and displays starting from the jump destination address specified by the
data value at the cursor position. (Refer to "5.16.2 Jump function".)
Opens the Assemble Window. If an active Assemble Window is open, that window is
displayed in the forefront (so that it can be manipulated).
Memory
Displays the memory contents starting from the jump destination address specified by
the data value at the cursor position. (Refer to "5.16.2 Jump function".)
Opens the Memory Window.
If an active Memory Window is open, that window is displayed in the forefront (so that
it can be manipulated).
User’s Manual
U18604EJ1V0UM
185
CHAPTER 6 WINDOW REFERENCE
Watch Window
This window is used to display and change specified watch data. (Refer to "5.6 Watch Function".)
This window can also display wide-ranging watch data (such as global variables and public symbols) in real time
even during program execution, in the same way as the Memory Window.
The results of updating and rewriting data in this window will be reflected in the Memory Window.
Watch data is registered by clicking the <Watch...> button in the Source Window or Assemble Window. (Refer to
"5.6.3 Registering and deleting watch data".)
This window allows easy setting of breakpoints to variables via a Context Menu.
Remark1:
If a local variable and a global variable exist with the same name, the local variable takes priority.
Remark2:
A maximum of 10,000 lines can be displayed in the Watch Window.
Caution1:
If an area that extending over a bank boundary (256 bytes) in the RRM area is accessed during
user program execution, the invalid values are displayed for the higher addresses. Consequently,
the corresponding variables are highlighted with red in the Watch window. (In such a case, the values displayed in the Memory window are also invalid, but they are not highlighted with red.)
This phenomenon occurs only during user program execution. The correct values are displayed at
a break. [IECUBE]
Caution2:
When a function to assign external variables to the registers of the CA850 is used, the variable
cannot be browsed or set in the Watch window. Manipulate such variables in the Register Window
or register the relevant register in the Watch window before manipulating the variables.
Figure 6-27 Watch Window
(2)
(1)
Symbol name display area
Data value display/setting area
- Opening
- Explanation of Each Area
- [View] Menu (Watch Window-dedicated items)
- Context Menu
186
User’s Manual
U18604EJ1V0UM
CHAPTER 6 WINDOW REFERENCE
Opening
Click the Wch button, or select [Browse] menu -> [Watch].
Explanation of Each Area
(1) Watch data display/change area
The left area displays symbol names, and the right area displays data values.
Symbol name display area
This area is used to display variable names, symbol names and types, and tag
names of structures or unions.'+' is prefixed to the displayed arrays, pointer
variables, and structures or unions. These variables are expanded and displayed
when they are double-clicked (first character changes from "+" to "-").
Registered watch data changes are performed in the Change Watch Dialog Box
opened by selecting the item to be changed and then selecting Context Menu ->
[Change Watch...]. A line with an expanded hierarchy, such as the elements of an
array, and members of structures and unions cannot be deleted.
If an access breakpoint is set for a variable or a symbol in the Watch Window, the
symbol name display area is highlighted in gold.
Array
By double-clicking the "+", all the elements of the variable
are displayed in accordance with the type of the array
variable.
Pointer variable
By double-clicking the "+", the data indicated by the pointer
is displayed.
Structure/union
By double-clicking the "+", all the members of the structure/
union are displayed in accordance with the type of the
member variable.
If a structure or union is defined in the structure or union,
the structure name or union name of the internal structure
or union is also displayed.
The internal structure or union can be also expanded by
using "+".
User’s Manual
U18604EJ1V0UM
187
CHAPTER 6 WINDOW REFERENCE
Data value display/setting
area
This area is used to display and change watch data values. A value is updated
when execution is stopped. To save a value, select [File ] menu -> [Save As...].
This area is blank if getting data has failed.
Values are changed through direct input. The location to be changed is displayed
in red and the contents of the change are written into the target memory when the
Enter key is pressed. The previous value can be canceled by the ESC key.
Display Data
Contents
Integer
Hexadecimal (0xxxxx)
Decimal (xxxx)
Octal (0xxxx)
Binary (0bxxxx)
Character
"Character"
Enumeration type
Member name
If scope is
specified
Displayed in accordance with specified scope.
Floating-point type
Single precision/double precision supported.
The input/display format is as follows:
[ + | - ] inf
[ + | - ] nan
[ + | - ] integer e [ + | - ]exponent
[ + | - ] integer.fraction[ e [ + | - ]exponent
"?"
Data that has been invalidated because of a change in the
scope or optimized compiling
Remark1:
If an array has too many variables and takes too long to expand, a warning message is displayed.
Remark2:
The radix can be changed per variable using the Context Menu. The display format of integers and
the number of elements for arrays can be changed in the Debugger Option Dialog Box.
Remark3:
Lines cannot be deleted and radices cannot be changed by selecting multiple lines on the Watch
window. Select one line at a time.
(2) Function buttons
Add...
Opens the Add Watch Dialog Box.
If watch data is specified and the <Add...> button is clicked in the Add Watch Dialog
Box, the specified watch data is added to the Watch Window.
Delete
Deletes the selected watch data from the window.
Up
Moves the selected line one line up.
Down
Moves the selected line one line down.
Refresh
Updates the contents of this window with the latest watch data.
Close
Closes this window.
188
User’s Manual
U18604EJ1V0UM
CHAPTER 6 WINDOW REFERENCE
[View] Menu (Watch Window-dedicated items)
When this window is the current window, The following items are added on [View] menu.
Only the selected item is subject to this manipulation.
Create Break Event
Creates a break event by using the selected item as follows.
Beak when Access to
this Variable
Creates a break event that can be accessed for read/write by using the
selected item.
Break when Write to this
Variable
Creates a break event that can be accessed for write by using the selected
item.
Break when Read from
this Variable
Creates a break event that can be accessed for read by using the selected
item.
Clear
Deletes a break event corresponding to the selected item.
Event Information
Displays the event information of the variable selected. If an event is set, the
Event Dialog Box is opened.
Bin
Displays the selected line in binary numbers.
Oct
Displays the selected line in octal numbers.
Dec
Displays the selected line in decimal numbers.
Hex
Displays the selected line in hexadecimal numbers.
String
Displays the selected line as a character string.
Proper
Displays the selected line as the default value of each variable.
Symbols are displayed in accordance with the setting of the Debugger Option
Dialog Box (default).
Byte
Displays the selected line in 8-bit units.
Half Word
Displays the selected line in 16-bit units.
Word
Displays the selected line in 32-bit units.
Adaptive
Displays the selected line as the default value of each variable. (default)
Only this item is valid for a symbol in C language.
Symbols in assembly language are displayed in accordance with the setting of
the Debugger Option Dialog Box.
Up
Moves the selected line one line up.
Down
Moves the selected line one line down.
Compulsion Read
Forcibly reads IOR, that are disabled from being read because their values will
be changed, or the data of the I/O ports and I/O protect area added in the Add I/
O Port Dialog Box.
User’s Manual
U18604EJ1V0UM
189
CHAPTER 6 WINDOW REFERENCE
Context Menu
The menu items are effective for the selected line or item, not the position where the mouse pointer was clicked
(same operation as when selecting the main menu with the same name).
Beak when Access to
this Variable
Creates a break event that can be accessed for read/write by using the selected item.
Break when Write to
this Variable
Creates a break event that can be accessed for write by using the selected item.
Break when Read
from this Variable
Creates a break event that can be accessed for read by using the selected item.
Clear
Deletes a break event corresponding to the selected item.
RRM Setting...
Sets the sampling range of RRM function.
Opens the RRM Setting Dialog Box. [IECUBE]
Event Information
Displays the event information of the variable selected. If an event is set, the Event
Dialog Box is opened.
Change Watch...
Changes the selected watch data.
Opens the Change Watch Dialog Box.
Delete Watch
Deletes the selected watch data from the window.
Bin
Displays the selected line in binary numbers.
Oct
Displays the selected line in octal numbers.
Dec
Displays the selected line in decimal numbers.
Hex
Displays the selected line in hexadecimal numbers.
String
Displays the selected line as a character string.
Proper
Displays the selected line as the default value of each variable.
Symbols are displayed in accordance with the setting of the Debugger Option Dialog
Box. (default)
Byte
Displays the selected line in 8-bit units.
Half Word
Displays the selected line in 16-bit units.
Word
Displays the selected line in 32-bit units.
Adaptive
Displays the selected line as the default value of each variable (default).
Only this item is valid for a symbol in C language.
Symbols in assembly language are displayed in accordance with the setting of the
Debugger Option Dialog Box.
Up
Moves the selected line one line up.
Down
Moves the selected line one line down.
190
User’s Manual
U18604EJ1V0UM
CHAPTER 6 WINDOW REFERENCE
Quick Watch Dialog Box
This dialog box is used to temporarily display or change specified watch data. (Refer to "5.6 Watch Function".)
Figure 6-28 Quick Watch Dialog Box
(1)
(4)
(2)
(3)
Symbol name display area
Data value display/setting area
- Opening
- Explanation of Each Area
Opening
When the Source Window or Assemble Window is the current window, select [View] menu -> [Quick Watch...], or
click the <Quick...> button in same window.
Explanation of Each Area
(1) Display form specification area
Display radix selection
area
This area is used to select the display radix.
Proper
Variable: Displays the default value of each variable.
Symbol: Displays data with the radix set in the Debugger
Option Dialog Box.
Hex
Displays in hexadecimal numbers.
Dec
Displays in decimal numbers.
Oct
Displays in octal numbers.
Bin
Displays in binary numbers.
String
Displays as a character string.
User’s Manual
U18604EJ1V0UM
191
CHAPTER 6 WINDOW REFERENCE
Display size selection
area
This area is used to select the display size.
If the display size is fixed, such as when a variable in C language or register is to
be displayed, it cannot be changed.
Adaptive
Variable: Displays the default value of each
variable.Symbol: Displays data with the size set in the
Debugger Option Dialog Box.
Byte
Displays in 8-bit units.
Half Word
Displays in 16-bit units.
Word
Displays in 32-bit units.
(2) Watch data specification area
Name:
This area is used to specify the watch data to be displayed.
In the default condition, the string selected in the window that called this dialog box
is displayed. As necessary, the character string displayed can be changed. Up to
16 input histories can be recorded.
If the contents of this area have been changed, the data specified can be displayed
in the field below by clicking the <View> button.
Number:
This area is used to specify the number of data to be displayed (blank or a number
of 1 to 256).
If this area is blank, data is displayed as a simple variable. If a number of 1 or more
is specified, data is displayed as an array variable in the Watch Window.
If an array variable is displayed, "+" is prefixed to the data. By double-clicking this
"+", all the elements of the data are expanded and displayed in accordance with the
type of the data ("-" is prefixed to the expanded data. If this "-" is double-clicked, the
expanded display is canceled).
If the number of data to be displayed is fixed, such as when a variable in C language or register is to be displayed, the specified number of data is invalid.
(3) Watch data display area
The left area displays symbol names, and the right area displays data values.
Symbol name display area
This area is used to display watch data (variable names, symbol names and
types, and tag names of structures or unions). (Refer to " Watch Window".)
This area cannot be edited.
Data value display/setting
area
This area is used to display and change data values. (Refer to " Watch
Window".)
(4) Function buttons
View
Displays the data specified in (2) Watch data specification area in the field below.
Add
Adds the data specified in (2) Watch data specification area to the Watch Window.
Close
Closes this dialog box.
Data that has not actually been written to the target memory will be canceled.
192
User’s Manual
U18604EJ1V0UM
CHAPTER 6 WINDOW REFERENCE
Add Watch Dialog Box
This dialog box is used to register watch data to be displayed in the Watch Window. (Refer to "5.6 Watch
Function".)
Multiple data with the same symbol name can be registered.
Figure 6-29 Add Watch Dialog Box
(1)
(2)
(3)
- Opening
- Explanation of Each Area
Opening
Select [View] menu -> [Add Watch...], or click the <Add...> button in the Watch Window.
Explanation of Each Area
(1) Watch data registration area
Name:
This area is used to specify symbol to be added to the Watch Window. (Refer to "Table
6-14 Watch Window Input Format".)
In the default condition, the string selected in the window that called this dialog box is
displayed. As necessary, the character string displayed can be changed. This area is
blank if no character string is selected. Up to 16 input histories can be recorded.
<Add>
Adds the specified data to the Watch Window.
The dialog box remains open.
User’s Manual
U18604EJ1V0UM
193
CHAPTER 6 WINDOW REFERENCE
Table 6-14 Watch Window Input Format
- Variable Name of C language
Variable expression : Variable Name
|Variable expression [Constant value | Variable Name]
Elements of array
|Variable expression . Member name
Entity members of structure/union
|Variable expression -> Member name
Members of structure/union indicated by
pointer
|*Variable expression
Value of pointer variable
|&Variable expression
Address where variable is located
- Register name
- IOR name, IOR bit name
- Label and address of immediate value
- Register name.bit
- IOR name. bit
- Label name.bit , address of immediate value.bit
- Specification of scope
How a variable is handled when a scope Is specified is as follows:
Table 6-15 How Variable Is Handled When Scope Is Specified
Scope Specification
Program Name
File Name
Function Name
Variable Name
prog$file#func#var
prog
file
func
var
prog$file#var
prog
file
global
var
prog$var
prog
global
global
var
file#func#var
current
file
func
var
file#var
current
file
global
var
var
current
current
current
var
194
User’s Manual
U18604EJ1V0UM
CHAPTER 6 WINDOW REFERENCE
(2) Display form change area
Radix:
Size:
Number:
This area is used to select the display radix.
Proper
Variable: Displays the default value of each variable.
Symbol: Displays data with the radix set in the Debugger Option
Dialog Box.
Hex
Displays in hexadecimal numbers.
Dec
Displays in decimal numbers.
Oct
Displays in octal numbers.
Bin
Displays in binary numbers.
String
Displays in strings.
This area is used to select the display size. If the display size is fixed, such as when a
variable in C language or register is to be displayed, it cannot be changed.
Adaptive
Variable: Displays the default value of each variable.
Symbol: Displays data with the size set in the Debugger Option
Dialog Box.
Byte
Displays in 8-bit units.
Half Word
Displays in 16-bit units.
Word
Displays in 32-bit units.
This area is used to specify the number of data to be displayed (blank or a number of 1
to 256).
If this area is blank, data is displayed as a simple variable. If a number of 1 or more is
specified, data is displayed as an array variable in the Watch Window.
If an array variable is displayed, "+" is prefixed to the data. By double-clicking this "+",
all the elements of the data are expanded and displayed in accordance with the type of
the data ("-" is prefixed to the expanded data. If this "-" is double-clicked, the expanded
display is canceled).
If the number of data to be displayed is fixed, such as when a variable in C language or
register is to be displayed, the specified number of data is invalid.
(3) Function buttons
OK
Adds the specified data to the Watch Window.
Closes this dialog box.
Cancel
Closes this dialog box.
Restore
Restores the status before this dialog box was opened.
Help
Displays this dialog box online help files.
User’s Manual
U18604EJ1V0UM
195
CHAPTER 6 WINDOW REFERENCE
Change Watch Dialog Box
This window is used to change the data on a line selected in the Watch Window. (Refer to "5.6 Watch Function".)
A line with an open hierarchy, such as the elements of an array, and members of structures and unions cannot
be changed.
When watch data is changed, the contents of the selected line are replaced with the new data.
The symbol name can be changed even if it results in duplication of a name already in use with existing data.
Figure 6-30 Change Watch Dialog Box
(1)
(2)
(3)
- Opening
- Explanation of Each Area
Opening
When the Watch Window is the current window, select [View] menu -> [Change Watch...].
Explanation of Each Area
(1) Watch data change area
Name:
This area is used to change a symbol name on a line selected in the Watch Window.
(Refer to "Table 6-14 Watch Window Input Format".)
The symbol name can be changed even if it results in duplication of a name already in
use with existing data.
In the default condition, the string selected in the window that called this dialog box is
displayed. Up to 16 input histories can be recorded.
<Add>
Cannot be selected.
196
User’s Manual
U18604EJ1V0UM
CHAPTER 6 WINDOW REFERENCE
(2) Display form change area
Radix:
Size:
Number:
This area is used to change the display radix on a line selected in the Watch Window.
Proper
Variable: Displays the default value of each variable.
Symbol: Displays data with the radix set in the Debugger Option
Dialog Box.
Hex
Displays in hexadecimal numbers.
Dec
Displays in decimal numbers.
Oct
Displays in octal numbers.
Bin
Displays in binary numbers.
This area is used to change the display size on a line selected in the Watch Window. If
the display size is fixed, such as when a variable in C language or register is to be
displayed, it cannot be changed.
Adaptive
Variable: Displays the default value of each variable.
Symbol: Displays data with the size set in the Debugger Option
Dialog Box.
Byte
Displays in 8-bit units.
Half Word
Displays in 16-bit units.
Word
Displays in 32-bit units.
This area is used to change the number of data to be displayed on a line selected in
the Watch Window (blank or a number of 1 to 256).
If this area is blank, data is displayed as a simple variable. If a number of 1 or more is
specified, data is displayed as an array variable in the Watch Window.
If an array variable is displayed, "+" is prefixed to the data. By double-clicking this "+",
all the elements of the data are expanded and displayed in accordance with the type of
the data ("-" is prefixed to the expanded data. If this "-" is double-clicked, the expanded
display is canceled).
If the number of data to be displayed is fixed, such as when a variable in C language or
register is to be displayed, the specified number of data is invalid.
(3) Function buttons
OK
Replaces the data on a line selected in the Watch Window with the specified data, and
then closes this dialog box.
Cancel
Closes this dialog box.
Restore
Restores the status before this dialog box was opened.
Help
Displays this dialog box online help files.
User’s Manual
U18604EJ1V0UM
197
CHAPTER 6 WINDOW REFERENCE
Local Variable Window
This window is used to display the local variable in the current function and change the local variable values.
(Refer to "5.6.2 Displaying and changing local variable values".)
It is linked with the Jump function of the Stack Window, and displays the local variable in the function jumped
when jumping to the Source Window.
A number of other operations using Context Menu, Function buttons, etc., can be performed in this window.
Figure 6-31 Local Variable Window
(2)
(1)
Local variable name display area
Local variable value display/setting area
- Opening
- Explanation of Each Area
- [View] Menu (Local Variable Window-dedicated items)
- Context Menu
Opening
Click the Loc button, or select [Browse] menu -> [Local Variable].
Explanation of Each Area
(1) Local variable display/change area
Local variable name display area
198
This area displays local variable name. (Refer to " Symbol name display
area" in the Watch Window.)
Auto, Internal Static, and Register variables can be displayed.
Local variables within the current function are automatically displayed in
this window. This area cannot be edited.
User’s Manual
U18604EJ1V0UM
CHAPTER 6 WINDOW REFERENCE
Local variable value display/
setting area
This area is used to display and change local variable values. (Refer to "
Data value display/setting area" in the Watch Window.)
Values are changed through direct input. The location to be changed is
displayed in red and the contents of the change are written into the target
memory when the Enter key is pressed. During user program execution,
however, the change cannot be written (if attempted, an error occurs). The
previous value can be canceled by the ESC key.
(2) Function buttons
Refresh
Updates the contents of this window with the latest watch data.
Close
Closes this window.
[View] Menu (Local Variable Window-dedicated items)
When this window is the current window, the following items are added on [View] menu.
Bin
Displays binary numbers.
Oct
Displays octal numbers.
Dec
Displays decimal numbers.
Hex
Displays octal numbers.
String
Displays character strings.
Proper
Displays the default value of each variable. (default)
Context Menu
The menu items are effective for the selected line or item, not the position where the mouse pointer was clicked
(same operation as when selecting the main menu with the same name).
Add Watch...
Opens the Add Watch Dialog Box.
Bin
Displays the selected line in binary numbers.
Oct
Displays the selected line in octal numbers.
Dec
Displays the selected line in decimal numbers.
Hex
Displays the selected line in hexadecimal numbers.
String
Displays the selected line as a character string.
Proper
Displays the selected line as the default value of each variable.
Symbols are displayed in accordance with the setting of the Debugger Option Dialog
Box. (default)
User’s Manual
U18604EJ1V0UM
199
CHAPTER 6 WINDOW REFERENCE
Stack Window
This window is used to display or change the current stack contents of the user program. (Refer to "5.6.7 Stack
trace display function".)
The window corresponding to the stack contents can be jumped to using the Jump function.
A number of other operations using Context Menu, Function buttons, etc., can be performed in this window.
Caution:
The stack trace display function may not operate correctly if there is a function that does not create
a stack frame.
Remark:
[ERROR] may be displayed during prologue or epilogue processing of a function.
Figure 6-32 Stack Window
(4)
(1)
(2)
(3)
- Opening
- Explanation of Each Area
- [View] Menu (Stack Window-dedicated items)
- Context Menu
Opening
Click the Stk button, or select [Browse] menu -> [Stack Trace].
200
User’s Manual
U18604EJ1V0UM
CHAPTER 6 WINDOW REFERENCE
Explanation of Each Area
(1) Stack frame number display area
This area assigns numbers to and displays the stack contents.
A stack frame number is a natural number starting from 1. The shallower the nesting of the stack, the higher the
number. This means that a function having stack number one higher than that of a certain function is the function
that calls the certain function.
(2) Stack frame contents display area
This area displays the stack frame contents.
It displays function names or local variable names. Note, however, that this area cannot be edited.
If the stack contents
consist of a function
They are displayed as follows:
[program name$file name#function name (argument list) #line number]
If this line is double-clicked, the operation will be the same as jumping to the Source
Window of the Jump function (i.e., the local variable in the function to which execution
has jumped will be displayed in the Local Variable Window).If the function has a local
variable, the local variable will be displayed on the next and subsequent lines.
If the stack contents
consist of a local
variable
Its type and name are displayed. (Refer to " Watch Window".) Note that the internal
Static and Register variables are not displayed.
(3) Stack contents display/setting area
This area is used to display or change the stack contents.
Values are changed through direct input. The location to be changed is displayed in red and the contents of the
change are written into the target memory when the Enter key is pressed. During user program execution,
however, the change cannot be written (if attempted, an error occurs). The previous value can be canceled by the
ESC key.
If the stack contents
are a function
"--" is displayed and the function cannot be changed.
If the stack contents
are a local variable
The variable value is displayed. (Refer to " Watch Window".)
(4) Function buttons
Refresh
Updates the contents of this window with the latest watch data.
Shrink <<<
Collapses the local variable list of the selected function.
Expand >>>
(when the
<Shrink<<<> button
is clicked)
Displays the local variable list of the selected function.
Close
Closes this window.
User’s Manual
U18604EJ1V0UM
201
CHAPTER 6 WINDOW REFERENCE
[View] Menu (Stack Window-dedicated items)
When this window is the current window, The following items are added on [View] menu.
Bin
Displays binary numbers.
Oct
Displays octal numbers.
Dec
Displays decimal numbers.
Hex
Displays octal numbers.
String
Displays character strings.
Proper
Displays the default value of each variable. (default)
Context Menu
Bin
Displays binary numbers.
Oct
Displays octal numbers.
Dec
Displays decimal numbers.
Hex
Displays octal numbers.
String
Displays character strings.
Proper
Displays the default value of each variable. (default)
Source Text
Displays the corresponding source text and source line from the jump destination
address specified by the data value at the cursor position. (Refer to "5.16.2 Jump
function".) If no line information exists at the jump destination address, however, you
cannot jump.
Opens the Source Window.
If an active Source Window is open, that window is displayed in the forefront (so that it
can be manipulated).
Assemble
Disassembles and displays starting from the jump destination address specified by the
data value at the cursor position. (Refer to "5.16.2 Jump function".)
Opens the Assemble Window.
If an active Assemble Window is open, that window is displayed in the forefront (so
that it can be manipulated).
Memory
Displays the memory contents starting from the jump destination address specified by
the data value at the cursor position. (Refer to "5.16.2 Jump function".)
Opens the Memory Window.
If an active Memory Window is open, that window is displayed in the forefront (so that
it can be manipulated).
202
User’s Manual
U18604EJ1V0UM
CHAPTER 6 WINDOW REFERENCE
Memory Window
This window is used to display and change the memory contents. (Refer to "5.7 Memory Manipulation
Function".) Other operations using Context Menu, Function buttons, etc., can be performed in this window.
Moreover, there are two statuses, Active status and static status, for this window. When the window is in the
active status, it has the Trace result with linking window [IECUBE], Jump function. (Refer to "5.16 Functions
Common to Each Window".)
Remark1:
The memory access status (read, write, read & write) can be displayed using different colors.
(Refer to "5.7.2 Access monitor function [IECUBE]".) [IECUBE]
Remark2:
The display start position when the this window is opened is as follows:
First time: Display starts from the first address of the RAM area.
Second and subsequent times: Display starts from the address at which an active status window
was closed. (if an active status window has never been closed, display starts from the first display
start position).
Figure 6-33 Memory Window
(5)
(1)
(2)
(3)
(4)
User’s Manual
U18604EJ1V0UM
203
CHAPTER 6 WINDOW REFERENCE
Figure 6-34 Memory Window (When RRM Function Is Selected)
- Opening
- Explanation of Each Area
- [View] Menu (Memory Window-dedicated items)
- Context Menu
Opening
Click the Mem button, or select [Browse] menu -> [Memory].
Explanation of Each Area
(1) Addr
This area displays memory addresses.
An arbitrary address can be selected by clicking the relevant line in this area. The selected address is
highlighted.
204
User’s Manual
U18604EJ1V0UM
CHAPTER 6 WINDOW REFERENCE
(2) +0 +1 +2....
This area is used to display and change memory contents, and to display the access status. (Refer to "5.7.2
Access monitor function [IECUBE]".)
Display
Symbol Substituted When
Display Information is Saved
in View File
Meaning
Green
R
Read
Red
W
Write
Blue
A
Read & write
No highlight color
None
Out of measurement range
Memory contents are changed through direct input. The location to be changed is displayed in red and the
contents of the contents of the change are written into the target memory when the Enter key is pressed. The
previous value can be canceled by the ESC key. Up to 256 bytes can be specified at one time.
Remark:
To change the memory contents during user program execution, open the DMM Dialog Box by
clicking the <DMM...> button.
(3) 0 1 2 3....
This area is used to display and change the memory contents in ASCII characters.
This area is displayed when [View] menu -> [Ascii] is selected.
Data can be changed in this area in the same manner as in the memory display area.
The changing method is the same as in (2) +0 +1 +2.....
Remark:
When the display address is changed, the position of the cursor in the ASCII display area is not
synchronized.
(4) ID Tag
This area displays the ID tag for the data flash memory.
The ID tag is a bit whose one bit is assigned to one word of the data flash memory and is used to detect power
failure. When it is "0", it means that data in the word has been written normally.
The setting for this area can be changed between "0" and "1".
Whether this area is displayed can be switched by selecting [ID tag] from the [View] menu (default: hidden). This
area is displayed exclusively with the area "(3) 0 1 2 3....".
User’s Manual
U18604EJ1V0UM
205
CHAPTER 6 WINDOW REFERENCE
(5) Function buttons
Search...
Opens the Memory Search Dialog Box and searches for character strings from the
displayed memory contents, or memory contents.
Selected data (a memory value) is displayed in the Memory Search Dialog Box as data
to be searched.If the Memory Search Dialog Box is opened without data specified,
specify data from the keyboard.
The results of the search is highlighted in the Memory window.
<<
Searches the memory contents satisfying the search condition set in the Memory
Search Dialog Box, forward (upward on screen) from the address at the cursor
position.
This button is displayed as the <Stop> button during a search.
>>
Searches the memory contents satisfying the search condition set in the Memory
Search Dialog Box, backward (downward on screen) from the address at the cursor
position.
This button is displayed as the <Stop> button during a search.
Stop(searching)
Stops searching.
Refresh
Updates the contents of the window with the latest data.
DMM...
Opens the DMM Dialog Box.
Close
Closes this window.
[View] Menu (Memory Window-dedicated items)
The following items are added in the [View] menu , when the Memory Window is active.
Bin
Displays binary numbers.
Oct
Displays octal numbers.
Dec
Displays decimal numbers.
Hex
Displays hexadecimal numbers (default).
Nibble
Displays in 4-bit units.
Byte
Displays in 8-bit units (default).
Half Word
Displays in 16-bit units.
Word
Displays in 32-bit units.
Ascii
Selects whether ASCII characters are displayed or not.
Selected: Displayed
Cleared: Hidden (default)
ID tag
Switches whether to display the data flash memory ID tag.
Selected: Displayed
Not selected: Hidden (default)
This ID tag display is displayed exclusively with the Ascii display.
Little Endian
Displays in little endian (default).
Big Endian
Displays in big endian.
Access Monitoring [IECUBE]
Sets about Access monitor function.
206
User’s Manual
U18604EJ1V0UM
CHAPTER 6 WINDOW REFERENCE
Clear [IECUBE]
Clears the display color through the access monitor function.
Accumulative [IECUBE]
Enables/disables cumulative display of access status (memory content change).
Selected: Cumulative display of memory contents changes
Not selected: Display of only memory contents changes from previous update.
Context Menu
The menu items are effective for the selected line or item, not the position where the mouse pointer was clicked
(same operation as when selecting the main menu with the same name).
Move...
Moves the display position.
Opens the Address Move Dialog Box.
RRM Setting...
Opens the RRM Setting Dialog Box. [IECUBE]
Bin
Displays binary numbers.
Oct
Displays octal numbers.
Dec
Displays decimal numbers.
Hex
Displays hexadecimal numbers. (default)
Nibble
Displays in 4-bit units.
Byte
Displays in 8-bit units. (default)
Half Word
Displays in 16-bit units.
Word
Displays in 32-bit units.
Ascii
Selects whether ASCII characters are displayed or not.
Selected: Displayed
Cleared: Hidden (default)
ID tag
Switches whether to display the data flash memory ID tag.
Selected: Displayed
Cleared: Hidden (default)
This ID tag display is displayed exclusively with the Ascii.
Clear Access Monitoring
[IECUBE]
Clears the display color through the access monitor function.
Accumulative
[IECUBE]
Enables/disables cumulative display of access status (memory content change).
Selected: Cumulative display of memory contents changes
Cleared: Display of only memory contents changes from previous update.
User’s Manual
U18604EJ1V0UM
207
CHAPTER 6 WINDOW REFERENCE
Memory Search Dialog Box
This dialog box is used to search the memory contents of the part of the Memory Window at which the cursor is
located. (Refer to "5.7 Memory Manipulation Function".)
If the cursor is placed in memory display area in the Memory Window, the specified data is treated as a binary
data string, and if the cursor is placed in the ascii display area, the specified data is treated as an ASCII character
string, and the contents of these respective areas are searched.
By setting each item and then clicking the <Find Next> button, searching can be started. By clicking the <Set
Find> button, the direction buttons ("<<" and ">>") in the Memory Window can be used for the search.
Caution:
Non-mapped, peripheral I/O registers, and I/O protect areas are not searched.
Figure 6-35 Memory Search Dialog Box
(2)
(1)
- Opening
- Explanation of Each Area
Opening
When the Memory Window is the current window, select [View] menu -> [Search...], or click the <Search...>
button in the same window.
208
User’s Manual
U18604EJ1V0UM
CHAPTER 6 WINDOW REFERENCE
Explanation of Each Area
(1) Search condition specification area
Find What:
Unit:
This area is used to specify the data to be searched. (Up to 256 character.)
In the default condition, the string selected in the window that called this dialog box
is displayed. As necessary, the character string displayed can be changed. Up to
16 input histories can be recorded.
When searching in
memory display
area
Up to 16 data items can be specified. Delimit each data with
a "blank character".
When searching in
ascii display area
Up to 256 characters can be specified. A "blank character"
in the data is treated as a blank character.
This area is used to specify the number of bits of the data to be searched in memory display area.
Byte
Searches the data as 8-bit data. (default)
Half Word
Searches the data as 16-bit data.
Word
Searches the data as 32-bit data.
Scan Whole Region
This should be selected to search the entire specified range.
Direction
This area is used to specify the direction of the search.
Address:
Up
Forward search. Searches data forward (upward on
screen) from the current position of the cursor.
Down
Backward search. Searches data backward (downward on
screen) from the current position of the cursor. (default)
This area is used to specify the address range to be searched.
The default radix for inputting a numeric value is hexadecimal. An address can be
also specified by a symbol or expression. (Refer to "Table 5-6 Specifying
Symbols".)
(2) Function buttons
Find Next
Searches the specified data in accordance with a given condition.
If the specified character string is found as a result of a search, it is highlighted.
To continue searching, click this button again.
Set Find
Sets the specified condition as the search condition and closes this dialog box.
Stop (searching)
Stops searching.
Close
Closes this dialog box.(During searching, this button is replaced by the <Stop>
button.)
Help
Displays this dialog box online help files.
User’s Manual
U18604EJ1V0UM
209
CHAPTER 6 WINDOW REFERENCE
Memory Fill Dialog Box
This dialog box is used to fill the memory contents in the Memory Window with specified codes (fill code). (Refer
to "5.7 Memory Manipulation Function".)
Figure 6-36 Memory Fill Dialog Box
(1)
(2)
- Opening
- Explanation of Each Area
Opening
Select [Edit] menu -> [Memory] -> [Fill...].
Explanation of Each Area
(1) Memory fill range specification area
Address
This area is used to specify the filling range and fill code.
From:
Specifies the filling range (start address -- end address).
The default radix for inputting a numeric value is hexadecimal. An
address can be also specified by a symbol or expression. (Refer to
"Table 5-6 Specifying Symbols".)
fill code =>
Specify the data (fill code) used when filling the range specified in
"From: “.
Up to 16 binary data strings (byte data strings) can be specified.
Delimit each data with a "blank character".
(2) Function buttons
OK
Fills the specified data in accordance with a given condition.
Stop (filling)
Stops filling.
Cancel
Closes this dialog box. (During filling, this button is replaced by the <Stop> button.)
Restore
Restores the status before this dialog box was opened.
Help
Displays this dialog box online help files.
210
User’s Manual
U18604EJ1V0UM
CHAPTER 6 WINDOW REFERENCE
Memory Copy Dialog Box
This dialog box is used to copy the memory contents in the Memory Window. (Refer to "5.7 Memory
Manipulation Function".)
Figure 6-37 Memory Copy Dialog Box
(1)
(2)
- Opening
- Explanation of Each Area
Opening
Select [Edit] menu -> [Memory] -> [Copy...].
Explanation of Each Area
(1) Copy range specification area
Address
This area is used to specify the copy source and copy destination addresses.
The default radix for inputting a numeric value is hexadecimal. An address can be also
specified by a symbol or expression. (Refer to "Table 5-6 Specifying Symbols".)
From:
Specify the address range (start address -- end address) of the copy
source.
To:
Specify start address of the copy destination.
(2) Function buttons
OK
Copies the memory contents in accordance with a given condition.
Stop (copying)
Stops copying.
Cancel
Closes this dialog box.(During copying, this button is replaced by the <Stop> button.)
Restore
Restores the status before this dialog box was opened.
Help
Displays this dialog box online help files.
User’s Manual
U18604EJ1V0UM
211
CHAPTER 6 WINDOW REFERENCE
Memory Compare Dialog Box
This dialog box is used to compare the memory contents in the Memory Window. (Refer to "5.7 Memory
Manipulation Function".)
Figure 6-38 Memory Compare Dialog Box
(1)
(2)
- Opening
- Explanation of Each Area
Opening
Select [Edit] menu -> [Memory] -> [Compare...].
Explanation of Each Area
(1) Comparison range specification area
Address
This area is used to specify the comparison source address and comparison
destination address.
The default radix for inputting a numeric value is hexadecimal. An address can be also
specified by a symbol or expression. (Refer to "Table 5-6 Specifying Symbols".)
Mem1:
Specify the address range (start address -- end address) of the
comparison source.
Mem2:
Specify the start address of the comparison destination.
(2) Function buttons
OK
Compares the memory contents in accordance with a given condition.
If no difference is found as a result of comparison, " Wf200: No difference
encountered." is displayed. If a difference is found, the Memory Compare Result
Dialog Box is opened.
Stop (comparison)
Stops memory comparison.
Cancel
Closes this dialog box.(During comparison, this button is replaced by the <Stop>
button.)
Restore
Restores the status before this dialog box was opened.
Help
Displays this dialog box online help files.
212
User’s Manual
U18604EJ1V0UM
CHAPTER 6 WINDOW REFERENCE
Memory Compare Result Dialog Box
This dialog box is displayed if any difference is found in the memory contents when the memory has been
compared in the Memory Compare Dialog Box. (Refer to "5.7 Memory Manipulation Function".)
Figure 6-39 Memory Compare Result Dialog Box
(1)
(2)
- Explanation of Each Area
Explanation of Each Area
(1) Comparison result display area
This area displays the results of comparing the memory. Only differences that have been found as a result of
comparison are displayed.
Mem1 Addr
Displays a comparison source address in which a difference has been found.
Memory
Displays the data in which a difference has been found.
(Left: Comparison source data, Right: Comparison destination data).
Mem2 Addr
Displays the comparison destination address at which a difference has been found.
(2) Function buttons
Close
Closes this dialog box.
Help
Displays this dialog box online help files.
User’s Manual
U18604EJ1V0UM
213
CHAPTER 6 WINDOW REFERENCE
DMM Dialog Box
This dialog box is used to set addresses and data for DMM (Dynamic Memory Modification). (Refer to "5.14
DMM Function".)
The memory contents are rewritten via the DMM function during user program execution.
Caution:
When IECUBE is connected, a pseudo DMM function is performed. With pseudo DMM, a break
occurs instantaneously upon a write during the user program execution.
Figure 6-40 DMM Dialog Box(Ex: When "Memory" is selected)
(1)
(3)
(2)
- Opening
- Explanation of Each Area
Opening
Select [Edit] menu -> [DMM...], or click the <DMM...> button in the Memory Window / Register Window / IOR
Window.
Explanation of Each Area
(1) DMM target selection area
This area is used to select the target for DMM. The items displayed in (2) DMM setting area change by selecting
the option button.
Memory
DMM is performed for the memory.
Register
DMM is performed for the register.
IOR
DMM is performed for the IOR.
Remark:
If the DMM Dialog Box is opened via the Memory Window, Register Window, or IOR Window, the
corresponding option button has already been selected.
214
User’s Manual
U18604EJ1V0UM
CHAPTER 6 WINDOW REFERENCE
(2) DMM setting area
(a) When Memory is selected
Memory Address:
This area is used to specify the memory address to which data is to be
written.
The default radix for inputting a numeric value is hexadecimal. An address
can be also specified by a symbol or expression. (Refer to "Table 5-6
Specifying Symbols".)
Write Data:
This area is used to specify the data to be written to the memory address
specified in "Memory Address:".
Data Size:
This area is used to specify the size of the data specified in "Write Data:" to
be written.
Byte:
Writes the data as 8-bit data.
Half Word:
Writes the data as 16-bit data.
Word:
Writes the data as 32-bit data.
(b) When Register is selected
Register Name:
This area is used to specify the register name to which data is to be written.
The case is distinguished. Both functional and absolute names can be used
for specification.
Write Data:
This area is used to specify the data to be written to the register specified in
"Register Name:".
(c) When IOR is selected
IOR Name:
This area is used to specify the IOR name to which data is to be written.
The case is distinguished. The read-only SFRs cannot be specified.
Write Data:
IORThis area is used to specify the data to be written to the register specified
in "IOR Name:".
(3) Function buttons
Set
Writes the data in accordance with a given condition.
Close
Closes this dialog box.
Help
Displays this dialog box online help files.
User’s Manual
U18604EJ1V0UM
215
CHAPTER 6 WINDOW REFERENCE
Register Window
This window is used to display and change registers (program register/system register). (Refer to "5.8 Register
Manipulation Function".)
Other operations using Context Menu, Function buttons, etc., can be performed in this window.
Each area in this window are the jump pointer of the Jump function.
Caution:
The ECR register value cannot be changed and the DBPC and DBPSW registers cannot be used
in the Register window.
Figure 6-41 Register Window
(2)
(1)
- Opening
- Explanation of Each Area
- [View] Menu (Register Window-dedicated items)
- Context Menu
Opening
Click the Reg button, or select [Browse] menu -> [Register].
216
User’s Manual
U18604EJ1V0UM
CHAPTER 6 WINDOW REFERENCE
Explanation of Each Area
(1) Register value display /change area
The left area displays register names, and the right area displays register values.
Register values are changed through direct input. The location to be changed is displayed in red and the
contents of the contents of the change are written into the target memory when the Enter key is pressed. During
user program execution, however, the change cannot be written (if attempted, an error occurs). The previous value
can be canceled by the ESC key.
The upper area displays the program register, and the lower area displays the system register.
The program register display/
change area
This area is used to display and change the program register.
The system register display/
change area
This area is used to display and change the system register.
By double-clicking "+", flag name and flag value are displayed (first
character changes from "+" to "-"). Expanded display is canceled by doubleclicking "-" (first character changes from "-" to "+").
Caution:
When overflow of a register occurs due to an illegal value entered by the user, the register will be
updated with a value of 0xFFFFFFFF.
(2) Function buttons
Refresh
Updates the contents of the window with the latest data.
DMM...
Opens the DMM Dialog Box.
Close
Closes this window.
[View] Menu (Register Window-dedicated items)
The following items are added in the [View] menu , when the Register Window is active.
Bin
Displays binary numbers.
Oct
Displays octal numbers.
Dec
Displays decimal numbers.
Hex
Displays hexadecimal numbers (default).
Pick Up
Displays only the registers selected in the Register Select Dialog Box.
Select...
Opens the Register Select Dialog Box.
User’s Manual
U18604EJ1V0UM
217
CHAPTER 6 WINDOW REFERENCE
Context Menu
Add Watch...
Registers a selected character string to the Watch window.
Opens the Add Watch Dialog Box.
Bin
Displays binary numbers.
Oct
Displays octal numbers.
Dec
Displays decimal numbers.
Hex
Displays hexadecimal numbers (default).
Pick Up
Displays only the registers selected in the Register Select Dialog Box.
Select...
Opens the Register Select Dialog Box.
218
User’s Manual
U18604EJ1V0UM
CHAPTER 6 WINDOW REFERENCE
Register Select Dialog Box
This dialog box is used to select registers that are not displayed in the Register Window. (Refer to "5.8 Register
Manipulation Function".)
Figure 6-42 Register Select Dialog Box
(1)
(2)
- Opening
- Explanation of Each Area
Opening
When the Register Window is the current window, select [View] menu -> [Select...].
Explanation of Each Area
(1) Display register selection area
Display:
Registers displayed in the Register Window.
Button
The following buttons are used to change register to be displayed.
Two or more registers can be selected by clicking any of the above buttons while holding
down the Ctrl or Shift key.
No Display:
<< Show
Moves the register selected from the "No Display:" list to "Display:".
Hide >>
Moves the register selected from the "Display:".list to "No Display:“.
<< Show All
Moves all registers to "Display:".
Hide All >>
Moves all registers to "No Display:".
Registers not displayed in the Register Window.
User’s Manual
U18604EJ1V0UM
219
CHAPTER 6 WINDOW REFERENCE
(2) Function buttons
OK
Reflects the selection in this dialog box in the Register Window and closes this dialog box.
Cancel
Cancels the changes and closes this dialog box.
Restore
Restores the status before this dialog box was opened.
Help
Displays this dialog box online help files.
220
User’s Manual
U18604EJ1V0UM
CHAPTER 6 WINDOW REFERENCE
IOR Window
This window is used to display and change the contents of peripheral I/O registers and the I/O ports that have
been registered in the Add I/O Port Dialog Box. (Refer to "5.8 Register Manipulation Function".)
A number of other operations using Context Menu, Function buttonsetc., can be performed in this window.
Caution1:
However, that the values of read-only peripheral I/O registers and I/O ports cannot be changed. In
addition, the peripheral I/O registers and I/O ports that cause the device to operate when they are
read are read-protected and therefore cannot be read. To read these registers, select a register,
and select and execute [Compulsion Read] from the Context Menu.
Caution2:
During user program execution, the IOR contents are updated at every sampling time set in the
Extended Option Dialog Box (refer to "5.13 RRM Function"). However, updating is not performed
when the RAM monitor function is OFF. [IECUBE]
Remark1:
The display start position when the window is opened is as follows.
First time: Display from peripheral I/O registers of minimum address
Second and subsequent times: Display from first peripheral I/O registers when window was last
closed
Remark2:
If the device supports programmable I/O registers and a programmable I/O area has been set in
the Configuration Dialog Box, the programmable I/O registers and expansion peripheral I/O registers are also displayed. If the value of an I/O port address is defined, the I/O port name is displayed
in light color.
Figure 6-43 IOR Window
(2)
(1)
User’s Manual
U18604EJ1V0UM
221
CHAPTER 6 WINDOW REFERENCE
- Opening
- Explanation of Each Area
- [View] Menu (IOR Window-dedicated items)
- Context Menu
- Cautions
Opening
Click the IOR button, or select [Browse] menu -> [IOR].
Explanation of Each Area
(1) IOR display/change area
Name
This area displays the names of peripheral I/O registers and I/O ports.
If the value of an I/O port address is not defined, the I/O port name displayed in light color.
Attribute
This area displays the attributes of peripheral I/O registers and I/O ports.
This area displays the read/write attributes, access types, and displays and absolute
addresses from the left side.
When the bit peripheral I/O registers is displayed, bit-offset value is also displayed.
It can be specified whether this area is displayed or not, by selecting [View] menu ->
[Attribute].
Read/Write Attribute
R
Read only
W
Write only
R/W
Read/write
*
Register that is read via an emulation register to prevent the device from
operating when this register is read.
To read this attribute directly from a peripheral I/O registers, execute
[View] menu -> [Compulsion Read].
Even a write-only peripheral I/O registers can also be read via an
emulation register.
However, some devices do not support this function.
Access Type
222
1
Can be accessed in Bit units.
8
Can be accessed in Byte units.
16
Can be accessed in Half Word units.
32
Can be accessed in Word units.
User’s Manual
U18604EJ1V0UM
CHAPTER 6 WINDOW REFERENCE
Value
This area is used to display and change the contents of a peripheral I/O registers and I/O
port.
Values are changed through direct input. The location to be changed is displayed in red
and the contents of the contents of the change are written into the target memory when the
Enter key is pressed. During user program execution, however, the change cannot be
written (if attempted, an error occurs). The previous value can be canceled by the ESC
key.
Note that the values of read-only peripheral I/O registers and I/O ports cannot be changed.
The value of read-protected peripheral I/O registers and I/O ports can be read by selecting
Context Menu -> [Compulsion Read].
The contents are displayed differently as follows, depending on the attribute:
Black Display
Read only or read/write
--
Write only
**
Value changes if read
(2) Function buttons
Refresh
Updates the contents of the window with the latest data.
DMM...
Opens the DMM Dialog Box.
Close
Closes this window.
[View] Menu (IOR Window-dedicated items)
When this window is the current window, the following items are added on [View] menu.
Bin
Displays binary numbers.
Oct
Displays octal numbers.
Dec
Displays decimal numbers.
Hex
Displays octal numbers. (default)
Sort By Name
Displays in alphabetical order.
Sort By Address
Displays in address order. (default)
Unsort
Does not sort.
Attribute
Switches on/off display of "Attribute".
Pick Up
Displays only the registers selected in the IOR Select Dialog Box.
Select...
Opens the IOR Select Dialog Box.
Compulsion Read
Forcibly reads the peripheral I/O registers that are disabled from being read because
their values will be changed, or the data of the I/O ports and I/O protect area added in
the Add I/O Port Dialog Box.
User’s Manual
U18604EJ1V0UM
223
CHAPTER 6 WINDOW REFERENCE
Context Menu
Move...
Opens the Address Move Dialog Box.
Add Watch...
Opens the Add Watch Dialog Box.
Add I/O Port...
Opens the Add I/O Port Dialog Box.
Bin
Displays binary numbers.
Oct
Displays octal numbers.
Dec
Displays decimal numbers.
Hex
Displays octal numbers.(default)
Sort By Name
Displays in alphabetical order.
Sort By Address
Displays in address order. (default)
Unsort
Does not sort.
Attribute
Switches on/off display of "Attribute".
Pick Up
Displays only the registers selected in the IOR Select Dialog Box.
Select...
Opens the IOR Select Dialog Box.
Compulsion Read
Forcibly reads the peripheral I/O registers that are disabled from being read because
their values will be changed, or the data of the I/O ports and I/O protect area added in
the Add I/O Port Dialog Box.
Cautions
When the V850E2/ME3 is used, the USB-related registers cannot be accessed without UCLK connected. If a
USB-related register is to be displayed on the IOR Window or Watch Window, therefore, the debugger may hang
up. To avoid this, save the following Tcl command as a text file, and perform batch processing by executing
sourcefile on the console window of the debugger (refer to "CHAPTER 7 COMMAND REFERENCE").
set save_UCKC 0
register UCKC 2
proc BeforeCpuRun {} {
register UCKC $::save_UCKC
}
proc AfterCpuStop {} {
set ::save_UCKC [register UCKC]
register UCKC 2
}
proc AfterCpuReset {} {
set ::save_UCKC 0
register UCKC 2
}
224
User’s Manual
U18604EJ1V0UM
CHAPTER 6 WINDOW REFERENCE
IOR Select Dialog Box
This dialog box is used to select peripheral I/O registers and I/O ports that are not displayed the IOR Window.
(Refer to "5.8 Register Manipulation Function".)
It is also used to specify the sequence in which registers and ports are displayed.
Figure 6-44 IOR Select Dialog Box
(3)
(1)
(2)
- Opening
- Explanation of Each Area
Opening
When the IOR Window is the current window, select [View] menu -> [Select...].
User’s Manual
U18604EJ1V0UM
225
CHAPTER 6 WINDOW REFERENCE
Explanation of Each Area
(1) Displayed peripheral I/O registers selection/display order change area
Display:
Registers displayed in the IOR Window.
Two or more registers can be selected by clicking any of the above buttons while holding
down the Ctrl or Shift key.
Pick Up
The following buttons are used to change peripheral I/O registers to be displayed.
Arrange
No Display:
<< Show
Moves the register selected from the "No Display:" list to "Display:".
Hide >>
Moves the register selected from the "Display: ".list to "No Display:".
<< Show All
Moves all registers to "Display:".
Hide All >>
Moves all registers to "No Display:".
The following buttons are used to change the display sequence in "Display:".
If the display arrangement is changed, multiple lines cannot be selected. Select one line at
a time.
Top
Moves the selected register to the top of the list.
Up
Moves the selected register one line up.
Down
Moves the selected register one line down.
Bottom
Moves the selected register to the bottom of the list.
Registers not displayed in the IOR Window.
(2) Display order change buttons
Sort by
The following buttons are used to change the display sequence in "No Display:".
Name
Displays in alphabetical order.
Address
Displays in address order.
(3) Function buttons
OK
Reflects the selection in this dialog box in the IOR Window and closes this dialog box.
Cancel
Cancels the changes and closes this dialog box.
Restore
Restores the status before this dialog box was opened.
Help
Displays this dialog box online help files.
226
User’s Manual
U18604EJ1V0UM
CHAPTER 6 WINDOW REFERENCE
Add I/O Port Dialog Box
This dialog box is used to register an I/O port to be added to the IOR Window. (Refer to "5.8 Register
Manipulation Function".)
Figure 6-45 Add I/O Port Dialog Box
(4)
(3)
(1)
(2)
- Opening
- Explanation of Each Area
Opening
Select [Option] menu -> [Add I/O Port...].
Explanation of Each Area
(1) I/O Port List:
This area lists the I/O ports currently registered.
If a new I/O port is registered, it is added to this list. An I/O port already registered can be selected and changed
or deleted by (3) Buttons.
User’s Manual
U18604EJ1V0UM
227
CHAPTER 6 WINDOW REFERENCE
(2) I/O port specification area
Name:
This area is used to specify an I/O port name to be added (up to 15 characters long).
Address:
This area is used to specify the address of the I/O port to be added.
The default radix for inputting a numeric value is hexadecimal. An address can be also
specified by a symbol. (Refer to "Table 5-6 Specifying Symbols".)
The address that can be set in this area is either a Target area address or peripheral I/
O registers area address.
Access
This area is used to select the access size of the I/O port to be added.
Read / Write
Byte
8-bit unit (default)
Half Word
16-bit unit
Word
32-bit unit
This area is used to specify the access attribute of the I/O port to be added.
In the default condition, all the attributes are not selected (i.e., the I/O port can be both
read and written).
Read Only
Read Only
Write Only
Write only
Read Protect
Read-protected
(3) Buttons
Add
Adds an I/O port of the specified address.
Change
Changes the setting of the I/O port selected in "I/O Port List:".
Delete
Deletes the I/O port selected in "I/O Port List:".
(4) Function buttons
OK
Reflects the results of addition in the IOR Window and closes this dialog box.
Cancel
Cancels the changing, closes this dialog box.
Restore
Restores the original status.
Help
Displays this dialog box online help files.
228
User’s Manual
U18604EJ1V0UM
CHAPTER 6 WINDOW REFERENCE
Timer Dialog Box
[IECUBE]
This dialog box is used to register and set timer event conditions, and display execution time measurement
results. (Refer to "5.12 Event Function" and "5.9 Timer Function [IECUBE]".)
The "Execution time display area" can be constantly displayed as the Timer Result Dialog Box by clicking the
<View Always> button.
Registration and setting of timer event conditions is done by setting each item (256 items max.) in this dialog box
and then pressing the <OK> button. The registered timer event conditions are managed by the Event Manager.
The number of timer event conditions that can be simultaneously used (validated) is limited. (Refer to "5.12.4
Number of enabled events for each event condition".)
The execution time measurement result is displayed when the set timer event condition is selected.
Remark1:
The measurement result display contents are updated at each sampling time of the RRM Function,
even during user program execution.
Remark2:
Timer event condition setting/enable/disable/delete operations are possible even during user program execution.
Figure 6-46 Timer Dialog Box
(6)
(5)
(1)
(3)
(2)
(4)
- Opening
- Explanation of Each Area
Opening
Click the Tim button, or select [Event] -> [Timer...] on the menu.
User’s Manual
U18604EJ1V0UM
229
CHAPTER 6 WINDOW REFERENCE
Explanation of Each Area
(1) Timer event condition setting area
Timer Name:
This area is used to set a timer event name.
Directly input an alphanumeric string of up to eight characters as a name.
To display the contents of an already created event condition, select from the drop-down
list.
To display from user program execution until break, specify "Run-Break". (Refer to "5.9.2
Run-Break event".)
The mark on the left of this area indicates the utilization status of events. (Refer to "Table
5-18 Event Icon".) The gray mark indicates that an event condition is being edited and has
not been registered yet.
By clicking the left mark, an event condition can be validated or invalidated.
Start Event:
End Event:
This area is used to set an event condition for the timer.
The number of event conditions that can be registered in this area is one for each of the
start and end conditions.
Setting of event conditions is easily done by dragging the icon of the event to be set from
the event manager area and dropping it in this area. For details, refer to "5.12.3 Setting
event conditions".
Time
This area is used to select the unit in which the (2) Execution time display area is to be
displayed.
Count Rate
This area displays timer count rate values (the values set in (2) Timer [IECUBE] in the
Extended Option Dialog Box). (The timer count rate value at the time of the event creation
is displayed when the contents of the existing timer event conditions are displayed. The
current timer count rate value is displayed when the event is newly created, or when the
contents of the Run-Break event conditions are displayed.) This area cannot be edited.
When the timer count rate value of the existing timer event conditions needs to be
changed, first, change the value of (2) Timer [IECUBE] in the Extended Option Dialog Box.
Then, reset the timer event conditions. When the timer count rate value at the time of the
event creation is different from the value set in (2) Timer [IECUBE] in the Extended Option
Dialog Box), the timeout time is affected. Therefore, the value in this area is displayed in
red (refer to "5.9.3 Cautions").
(2) Execution time display area
This area displays the result of measuring the execution time of the program.
Only "Total" is displayed for Run-Break.
Measurement results that cannot be trusted due to counter overflow are displayed in red.
Pass:
Number of passes
Total:
Total execution time in the measurement zone specified by start event and end
event conditions
Average:
Average execution time
Max:
Maximum execution time
Min:
Minimum execution time
<Initialize>
Clears the measurement results.
<Copy>
Copies the measurement result to the clipboard in text format.
<View Always>
Opens the Timer Result Dialog Box.
230
User’s Manual
U18604EJ1V0UM
CHAPTER 6 WINDOW REFERENCE
Table 6-16 Measurable Values
Connected IE
[IECUBE]
Measurable Execution Time
(Total, Max, Min = 33bit, External clock = 50 MHz)
Approx. 2.8 minutes max. (1 division, resolution = 20 nsec)
Approx. 195.2 hours max.(4K division, resolution = 81920
nsec)
Measurable
Execution Count
16 bit
65,535 times max.
(3) Time Out Break
This area is used to set the timeout break for the section measurement time specified in "Start Event:, End
Event:" (time from the establishment of timer start event to the establishment of timer end event).
ON
A timeout break occurs (execution is terminated) if the section measurement time
exceeds the specified timeout time.
Specify the time-out time in the text boxes. The values up to the maximum measurable
time can be specified.
OFF
No timeout break occurs. (default)
Overflow
A timeout break occurs (execution is terminated) if the section measurement time
exceeds the maximum measurable time (refer to "Table 6-16 Measurable Values").
Remark:
In the case of a Run-Break event, this area is fixed to the "OFF" position and disabled.
(4) Event manager area
This area displays the list of registered events.
Each event condition can be set easily just by dragging and dropping the event icon displayed in this area onto
the event setting area in each event setting dialog box. (Refer to "5.12.3 Setting event conditions".)
This area is common to all event-related dialog boxes. (Refer to "(2) Event manager area" in the " Break Dialog
Box".)
(5) Function buttons (for event condition contents display, etc.)
These buttons are used to display or delete the event conditions displayed in the event condition setting area,
and to display or hide the Event manager area. This area is common to all event-related dialog boxes.(Refer to "(3)
Function buttons (for event condition contents display, etc.)" in the " Break Dialog Box".)
(6) Function buttons (for registering, deleting, validating, and invalidating event conditions)
These buttons are used to register, delete, validate, and invalidate the events.
The event with the specified event condition is registered or set (validated) by clicking the <OK> (or <Set>)
button. This area is common to all event-related dialog boxes. (Refer to "(4) Function buttons (for registering,
deleting, validating, and invalidating event conditions)" in the " Break Dialog Box".)
User’s Manual
U18604EJ1V0UM
231
CHAPTER 6 WINDOW REFERENCE
Timer Result Dialog Box
[IECUBE]
This dialog box displays the results of measuring the execution time. (Refer to "5.9 Timer Function [IECUBE]".)
By clicking the <View Always> button in the Timer Dialog Box, this dialog box is opened corresponding to a timer
event condition on a one-to-one basis. Two or more of this dialog box can be simultaneously opened.
Up to 256 + 1 (Run-Break event) Timer Result Dialog Boxes can be opened, the number of events that can be
measured at the same time is the number of valid events described in "5.12.4 Number of enabled events for each
event condition" + 1 (Run-Break event).
Remark:
The measurement result display contents are updated at each sampling time of the RRM Function,
even during user program execution.
Figure 6-47 Timer Result Dialog Box
(1)
(2)
- Opening
- Explanation of Each Area
Opening
Select a timer event condition in the Timer Dialog Box , click the <View Always> button.
Explanation of Each Area
(1) Execution time display area
Same area is Timer Dialog Box.
Pass:
Number of passes
Total:
Total execution time in the measurement zone specified by start event and end event
conditions
Average:
Average execution time
Max:
Maximum execution time
Min:
Minimum execution time
232
User’s Manual
U18604EJ1V0UM
CHAPTER 6 WINDOW REFERENCE
(2) Function buttons
Initialize
Clears the measurement results.
Copy
Copies the measurement result to the clipboard in text format.
Close
Closes this dialog box.
Help
Displays this dialog box online help files.
User’s Manual
U18604EJ1V0UM
233
CHAPTER 6 WINDOW REFERENCE
Trace View Window
[IECUBE]
This window used to display the trace results. (Refer to "5.10 Trace Function [IECUBE]".)
Display updates are performed during breaks or during step execution.
This window has Mixed display mode (Trace View Window). Also, It has "5.16.3 Trace result with linking window
[IECUBE]".
Other operations using Context Menu, Function buttons, etc., can be performed in this window.
Figure 6-48 Trace View Window
(4)
(1)
(2)
(3)
Frame Time Fetch access display area
Data access display area
- Opening
- Explanation of Each Area
- [View] Menu (Trace View Window-dedicated items)
- Context Menu
Opening
Click the TrW button, or select [Browse] menu -> [Trace].
234
User’s Manual
U18604EJ1V0UM
DisAsm
CHAPTER 6 WINDOW REFERENCE
Explanation of Each Area
(1) Point mark display area
This area displays the Event Setting Status (Event Mark).
If an execution event or access event is set at the corresponding trace address, the mark corresponding to the
type of the event is displayed.
The mark displayed is not that during trace but an event mark that is set when the trace result is displayed.
(2) Trace mode display area
This area displays the type of tracer mode.
A
A start or an end frame (section trace or qualify trace)
T
Delay trigger frame
M
DMA point access frame (DMA start point and end point) (Refer to "5.10.7 DMA point
trace function".)
N
Frame for which not all the trace data was fetched
(3) Trace result display area
This area displays the trace results.
Complement frames are displayed in gray.
In complement frames, "Frame", "Fetch access display area", and "DisAsm" are displayed only.
Whether each of the following sub-areas is displayed or not can be selected in the Trace Data Select Dialog Box.
Frame
This area displays the trace flame number.
Time
This area displays the number of clocks required for the target chip from the
execution start of the program to the execution start of an instruction of each frame
or generation of memory access cause.
In complement frames, this area is not displayed.
The display contents can be switched between clock count display and time display
in the Trace Data Select Dialog Box.
For the relationship between the timer count division ratio and maximum
measurement time, refer to "Table 6-5 Relationship Between Time Tag Counter
Division Ratio and Maximum Measurement Time (Time tag counter (Trace))". The
timetag and time measurement are performed using an external clock (50MHz).
Note: If overflow occurs, the time tag maximum value is displayed in red.
Fetch access display
area
This area displays the result of fetching the program.
In the case of a complement frame, only "Address" and "Data" are displayed.
User’s Manual
U18604EJ1V0UM
235
CHAPTER 6 WINDOW REFERENCE
Address
Displays the fetch address
Data
Displays the fetch data
Status
The following types of statuses are available:
Data access display area
BRM1
Fetching of first byte of first instruction after branch. (The frame
which is BRM1 and is also M1 is included.)
If the fetch address is the start of the symbol, the first line is
highlighted in blue.
M1
Fetching of first byte of instruction
Blank
Any of the following
- Data access frame (3 frames max. (2 frames max when RRM
function is selected.))
- Frame of the second instruction (when two instructions are
executed at the same time)
- Invalid flame
IF
Fetch address that entered interrupt and was canceled (The address
where the breakpoint was set and this correspond.)
INFO
Trace start (delay trigger trace), traces start/trace end (section
trace), Fetch address (qualify trace start/end)
This area displays the result of accessing data.
In complement frames, this area is not displayed.
Address
Displays access address
Data
Displays access data
Status
Displays access status
DisAsm
Remark1:
R
Data read
W
Data write
This area displays the disassemble results.(only when "Status" is BRM1, M1, or
complement frames).
For the frame that only displays access addresses, global symbols are displayed
instead.
When a 6-byte or 8-byte instruction code is displayed, the first 4 bytes are displayed in the first
frame, and the other bytes are displayed in the second and third frames. If two instructions are
executed at the same time, one frame is displayed on two lines. The instruction code at the lower
address is displayed on the first line and the instruction code at the higher address is displayed on
the second line.
Remark2:
To display instruction codes when two instructions are simultaneously executed, one instruction is
displayed on the first line, and the other instruction is displayed on the second line.
236
User’s Manual
U18604EJ1V0UM
CHAPTER 6 WINDOW REFERENCE
(4) Function buttons
Search...
Opens the Trace Search Dialog Box and searches trace results.
The searched result will be highlighted in the Trace View Window.
Same function as [View] menu -> [Search...].
<<
Searches forward (upward on screen) for a trace result that satisfies the search
condition set in the Trace Search Dialog Box.
>>
Searches backward (downward on screen) for a trace result that satisfies the search
condition set in the Trace Search Dialog Box.
Refresh
Updates the contents of the window with the latest data.
Close
Closes this dialog box.
[View] Menu (Trace View Window-dedicated items)
The following items are added in the [View] menu, when the Trace View Window is active.
Select...
Selects the contents to be displayed.
Opens the Trace Data Select Dialog Box.
Mix
Switches whether to display the source file in mixed display mode.
Selected: Mixed display
Cleared: Hidden (default)
Window Synchronize
Links the Trace View Window with the following windows: (Refer to "5.16.3
Trace result with linking window [IECUBE]".)
A selected window is linked.
Source Text
Links the Source Window.
Assemble
Links the Assemble Window.
Memory
Links the Memory Window.
Context Menu
Move...
Moves the display position.
Opens the Trace Move Dialog Box.
Trace Clear
Clears the trace data.
Select...
Selects the contents to be displayed.
Opens the Trace Data Select Dialog Box.
Mix
Switches whether to display the source file in mixed display mode.
Selected: Mixed display
Cleared: Hidden (default)
Window Synchronize
Links the Trace View Window with the following windows: (Refer to "5.16.3 Trace
result with linking window [IECUBE]".)
Source Text
Links the Source Window.
Assemble
Links the Assemble Window.
Memory
Links the Memory Window.
User’s Manual
U18604EJ1V0UM
237
CHAPTER 6 WINDOW REFERENCE
Source Text
Displays the corresponding source text and source line, using the data value at the
cursor position as the jump destination address. (Refer to "5.16.2 Jump function".)
If no line information exists at the jump destination address, however, you cannot
jump.
Opens the Source Window.
If the Source Window in active is open, that window is displayed in the forefront (so
that it can be manipulated).
Assemble
Disassembles and displays starting from the jump destination address specified by
the data value at the cursor position. (Refer to "5.16.2 Jump function")
Opens the Assemble Window.
If the Assemble Window in active is open, that window is displayed in the forefront
(so that it can be manipulated).
Memory
Displays the memory contents starting from the jump destination address specified
by the data value at the cursor position. (Refer to "5.16.2 Jump function")
Opens the Memory Window.
If the Memory Window in active is open, that window is displayed in the forefront
(so that it can be manipulated).
238
User’s Manual
U18604EJ1V0UM
CHAPTER 6 WINDOW REFERENCE
Trace Search Dialog Box
[IECUBE]
This dialog box is used to search in the Trace View Window. (Refer to "5.10 Trace Function [IECUBE]".)
By setting each item and then clicking the <Find Next> button, searching can be started.
By clicking the <Set Find> button, the direction buttons (<< and >>) in the Trace View Window can be used for
the search.
Figure 6-49 Trace Search Dialog Box
(1)
(2)
(6)
(3)
(4)
(5)
- Opening
- Explanation of Each Area
Opening
When the Trace View Window is the current window, select [View] menu -> [Search...], or click the <Search... >
button in the same window.
Explanation of Each Area
(1) Event Status:
This area is used to select a status condition.
If a status condition is omitted, all frames (All status) are searched.
Remark:
The IF and INFO frames are not searched.
All Status
All frames (default)
M1 Fetch
M1 fetch (including BRM1 Fetch)
R/W
Data read/write (including Read, Write)
Read
Data read
Write
Data write
User’s Manual
U18604EJ1V0UM
239
CHAPTER 6 WINDOW REFERENCE
(2) Access Size:
This area is used to select an access size condition.
By specifying an access size condition, the access width of a data condition to be detected by an access event is
determined.
Byte
Searches for a data condition with 8-bit width (only during 8-bit access).
Half Word
Searches for a data condition with 16-bit width (only during 16-bit access).
Word
Searches for a data condition with 32-bit width (only during 32-bit access).
No Condition
Does not search based on access size (nothing can be input to "Data" area).
Bit
Searches for a data condition with 1-bit width (only during 8-bit access)Note1,2
Note1:
If an access event is specified as a status condition, the alternative of Bit is not displayed. If Bit or 1
is specified, an error occurs.
Note2:
In this case, a search is made for a data condition with 1-bit width. Because of the operation of the
simulator, access to a bit is not directly detected; the simulator searches a dummy bit access by
internally setting address conditions and data conditions as follows:
Input example:
Address: 3FF7000.1
Data: 1
->
Setting of trace search:
Address: 3FF7000
Data: 00000010B
Mask: 11111101B
If another bit of the same address is accessed or if all the 8 bits of the same address are accessed,
therefore, a trace data is searched in accordance with the specified status if the address and bit
match the specified value of [address.bit].
Remark:
If no access size condition is specified, a judgment is automatically made from the address condition and data condition, and the following is set:
- Bit, if the address condition is set in bit units
- Byte, if the data condition is set in 8-bit units
- Half Word, if the data condition is set in 16-bit units
- Word, if the address condition is set in 32-bit units
- No Condition, if no data condition is specified
240
User’s Manual
U18604EJ1V0UM
CHAPTER 6 WINDOW REFERENCE
(3) Address condition setting area
This area is used to specify an address condition (may be omitted). The following can be set:
Table 6-17 Settable Range of Address Condition (Trace)
Settable Range
Condition
0 <= address value <= 0xFFFFFFFF
None
0 <= mask value <= 0xFFFFFFFF
None
Address:
Mask:
Set an address condition (lower address - higher address) (may be omitted). The default
radix for inputting a numeric value is hexadecimal. A symbol can be also specified by a
symbol or expression. (Refer to "Table 5-6 Specifying Symbols".)
The following can be set:
Setting as a point
Set a value to only the lower address, or set the same value to the
lower address and the higher address.
Setting as a range
Set a value to only the lower address, or set the same value to the
lower address and the higher address.
Setting as a bit
Set a value to only the lower address, or set the same value to the
lower address and the higher address.
Specify a value in the form of "address.bit". Mask cannot be set.
The value of bit, which indicates the bit position, must be 0 <= bit<=
7.
Set a mask value for an address value (only when "Setting as a point ") (may be omitted).
The address value of a bit whose mask value is 1 may be 0 or 1.
Example1: 0x4000 to 0x40FF satisfy the condition.
Address:
0x4000 to 0x4000
Mask:
0xFF
Example2: 0x4000, 0x4001, 0x4100, and 0x4101 satisfy the condition.
Address:
0x4000 to 0x4000
Mask:
0x101
User’s Manual
U18604EJ1V0UM
241
CHAPTER 6 WINDOW REFERENCE
(4) Data condition setting area
This area is used to set data conditions (may be omitted).
The settable range differs as follows depending on the access size condition specified in "(2) Access Size:".
(Refer to "(5) Data condition setting area" in the " Event Dialog Box" .)
Data:
Set a data value as data conditions. The default radix for inputting a numeric value
is hexadecimal. A data can be also specified by a symbol. (Refer to "Table 5-6
Specifying Symbols".)
Mask:
Set a mask value for the data value (may be omitted).
When a mask is set, the data value for the bit whose mask value is 1 may be 0 or 1.
Example1: 0x4000 to 0x40FF satisfy the condition.
Data
0x4000
Mask
0xFF
Example2: 0x4000, 0x4001, 0x4100, and 0x4101 satisfy the condition.
Data
0x4000
Mask
0x101
(5) Search condition setting area
Scan Whole Region
This should be selected to search the entire specified range.
Frame:
This area is used to specify a frame number to be searched.
The default radix for inputting a numeric value is decimal. A symbol can be also
specified by Frame Number Specification Format.
Direction
This area is used to specify the direction of the search.
Up
Forward search. Searches data forward (upward on screen)
from the current position of the cursor.
Down
Backward search. Searches data backward (downward on
screen) from the current position of the cursor. (default)
(6) Function buttons
Find Next
Searches the specified data in accordance with a given condition.
If the specified frame is found as a result of a search, it is highlighted. To continue
searching, click this button again.
Set Find
Sets the specified condition as the search condition and closes this dialog box.
Close
Closes this dialog box.
Help
Displays this dialog box online help files.
242
User’s Manual
U18604EJ1V0UM
CHAPTER 6 WINDOW REFERENCE
Trace Data Select Dialog Box
[IECUBE]
This dialog box is used to select items to be displayed in the Trace View Window. (Refer to "5.10 Trace Function
[IECUBE]".)
Figure 6-50 Trace Data Select Dialog Box
(2)
(1)
(3)
- Opening
- Explanation of Each Area
Opening
When the Trace View Window is the current window, select [View] -> [Select...] menu.
Explanation of Each Area
(1) Item
This area is used to select items to be displayed in the Trace View Window. Displaying the following fields may
or may not be selected. The field selected is displayed. (Refer to "(3) Trace result display area".)
Frame
Frame field
Timetag
Time field
Whether the "Clock" or "Time" is displayed can be selected.
Instruction Fetch Address
Address (Fetch access display area) field
Instruction Fetch Data
Data (Fetch access display area) field
Instruction Fetch Status
Status (Fetch access display area) field
Memory Access Address
Address (Data access display area) field
Memory Access Data
Data (Data access display area) field
Memory Access Status
Status (Data access display area) field
DisAssemble
DisAsm field
User’s Manual
U18604EJ1V0UM
243
CHAPTER 6 WINDOW REFERENCE
(2) Radix
This area is used to select the radix in which data is to be displayed. Displaying the following items may or may
not be selected.
Instruction Fetch Data:
Data ( Fetch access display area) Field
Memory Access Data:
Data (Data access display area) Field
HEX
Displays hexadecimal numbers. (default)
DEC
Displays decimal numbers.
OCT
Displays octal numbers.
Bin
Displays binary numbers.
(3) Function buttons
OK
Reflects the results of selection in this dialog box in the Trace View Window.
Cancel
Closes this dialog box.
Restore
Restores the original status.
Help
Displays this dialog box online help files.
244
User’s Manual
U18604EJ1V0UM
CHAPTER 6 WINDOW REFERENCE
Trace Move Dialog Box
[IECUBE]
This dialog box is used to specify the position from which displaying the Trace View Window is started. (Refer to
"5.10 Trace Function [IECUBE]".)
Figure 6-51 Trace Move Dialog Box
(1)
(2)
- Opening
- Explanation of Each Area
Opening
When the Trace View Window is the current window, select [View] menu -> [Move...].
Explanation of Each Area
(1) Frame selection area
This area is used to specify the frame at the destination.
1st frame
Moves the display start position to a first frame of trace data.
Trigger frame
Moves the display start position to the trigger frame of trace data.
Last frame
Moves the display start position to the last frame of trace data.
Frame No.
Moves the display start position to the specified frame number. (Refer to
"Table 6-18 Frame Number Specification Format".)
In the default condition, the character string selected in the window that
called this dialog box or "Last" is selected.
The default radix for inputting a numeric value is decimal.
If 0 is specified, the display start position is moved to the first frame of trace
data. Up to 16 input histories can be recorded.
User’s Manual
U18604EJ1V0UM
245
CHAPTER 6 WINDOW REFERENCE
Table 6-18 Frame Number Specification Format
Specification
Abbreviation
Contents
+numeric value
None
Moves backward (downward on screen) the display start position from the
frame at the cursor by the specified number of frames (numeric value).
-numeric value
None
Moves forward (upward on screen) the display start position from the frame
at the cursor by the specified number of frames (numeric value).
Top
O
Moves the display start position to the first frame.
First
S
Same as "1st frame"
Trigger
T
Same as "Trigger frame"
Last
L
Same as "Last frame"
(2) Function buttons
OK
Starts trace display from the specified position.
Cancel
Closes this dialog box.
Restore
Restores the input data to the original status.
Help
Displays this dialog box online help files.
246
User’s Manual
U18604EJ1V0UM
CHAPTER 6 WINDOW REFERENCE
Trace Dialog Box
[IECUBE]
This dialog box is used to register, set, and display trace event conditions. (Refer to "5.12 Event Function", "5.10
Trace Function [IECUBE]".)
The trace event conditions for when performing conditional trace are specified in this dialog box. (Refer to "Table
5-13 Types of Conditional Trace".)
Registration and setting of trace event conditions is done by setting each item (256 items max.) in this dialog box
and then clicking the <OK> button. The registered trace event conditions are managed by the Event Manager.
The number of trace event conditions that can be simultaneously used (validated) is limited. (Refer to "5.12.4
Number of enabled events for each event condition".)
Remark:
Trace event condition setting/enable/disable/delete operations are possible even during user program execution. In this case, the tracer operation is momentarily stopped during manipulation.
Figure 6-52 Trace Dialog Box
(4)
(3)
(1)
(2)
- Opening
- Explanation of Each Area
Opening
Click the Trc button, or select [Event] menu -> [Trace...].
User’s Manual
U18604EJ1V0UM
247
CHAPTER 6 WINDOW REFERENCE
Explanation of Each Area
(1) Trace event condition setting area
Trace Name:
This area is used to set a trace event name.
Directly input an alphanumeric string of up to eight characters as a name.
To display the contents of an already created event condition, select from the drop-down
list. The mark on the left of this area indicates the utilization status of events. (Refer to
"Table 5-18 Event Icon".) The gray mark indicates that an event condition is being edited
and has not been registered yet.
By clicking the left mark, an event condition can be validated or invalidated.
Delay Trigger:
This area is used to set an event condition for a delay trigger. (Refer to "5.10.6 Setting
conditional trace".)
Event conditions are easily set by dragging the icon of the event to be set from the event
manager area and dropping it in this area. For details, refer to "5.12.3 Setting event
conditions". The number of event conditions that can be set in this area is refer to "Table
6-19 Number of Events Settable".
Section Start:
Section End:
Event conditions are easily set by dragging the icon of the event to be set from the event
manager area and dropping it in this area. For details, refer to "5.12.3 Setting event
conditions". The number of event conditions that can be set in this area is refer to "Table
6-19 Number of Events Settable".
Qualify:
This area is used to set an event condition for a qualify trace. (Refer to "5.10.6 Setting
conditional trace".)
If two or more events are set, trace is performed when each event occurs.
Event conditions are easily set by dragging the icon of the event to be set from the event
manager area and dropping it in this area. For details, refer to "5.12.3 Setting event
conditions". The number of event conditions that can be set in this area is refer to "Table 619 Number of Events Settable".
Table 6-19 Number of Events Settable
Event Conditions
Total (execution/access)
Connected IE
14 (8*a/6)
[IECUBE]
*a
Event Link Conditions
1
Can be used to events after execution.
(2) Event manager area
This area displays the list of registered events.
Each event condition can be set easily just by dragging and dropping the event icon displayed in this area onto
the event setting area in each event setting dialog box. (Refer to "5.12.3 Setting event conditions".)
This area is common to all event-related dialog boxes. (Refer to "(2) Event manager area" in the " Break Dialog
Box".)
248
User’s Manual
U18604EJ1V0UM
CHAPTER 6 WINDOW REFERENCE
(3) Function buttons (for event condition contents display, etc.)
These buttons are used to display or delete the event conditions displayed in the event condition setting area,
and to display or hide the Event manager area. This area is common to all event-related dialog boxes.(Refer to "(3)
Function buttons (for event condition contents display, etc.)" in the " Break Dialog Box".)
(4) Function buttons (for registering, deleting, validating, and invalidating event conditions)
These buttons are used to register, delete, validate, and invalidate the events.
The event with the specified event condition is registered or set (validated) by clicking the <OK> (or <Set>)
button. This area is common to all event-related dialog boxes. (Refer to "(4) Function buttons (for registering,
deleting, validating, and invalidating event conditions)" in the " Break Dialog Box".)
User’s Manual
U18604EJ1V0UM
249
CHAPTER 6 WINDOW REFERENCE
Delay Count Dialog Box
[IECUBE]
This dialog box is used to set or display delay count values. (Refer to "5.10 Trace Function [IECUBE]".)
By setting a delay count value, a trace can be executed the number of times specified by the delay count value
after the delay trigger event condition set in the Trace Dialog Box has been satisfied. (Refer to "5.10.6 Setting
conditional trace".)
Figure 6-53 Delay Count Dialog Box
(1)
(2)
- Opening
- Explanation of Each Area
Opening
Select [Event ] menu -> [Delay Count...].
Explanation of Each Area
(1)Delay count setting area
Delay Count
Caution:
The following items can be selected.
FIRST
Places the trigger pointer at the first of the trace data, traces all
frames, and then stops the tracer.
MIDDLE
Places the trigger pointer at the center of the trace data, traces a half
of all frames, and then stops the tracer.
LAST
Places the trigger pointer at the end of the trace data and
immediately stops the tracer.
The delay count value differs according to the trace memory size specified in the Extended Option
Dialog Box.
Example: When the trace memory size is 256K frames,
FIRST: 256K - 1 frame
MIDDLE: (256K / 2) - 1 frame
LAST: 5 frames
250
User’s Manual
U18604EJ1V0UM
CHAPTER 6 WINDOW REFERENCE
(2) Function buttons
OK
Validates the settings and closes this dialog box.
Restore
Restores the previous settings.
Cancel
Closes this dialog box.
Help
Displays this dialog box online help files.
User’s Manual
U18604EJ1V0UM
251
CHAPTER 6 WINDOW REFERENCE
Code Coverage Window
[IECUBE]
This dialog box displays the code coverage measurement result (C0 coverage). (Refer to "5.11 Coverage
Measurement Function [IECUBE]".)
The lines where the user program has been executed or not yet executed can be checked in the Source Window
or Assemble Window.
Caution:
The coverage measurement result is inaccurate if the on-chip flash memory data is replaced via
emulation of flash self programming. (Refer to " Flash Option Dialog Box".)
Remark:
Coverage data is cleared when the ID850QB is started.
Figure 6-54 Code Coverage Window
(1)
(3)
(2)
- Opening
- Explanation of Each Area
- Context Menu
Opening
Click the Cov button, or select [Browse] menu -> [Code Coverage].
252
User’s Manual
U18604EJ1V0UM
CHAPTER 6 WINDOW REFERENCE
Explanation of Each Area
(1) Coverage information display area
Load Module:
This area is used to select the load module file that has been downloaded.
This area is blank when no load module file has been downloaded.
Total Coverage (%):
This area displays the coverage for the area for which code coverage has been
measured.
Total coverage = Total executed (fetched) function size/total function size
(excluding sections outside the coverage measurement range)
This area is blank when no load module file has been downloaded.
(2) Measurement result display area
This area displays the measurement result per tab (function, section, interrupt handler).
The coverage measurement result is updated automatically at a break (it is not updated during user program
execution).
This area is blank when no load module file has been downloaded.
The display jumps from this tab to the Source Window or Assemble Window using the start address value of the
selected line as a jump pointer. The jump destination window will be displayed from the jump pointer.
The jump function is executed by selecting a jump source line then selecting [Source Text/Assemble] in the
[Jump] menu. Jump can also be performed by double-clicking the jump source line.
Remark:
The displayed items are sorted by clicking the title (on the label) in each column (ascending/
descending order is switched each time the title is clicked).
(a) When [Function] tab is selected
Name
Function name
(displayed as function in file units in case of assembler source file)
File
Name of file in which the function is defined
Address
Function start address
Size
Function size (unit: bytes)
Fetch
Number of bytes executed (fetched)
Coverage (%)
Coverage of the function (0 - 100%)
---- : When the function is outside the coverage measurement range
(b) When [Section] tab is selected
Name
Section name
Type
Section type (code, data)
Address
Section start address
Size
Section size (unit: bytes)
User’s Manual
U18604EJ1V0UM
253
CHAPTER 6 WINDOW REFERENCE
Fetch
Number of bytes executed (fetched)
Coverage [%]
Coverage of the section (0 - 100%)
---- : When the section is outside the coverage measurement range
(c) When [Interrupt] tab is selected
Name
Interrupt request name
Type
Interrupt type
(nonmaskable, maskable, software, security id, flash mask option)
Status
Utilization status in the program
---- : Unknown
Address
Starting address of the interrupt handler
Size
Size of the interrupt handler (unit: bytes)
Maximum size for statuses other than "use"
Fetch
Number of bytes executed (fetched)
Coverage [%]
Coverage of the interrupt handler (0 - 100%)
---- : When the interrupt handler is outside the coverage measurement range
(3) Function buttons
Refresh
Updates the contents of this window with the latest watch data.
Close
Closes this window.
Context Menu
Source Text
Displays the corresponding source text and source line, using the data value at the
cursor position as the jump destination address. (Refer to "5.16.2 Jump function".)
If no line information exists at the jump destination address, however, you cannot jump.
Opens the Source Window. If an active Source Window is open, that window is
displayed in the forefront (so that it can be manipulated).
Assemble
Disassembles and displays starting from the jump destination address specified by the
data value at the cursor position. (Refer to "5.16.2 Jump function".)
Opens the Assemble Window. If an active Assemble Window is open, that window is
displayed in the forefront (so that it can be manipulated).
Clear
Clears the coverage measurement results.
Select...
Selects the coverage measurement range as a space of 1 MB or more.
Opens the Coverage-Address Dialog Box.
254
User’s Manual
U18604EJ1V0UM
CHAPTER 6 WINDOW REFERENCE
Coverage-Address Dialog Box
[IECUBE]
This dialog box is used to select the coverage measurement range to be displayed in the Code Coverage
Window. (Refer to "5.11 Coverage Measurement Function [IECUBE]".)
The measurable ranges are given below. In this dialog box, any 1 MB range can be selected.
Table 6-20 Coverage Measurement Range (Detail)
Connected IE
[IECUBE]
Code Coverage Measurement Range
- 1 MB space of addresses 0x000000 to 0x0FFFFF(fixed measurement areas)
- Any 1 MB space of addresses 0x100000 to 0x3FFFFFF (selectable by this daialog)
(Default: 0x3F00000 to 0x3FFFFFF)
Figure 6-55 Coverage-Address Dialog Box
(1)
(2)
- Opening
- Explanation of Each Area
Opening
Select [Option] menu -> [Coverage] -> [Select...]
Explanation of Each Area
(1) Address selection area
Address Range
This is an area for selecting any 1 MB space that performs coverage measurement.
Changing the measurement range clears the measurement result (coverage data) in
the previously selected range, but does not clear the coverage data in the fixed
measurement areas 0 to 0x0FFFFF. To determine the coverage measurement range,
select the area, and click the <OK> button.
User’s Manual
U18604EJ1V0UM
255
CHAPTER 6 WINDOW REFERENCE
(2) Function buttons
OK
Validates the coverage measurement range selected.
Cancel
Closes this dialog box.
Help
Displays this dialog box online help files.
256
User’s Manual
U18604EJ1V0UM
CHAPTER 6 WINDOW REFERENCE
Coverage-Color Dialog Box
[IECUBE]
This dialog box is used to select the color to distinguish the coverage of executed code displayed in the Source
Window and Assemble Window (refer to "5.11.3 Display of locations for which coverage measurement is
executed").
Figure 6-56 Coverage-Color Dialog Box
(1)
(2)
- Opening
- Explanation of Each Area
Opening
Click the <Color...> button in the Debugger Option Dialog Box.
Explanation of Each Area
(1) 0%, 1 ~ 99%, 100%
The current settings (colors) for coverage 0%, 1 to 99%, and 100% are displayed.
The color for coverage 0%, 1 to 99%, and 100% can be selected by clicking the <Change> button.
A Windows standard color setting dialog box is used for color specification.
(2) Function buttons
OK
Applies the settings to the Source Window or Assemble Window and closes this dialog
box.
Default
Restores the default color for coverage.
Cancel
Closes this dialog box.
Help
Displays this dialog box online help files.
User’s Manual
U18604EJ1V0UM
257
CHAPTER 6 WINDOW REFERENCE
Software Break Manager
This window is used to display, enable or disable, and delete software breaks. (Refer to "5.4.4 Hardware break
and software break".)
Software breakpoints cannot be set in this window; they can be set in the Source Window or Assemble Window.
(Refer to "5.4.2 Breakpoint setting".)
Caution1:
Software break points can be set or deleted while the user program is being executed. While the
user program is being executed, software breaks can be set, deleted, enable or disable. The
warning of a purport which makes a user program once take a break is displayed.
Caution2:
When the Pseudo real-time monitor function (Break When Readout) is enabled, no software break
points can be set.
In addition, if a valid software break point has been set, writing during user program execution
(DMM Function) is disabled.
Remark:
The displayed items are sorted by clicking the title (on the label) in each column (ascending/
descending order is switched each time the title is clicked).
Figure 6-57 Software Break Manager
(3)
(2)
(1)
- Opening
- Explanation of Each Area
Opening
Select [Event] menu -> [Software Break Manager].
258
User’s Manual
U18604EJ1V0UM
CHAPTER 6 WINDOW REFERENCE
Explanation of Each Area
(1) Break information display area
Name
This area displays the names of registered events, and the checkboxes that
indicate whether each event is enabled or disabled.
An event name is displayed in the form of "Swb+[number]" in the default
condition. It can be changed to an alphanumeric string of up to 256 characters.
To change an event name, select and click a name. Then directly edit the
name. To set the editing, press the Enter key.
When an event is enabled, the checkbox is selected. To be disable, the
checkbox is not selected.
Furthermore, the name jumps to the Source Window by double-clicking an
event name if the event name corresponds to the source line, whereas the
name jumps to the Assemble Window if it does not correspond to the source
line.
Brk
The ">" mark is displayed for a software break event that is set at the current
PC position (so that the software break event that caused a break can be easily
identified).
File#Line / Symbol+Offset
This area displays the location at which a software break event was set as
follows:
Program$file name#line number (If the event corresponds to the source line.)
Program$file name#symbol+offset (If the event dose not correspond to the
source line.)
Events are evaluated based on this when a symbol is re-downloaded.
Address
This area displays the address at which a software break event is set.
(2) Item label area
The displayed items are sorted by clicking each item label (ascending/descending order is switched each time
the label is clicked).
Name
Sorts the character strings in alphabetic order (ascending/descending order)
Brk
Does not sort
File#Line / Symbol+Offset
Sorts the character strings in alphabetic order (ascending/descending order)
Address
Sorts the addresses based on higher/lower (ascending/descending order)
(3) Function buttons
Enable
Enables the selected event.
Disable
Disables the selected event.
Delete
Deletes the selected event.
Delete All
Deletes all the set software break events.
Close
Closes this window.
User’s Manual
U18604EJ1V0UM
259
CHAPTER 6 WINDOW REFERENCE
Event Manager
This window is used to manage event conditions. This window allows display, enabling/disabling, and deletion of
the Various Event Conditions. (Refer to "5.12 Event Function".)
Other operations using Context Menu, Function button, etc., can be performed in this window.
The event icon is the jump pointer of the Jump function.
Figure 6-58 Event Manager (In Detailed Display Mode)
(2)
(1)
- Opening
- Explanation of Each Area
- [View] Menu (Event manager-dedicated items)
- Context Menu
Opening
Click the Mgr button, or select [Event] menu -> [Event Manager].
Explanation of Each Area
(1) Event display area
This area displays the icons (event icons) of the registered Various Event Conditions.
By selecting the context menu -> [Detail], the details can be displayed.
[In list displayed]
Displays event icon. (Refer to "Table 5-18 Event Icon".)
The event icon is the jump pointer. (Refer to "5.16.2 Jump function".)
260
User’s Manual
U18604EJ1V0UM
CHAPTER 6 WINDOW REFERENCE
[In detailed display]
Details of event contents are displayed by using the following key information as a
separator. (Refer to "Table 6-21 Separator for Displaying Event Details".)
Table 6-21 Separator for Displaying Event Details
Key Information
Contents
Event condition
[S]
Status condition
[Z]
Access size condition
[A]
Address condition
Symbol or expression: (actual address)
[D]
Data condition
Symbol or expression: (actual address)
[M]
Mask condition
Event link condition
[P1] - [P4]
Event link condition on "n" th line
[D]
Disable condition
[P]
Pass count condition
Break condition
[B]
Break condition
Trace condition [IECUBE]
[M]
Tracer control mode
[T]
Delay trigger condition
[D]
Delay Count
[S]
Trace start condition
[E]
Trace end condition
[Q]
Qualify trace condition
Timer condition [IECUBE]
[S]
Timer measurement start condition
[E]
Timer measurement end condition
[U]
Timer measurement unit
[B]
Timeout break condition
User’s Manual
U18604EJ1V0UM
261
CHAPTER 6 WINDOW REFERENCE
(2) Function button
OK
Automatically registers the event condition being edited, if any, and closes this dialog box.
Each event condition becomes valid as soon as it has been registered.
New...
Opens the [New Event] Dialog Box.
Opens the dialog box to create new event condition.
By clicking each button, the corresponding event setting dialog box
can be opened with the new event name set. After the event setting
dialog box has been opened, this dialog box is closed.
Returns to Event Manager by clicking the <Cancel> button.
Set
Registers the various event conditions. Because the dialog box is not closed even after an
event has been registered, new event conditions can be registered.
Each event condition becomes valid as soon as it has been registered.
Open
Opens the various event setting dialog box corresponding to the selected event condition
(one). Each setting dialog box displays the contents of the selected event condition.
Same operation as double-clicking the event icon or pressing the Enter key.
Enable
Disable
Validates (enables) or invalidates (disables) the selected event condition.
However, event conditions and event link conditions cannot be enabled or disabled.
Same operation as the clicking the mark of event icon.
Remove
Deletes the selected event.
When an event condition or an event link condition is to be deleted, an error occurs and
the event condition or event link condition cannot be deleted if the event is used as a
various event condition.
Delete All
Deletes all event conditions.
Info...
Opens the [Event Info] Dialog Box.
This dialog box is used to change the display mode and rearrange event names.
<Sort by Name> ..... Sorts events into name order.
<Sort by Kind> ......... Sorts events into type order.
<Unsort> .................. Displays events in the order in which they have
been registered without sorting the events.
<Detail> ................... Sets the detailed display mode.
<Overview> ............. Sets the list display mode.
<Cancel> ................ Closes this dialog box (same as ESC key).
Close
262
Closes this dialog box.
User’s Manual
U18604EJ1V0UM
CHAPTER 6 WINDOW REFERENCE
[View] Menu (Event manager-dedicated items)
The following items are added in the [View] menu , when the Event Manager is active.
Select All Event
Selects all the registered events.
Delete Event
Deletes a selected event.
Sort By Name
Displays icons in the order of event names.
Sort By Kind
Displays icons in the order of event types.
Unsort
Does not sort icons. (default)
Detail
Displays the details.
Overview
List display (default)
Context Menu
Sort By Name
Displays icons in the order of event names.
Sort By Kind
Displays icons in the order of event types.
Unsort
Does not sort icons. (default)
Detail
Displays the details.
Overview
List display (default)
Source Text
Displays the corresponding source text and source line, using the position of
the selected event as the jump destination address. (Refer to "5.16.2 Jump
function".)
If no line information exists at the jump destination address, however, you
cannot jump.
Opens the Source Window.
If an active Source Window is open, that window is displayed in the forefront
(so that it can be manipulated).
Assemble
Displays the Assemble window from the position of the selected event, which is
used as the jump destination address. (Refer to "5.16.2 Jump function".)
Opens the Assemble Window.
If an active Assemble Window is open, that window is displayed in the forefront
(so that it can be manipulated).
Memory
Displays the memory contents from the position of the selected event, which is
used as the jump destination address. (Refer to "5.16.2 Jump function".)
Opens the Memory Window.
If an active Memory Window is open, that window is displayed in the forefront
(so that it can be manipulated).
User’s Manual
U18604EJ1V0UM
263
CHAPTER 6 WINDOW REFERENCE
Event Dialog Box
This dialog box is used to register and display event conditions. (Refer to "5.12 Event Function".)
Setting of event conditions is done by setting each item in this dialog box and then pressing the <OK> button.
The registered event conditions are managed by the Event Manager.
One event condition can be set for multiple Various Event Conditions. However, the number of event conditions
that can be simultaneously used is limited. (Refer to "5.12.4 Number of enabled events for each event condition".)
Figure 6-59 Event Dialog Box
(8)
(1)
(2)
(3)
(7)
(4)
(5)
(6)
- Opening
- Explanation of Each Area
Opening
In normal mode
If the Event Dialog Box is opened as follows, an event condition can be registered without its purpose being
specified.
Click the Evn button, or select [Event] menu -> [Event...].
In select mode
If the <OK> button is pressed when the Event Dialog Box has been opened as follows, an event condition can
be registered in the setting dialog box from which this dialog box was opened (the setting dialog box from
which the this box was opened is displayed on the title bar.).
In each various event setting dialog box, click the <Add Event... > button.
264
User’s Manual
U18604EJ1V0UM
CHAPTER 6 WINDOW REFERENCE
Explanation of Each Area
(1) Event Name:
This area is used to set an event name.
Directly input an alphanumeric string of up to eight characters as a name.
To display the contents of an already created event condition, select from the drop-down list.
In the select mode, the selected event condition can be set in the event condition setting area of the setting
dialog box that called the Event Dialog Box.
The mark on the left of this area indicates the utilization status of events. (Refer to "Table 5-18 Event Icon".) The
gray E. mark indicates that the event condition is being edited and has not been registered yet.
(2) Event Status:
The status conditions that can be specified are listed below.
This area is used to select a status condition.
By specifying a status condition, the type of the execution event and an access event is determined (if an
execution event is specified, nothing can be input to the "Access Size:" and "Data:, Mask:").
Execution event
Execution
EX
Program execution
Before Execution
EX-B
Program execution (break before execution) Note1
R/W
RW
Data read/write
Read
R
Data read
Write
W
Data write
R/W(Data not Equal)
RWND
Data read/write
(An event occurs only if a data condition is not satisfied.)Note2
Read(Data not Equal)
RND
Data read
(An event occurs only if a data condition is not satisfied.)Note2
Write(Data not Equal)
WND
Data write
(An event occurs only if a data condition is not satisfied.)Note2
Access event
Note1:
Multiple items can be specified, but only two items, including access events, can be enabled.
The address range cannot be specified. Can be used only for break event conditions.
Note2:
In this case, data condition can not be omitted.
For access size condition, "No Condition" and "Bit" can not be selected.
User’s Manual
U18604EJ1V0UM
265
CHAPTER 6 WINDOW REFERENCE
(3) Access Size:
This area is used to select an access size condition.
By selecting an access size condition from the drop-down list, the access width of a data condition to be
detected by an access event is determined.
If no access size condition is specified, a judgment is automatically made from the address condition and data
condition.
Byte
Detects data condition with 8-bit width (only during 8-bit access).
Half Word
Detects data condition with 16-bit width (only during 16-bit access).
Word
Detects data condition with 32-bit width (only during 32-bit access).
No Condition
Does not detect access size (nothing can be input to the Data area).
Bit
Detects data condition with 1-bit width (only during 8-bit access)Note.
Note:
In this case, a search is made for a data condition with 1-bit width. Because of the operation of the
emulator, access to a bit is not directly detected; the simulator searches a dummy bit access by
internally setting address conditions and data conditions as follows:
Input example:
Address: 3FF7000.1
Data: 1
Setting of emulator:
Address: 3FF7000
Data: 00000010B
Mask: 11111101B
->
If another bit of the same address is accessed or if all the 8 bits of the same address are accessed,
therefore, an event is detected in accordance with the specified status if the address and bit match
the specified value of [address.bit].
(4) Address condition setting area
This area is used to specify an address condition (may be omitted).
The following can be set:
Table 6-22 Settable Range of Address Condition (Event)
Connected IE
[IECUBE]
[MINICUBE]
266
Settable Range
0 <= address value <= 0xFFFFFFFF
User’s Manual
U18604EJ1V0UM
CHAPTER 6 WINDOW REFERENCE
Address:
Caution:
Set an address condition (lower address - higher address) (may be omitted). The default
radix for inputting a numeric value is hexadecimal. A symbol can be also specified by a
symbol or expression. (Refer to "Table 5-6 Specifying Symbols".)
The following can be set:
Setting as a point
Set a value to only the lower address, or set the same value to the
lower address and the higher address.
Setting as a range
Set a value to only the lower address, or set the same value to the
lower address and the higher address.
Setting as a bit
Set a value to only the lower address, or set the same value to the
lower address and the higher address.
Specify a value in the form of "address.bit". Mask cannot be set.
The value of bit, which indicates the bit position, must be 0 <= bit<=
7.
Specify a 28-bit address, since physical address and image space are distinguished in setting
event.
(5) Data condition setting area
This area is used to specify an data condition (data value, mask value).
The default radix for inputting a numeric value is hexadecimal.
The settable range differs as follows depending on the access size condition specified in "Access Size:".
Data:
Mask:
This area is used to specify an data condition (data value, mask value).
The default radix for inputting a numeric value is hexadecimal.
The settable range differs as follows depending on the access size condition specified in
"Access Size:".
Byte
0 <= data value <= 0xFF
0 <= mask value <= 0xFF
Half Word
0 <= data value <= 0xFFFF
0 <= mask value <= 0xFFFF
Word
0 <= data value <= 0xFFFFFFFF
0 <= mask value <= 0xFFFFFFFF
Bit
Data value = 0 or 1
Mask value = Cannot be specified.
Set a mask value for the data value (may be omitted).
When a mask is set, the data value for the bit whose mask value is 1 may be 0 or 1.
Example1: 0x4000 to 0x40FF satisfy the condition.
Data
0x4000
Mask
0xFF
Example2: 0x4000, 0x4001, 0x4100, and 0x4101 satisfy the condition.
Data
0x4000
Mask
0x101
User’s Manual
U18604EJ1V0UM
267
CHAPTER 6 WINDOW REFERENCE
(6) Event manager area
Event manager:
This area is used to display the list of the events registered. (Refer to "Table 5-18 Event
Icon", "(4) Manipulation in event manager area".)
<Open>
Opens the various event setting dialog box corresponding to the selected event condition
(one). Each setting dialog box displays the contents of the selected event condition.
Same operation as double-clicking the event icon or pressing the Enter key.
<Remove>
Deletes the selected event.
When an event condition or an event link condition is to be deleted, an error occurs and
the event condition or event link condition cannot be deleted if the event is used as a
various event condition.
<Info...>
Opens the [Event Info] Dialog Box.
This dialog box is used to change the display mode and rearrange event names.
<Sort by Name> ..... Sorts events into name order.
<Sort by Kind> ......... Sorts events into type order.
<Unsort> .................. Displays events in the order in which they have
been registered without sorting the events.
<Detail> ................... Sets the detailed display mode.
<Overview> ............. Sets the list display mode.
<Cancel> ................ Closes this dialog box (same as ESC key).
(7) Function buttons (for event condition contents display, etc.)
Event Link...
Break...
Trace...
Timer...
By clicking each button, the corresponding event setting dialog box can be opened with
the new event name set.
Manager...
Opens the Event Manager.
Expand >>>
Shrink <<<
Turns on or off display of the event manager area.
The size of the dialog box is expanded or reduced.
(8) Function buttons (for registering, deleting, validating, and invalidating event conditions)
These buttons are used to register, delete, validate, and invalidate the events.
The event with the specified event condition is registered or set by clicking the <OK> (or <Set>) button. This
area is common to all event-related dialog boxes. (Refer to "(4) Function buttons (for registering, deleting,
validating, and invalidating event conditions)" in the " Break Dialog Box".)
268
User’s Manual
U18604EJ1V0UM
CHAPTER 6 WINDOW REFERENCE
Event Link Dialog Box
This dialog box is used to register and display event link conditions. (Refer to "5.12 Event Function".)
Registration of event link conditions is done by setting each item (256 items max.) in this dialog box and then
pressing the <OK> button. The registered event link conditions are managed by the Event Manager.
However, the number of event link conditions that can be simultaneously used is limited ("5.12.4 Number of
enabled events for each event condition").
Figure 6-60 Event Link Dialog Box
(4)
(3)
(1)
(2)
- Opening
- Explanation of Each Area
Opening
In normal mode
If the Event Link Dialog Box is opened as follows, an event link condition can be registered without its purpose
being specified.
Select [Event] menu -> [Event Link...].
In select mode
If the <OK> button is pressed when the Event Link Dialog Box has been opened as follows, an event link
condition can be registered in the setting dialog box from which this dialog box was opened.
In each various event setting dialog box, click the <Add Link... > button.
(the setting dialog box from which the Event Link Dialog Box was opened is displayed on the title bar.)
User’s Manual
U18604EJ1V0UM
269
CHAPTER 6 WINDOW REFERENCE
Explanation of Each Area
(1) Event link condition setting area
Link Name:
Directly input an alphanumeric string of up to eight characters as a name.
To display the contents of an already created event link condition, select from the dropdown list.
In the select mode, the selected event condition can be set in the event link condition
setting area of the setting dialog box that called the Event Link Dialog Box.
The mark on the left of this area indicates the utilization status of event link conditions
("Table 5-18 Event Icon"). The mark "L" in gray indicates that an event link condition is
being edited and has not been registered yet.
Phase 1:
Phase 2:
Phase 3:
Phase 4:
This area is used to specify the sequence in which event conditions and events are
detected.
Up to four sequences can be specified. If a disable condition is detected while the program
is being executed, however, the event conditions that have so far been satisfied are
initialized, and the event conditions are detected again starting from the first event
condition. If a link condition and a disable condition are detected at the same time, the
disable condition takes precedence.
Set "Phase 1" -> "Phase 2" -> "Phase 3" -> "Phase 4", in that order. "Phase 4" does not
have to be set. In this case, an event occurs when the event condition set for the last
phase has been detected. An event condition can be set for only "Phase 1" or the same
event condition can be set for two or more Phases.
The number of event conditions that can be set to each phase of this area and while the
dialog box, refer to "Table 6-23 Number of Event Conditions in Event Link Dialog Box".
Setting of event conditions is easily done by dragging the icon of the event to be set from
the event manager area and dropping it in this area. For details, refer to "5.12.3 Setting
event conditions".
Disable:
This area is used to set an event condition that invalidates the event conditions that have
so far been satisfied.
The number of event conditions that can be set to this area and while the dialog box, refer
to "Table 6-23 Number of Event Conditions in Event Link Dialog Box".
Setting of event conditions is easily done by dragging the icon of the event to be set from
the event manager area and dropping it in this area. For details, refer to "5.12.3 Setting
event conditions".
Pass Count:
[IECUBE]
This area is used to set a pass count condition.
A pass count condition specifies how many times an event condition must be satisfied
during user program execution before a given condition is satisfied.
If no pass count is specified, 1 is assumed (the condition is satisfied as soon as the event
condition is satisfied).
Table 6-23 Number of Event Conditions in Event Link Dialog Box
Connected IE
Each Area
10
14 (8/6)
Nx85ET
(RCU0+TEU+TRCU)
10*a
12 (8/4)
Nx85E901 (RCU0), RCU1
1*b
2*c
With debug function
1*b
2*c
[IECUBE]
[MINICUBE]
[MINICUBE2]
-
Without debug function
270
Total (Execution/Access)
User’s Manual
U18604EJ1V0UM
-
CHAPTER 6 WINDOW REFERENCE
*a
Can be set in Phase1-4 (expect before execution)
*b
Can be set only in Phase 1 and Phase 2 (must always be set in two stages)
*c
Only events before execution
(2) Event manager area
This area displays the list of registered events.
Each event condition can be set easily just by dragging and dropping the event icon displayed in this area onto
the event setting area in each event setting dialog box. (Refer to "5.12.3 Setting event conditions".)
This area is common to all event-related dialog boxes. (Refer to "(2) Event manager area" in the " Break Dialog
Box".)
(3) Function buttons (for event condition contents display, etc.)
These buttons are used to display or delete the event conditions displayed in the event condition setting area,
and to display or hide the Event manager area. This area is common to all event-related dialog boxes.(Refer to "(3)
Function buttons (for event condition contents display, etc.)" in the " Break Dialog Box".)
(4) Function buttons (for registering, deleting, validating, and invalidating event conditions)
These buttons are used to register, delete, validate, and invalidate the events.
The event with the specified event condition is registered by clicking the <OK> (or <Set>) button.
OK
Automatically registers the event condition being edited, if any, and closes this dialog box.
In the select mode
An event condition is selected and the setting dialog box (indicated on the title bar) that
called the Event Link dialog box is displayed again. If the calling dialog box has already
been closed, the select mode is returned to the normal mode, and the Event Dialog Box is
not closed. Otherwise, this dialog box will be closed.
New
Newly creates an event condition in this dialog box.
An event condition name is automatically created and a new event condition is prepared.
Set
Registers the various event conditions. Because the dialog box is not closed even after an
event has been registered, new event conditions can be registered.
In the select mode
An event condition is selected. If there is an event being edited, it is automatically
registered and selected.
Enable/Disable
Validates (enables) or invalidates (disables) the selected event condition.
However, event conditions and event link conditions cannot be enabled or disabled.
Same operation as the clicking the mark of event icon.
Clear
Clears the contents of the event condition.
Restore
Restores the contents of an edited event condition.
If an event condition not registered is displayed, all the fields other than the event name
field are blank or the default values are set.
Cancel
Close
Closes this dialog box. Even if an event condition is being edited, it is not registered and
the dialog box is closed.
Help
Displays the help window of this window.
User’s Manual
U18604EJ1V0UM
271
CHAPTER 6 WINDOW REFERENCE
Break Dialog Box
This dialog box is used to register; set, and display break event conditions. (Refer to "5.12 Event Function", "5.4
Break Function".)
Registration and setting of break event conditions is done by setting each item (256 items max.) in this dialog
box and then clicking the <OK> button. The registered break event conditions are managed by the Event Manager.
There are restrictions on the number of break event conditions that can be simultaneously set (enabled). (Refer
to "5.12.4 Number of enabled events for each event condition".)
Figure 6-61 Break Dialog Box
(4)
(1)
(3)
(2)
- Opening
- Explanation of Each Area
Opening
Click the Brk button, or select [Event] menu -> [Break...].
272
User’s Manual
U18604EJ1V0UM
CHAPTER 6 WINDOW REFERENCE
Explanation of Each Area
(1) Break event condition setting area
Break Name:
This area is used to set a break event name. Directly input an alphanumeric string of up to
eight characters as a name.
To display the contents of an already created event condition, select from the drop-down
list.
The mark on the left of this area indicates the utilization status of events. (Refer to "Table
5-18 Event Icon".) The gray mark indicates that an event condition is being edited and has
not been registered yet. By clicking the left mark, an event condition can be validated or
invalidated.
Break Event:
This area is used to set an event condition for break.
Refer to "Table 6-24 Number of Events Settable in Condition Setting Area" for the number
of event conditions and event link conditions that can be set in this area.
Event conditions are easily set by dragging the icon of the event to be set from the event
manager area and dropping it in this area. For details, refer to "5.12.3 Setting event
conditions".
Table 6-24 Number of Events Settable in Condition Setting Area
Total Event Condition (Before
Execution/After Execution/
Access)
Connected IE
16 (2 / 8 / 6)
[IECUBE]
[MINICUBE]
[MINICUBE2]
Event Link Condition
1
Nx85ET
(RCU0+TEU+TRCU)
14 (2 / 8 / 4)
-
Nx85E901 (RCU0), RCU1
2
-
With debug function
2
-
Without debug function
-
-
(2) Event manager area
This area displays the list of registered events.
Each event condition can be set easily just by dragging and dropping the event icon displayed in this area onto
the event setting area in each event setting dialog box. (Refer to "5.12.3 Setting event conditions".)
This area is common to all event-related dialog boxes.
<Add>
The event condition and event link condition selected in Event Manager area add to
setting area with a focus.
User’s Manual
U18604EJ1V0UM
273
CHAPTER 6 WINDOW REFERENCE
<Info...>
Opens the [Event Info] Dialog Box.
This dialog box is used to change the display mode and rearrange event names.
<Sort by Name>....... Sorts events into name order.
<Sort by Kind> ........ Sorts events into type order.
<Unsort> .................. Displays events in the order in which they have
been registered without sorting the events.
<Detail>.................... Sets the detailed display mode.
<Overview>.............. Sets the list display mode.
<Cancel> ................. Closes this dialog box (same as ESC key).
<Other...>
Opens the [Set Other] Dialog Box.
By clicking each button, the corresponding event setting dialog box
can be opened with the new event name set. After the event setting
dialog box has been opened, this dialog box is closed.
<Manager...> ........... Opens the Event Manager.
<Cancel>.................. Closes the dialog box to create event condition.
(3) Function buttons (for event condition contents display, etc.)
These buttons are used to display or delete the event conditions displayed in the event condition setting area,
and to display or hide the Event manager area. This area is common to all event-related dialog boxes.
Add Event...
Opens the Event Dialog Box in the select mode, and selects or newly creates an event
condition to be set. The event condition will be added to the area selected when the < Add
Event...> button is pressed.
Add Link...
Opens the Event Link Dialog Boxin the select mode, and selects or newly creates an event
link condition. The event condition will be added to the area selected when the < Add
Link...> button is pressed.
Open
Opens the various event setting dialog box corresponding to the selected event condition
(one). Each setting dialog box displays the contents of the selected event condition.
Same operation as double-clicking the event icon or pressing the Enter key.
Remove
Delete
Deletes the selected event.
When an event condition or an event link condition is to be deleted, an error occurs and
the event condition or event link condition cannot be deleted if the event is used as a
various event condition.
Expand >>>
Shrink <<<
Turns on or off display of the event manager area.
The size of the dialog box is expanded or reduced.
274
User’s Manual
U18604EJ1V0UM
CHAPTER 6 WINDOW REFERENCE
(4) Function buttons (for registering, deleting, validating, and invalidating event conditions)
These buttons are used to register, delete, validate, and invalidate the events.
The event with the specified event condition is registered or set (validated) by clicking the <OK> (or <Set>)
button. This area is common to all event-related dialog boxes.
OK
Automatically registers the event condition or the various event condition being edited, if
any, and closes this dialog box. Each event condition becomes valid as soon as it has
been registered.
New...
Newly creates an event condition in this dialog box.
An event condition name is automatically created and a new event condition is prepared.
Set
Registers the event condition or the various event condition. Because the dialog box is not
closed even after an event has been registered, new event conditions can be registered.
Each event condition becomes valid as soon as it has been registered.
Enable/Disable
Validates (enables) or invalidates (disables) the selected event condition.
However, event conditions and event link conditions cannot be enabled or disabled.
Same operation as the clicking the mark of event icon.
Clear
Clears the contents of the event condition.
Restore
Restores the contents of an edited event condition.
If an event condition not registered is displayed, all the fields other than the event name
field are blank or the default values are set.
Cancel
Close
Closes this dialog box. Even if an event condition is being edited, it is not registered and
the dialog box is closed.
Help
Displays the help window of this window.
User’s Manual
U18604EJ1V0UM
275
CHAPTER 6 WINDOW REFERENCE
View File Save Dialog Box
This dialog box is used to save the current display information of the current window to a view file. (Refer to
"5.15.2 Window display information (view file)".)
Figure 6-62 View File Save Dialog Box
(1)
(3)
(2)
- Opening
- Explanation of Each Area
Opening
When the window to be saved is the current window, select [File] menu -> [Save As...].
Explanation of Each Area
(1) Save file setting area
Save in:
File name:
Save as type:
276
This area is used to specify a file name. A file name can be directly input, or
selected from the list at the upper part of this area.
Up to 257 characters string with a extension can be specified.
This area is used to specify the type (extension) of the file to be saved. (Refer to
"Table 5-21 Type of View Files".) The extension of the file corresponding to the
current window is displayed.
User’s Manual
U18604EJ1V0UM
CHAPTER 6 WINDOW REFERENCE
(2) Save range setting area
If a range of 100 lines / 100 frames / 256 bytes or more is specified, a message dialog box is displayed to
indicate the progress of saving. To stop saving midway, click the <Stop> button in the message dialog box.
Save range
Specify the range of data to be saved.
This area is displayed if the current window to be saved is the following.
- Source Window
- Assemble Window
- Memory Window
- Trace View Window
All
This should be selected to save the entire range, from the first line to
the last line.
Screen shot
This should be selected to save the area visible on the screen, from
the top line on the screen to the bottom line. If the Source Window is
in the mixed display mode, however, the window contents are saved
from the source line that includes the area visible on the screen.
Specify Line
Specify Frame
Specify Address
This should be selected to specify the start line and end line of the
area to be saved.
If the start line and end line are omitted, the first line and last line are
assumed.
Display any of the following corresponding to the current window:
Specify Line
Specify the range of the line numbers to be saved.
The default radix for inputting a numeric value is decimal.
If the Source Window is in the mixed display mode, the mixed
displayed part on the specified line is also saved.
Specify Frame [IECUBE]
Specify the range of trace frames to be saved. (Refer to "Table 6-18
Frame Number Specification Format".) The default radix for
inputting a numeric value is decimal.
Specify Address
Specify the range of address to be saved.
An address can be also specified by a symbol or expression. (Refer
to "Table 5-6 Specifying Symbols".)
The default radix for inputting a numeric value is hexadecimal.
(3) Function buttons
Save
Saves the display information of the current window to the selected file. After saving,
this dialog box is closed.
Cancel
Closes this dialog box without executing anything.
Help
Displays this dialog box online help files.
Restore
Restores the status before this dialog box was opened.
User’s Manual
U18604EJ1V0UM
277
CHAPTER 6 WINDOW REFERENCE
View File Load Dialog Box
This dialog box is used to read the view files. (Refer to "5.15.2 Window display information (view file)".)
When a view file is loaded, the reference window (Source Window in static status) opens and the display
information at saving is displayed.
The window to be opened and its status differ as follows, depending on the file to be loaded.
- Loading source file to which symbol information has been read
If there is a Source Window in the active status, it is opened in the static status; otherwise, the Source Window
is opened in the active status.
- Loading source file to which symbol information has not been read, or view file
A window of text-format files is opened in the Source Window in the static status.
Figure 6-63 View File Load Dialog Box
(1)
(2)
- Opening
- Explanation of Each Area
Opening
Click the Open button or select [File] menu -> [Open...].
278
User’s Manual
U18604EJ1V0UM
CHAPTER 6 WINDOW REFERENCE
Explanation of Each Area
(1) Load file setting area
Look in:
File name:
Files of type:
This area is used to specify the file name to be loaded. A file name can be directly
input from the keyboard, or selected from the list.
Up to 257 character string with a extension can be specified.
This area is used to specify the type (extension) of the file to be loaded. (Refer to
"Table 5-21 Type of View Files".)
(2) Function buttons
Open
Loads the selected file. After loading the file, this dialog box is closed.
Cancel
Closes this dialog box without executing anything.
Help
Displays this dialog box online help files.
User’s Manual
U18604EJ1V0UM
279
CHAPTER 6 WINDOW REFERENCE
Environment Setting File Save Dialog Box
This dialog box is used to save the setting contents of the current window to a setting file. (Refer to "5.15.3
Window setting information (setting file)".)
Figure 6-64 Environment Setting File Save Dialog Box
(1)
(2)
- Opening
- Explanation of Each Area
Opening
When the window to be saved is the current window, select [File] menu -> [Environment] -> [Save As...].
Explanation of Each Area
(1) Save file setting area
Save in:
File name:
Save as type:
This area is used to specify a file name. A file name can be directly input, or
selected from the list at the upper part of this area.
Up to 257 characters string with a extension can be specified.
This area is used to specify the type (extension) of the file to be saved. (Refer to
"Table 5-22 Type of Setting Files".) The extension of the file corresponding to the
current window is displayed.
(2) Function buttons
Save
Saves the setting information of the current window to the selected file. After saving, this dialog box is closed.
Cancel
Closes this dialog box without executing anything.
Help
Displays this dialog box online help files.
280
User’s Manual
U18604EJ1V0UM
CHAPTER 6 WINDOW REFERENCE
Environment Setting File Load Dialog Box
This dialog box is used to read the setting files. (Refer to "5.15.3 Window setting information (setting file)".)
When a setting file is loaded, the target window opens and the setting information at saving is restored.
Figure 6-65 Environment Setting File Load Dialog Box
(1)
(2)
- Opening
- Explanation of Each Area
Opening
select [File] menu -> [Environment] -> [Open...].
Explanation of Each Area
(1) Load file setting area
Look in:
File name:
Files of type:
This area is used to specify the file name to be loaded. A file name can be directly
input from the keyboard, or selected from the list.
Up to 257 character string with a extension can be specified.
This area is used to specify the type (extension) of the file to be loaded. (Refer to
"Table 5-22 Type of Setting Files".)
(2) Function buttons
Open
Loads the selected file. After loading the file, this dialog box is closed.
Cancel
Closes this dialog box without executing anything.
Help
Displays this dialog box online help files.
User’s Manual
U18604EJ1V0UM
281
CHAPTER 6 WINDOW REFERENCE
Reset Debugger Dialog Box
This dialog box is used to initialize the ID850QB, CPU, and symbol information.
Figure 6-66 Reset Debugger Dialog Box
(1)
(2)
- Opening
- Explanation of Each Area
Opening
Select [File] menu -> [Debugger Reset...].
Explanation of Each Area
(1) Reset subject selection area
This area is used to specify what is to be Initialized. Initializes the selected item.
Debugger
Initializes the ID850QB. (default)
Symbol
Initializes the symbol information.
Target CPU
Initializes the CPU.
(2) Function buttons
OK
Initializes according to the setting.
Cancel
Cancels the changes and closes this dialog box.
Help
Displays this dialog box online help files.
282
User’s Manual
U18604EJ1V0UM
CHAPTER 6 WINDOW REFERENCE
Exit Debugger Dialog Box
This dialog box is used to select whether the current debug environment is saved to a project file or not before
terminating the ID850QB. (Refer to "5.15.1 Debugging environment (project file)".)
It can be specified in the Debugger Option Dialog Box that the ID850QB is terminated without this confirmation
dialog box being opened.
Figure 6-67 Exit Debugger Dialog Box
- Opening
- Function buttons
Opening
- Select [File] menu -> [Exit].
- If forcible termination, such as to terminate the application, has been executed on the task list that terminates
Windows.
Function buttons
Yes
Saves the current debug environment to a project file, closes all the windows, and
terminates the ID850QB.
If a project file name is not specified, the Project File Save Dialog Box is opened. If the
<Cancel> button is selected on the Project File Save Dialog Box, the environment is
neither saved to a project file nor is the ID850QB terminated.
(If a project file is loaded or saved during debugger operation, this button has the
default focus.)
No
Closes all the windows and terminates the ID850QB.
(If a project file is not loaded or saved during debugger operation, this button has the
default focus.)
Cancel
Closes this dialog box without executing anything.
User’s Manual
U18604EJ1V0UM
283
CHAPTER 6 WINDOW REFERENCE
About Dialog Box
This dialog box displays the version information of the ID850QB (the year is displayed in 4 digits).
Remark:
The version information can be copied to the clipboard by selecting [Select All and Copy (&C)] from
the context menu in the dialog box.
The following version information is displayed:
- Product version of ID850QB
- Version of device file
- Version of GUI
- Version of debugger DLL
- Version of assembler DLL
- Version of executor
- Version of Tcl/Tk
- Product ID and product version of in-circuit emulator
Figure 6-68 About Dialog Box
- Opening
Opening
Select [Help] menu -> [About...].
Remark:
284
This dialog also be opened by clicking the <About...> button in the Configuration Dialog Box.
User’s Manual
U18604EJ1V0UM
CHAPTER 6 WINDOW REFERENCE
Console Window
This window is used to input commands that control the ID850QB.
Because the key bind is Emacs-like, the accelerator key is not acknowledged if the Console Window is active.
However, the F1 key displays the online help files of the Console Window.
While the Console Window is open, an error message window with only an <OK> button is displayed in the
Console Window.
The command history is saved when the Console window is closed.
Refer to "CHAPTER 7 COMMAND REFERENCE" for details on the command specifications.
Figure 6-69 Console Window
- Opening
- Explanation of Each Area
Opening
Select [Browse] menu -> [Console].
Explanation of Each Area
Refer to "CHAPTER 7 COMMAND REFERENCE" for details on the command specifications.
User’s Manual
U18604EJ1V0UM
285
CHAPTER 6 WINDOW REFERENCE
Browse Dialog Box
This dialog box is used to select the file to be set in the Source Text Move Dialog Box.
Remark:
If this dialog box is opened for the first time after the system has been started up, the directory first
specified by the source path is displayed. When the dialog box is opened the second and subsequent times, the previously displayed directory is recorded and displayed again. If the <Cancel>
button is clicked, however, the previously displayed directory is not recorded.
Figure 6-70 Browse Dialog Box
(1)
(2)
- Opening
- Explanation of Each Area
Opening
Click the <Browse...> button in the target dialog box.
Explanation of Each Area
(1) Open file setting area
Look in:
File name:
Files of type:
286
This area is used to specify the file name to be opened. A file name can be directly
input from the keyboard, or selected from the list.
Up to 257 character string with a extension can be specified.
This area is used to specify the type (extension) of the file to be opened. (Refer to
"Table 5-5 File Type Can Be Displayed".)
User’s Manual
U18604EJ1V0UM
CHAPTER 6 WINDOW REFERENCE
(2) Function buttons
Open
Sets the selected file. After setting the file, this dialog box is closed.
Cancel
Closes this dialog box without executing anything.
Help
Displays this dialog box online help files.
User’s Manual
U18604EJ1V0UM
287
CHAPTER 7 COMMAND REFERENCE
CHAPTER 7 COMMAND REFERENCE
This chapter explains the details of the command functions of the ID850QB.
- Command Line Rules
- Command List
- List of Aliases
- List of Variables
- List of Packages
- Key Bind
- Expansion Window
- Callback Procedure
- Hook Procedure
- Related Files
- Cautions
- Explanation of Commands
7.1
Command Line Rules
The specification of command lines has the following rules:
- Command name, option, and argument are specified for command line.
- To divide words, a space (space key or tab key) is used.
- At the end of a line, a line feed character or a semicolon is used.
- When a command name and an option are entered to the point of identifiability, they are recognized.
- In script, command names have to be entered completely.
Command format
command -options arg1 arg2 arg3 ...
288
User’s Manual
U18604EJ1V0UM
CHAPTER 7 COMMAND REFERENCE
7.2
Command List
Table 7-1 Debugger Control Command List
Command Name
Function
address
Evaluation of address expression
assemble
Disassemble/line assemble
batch
Executing batch (with echo)
breakpoint
Setting/deletion of breakpoint
cache
Setting of cache [MINICUBE]
dbgexit
Terminating ID850QB
dbgopt
Selecting debugger option
download
Download of files
efconfig
Setting flash memory in external space
erase
Deletion of the internal flash memory
extwin
Creation of expansion window
finish
Returning from function
flop
Manipulation related to internal flash memory
go
Continuous execution
help
Display of help
hook
Setting of hook
ie
Display/setting of IE register
inspect
Symbol inspect
jump
Jump to window
map
Setting / deleting memory mapping
mdi
Setting of expansion window
memory
Display/setting of memory
module
Display of the list of files and functions
next
Procedure step
refresh
Redrawing of window
register
Display/setting of register value and IOR value
reset
Reset
run
Reset and execution of CPU
step
Step execution
stop
Stop execution
User’s Manual
U18604EJ1V0UM
289
CHAPTER 7 COMMAND REFERENCE
Command Name
Function
upload
Upload
version
Display of the version information
watch
Display/setting of variables
where
Stack trace
wish
Start of Tclet
xcoverage
Operation of coverage [IECUBE]
xtime
Operation of timer [IECUBE]
xtrace
Operation of tracer [IECUBE]
Table 7-2 List of Console/Tcl Commands
Command Name
Function
alias
Creation of another name
cd
Change of directory
clear
Clears the screen
echo
Echo
exit
Close/end
history
Display of history
ls
Display of files
pwd
Check of the directory
source
Execution of batch
time
Measurement of time for commands
tkcon
Console control
unalias
Deletion of another name
which
Display of the command path or another name
Other
Based on Tcl/Tk 8.4
Remark
For details of the Tcl commands, select the [start] menu -> [All Programs] ->[NEC Electronics
Tools] -> [ID850QB] -> [VX.xx] -> [ID850QB VX.xx Tcl8.4 Help].
290
User’s Manual
U18604EJ1V0UM
CHAPTER 7 COMMAND REFERENCE
7.3
List of Aliases
The commands can be specified with other names by defining their aliases in the file "bin/idtcl/aliases.tcl".
The aliases are described by default as shown below.
This file can be edited with an editor.
Table 7-3 Contents of File aliases.tcl
alias a assemble
alias b breakpoint
alias g go
alias i step -i
alias j jump
alias l download
alias m memory
alias n next
alias r run
alias s step
alias w watch
7.4
List of Variables
Table 7-4 List of Variables
Variable
Function
dcl (chip)
Chip name read only
dcl (prjfile)
Project file name read only
dcl (srcpath)
Source path read only
dcl (ieid)
IE type read only
dcl (iestat)
IE status read only
dcl (bkstat)
Break status read only
env (LANG)
Language
dcl_version
Dcl version read only
User’s Manual
U18604EJ1V0UM
291
CHAPTER 7 COMMAND REFERENCE
7.5
List of Packages
Table 7-5 List of Packages
Package
Function
tcltest
Restoration test
cwind
Automatic window control
BWidget
Toolkit
tcllib
Tcllibrary
mclistbox
Multi-column list box
combobox
Combo box
7.6
Key Bind
- tcsh + Emacs like
- Complement of command name [Tab]
- Complement of file name [Tab]
- HTML help [F1]
7.7
Expansion Window
The expansion windows can be created using Tk.
In the expansion windows, Widget is allocated with '.dcl' as a root instead of '.'.
When the following script files are allocated in bin/idtcl/tools/, an expansion window is added on selecting
[Browse] menu -> [Others].
The mdi command, an exclusive command for expansion windows, has been added.
# Sample.tcl
wm protocol .dcl WM_DELETE_WINDOW { exit }
mdi geometry 100 50
button .dcl.b -text Push -command exit
pack .dcl.b
Caution:
In the expansion windows, Tk menu commands cannot be used because of the restrictions of MDI
windows.
292
User’s Manual
U18604EJ1V0UM
CHAPTER 7 COMMAND REFERENCE
7.7.1
Samples (calculator script)
The script of the expansion window in which the calculator script is described and its execution screen are
shown below.
Script of expansion window
# Calculator.tcl
mdi geometry 100 100
set top .dcl
entry $top.e -relief sunken -textvariable v
frame $top.f -height 120 -width 120; pack $top.e -fill x; pack $top.f -fill both -expand 1
set i 0; set v {}; set r 0.25
foreach n {7 8 9 / 4 5 6 * 1 2 3 - 0 = + C} {
if {$n == "=" || $n == "C"} {
button $top.f.b$n -text $n
} else {
button $top.f.b$n -text $n -command "$top.e insert end $n"
}
place $top.f.b$n -relx [expr ($i%4)*$r] -rely [expr ($i/4)*$r] -relw $r -relh $r
incr i
}
bind $top.f.bC <1> {$top.e delete 0 end}
bind $top.f.b= <1> {catch {expr $v} v}
Figure 7-1 Execution Screen
User’s Manual
U18604EJ1V0UM
293
CHAPTER 7 COMMAND REFERENCE
7.8
Callback Procedure
Expansion windows can hold dcl_asyncproc procedures called by asynchronous messages.
proc dcl_asyncproc {mid} {
if {$mid == 19} {
redraw
}
}
The asynchronous message ID is passed for the argument of the dcl_asyncproc procedure
The message IDs are shown below:
Table 7-6 Message ID
Message ID
Meaning
9
After changing configuratio
10
After registering event
11
After deleting event
12
Before executing
13
After breaking
14
After resetting CPU
15
After resetting ID850QB
17
After changing extended option
18
After changing debugger option
19
After downloading
20
After changing memory or register
36
Before starting tracer [IECUBE]
37
After stopping tracer [IECUBE]
40
Before starting timer [IECUBE]
41
After stopping timer [IECUBE]
42
After clearing trace [IECUBE]
45
After resetting symbol
46
After change from RRM function to trace function, and change from trace function
to RRM function. [IECUBE]
294
User’s Manual
U18604EJ1V0UM
CHAPTER 7 COMMAND REFERENCE
7.9
Hook Procedure
A hook can be set in the ID850QB using the hook procedure.
The hook procedures are shown below:
- BeforeDownload(Hook before downloading)
- AfterDownload(Hook after downloading)
- AfterCpuReset(Hook after CPU reset during break)
- BeforeCpuRun(Hook before starting execution)
- AfterCpuStop(Hook after breaking)
By using hook procedures, register values can be changed before downloading programs or after resetting the
CPU.
An actual example of the procedure is shown below. A hook is valid till the ID850QB is closed.
(1) [When hook is set with ID850QB control command]
1) Create script file a. with an editor.
2) Start up the ID850QB, select [Browse] menu -> [Console], and open the Console Window.
3) If the script file is executed in the window as below, the hook in the script file is set.
%hook test.tcl
(2) [When hook is set on downloading of project file]
1) Create script file a. with an editor.Note
2) Start up the ID850QBand read test.prj. The hook in the script file is set.
proc BeforeDownload {} {
register MM 0x7
register PMC8 0xff
register PMC9 0xff
register PMCX 0xe0
}
proc AfterCpuReset {} {
register MM 0x7
register PMC8 0xff
register PMC9 0xff
register PMCX 0xe0
}
Note:
Be sure that the script file name is the same as the project file.
Example:
The script file corresponding to test.prj is test.tcl.
Allocate test.prj, test.pri, and test.tcl in the same directory.
User’s Manual
U18604EJ1V0UM
295
CHAPTER 7 COMMAND REFERENCE
7.10
Related Files
Table 7-7 List of Related Files
File Name
Function
aliases.tcl
Executes when the aliases.tcl console is opened. Sets the default
alias etc.
Projectfilename.tcl
Executes when the project file name.tcl project is opened.
The following hooks can be used.
BeforeDownload
AfterDownload
AfterCpuReset
BeforeCpuRun
AfterCpuStop
Loadmodulefilename.tcl
Executes when the load module name.tcl load module file is
downloaded.
The following hooks can be used.
BeforeDownload
AfterDownload
AfterCpuReset
BeforeCpuRun
AfterCpuStop
7.11
Cautions
- The separator for file and path is a slash (/).
- When a console is open, error messages are output to the console.
- To terminate the command forcibly, close the console.
- The execution of external commands (DOS commands) is OFF by default.
296
User’s Manual
U18604EJ1V0UM
CHAPTER 7 COMMAND REFERENCE
7.12
Explanation of Commands
In this section, each command is explained using the format shown below.
Command name
Describes the command name.
Input format
Describes the input format of the command.
In the following explanation, italics indicate an Argument to be supplied by the user, while the argument enclosed
in "?" may be omitted.
When a command name and an option are entered to the point of identifiability, they are recognized.
Aliases
Describes the defined command name if the command is defined with another name. For details, refer to "7.3
List of Aliases".
Functions
Explains the functions of the command.
Usage example
Shows an example of the usage of the command.
User’s Manual
U18604EJ1V0UM
297
CHAPTER 7 COMMAND REFERENCE
address
address - Evaluation of address expression
Input format
address expression
Functions
Converts the address expression specified by expression into address.
Usage example
(IDCON) 1 % address main
0xaa
(IDCON) 2 % address main+1
0xab
298
User’s Manual
U18604EJ1V0UM
CHAPTER 7 COMMAND REFERENCE
assemble
assemble - Disassemble/line assemble
Input format
assemble ?options? address ?code?
Functions
Line assembles the character strings specified by codefrom the address specified by address.
When '.' is specified for address, it is understood as an address continuing from the immediately disassemble.
When code is omitted, it is disassembled from the address specified by address.
The following are options: They are ignored for line assembly.
-code
Command code is also displayed.It is ignored for line assembly.
-number number
Number line is displayed. It is ignored for line assembly.
Usage example
(IDCON) 1 % assemble -n 5 main
0x000000aa B7
PUSH HL
0x000000ab B1
PUSH AX
0x000000ac 891C
MOVW AX,SP
0x000000ae D6
MOVW HL,AX
0x000000af A100
MOV A,#0H
(IDCON) 2 % assemble main mov a,b
(IDCON) 3 % assemble . mov a,b
User’s Manual
U18604EJ1V0UM
299
CHAPTER 7 COMMAND REFERENCE
batch
batch - Executing batch (with echo)
Input format
batch scriptname
Functions
Executes in batch with displaying files specified by scriptname on the screen.
Nesting is possible.
Usage example
(IDCON) 1 % clear
(IDCON) 2 % batch bat_file.tcl
(IDCON) 3 % tkcon save a:/log.txt
300
User’s Manual
U18604EJ1V0UM
CHAPTER 7 COMMAND REFERENCE
breakpoint
breakpoint - Setting/deletion of breakpoint
Input format
breakpoint ?options? ?address1? ?address2?
breakpoint -delete brkno
breakpoint -enable brkno
breakpoint -disable brkno
breakpoint -information
Aliases
b
Functions
Operates the breakpoint specified by options and address.
If a breakpoint can be set correctly, the breakpoint number is returned.
The following are options:
-software
A software break is specified.
-hardware
A hardware break is specified. (default)
-execute
The address execution break is set. (default)
-beforeexecute
The break before address execution is set.
-read
An address data read break is set.
-write
An address data write break is set.
-access
An address data access break is set.
-size size
The access size is set (8, 16 or 32) .(Unit: bit) [IECUBE]
-data value
The data condition is set.
-datamask value
The data mask is set.
-information
The list of breakpoints is displayed.
-delete
The breakpoint whose number is specified is deleted.
-disable
The breakpoint whose number is specified is disabled.
-enable
The breakpoint whose number is specified is enabled.
User’s Manual
U18604EJ1V0UM
301
CHAPTER 7 COMMAND REFERENCE
Usage example
(IDCON) 1 % breakpoint main
1
(IDCON) 2 % breakpoint -i
1 Brk00001 enable rammon.c#17
(IDCON) 3 % breakpoint -software sub
2
(IDCON) 4 % breakpoint -i
1 Brk00001 enable rammon.c#17
2 Brk00001 enable rammon.c#8
(IDCON) 5 % breakpoint -disable 2
(IDCON) 6 % breakpoint -i
1 Brk00001 enable rammon.c#17
2 Brk00001 disable rammon.c#8
(IDCON) 7 % breakpoint -delete 1
2 Brk00001 disable rammon.c#8
302
User’s Manual
U18604EJ1V0UM
CHAPTER 7 COMMAND REFERENCE
cache
[MINICUBE]
cache - Setting of cache
Input format
cache
cache config ?-icache itype? ?-dcache dtype?
cache clear ?-icache bool? ?-dcache bool?
Functions
When config is specified for the subcommand, the cache type is set.
When clear is specified for the subcommand, whether cache clear is to be done by EXEC, or not, is set (default
is clear)
When subcommand or below is omitted, the current status is displayed.
itype is selected from the following:
NB85E212
NB85E212 is used.
NB85E213
NB85E213 is used.
nouse
Not used (default).
dtype is selected from the following:
NB85E252
NB85E252 is used.
NB85E263
NB85E263 is used.
nouse
Not used (default).
bool is selected from the following:
0, false, or off
Off
1, true, or on
On
Usage example
(IDCON) 1 % cache config -i NB85E212 -d NB85E252
(IDCON) 2 % cache
i-cache: NB85E212
d-cache: NB85E252
(IDCON) 3 % cache clear -i false
(IDCON) 4 % cache
i-cache: NB85E212 (persist)
d-cache: nouse
User’s Manual
U18604EJ1V0UM
303
CHAPTER 7 COMMAND REFERENCE
dbgexit
dbgexit - Terminating ID850QB
Input format
dbgexit ?options?
Functions
Terminate the ID850QB.
The following are options:
-saveprj
Project is saved on terminating ID850QB.
Usage example
(IDCON) 1 % dbgexit -saveprj
304
User’s Manual
U18604EJ1V0UM
CHAPTER 7 COMMAND REFERENCE
dbgopt
dbgopt - Selecting the debugger option
Input format
dbgopt options ?value?
Functions
Selects the option of the debugger. The following are options:
-function ?func?
[IECUBE]
Switches the RRM function, trace function, or coverage function
When func is omitted, the current function is displayed.
func is selected from the following:
rrm
RRM function is selected.
trace
Trace function is selected.
coverage
Coverage function is selected.
Usage example
(IDCON) 1 % dbgopt -function trace
User’s Manual
U18604EJ1V0UM
305
CHAPTER 7 COMMAND REFERENCE
download
download - Download of files
Input format
download ?options? filename ?offset?
Aliases
l
Functions
Downloads files specified with filename according to options. (The load module format files and HEX-format files
are automatically recognized.)
If offset is specified, the address is shifted by the offset (if the data is in binary format, the load start address is
specified for offset).
-binary
Binary format data is downloaded.
-coverage
Coverage data is downloaded. [IECUBE]
-append
Additional download is executed.
-nosymbol
Download is executed. Symbol information is not read.
-symbolonly
Symbol information is read.
-erase
The contents of the internal flash memory are erased all before download. (Only
a product with internal flash memory.) [MINICUBE]
-reset
CPU is reset after download.
-information
Download information is displayed.
-extflash
Data in the flash memory in an external space is given priority for downloading.
(When using an E2 core, addresses in internal instruction RAM area and the
flash memory area in an external space may overlap, so use this option to give
priority to one of them.)
Data in internal instruction RAM takes precedence for downloading when this
option is omitted (default).
-idtag
HEX file with an ID tag is downloaded.
-highspeed
The clock is switched to the highest one for downloading. [IECUBE]
CPU reset occurs when the clock is switched.
Usage example
(IDCON) 1 % download test.lmf
306
User’s Manual
U18604EJ1V0UM
CHAPTER 7 COMMAND REFERENCE
efconfig
efconfig - Setting of flash memory in external space
Input format
efconfig ?options? ?filename address size parallel serial?
Functions
This command sets the flash memory in the external space.
Be sure to set the flash memory before downloading data to it.
The following are options:
filename
Specifies information file of the flash memory by a full path.
address
Specifies the start address of the flash memory.
size
Specifies the data width (access size) of the flash memory (8, 16, or 32Note).
parallel
Specifies the number of flash memories in parallel (1 or moreNote).
serial
Specifies the number of flash memories in series.(1 or moreNote).
Note: For the set value, refer to refer to "Table 7-8 Parameter Set Values (example)" .
If all the parameters are omitted, the current setting and the total size (KB) of the flash memory are displayed.
The following options are also available.
-id
Displays the ID information (manufacturer code and device code) of the flash
memory in the external space). This information will not be correctly displayed if
the setting is not correctly made.
-clear
Deletes the set information.
Usage example
(IDCON) 1 % efconfig c:/MBM29LV800BA.fdb 0x100000 16 2 1
(IDCON) 2 % efconfig
(IDCON) 3 % efconfig -id
User’s Manual
U18604EJ1V0UM
307
CHAPTER 7 COMMAND REFERENCE
Table 7-8 Parameter Set Values (example)
308
User’s Manual
U18604EJ1V0UM
CHAPTER 7 COMMAND REFERENCE
erase
erase - Erasure of the flash memory
Input format
erase
Functions
Erases the internal flash memory.
The following are options:
Erases the code flash memory if none of the following options is specified.
-code
Erases the code flash memory.
-data
Erases the data flash memory.
-external
Erases the flash memory in an external space.
Usage example
(IDCON) 1 % erase -code -data
User’s Manual
U18604EJ1V0UM
309
CHAPTER 7 COMMAND REFERENCE
extwin
extwin - Creation of expansion window
Input format
extwin scriptfile
Functions
Creates expansion window with scriptfile.
Usage example
(IDCON) 1 % extwin d:/foo.tcl
310
User’s Manual
U18604EJ1V0UM
CHAPTER 7 COMMAND REFERENCE
finish
finish - Returning from function
Input format
finish
Functions
Executes until it returns to the program that called the current function.
Usage example
(IDCON) 1 % finish
User’s Manual
U18604EJ1V0UM
311
CHAPTER 7 COMMAND REFERENCE
flop
[MINICUBE]
flop -Manipulation related to user flash memory
Input format
flop -init
flop -user clock
Functions
Selects whether the clock-related settings during user flash memory write are the device file settings or user
settings.
-init
Processing is performed using the device file setting.
If the device file contains no information, an error occurs during internal
flash memory write. In this case, use the -user option.
-user clock
IOR of the clock generation function is manipulated.
Specify for clock the frequency (MHz) of the CPU clock (fCPU)
determined by the IOR manipulation.
In this case, perform the IOR setting using the hook procedure.
Usage example
(IDCON) 1 % flop -user 13.5
312
User’s Manual
U18604EJ1V0UM
CHAPTER 7 COMMAND REFERENCE
go
go - Continuous execution
Input format
go ?options?
Aliases
g
Functions
Executes program continuously.If -waitbreak is specified, the command waits until the program stops.
The following are options:
-ignorebreak
Breakpoint is ignored.
-waitbreak
The command waits for the program to stop.
Usage example
(IDCON) 1 % go -w
User’s Manual
U18604EJ1V0UM
313
CHAPTER 7 COMMAND REFERENCE
help
help - Display of help
Input format
help
Functions
Displays Dcl help.
Usage example
(IDCON) 1 % help
For more information on a specific command, type HELP command-name
ASSOC Displays or modifies file extension associations.
AT
Schedules commands and programs to run on a computer.
ATTRIB Displays or changes file attributes.
BREAK Sets or clears extended CTRL+C checking.
CACLS Displays or modifies access control lists (ACLs) of files.
CALL Calls one batch program from another.
CD
Displays the name of or changes the current directory.
CHCP Displays or sets the active code page number.
CHDIR Displays the name of or changes the current directory.
CHKDSK Checks a disk and displays a status report.
CHKNTFS Displays or modifies the checking of disk at boot time.
CLS
Clears the screen.
:
:
:
314
User’s Manual
U18604EJ1V0UM
CHAPTER 7 COMMAND REFERENCE
hook
hook - Setting of hook
Input format
hook scriptfile
Functions
Sets the procedure for hook with scriptfile.
The hook setting is initialized when the project file is loaded and when the ID850QB is reset.
Usage example
(IDCON) 1 % hook d:/foo.tcl
User’s Manual
U18604EJ1V0UM
315
CHAPTER 7 COMMAND REFERENCE
ie
Display/setting of IE register
Input format
ie reg address ?value?
ie dcu address ?value?
Functions
The ie command depends on the IE.
When reg is specified for the subcommand, referencing and setting of the IE register is executed.
When dcu is specified for the subcommand, referencing and setting of the DCU register is executed.
When using a Midas Lab emulator, input an rte4win32 internal command following ie.
For details on commands, refer to the rte4w32 user's manual.
Example:
ie rom1 100000 20000 1m rom16 bus16 !wren
Caution:The value of a register will be reset by 0 if a DCU register is referred to.
Usage example
(IDCON) 1 % ie reg 0x100 1
(IDCON) 2 % ie dcu 0x100 1
316
User’s Manual
U18604EJ1V0UM
CHAPTER 7 COMMAND REFERENCE
inspect
inspect - Symbol inspect
Input format
inspect ?options? progname pattern
Functions
Searches and displays the load module symbol specified with progname using the regular expression of pattern.
The following regular expressions can be used.
?
Match 1 character
*
Match characters other than 0
[chars]
Match chars character. (Range specification such as [a-z/0-9] also possible.)
\x
Match character x. (? * [ ] \ specification also possible.)
The following are options:
-nocase
The case is distinguished.
-address
Displays in pair with symbol address.
Usage example
(IDCON) 1 % inspect test1.out {[a-z]*}
User’s Manual
U18604EJ1V0UM
317
CHAPTER 7 COMMAND REFERENCE
jump
jump - Jump to window
Input format
jump -source -line filename ?line?
jump ?options? address
Aliases
j
Functions
Displays the window specified by options.
-source
The Source Window is displayed from the address specified by address.
-assemble
The Assemble Window is displayed from the address specified by address.
-memory
The Memory Window is displayed from the address specified by address.
-line
The command is moved to the line specified by line.
-focus
The Focus is moved to the window displayed.
Usage example
(IDCON) 1 % jump -s main
(IDCON) 2 % jump -s -l mainfile.c 10
(IDCON) 3 % jump -m array
318
User’s Manual
U18604EJ1V0UM
CHAPTER 7 COMMAND REFERENCE
map
map - Setting/deletion of memory mapping
Input format
map options address1 address2 ?accsize? ?cs?
Functions
Sets, deletes, and displays memory mapping.
Remark:
The access size of 8, 16, or 32 is specified by accsize (unit: byte, the default is 8).
Caution:
To map an emulation memory (alternate ROM/RAM) with the ID850QB, specify either cs0, cs1,
cs2, cs3, cs4, cs5, cs6, or cs7 for cs for chip selection.
In the case of the V850ES microcontrollers, this specification can be omitted because the allocation by chip selection may be fixed or the chip selection function may not be provided. If cs is specified, specification of accsize cannot be omitted.
The following are options:
-erom
[IECUBE]
Alternate ROM is mapped. (With memory board)
-eram
[IECUBE]
Alternate RAM is mapped. (With memory board)
-target
Target area is mapped.
-targetrom
[IECUBE]
Target ROM area is mapped.
-protect
I/O protect area is mapped.
-rrm
Start address of RRM area is set.
If performed during user program execution, CPU is stopped for an
instant.
RRM area can be divided into 8 partitions.
The start address and size are specified in pairs in list format as follows.
{{address size} {address size} {address size} ...}
size is one of 256, 512, 768, 1024, 1280, 1536, 1792, 2048 bytes, and the
total size is up to 2048.
-clear
All the settings for the mapping are deleted.
-information
Refer to the setting for the mapping.
User’s Manual
U18604EJ1V0UM
319
CHAPTER 7 COMMAND REFERENCE
Usage example
(IDCON) 1 % map -i
1: 0 0x7fff 8 {IROM}
2: 0x8000 0x87ff 8 {Target RRM}
3: 0x8800 0x9fff 8 {Target}
4: 0xa000 0xf7ff 8 {NonMap}
5: 0xf800 0xfaff - {NonMap}
6: 0xfb00 0xfedf 8 {IRAM}
7: 0xfee0 0xfeff 8 {Register}
8: 0xff00 0xffff 8 {IOR}
(IDCON) 2 % map -erom 0x100000 0x10ffff
(IDCON) 3 % map -c
320
User’s Manual
U18604EJ1V0UM
CHAPTER 7 COMMAND REFERENCE
mdi
mdi - Setting of expansion window
Input format
mdi geometry ?x y? width height
mdi title string
Functions
Sets the size and title name of the expansion window.
The command can be used only from the expansion window.
Usage example
(IDCON) 1 % mdi geometry 0 0 100 100
(IDCON) 2 % mdi title foo
User’s Manual
U18604EJ1V0UM
321
CHAPTER 7 COMMAND REFERENCE
memory
memory - Display/setting of memory
Input format
memory ?options? address ?value?
memory ?options? -fill address1 address2 value
memory ?options? -copy address1 address2 address3
Aliases
m
Functions
Sets value in the memory of the address specified by address according to options.
If value is omitted, display the value of the memory of the address specified by address.
If -fill is specified, data from address1 to address2 is filled with value.
If -copy is specified, data from address1 to address2 is copied to address3.
The following are options:
-byte
Displayed/set in one-byte units. (default)
-halfword
Displayed/set in halfword units.
-word
Displayed/set in word units.
-fill
The data is filled in.
-copy
The data is copied.
-noverify
Verification is not executed on writing.
Remark:
If either of the following operations is performed during user program execution, the CPU is
stopped momentarily and execution continues.
- Referencing a memory area other than the RRM area
- Setting of a memory
Usage example
(IDCON) 1 % memory 100
0x10
(IDCON) 2 % memory 100 2
(IDCON) 3 % memory 100
0x02
(IDCON) 4 % memory -fill 0 1ff 0
322
User’s Manual
U18604EJ1V0UM
CHAPTER 7 COMMAND REFERENCE
module
module - Display of the list of files and functions
Input format
module progname ?filename?
Functions
Displays the list of files and functions of the load module specified by progname.
If filename is not specified, the list of files is displayed.
If filename is specified, the list of functions of the specified files is displayed.
Usage example
(IDCON) 1 % module rammon.lmf
1: rammon.c
(IDCON) 2 % module rammon.lmf rammon.c
1: rammon.c sub1
2: rammon.c main
User’s Manual
U18604EJ1V0UM
323
CHAPTER 7 COMMAND REFERENCE
next
next - Procedure step
Input format
next ?options?
Aliases
n
Functions
Executes the procedure steps. If functions are called, the step stops after executing function.
The following are options:
-source
The command is executed in source line units. (default)
-instruction
The command is executed in command units.
Usage example
(IDCON) 1 % next -i
(IDCON) 2 % next -s
324
User’s Manual
U18604EJ1V0UM
CHAPTER 7 COMMAND REFERENCE
refresh
refresh - Redrawing of window
Input format
refresh
Functions
Redraws the window and updates the data.
Usage example
(IDCON) 1 % batch foo.tcl
(IDCON) 2 % refresh
User’s Manual
U18604EJ1V0UM
325
CHAPTER 7 COMMAND REFERENCE
register
register - Display/setting of register value and IOR value
Input format
register ?options? regname ?value?
Functions
Sets value in the register specified with regname.
If value is omitted, displays the value of the register specified by regname.
The following are options:
-force
Remark:
Compulsory reading or writing is executed.
If either of the following operations is performed during user program execution, the CPU is
stopped momentarily and execution continues.
- Referencing a register
- Setting of a register
Usage example
(IDCON) 1 % register pc
0x100
(IDCON) 2 % register pc 200
(IDCON) 3 % register pc
0x200
326
User’s Manual
U18604EJ1V0UM
CHAPTER 7 COMMAND REFERENCE
reset
reset - Reset
Input format
reset ?options?
Functions
Resets the ID850QB , CPU, symbols or events.
If options are omitted, the CPU is reset.
The following are options:
-cpu
CPU is reset. (default)
-debugger
The ID850QB is reset.
-symbol
Symbol is reset.
-event
All events and software breaks are reset.
Usage example
(IDCON) 1 % reset
User’s Manual
U18604EJ1V0UM
327
CHAPTER 7 COMMAND REFERENCE
run
run - Reset and execution of CPU
Input format
run ?options?
Aliases
r
Functions
Resets the program and executes it.
If -waitbreak is not specified, the command does not wait until the program stops.
The following are options:
-waitbreak
The command waits for the program to stop.
Usage example
(IDCON) 1 % run
(IDCON) 2 % run -w
328
User’s Manual
U18604EJ1V0UM
CHAPTER 7 COMMAND REFERENCE
step
step - Step execution
Input format
step ?options?
Aliases
s (step -source)
i (step -instruction)
Functions
Executes step execution.
If functions are called, the command stops at the head of the functions.
The following are options.
-source
The command is executed in source line units. (default)
-instruction
The command is executed in instruction units.
Usage example
(IDCON) 1 % step -i
(IDCON) 2 % step -s
User’s Manual
U18604EJ1V0UM
329
CHAPTER 7 COMMAND REFERENCE
stop
stop - Stop executing
Input format
stop
Functions
Stops the program forcibly.
Usage example
(IDCON) 1 % run
(IDCON) 2 % stop
330
User’s Manual
U18604EJ1V0UM
CHAPTER 7 COMMAND REFERENCE
tkcon
tkcon - Console control
Input format
tkcon cmd ?arg?
Functions
Controls the Console window.
This command is one of the console/Tcl commands.(Refer to "Table 7-2 List of Console/Tcl Commands".)
tkcon buffer ?size?
Sets and references the maximum buffer size (number of lines) of
the console.
If the specified buffer size is exceeded, the excessive lines are
deleted from the oldest order.
tkcon close
tkcon destroy
Close the Console window.
tkcon font ?fontname?
Sets and references the fonts used in the Console window.
tkcon gets
Performs standard inputs such as Stdin.
Opens a dialog box.
tkcon history ?-newline?
Displays the command history.
tkcon save ?filename? ?type?
Saves the buffer data for the Console window as a file.
When the file name or the file type is omitted, a dialog box is opened.
Select the type from all, history, stdin, stdout, and stderr.
tkcon version
Displays the console version.
Usage example
(IDCON) 1 % tkcon save c:/temp/logfile.txt all
User’s Manual
U18604EJ1V0UM
331
CHAPTER 7 COMMAND REFERENCE
upload
upload - Upload
Input format
upload ?options? filename address1 address2
upload -coverage filename
Functions
Saves the memory data or coverage data within the specified range in a file.
The following are options:
-binary
The data is saved in binary format.
-coverage
[IECUBE]
The coverage data is saved. When saving coverage data, all the
specified range of the coverage data is saved in the file (specification
of start/end addresses not required).
-intel
The data is saved in Intel HEX format. (default).
-motorola
The data is saved in Motorola HEX format.
-tektronix
The data is saved in Tektronix HEX format.
-force
The file is overwritten.
Usage example
(IDCON) 1 % upload -b foo.hex 0 0xffff
332
User’s Manual
U18604EJ1V0UM
CHAPTER 7 COMMAND REFERENCE
version
version - Display of the version information
Input format
version
Functions
Displays the version of the ID850QB.
Usage example
(IDCON) 1 % version
GUI
: Vx.xx [XX XXXX 200X]
Devicefile
: V850 Device File [uPD703201] Vx.xx
Debugger
: V850 Debugger Vx.xx [XX XXXX 200X]
Executer
: V850 Executer Vx.xx [XXX XXXX 200X]
Monitor
: V850 Peripheral Vx.xx [XX XXXX 200X]
Assembler : V850 Asm/Disasm Vx.xx [XX XXXX 200X]
Tcl/Tk
: 8.4.XX
User’s Manual
U18604EJ1V0UM
333
CHAPTER 7 COMMAND REFERENCE
watch
watch - Display/setting of variables
Input format
watch ?options? variable ?value?
Aliases
w
Functions
Displays and sets the variables.
The following are options:
-binary
The value is displayed in binary digits.
-octal
The value is displayed in octal digits.
-decimal
The value is displayed in decimal digits.
-hexdecimal
The value is displayed in hexdecimal digits.
-string
The value is displayed in character strings.
-sizeof
The size, instead of the value, of variables is displayed in decimal digits.
-encoding name
Encoding during character string display is specified.
By default, system encoding is used.
name (encoding name) is based on the Tcl specification (shiftjis, euc-jp,
etc.).
Usage example
(IDCON) 1 % watch var
0x10
(IDCON) 2 % watch -d var
16
(IDCON) 3 % watch array\[0\] 0xa
334
User’s Manual
U18604EJ1V0UM
CHAPTER 7 COMMAND REFERENCE
where
where - Stack trace
Input format
where
Functions
Executes the back-trace of the stack.
Usage example
(IDCON) 1 % where
1: test2.c#sub2(int i)#13
2: test.c#num(int i)#71
3: test.c#main()#82
User’s Manual
U18604EJ1V0UM
335
CHAPTER 7 COMMAND REFERENCE
wish
wish - Startup of Tclet
Input format
wish scriptname
Functions
Starts up the script using Tk (Tclet).
The expansion window can be created with Tclet.
Usage example
(IDCON) 1 % wish test.tcl
336
User’s Manual
U18604EJ1V0UM
CHAPTER 7 COMMAND REFERENCE
xcoverage
[IECUBE]
xcoverage - Operation of coverage
Input format
xcoverage option
Functions
Operates coverage.
The following are options:
-clear
Clears the coverage memory.
Usage example
(IDCON) 1 % xcoverage -clear
User’s Manual
U18604EJ1V0UM
337
CHAPTER 7 COMMAND REFERENCE
xtime
[IECUBE]
xtime - Operation of timer
Input format
xtime option
Functions
Operates timer.
The following are options:
-start
Timer starts on executing the program.
-stop
Timer stops on executing the program.
-gobreak
Time from Go to Break is displayed in nsec.
Usage example
(IDCON) 1 % xtime -start
(IDCON) 2 % xtime -stop
338
User’s Manual
U18604EJ1V0UM
CHAPTER 7 COMMAND REFERENCE
xtrace
[IECUBE]
xtrace - Operation of tracer
Input format
xtrace -dump ?-append? frameno ?filename?
xtrace -start
xtrace -stop
xtrace -clear
xtrace -addup ?bool?
xtrace -mode ?mode?
xtrace -complement ?bool?
Functions
Operates tracer.
The following are options:
-start
The tracer starts on executing the program.
-stop
The tracer stops on executing the program.
-clear
Clears the trace memory.
-dump
The trace data is dumped. (default)
The dump result is redirected to the console window.
If the file name is specified, the dump result is written in the file.
-append
The dump result is added to a file.
-addup ?bool?
Whether the time tag is totaled or not is selected.
When bool is omitted, the current mode is displayed.
-mode ?mode?
The trace control mode (any one of: all, cond, nonstop, fullstop,
fullbreak, delaystop, delaybreak, machine, or event) is selected.
When mode is omitted, the current mode is displayed.
-complement ?bool?
Selects whether to perform trace complementation.
When bool is omitted, the current mode is displayed.
Usage example
(IDCON) 1 % xtrace -start
(IDCON) 2 % xtrace -stop
(IDCON) 3 % xtrace -dump 3
_ 01685 2 000000BC M1 br _sub2+0x2
_ 01686 4 0000009A BRM1 st.w r6, 0x8[sp]
_ 01687 3 0000009E BRM1 st.w r0, 0x0[sp]
(IDCON) 4 % xtrace -clear
(IDCON) 5 % xtrace -addup true
User’s Manual
U18604EJ1V0UM
339
APPENDIX A EXPANSION WINDOW
APPENDIX A EXPANSION WINDOW
- Overview
- Sample Window
- Activation
- Explanation of Each Sample Window
A.1
Overview
With the ID850QB, the user can create custom windows in addition to the existing windows.
The Tcl (Tool Command Language) interpreter and the commands for controlling the debugger are implemented
in the ID850QB. Users can create windows using this Tcl.
The ID850QB is supplied with samples of the following expansion windows.
A.2
Sample Window
Table A-1 List of Expansion Window (Sample)
Window Name
Function
List window
Displays a list of the source files and functions.
Grep window
Searches a character string.
RRM window
This is the memory window for real-time RAM monitoring.
Hook window
Sets the hook procedure.
Memory Mapped I/O window
Writes to or reads from the specified address.
Sym Inspect window
Searches through a list of properly described symbols.
Run Break Time window
Displays two types of time: Time at which the user program starts running
(Run) and time at which the user program breaks (Break).
OpenBreak window
This window is used to set the open break function.
A.3
Activation
The expansion window can be activated by selecting List, Grep, RRM, Hook, Memory, SymInspect or RunBreakTime in [Others] on the [Browse] menu.
Remark:
340
Each .tcl file is installed in NEC Electronics Tools\ID850QB\Vx.xx\bin\idtcl\tools
User’s Manual
U18604EJ1V0UM
APPENDIX A EXPANSION WINDOW
A.4
Explanation of Each Sample Window
The ID850QB provides the sample window below.
List window
The lists of the source files and functions are displayed in a tree format in this window. When a function name in
the list is clicked, the corresponding source is displayed.
Figure A-1 List Window
When a function name in the list is clicked, the corresponding function
portion is displayed in the Source window.
User’s Manual
U18604EJ1V0UM
341
APPENDIX A EXPANSION WINDOW
Grep window
Search for a character string is performed in the files under the source path.
When the search result is clicked, the corresponding source is displayed.
Figure A-2 Grep Window
By clicking a character string line in the search
result,the coressponding character string portion is
displayed in the Source window.
Object
Function
Pattern
Input the character string to be searched.
<Mark> button
Marks the searched character string.
<Clear> button
Clears the marking.
<Jump> button
Put the cursor on a section in the search result and click this button to open the
corresponding file.
Match Case
Select whether or not to distinguish uppercase and lowercase.
Filter
Specify the type of the file to be searched.
342
User’s Manual
U18604EJ1V0UM
APPENDIX A EXPANSION WINDOW
RRM window
This is a dedicated window for RAM monitoring.
The address area in which a value was changed in the RAM area during program execution is highlighted with a
color. The display range is 1 KB. With reading RAM, execution of the user program momentarily breaks. On this
window, the start address of the RAM area can be changed while the user program is being executed.
Caution:
All data are not read at the same time (because data of 1 KB is divided and read in word units).
Remark1:
This RRM window is opened even when the RAM monitor function is set to OFF in the Extended
Option Dialog Box.
Remark2:
The sampling interval is about 0.3 - 0.7 seconds (20MHz), but it depend on the frequency of the
CPU operation. [MINICUBE]
Figure A-3 RRM Window
Object
Function
Address
Input the start address to be displayed (automatically aligned to 1 KB.)
<Change> button
Switch the start address display.
<Refresh> button
Reads data from the memory.
<Color> button
The color can be customized. The default color is red.
Keep Color
Specify whether or not to hold the color highlighting.
Selected: Once a value is changed, the color highlighting is held until a break occurs.
Unselected: The color is cleared if there is no change of values. (default)
<Close> button
Closes this window.
User’s Manual
U18604EJ1V0UM
343
APPENDIX A EXPANSION WINDOW
Hook window
This window is used to set a hook to the debugger, using a hook procedure.
The hook procedure enables changing the register value before downloading a program, or after a CPU reset.
On this window, a hook can be set by using the following five tabs.
- [AfterDownload] tab: Hook after downloading
- [BeforeDownload] tab: Hook before downloading
- [AfterCpuReset] tab: Hook after CPU reset during break
- [BeforeCpuRun] tab: Hook before start of execution
- [AfterCpuStop] tab: Hook after break
Remark:
By setting a IOR by using the [BeforeDownload] tab before downloading the load module, for
example, downloading can be executed at high speeds. Access to the external memory is also
facilitated by using this tab.
If the setting is saved as "project-file-name.tcl" in the directory where the project is stored, the setting is executed
when the project is next opened.
Figure A-4 Hook Window
344
User’s Manual
U18604EJ1V0UM
APPENDIX A EXPANSION WINDOW
Object
Function
[AfterDownload] tab
Hook after downloading
After downloading is performed, the register values input to the tab are automatically
overwritten by the specified value.
[BeforeDownload] tab
Hook before downloading
Before downloading is performed, the register values input to the tab are
automatically overwritten by the specified value.
[AfterCpuReset] tab
Hook after CPU reset during break
after resetting CPU, the register values input to the tab are automatically overwritten
by the specified value.
[BeforeCpuRun] tab
Hook before starting execution
before starting execution, the register values input to the tab are automatically
overwritten by the specified value.
[AfterCpuStop] tab
Hook after breaking
After breaking, the register values input to the tab are automatically overwritten by
the specified value.
<Test> button
All the commands described on the tabs are tested.
<Save> button
Saves all the tab contents to a file.
If the ID850QB was activated from a project file, the file is saved as "project-filename.tcl".
<Clear> button
Clears all the descriptions on the tabs.
Remark:
Specify the program register and the peripheral I/O registers for the register name.
User’s Manual
U18604EJ1V0UM
345
APPENDIX A EXPANSION WINDOW
Memory Mapped I/O window
Data is explicitly read or written at a specified address in this window.
When a write is performed in the Memory Window, the data is internally read and verified by the ID850QB. In
addition, the memory can also be read simply by scrolling in the Memory Window. On the Memory Mapped I/O
window, however, the above operations are not performed.
Therefore, this window is useful for reading or writing a specific address.
While the user program is being executed, it momentarily breaks before data is written in this window.
Figure A-5 Memory Mapped I/O Window
Object
Function
Address:
Input the address to display. The display target address changes by pressing the
Enter key or clicking the <Jump> button.The data contents are not read at this time,
so the address (numerical value) is displayed in the address display section, but
"XX" is displayed in the data section.
<Jump> button
Jumps to the address input in the Address field.
<Refresh All> button
Reads all the areas currently displayed only once. "ZZ" will be displayed in the data
section when an attempt is made to read an unmapped area, or when an error
occurs upon a read.
<Refresh One> button
Reads data in the memory of the address at which the cursor is placed only once.
The read data size depends on the display format.
"ZZ" will be displayed in the data section when an attempt is made to read an
unmapped area, or when an error occurs upon a read.
<Modify...> button
Opens the Memory Mapped I/O dialog box.
The address at which the cursor is placed is the input address displayed in the
Memory Mapped I/O dialog box.If this button is clicked after the cursor position is
changed in the Memory Mapped I/O dialog box, the Address field in the Memory
Mapped I/O dialog box is also changed.
346
User’s Manual
U18604EJ1V0UM
APPENDIX A EXPANSION WINDOW
Object
Function
<Close> button
Closes this window.
Context menu
Select the display format from Byte, HalfWord, and Word.
User’s Manual
U18604EJ1V0UM
347
APPENDIX A EXPANSION WINDOW
Memory Mapped I/O dialog box
This dialog box can be opened by clicking the <Modify... > button on the Memory Mapped I/O window. It is used
to write data to any address.
Remark1:
When the area to which data is written is displayed in the Memory Window or Watch Window, data
is read in these windows after the <Write in> button is clicked.
Remark2:
If Data Size is less than Access Size specified in the Configuration Dialog Box, ID850QB reads
data in Access Size once, changes the corresponding part of the read data, and writes the
changed data in Access Size.
Figure A-6 Memory Mapped I/O Dialog Box
Object
Function
Address:
Input the address to be written.
The address corresponding to the data for which the cursor is placed in the
Memory Mapped I/O window is displayed by default.
Value:
Input the value to be written.
Data Size:
Select the size of the data to be written.
The size specified in the Memory Mapped I/O window is selected by default.
<Write In> button
Data is written to the specified address with the specified size.
<Close> button
Closes this dialog box.
348
User’s Manual
U18604EJ1V0UM
APPENDIX A EXPANSION WINDOW
Sym Inspect window
This window displays the list of the symbols and addresses of loaded module files, and is used for searching the
list for the properly described symbol.
Figure A-7 Sym Inspect Window
Object
Function
Load Module:
Selects a load module file.
Filter:
Specifies a properly described symbol so that the symbol is retrieved.
Match Case
In Filter:, specify to differentiate or not differentiate case sensitivity. Select this box
to differentiate case sensitivity.
Symbol
Displays the symbols. Clicking this icon has the symbols sorted in alphabetical
order.
Address
Displays the addresses. Clicking this icon has the addresses sorted in ascending
numerical order.
Context Menu
Function
Copy
Copies the selected address to the clipboard.
Jump to Source
Jumps from the address in the selected line to the identical address displayed in
the Source Window.
Jump to Assemble
Jumps from the address in the selected line to the identical address displayed in
the Assemble Window.
Jump to Memory
Jumps from the address in the selected line to the identical address displayed in
the Memory Window.
User’s Manual
U18604EJ1V0UM
349
APPENDIX A EXPANSION WINDOW
Run Break Time window
This window displays two types of time: Time at which the user program starts running (Run) and time at which
the user program breaks (Break). The window is helpful when measuring takes a long time. The Windows timer
function is utilized for this window; the time is displayed in hours, minutes, and seconds.
Figure A-8 RunBreakTime Window
Object
<Clear> button
350
Function
Clears the time display
User’s Manual
U18604EJ1V0UM
APPENDIX A EXPANSION WINDOW
OpenBreak window
The open break function is used to set the pins, which control a motor, to Hi-Z so as to stop the motor safely if
the motor control signal is not fed back due to CPU stoppage and it may have an adverse effect on the motor.
For whether the open break function is supported by the emulator used, refer to the user's manual of the target
emulator. When MINICUBE or N-Wire CARD is used, the support status depends on the target device, so refer to
the user's manual of the target device.
At present, MINICUBE2 does not support this function.
Figure A-9 OpenBreak Window
Object
Function
When CPU stops, terminal is...
Select operation of the open break target pin after the CPU is stopped.
OPEN [Hi-Z]
The open break target pin becomes the Hi-Z state after the CPU is stopped.
Output signal
The open break target pin outputs the signal even after the CPU is stopped.
User’s Manual
U18604EJ1V0UM
351
APPENDIX B ADDITIONAL CAUTIONS
APPENDIX B ADDITIONAL CAUTIONS
This chapter explains cautions on connecting each emulator and functional differences between when a Midas
Lab emulator is connected and IECUBE is connected.
- Cautions on using On-Chip Debug Emulator [MINICUBE] [MINICUBE2]
- Cautions on using Midas Lab emulator RTE-2000H-TP
B.1
Cautions on using On-Chip Debug Emulator [MINICUBE] [MINICUBE2]
Note the following points when connecting on-chip debug emulator MINICUBE, N-Wire CARD, or MINICUBE2.
(1) The contents of the internal RAM may be lost if the CPU reset button is pressed in products supporting a
boot-swap function.
(2)
The following restrictions are applicable when using the AZ850. The hardware trace method cannot be
used. Use the software trace method instead.
(3) Since there is no identification information in single-chip mode 0 or single-chip mode 1 in the TEG chip, the
internal ROM start address is fixed to 0h.
(4) The target device that is used for debugging cannot be mounted in the mass production product. (The NWire CARD rewrites the flash memory (target device) during debugging, so the guaranteed number of
rewrites of the flash memory may not be satisfied.)
B.1.1
When MINICUBE or N-Wire CARD Is Connected [MINICUBE]
Note the following points (1) to (5) when debugging the self programming function using MINICUBE and N-Wire
CARD.
(1) A break may not occur even if a hardware breakpoint is set in the interrupt servicing in the user application.
The interrupts registered by the handler registration function in the user application can be acknowledged in
a flash environment.However, no break occurs in an interrupt servicing acknowledged during flash macro
servicing even if a hardware breakpoint has been set in the interrupt servicing. That is, no break occurs in
an interrupt service routine acknowledged during self-programming, even if an event breakpoint has been
set.
(2) Debug cannot be performed if a break is forcibly generated during flash macro servicing. When a break is
forcibly generated during flash macro servicing, the message "Flash Macro Service" is displayed on the
status bar. If an attempt is made to continue the debug operation, the error message " F0c25: Flash macro
service ROM was accessed or stepped in." will be displayed. In such a case, execute [Go] or [Restart].
352
User’s Manual
U18604EJ1V0UM
APPENDIX B ADDITIONAL CAUTIONS
(3) If a forcible break is acknowledged in the flash environment, the values in the on-chip flash memory area are
undefined and cannot be displayed normally.If a forcible break is acknowledged and generated in the flash
environment, the on-chip flash memory area in the Assemble Window is maskedNote and the all values in
the on-chip flash memory area in the Memory Window become 0.
Note:
Nothing is displayed in the disassemble display area in the Assemble Window.
(4) Do not set a software breakpoint in the on-chip flash memory area.When a software breakpoint occurs in the
on-chip flash memory area ("Software Break" is displayed in the break cause area on the status bar, the
error message " F0c25: Flash macro service ROM was accessed or stepped in." will be displayed.
(5)
Do not to stop the peripheral macro when using the flash self-programming function in the user
application.Select "Non Break" (option to not stop the peripheral macro) in the Peripheral Break area in the
Configuration Dialog Box of the ID850QB when using the self-programming function in the user application;
otherwise, the on-chip flash memory may be damaged.
B.1.2
When MINICUBE2 Is Connected [MINICUBE2]
Do not perform the following operations when debugging the self-programming function by using MINICUBE2;
the debugger may hang up.
(1) Break in flash environment
(2) Stepping in of program that transfers to flash environment
User’s Manual
U18604EJ1V0UM
353
APPENDIX B ADDITIONAL CAUTIONS
B.2
Cautions on using Midas Lab emulator RTE-2000H-TP
The following table lists functional differences between the V850-IECUBE and RTE-2000HTP + PG2-IE,
regarding cautions for connecting Midas Lab emulator RTE-2000H-TP.
Table B-1 Functional Differences Between V850-IECUBE and RTE-2000H-TP + PG2-IE
IECUBE
RTE-2000H-TP+PG2-IE
Connection
Connection with host machine
USB
USB or LAN
None
/ICE:RTE
/EXEC:EX850G32RTE
Chip
O (Available)
O
Internal Memory
O
X (Not available)
Clock
O
X
ID Code
X
X
Programmable I/O Area
O
O
Peripheral Break
O
X
Monitor Clock
O
X
Target
O
X
Fail-safe Break
O
X
Mask
O
X
Memory Mapping
O
O
Memory Attribute
Emulation ROM
Emulation RAM
Target
Target ROM
I/O Protect
Target
I/O Protect
Startup
Startup option
Settings
Configuration Dialog Box
354
User’s Manual
U18604EJ1V0UM
APPENDIX B ADDITIONAL CAUTIONS
IECUBE
RTE-2000H-TP+PG2-IE
Trace
O
O
Timetag Count Rate
O
X
Memory Size
O
O
Clear trace memory
before run
O
X
Cleared before execution
Trace Data
O
O
Mode
O
O
Complement Data
O
O
Add DMA Point
O
X
Timer
O
X
RAM Monitor
O
X
On Mouse Click
O
O
Break Sound
O
O
Verify Check
O
O
Clear register when reset
O
X
Cleared during reset
Check monitor
overwriting when
downloading
X
X
RRM Setting Dialog Box
X
X
Flash Option Dialog Box
O
X
Data Flash Option Dialog Box (Fx3)
O
X
Timer Dialog Box
O
X
RRM
O
X
Trace
O
O
Code coverage (option)
O
X
Access monitor
O
X
Pseudo RM/ DMM
O
X
Emulation memory (option)
O
X
Hardware break
O
O
Software break
O
O
Event
O
O
Event link
O
O
Timer event
O
X
Trace event
O
O
Run-Break timer
O
O
Extended Option Dialog
Box
Function
User’s Manual
U18604EJ1V0UM
355
APPENDIX B ADDITIONAL CAUTIONS
IECUBE
RTE-2000H-TP+PG2-IE
External Flash download
O
O
High-speed download
O
X
Display of IE version
O
X
Measurement of trace (time tag) resolution and
maximum time
Displays the total
20 ns/1.4 min.
97.6 hr. (4K division)
Clears the time tag to 0
when execution starts
100ns
Time tag of the oldest
frame is cleared to 0 (Not
the accumulated time
from execution start)
Run-Break timer
Measurement of resolution and maximum time
20ns/2.8 min.
195.2 hr. (4K division)
20ns/6.1h
356
User’s Manual
U18604EJ1V0UM
APPENDIX C INPUT CONVENTIONS
APPENDIX C INPUT CONVENTIONS
- Usable Character Set
- Symbols
- Numeric Values
- Expressions and Operators
- File Names
C.1
Usable Character Set
Table C-1 List of Character Set
Classification
Character
Alphabetic characters
Uppercase: A B C D E F G H I J K L M N O P Q R S T U V W X Y Z
Lowercase: a b c d e f g h i j k l m n o p q r s t u v w x y z
Numerals
0123456789
Character equivalent to alphabetic
character
@_
Table C-2 List of Special Characters
Character
Name
Usage
(
Left parenthesis
Changes operation order.
)
Right parenthesis
Changes operation order.
+
Plus
Addition operator or positive sign
-
Minus
Subtraction operator or negative sign
*
Asterisk
Multiplication operator or indirect reference operator
/
Slash
Division operator
%
Percent
Remainder operator
~
Tilde
Complement operator
|
Vertical line
Bit sum operator
^
Circumflex
Bit difference operator
&
Ampersand
Bit product operator or address operator
.
Period
Direct member operator or bit position specifier
,
Comma
Delimiter between operands
User’s Manual
U18604EJ1V0UM
357
APPENDIX C INPUT CONVENTIONS
Character
Name
[
Left bracket
]
Right bracket
C.2
Usage
Array subscript operator or base register specification symbol
Symbols
(1) A symbol is composed of either of the following characters.
A to Z, a to z, @, _ (underbar), ?, and 0 to 9
(2) A symbol must start with a character other than numerals 0 to 9.
(3) Uppercase characters (A to Z) and lowercase characters (a to z) are distinguished.
(4) A symbol must be no more than 2048 characters long (if a symbol of more than 2048 characters is defined,
only the first 2048 characters are valid).
(5) A symbol is defined by loading a load module file.
(6) Symbols are classified into the following types by the valid range:
Global symbol (assembly language, C language)
Static symbol (C language)
- In-file static symbol
- In-function static symbol
Local symbol (C language)
- In-file local symbol
- In-function local symbol
- In-block local symbo
(7) The following symbols are available for each language used:
Assembly language, structured assembly language
label name, bit symbol name
C language
Variable name (including pointer variable name, enumeration type variable name, array name,
structure name, and union name)
Function name, label name
Array element, structure element, union element, bit field (if the symbol is an array, structure, or
union)
(8) A symbol can be described instead of an address or numeric value.
(9) The valid range of a symbol is determined based on the source debug information when the source file is
assembled or compiled.
(10) Describe only the symbol name of a global symbol.
(11) A local symbol is expressed in pairs with a file name.
358
User’s Manual
U18604EJ1V0UM
APPENDIX C INPUT CONVENTIONS
C.3
Numeric Values
The following four types of numeric values can be used. The input format of each type is as shown below.
The suffix (bold) and the alphabetic characters of hexadecimal numbers may be uppercase or lowercase
characters. If the first character is A to F, 0 must be prefixed to it.
In the input field of ID850QB, decimal numbers or hexadecimal numbers are alternately selected, depending on
the default radix.
Table C-3 Input Format of Numeric Values
Numeric Value
Input Format
Binary number
nY
n...nY (n=0,1)
Octal number
nO
n...nO (n=0,1,2,3,4,5,6,7)
nQ
n...nQ (n=0,1,2,3,4,5,6,7)
Decimal number
n
n...n
nT
n...nT (n=0,1,2,3,4,5,6,7,8,9)
Hexadecimal numbers
n
n...n
nH
n...nH
0xn
0xn...n (n=0,1,2,3,4,5,6,7,8,9,A,B,C,D,E,F)
User’s Manual
U18604EJ1V0UM
359
APPENDIX C INPUT CONVENTIONS
C.4
Expressions and Operators
(1) Expressions
An expression consists of constants, register names, peripheral I/O registers name and symbols coupled by
operators.
If peripheral I/O registers name, label name, function name, or variable name is described as a symbol, an
address is calculated as the value of the symbol.
The elements making up an expression, except operators, are called terms (constants and labels). Terms are
called the first term, the second term, and so on, starting from the left.
(2) Operators
The following operators of the C language can be used:
Table C-4 List of Operators
Symbol
Meaning
Explanation
Arithmetic operator
+
Addition
Returns the sum of the first and second terms.
-
Subtraction
Returns the difference between the first and second terms.
*
Multiplication
Returns the product of the first and second terms.
/
Division
Divides the value of the first term by the value of the second term, and
returns the integer of the results.
MOD
%
Remainder
Divides the value of the first term by the value of the second term, and
returns the remainder of the results.
- sign
Unary
operator
(negative)
Returns 2's complement of the value of the term.
+ sign
Unary
operator
(positive)
Returns the value of the term.
Negation
Logically negates each bit of the term, and returns the results.
AND
&
Logical
product
Obtains the logical product of the values of the first and second terms on
each bit, and returns the results.
OR
|
Logical sum
Obtains the logical sum of the values of the first and second terms on each
bit, and returns the results.
XOR
^
Exclusive
logical sum
Obtains the exclusive logical sum of the values of the first and second terms
on each bit, and returns the results.
Right shift
Shifts the value of the first term by the value (number of bits) of the second
term to the right, and returns the results. As many 0s as the number of
shifted bits are inserted in the higher bits.
Logical operator
NOT
~
Shift operator
SHR
>>
360
User’s Manual
U18604EJ1V0UM
APPENDIX C INPUT CONVENTIONS
Symbol
SHL
<<
Meaning
Left shift
Explanation
Shifts the value of the first term by the value (number of bits) of the second
term to the left, and returns the results. As many 0s as the number of shifted
bits are inserted in the lower bits.
Byte separation operator
HIGH
Higher byte
Of the lowest 16 bits of the term, returns the higher 8 bits.
LOW
Lower byte
Of the lowest 16 bits of the term, returns the lower 8 bits.
Word separation operator
HIGHW
Higher word
Of the 32 bits of the term, returns the higher 16 bits.
LOWW
Lower word
Of the 32 bits of the term, returns the lower 16 bits.
(
Left
parenthesis
Performs the operation in ( ) before the operation outside ( ).
'(' and ')' are always used in pairs.
)
Right
parenthesis
Other
(3) Rules of operation
Operations are performed according to the priority of the operators.
Table C-5 Operator Priority
Priority
1
Higher
Operators
(,)
2
+ sign, - sign, NOT, ~, HIGHT, LOW, HIGHW, LOWW
3
*, /, MOD, %, SHR, >>, SHL, <<
4
+, -
5
AND, &
6
Lower
OR, |, XOR, ^
- If the priorities of the operators are the same, the operation is performed from the left toward the right.
- Performs the operation in ( ) before the operation outside ( ).
- Each term in an operation is treated as unsigned 32-bit data.
- All operation results are treated as unsigned 32-bit data.
- If an overflow occurs during operation, the lower 32 bits are valid, and the overflow is not detected.
(4) Terms
To describe a constant for a term, the following numeric values can be described.
User’s Manual
U18604EJ1V0UM
361
APPENDIX C INPUT CONVENTIONS
Table C-6 Range of Radixes
Radix
Range
Binary number
0Y <= value <= 1111111111111111111111111111111Y (32 digits)
Octal number
0O <= value <= 37777777777O
Decimal number
-2147483648 <= value <= 4294967295
(A negative decimal number is internally converted into a 2's complement.)
Hexadecimal numbers
0H <= value <= 0FFFFFFFH
C.5
File Names
The following regulations apply to the source file names and load module file names.
(1) Source file names and load module file names
File names are composed of a to z, A to Z, 0 to 9, ., _, +, and -.
File names must start with a character other than ".".
File names cannot be prefixed or suffixed by a period (.) or space.
File names are not case-sensitive.
A file name consists of up to 259 characters including the path.
(2) Other file names
Other file names comply with Windows file name regulations.
The following characters cannot be used in file names.
\/:*?"<>|;
File names cannot be prefixed or suffixed by a period (.) or space.
File names are not case-sensitive.
A file name consists of up to 259 characters including the path.
362
User’s Manual
U18604EJ1V0UM
APPENDIX D KEY FUNCTION LIST
APPENDIX D KEY FUNCTION LIST
Table D-1 Key Function List
Key
Function
BackSpace
Deletes one character before the cursor and moves the cursor to the position of the
deleted character.
At this time, the character string following the cursor moves forward.
Delete
- Deletes one character after the cursor and move the character string following the
cursor forward.
- Deletes a various event condition selected in the Event Manager or each event dialog
box.
- Deletes the data selected in the Watch Window.
Insert
Alternately selects the insert mode and overwrite mode in the Source Window and
Assemble Window. However, this key is invalid in the Memory, Register, and IOR
Windows, and only the overwrite mode can be used as an input mode.
PrintScreen
Loads the entire display screen to the clipboard as a bitmap image (function of
Windows).
Esc
- Closes the pull-down menu.
- Closes the modal dialog box.
- Restores the input data.
Alt
Moves the cursor to the menu bar.
End
Moves the cursor to the end of the line.
Home
Moves the cursor to the beginning of the line.
PageUp
Scrolls the screen one screen up. The cursor also moves up to the top of the screen.
PageDown
Scrolls the screen one screen down. The cursor also moves up to the top of the screen.
Space
Inserts one blank character.
Tab
Moves the cursor to the next item.
Up arrow key
Moves the cursor up.
If the cursor is at the bottom of the screen, scrolls the screen up one line at a time.
Down arrow key
Moves the cursor down.
If the cursor is at the top of the screen, scrolls the screen down one line at a time.
Right arrow key
Moves the cursor to the left.
If the cursor is at the left most position on the screen, scrolls the screen one column to
the right.
Left arrow key
Moves the cursor to the right.
If the cursor is at the right most position on the screen, scrolls the screen one column to
the left.
Enter
- Sets the input data.
- Presses the default push button.
F1
Opens the Help window.
User’s Manual
U18604EJ1V0UM
363
APPENDIX D KEY FUNCTION LIST
Key
Function
F2
Forcibly stops program execution. Same function as [Run] menu -> [Stop].
F3
Resets the CPU. Same function as [Run] menu -> [CPU Reset].
F4
Resets the CPU and executes the program. Same function as [Run] menu -> [Restart].
F5
Executes the program. Same function as [Run] menu -> [Go].
F6
Executes the program to the cursor position in the Source or Assemble Window.
Same function as [Run] menu -> [Come Here].
F7
The user program is real-time executed until execution returns.
Same function as [Run] menu -> [Return Out].
F8
Step execution. Same function as [Run] menu -> [Step In].
F9
Sets a breakpoint at cursor position in Source or Assemble Window.
Same function as [Run] menu -> [Break Point].
F10
Next step execution. Same function as [Run] menu -> [Next Over].
F11
Sets or deletes a software breakpoint.
Same function as [Run] menu -> [Software Break Point].
Shift+End
Expands the selection range to the end of the line.
Shift+Home
Expands the selection range to the beginning of the line.
Shift+Left arrow key
Expands the selection range one character to the left.
Shift+Right arrow key
Expands the selection range one character to the right.
Shift+F6
Executes the program from the cursor position in the Source or Assemble Window.
Same function as [Run] menu -> [Start From Here].
Shift+F9
Resets the CPU.
Same function as [Run] menu -> [CPU Reset].
Ctrl+End
Displays the last line. The cursor will also move to the last line.
Ctrl+Home
Displays the first line. The cursor will also move to the first line.
Ctrl+Left arrow key
Moves the cursor one word to the left.
If the cursor at the left most position on the screen, scrolls the screen one column to the
right.
Ctrl+Right arrow key
Moves the cursor one word to the right.
If the cursor at the right most position on the screen, scrolls the screen one column to
the left.
Ctrl+F5
Ignores break points being set, and executes the program.
Same function as [Run] menu -> [Ignore break points and Go].
Ctrl+F9
Sets the address at the cursor position in the Source Window or Assemble Window to
the PC.
Same function as [Run] menu -> [Change PC].
Ctrl+A
Selects all the events registered to the Event Manager.
Same function as [View] menu -> [Select All Event] in the Event Manager.
Ctrl+C
Copies a selected character string and saves it to the clipboard buffer.
364
User’s Manual
U18604EJ1V0UM
APPENDIX D KEY FUNCTION LIST
Key
Function
Ctrl+D
Disassembles and displays the results from the jump destination address specified by
the data value selected in the current window.Opens the Assemble Window.
Same function as [Jump] menu -> [Assemble].
Ctrl+E
Opens the source file displayed in the active Source Window with the editor specified by
the PM+ when the PM+ is running. Same function as [Edit] menu -> [Edit Source].
Ctrl+G
Performs a search.Opens the search dialog box corresponding to the current window.
Same function as [View] menu -> [Search...].
Ctrl+J
Moves the display position. Opens the each dialog box, depending on the current
window.
Same function as [View] menu -> [Move...].
Ctrl+M
Displays the memory contents from the jump destination address specified by the data
value selected in the current window. Opens the Memory Window.
Same function as [Jump] menu -> [Memory...].
Ctrl+O
Loads a view file, source file, or text file.
Opens the View File Load Dialog Box. The operation will differ depending on the
extension of the file.
view file: Displays the file in the corresponding window.
Others: Displays the file in the Source Window.
Same function as [File] menu -> [Open...].
Ctrl+S
Saves the data displayed in the current window to the view file.
Same function as [View] menu -> [Save...].
Ctrl+U
Displays the corresponding source text and source line, using the data value selected in
the current window as the jump destination address. Opens the Source Window.
Same function as [Jump] menu -> [Source Text].
Ctrl+V
Pastes the contents of the clipboard buffer to the text cursor position.
Ctrl+W
Temporarily displays the contents of the specified data.
Opens the Quick Watch Dialog Box.
Same function as [View] menu -> [Quick Watch...].
Ctrl+X
Cuts a selected character string and saves it to the clipboard buffer.
Same function as [Edit] menu -> [Cut].
Ctrl+Shift+Left arrow
key
Expands the selection range one word to the left.
Ctrl+Shift+Right
arrow key
Expands the selection range one word to the right.
User’s Manual
U18604EJ1V0UM
365
APPENDIX E MESSAGES
APPENDIX E MESSAGES
- Display Format
- Types of Messages
- Message Lists
E.1
Display Format
Messages are output to the error/warning dialog box.
By pressing the F1 key while the error/warning dialog box is open, the related online help files are displayed.
If the [This message is not to be shown until restart] checkbox is selected in dialog boxes that appears with this
checkbox, the message will no longer displayed while the ID850QB is running. When the ID850QB is started next
time, this message can be displayed (default: cleared).
Figure E-1 Error/Warning Dialog Box
Err type Err No.(hexadecimal number)
366
User’s Manual
U18604EJ1V0UM
APPENDIX E MESSAGES
E.2
Types of Messages
The ID850QB outputs the following types of messages.
Table E-1 Types of Messages
Types
Meaning
A
Abort Error
Stops processing, and terminates the debugger.
If this error occurs, debugging cannot be continued.
F
Fail
Stops processing, and opened windows and dialog boxes are closed.
W
Warning
Stops processing, but opened windows and dialog boxes are not closed.
E.3
Message Lists
< From X0000 > < From X1000 > < From X2000 > < From X3000 > < From X4000 > < From X5000 > <
From X6000 > < From X7000 > < From X8000 > < From X9000 > < From Xa000 > < From Xb000 > < From
Xc000 > <From Xd000 > < From Xe000 > < From Xf000 >
(1) From X0000
F0002: This feature is not supported.
F0100: Can not communicate with ICE. Please confirm the installation of the device driver for the PC interface
board.
1) Check the connection of the emulator power supply and cables.
2) The driver may not be correctly installed. Reinstall the driver.
A0101: Can not find initialization file (expc.ini).
A0102: Host name not found.
F0103: Data transfer to ICE is timed out. Please confirm the power of ICE, connection of the interface cable, or
I/O address of the PC interface board.
F0104: Data receive from ICE is timed out. Please confirm the power of ICE, connection of the interface cable,
or I/O address of the PC interface board.
A0105: Failed in reading device file (file name).
1) Necessary files may be damaged. Reinstall the device file.
A0106: Illegal data received.
1) Check the power of the emulator, cable connections, and setting of the interface board and restart
the debugger.
A0107: Can not communicate with ICE.
A0108: Failed in reading initialization file (expc.ini).
User’s Manual
U18604EJ1V0UM
367
APPENDIX E MESSAGES
A0109: Can not communicate with ICE. Please terminate the debugger and check the power of ICE or the
connection of cable then restart the debugger.
1) An error may have occurred during USB communication (such as disconnection of power or cable)
or IECUBE is faulty. [IECUBE]
A010a: Cannot run debugger and a utility at the same time.
1) The QB-Programmer, MINICUBE2 self-testing tool, or OCD Checker is running, so terminate it first.
2) MINICUBE2 is being used by ID78K0-QB, ID78K0S-QB, or ID78K0R-QB, so terminate it first.
3) MINICUBE2 is being used by MULTI or C-SPY, so terminate it first.
A01a0: No response from the evachip. Please confirm the signal of the CLOCK or RESET WAIT, HLDRQ and
so on.
No response from the CPU. Please confirm the signal of the CLOCK or RESET WAIT, HLDRQ and so
on.
1) Check the HOLD signal, WAIT signal, clock signal, etc. The IOR value (or SFR value) may not be
correct.
A01a1: Failed in reading ie703000.ie.
A01a2: Break board is not connected.
A01a3: Emulation board is not connected.
A01a4: Board configuration of ICE is not consistent.
A01a5: POD/EM1 board is not connected.
A01a6: Executor is running.
1) MINICUBE2 is being used by MULTI or C-SPY, so terminate it first.
A01a8: Failed to find configuration file (lv8hw.ini).
A01ad: Please update the device driver for the PC interface board.
1) The device driver may be old. Install the latest device driver.
A01ae: Failed in reading configuration file (lv8hw.ini).
A01af: Failed in executing monitor command.
A01b0: Can not communicate with monitor program. Please check the availability of communication port, the
setting of CPU board or the type of cable.
A01b1: Can not communicate with monitor program. Please terminate the debugger and check the power of
CPU board or the connection of cable then restart the debugger.
A01b2: The firmware of the emulator is old version. Please update it with utility to the latest firmware.
1) Update firmware using MQB2UTL.
F0200: Verification error occurred. Failed in writing memory.
1) External memory could not be accessed, as it is not set. Change the register values necessary for
accessing the external memory using the IOR Window or Hook Procedure before download.
F02a0: Bus hold error.
1) CPU is in the bus-hold status. Reset the debugger.
F02a2: Can not compulsory break.
368
User’s Manual
U18604EJ1V0UM
APPENDIX E MESSAGES
F02a3: Reset under continuation.
1) This error occurs when the RESET pin of MINICUBE2 does not become high level after reset
release. The following cause is assumed. [MINICUBE2]
- There is a problem in connection with the target system (RESET).
F02d2: Not enough memory for trace-buffer.
F0300: User program is running.
F0301: User program is being breaked.
F0302: User program is being traced.
F0303: Not traced.
F0304: Trace memory is not set.
F0306: No trace block exists.
F0307: No event condition exists.
F0308: No timer measurement is done.
F0309: No trigger frame exists.
F030a: Tracer is being stopped.
F030b: Specified snap-event has not been registered.
F030c: Specified stub-event has not been registered.
F030d: Timer is running.
F030e: Memory copy area is overlapped.
F030f: Trace has been already set.
F0310: Event condition is not set.
F0311: Too many valid timer event conditions.
F0312: Specified timer event is not set.
F0313: Illegal map range.
1) Check the map range in the Configuration Dialog Box. When mapping to external memory has been
performed, change the register values necessary for accessing the external memory using the IOR
Window or Hook Procedure before download).
F0314: Only trace delay mode can set with delay trigger.
F0315: Delay trigger cannot set without trace delay mode.
F0316: Overflowed the number of mapping.
F03a0: Target is not turned on.
1) Check the target system power supply. Check the cable connecting the emulator and target board.
Check that the VDD signal is input to the connector of the target board.
F03a1: Step execution is being done.
F03a2: Timer and Tracer are running.
F03a3: Event link and BRS events are mixed.
F03d0: Back-trace is being executed.
User’s Manual
U18604EJ1V0UM
369
APPENDIX E MESSAGES
F03d1: Back-trace is being stopped.
F03d2: Back-trace execution point overrun oldest frame.
F03d3: Register status or Memory status cannot be set up other than Phase1 of event link.
F03d4: No back-trace information exists.
F03d5: Last command can not be backstepped.
F0400: Illegal condition.
1) Settings of the used emulator and those of the Configuration Dialog Box may not match. Check the
Chip selection.
F0401: Result of timer measurement overflowed.
F0402: Too many event conditions with path count.
F0403: Too many address range conditions.
F0404: Too many simultaneously-usable-event conditions.
F0405: Too many snap-events.
F0406: Too many stub-events.
F0407: Too many initialization data.
F0408: Too large search data (> 16 byte).
F0409: Too large search data (> search range).
F040a: Too many Linking-event conditions.
F04a0: Software break conditions number overflow.
F04a1: Not enough memory for emulation.
F04a2: Too many partition of bus size.
F04a3: Too many execution-event conditions.
F04a4: Too many bus-event conditions.
A0600: Not enough memory for buffer.
1) There is not enough system memory. Close the applications being executed and the open files.
A0601: Not enough resource of operating system.
F0b20: This event number can not be used.
F0b61: Section Trace event conditions overflow.
F0b66: Cannot use the break before execution event and the software break at the same time.
1) This is because a break before execution is used for implementing a software break. [MINICUBE]
F0b80: Reset by hardware error.
F0c00: Monitor file read error.
1) Necessary files may be damaged. Reinstall the debugger.
A0c01: During access of register, CPU did time out.
1) Check the clock signal, etc. The register value may not be correct.
A0c02: During access of memory, CPU did time out.
1) Check the HOLD signal, WAIT signal, clock signal, etc. The memory value may not be correct.
370
User’s Manual
U18604EJ1V0UM
APPENDIX E MESSAGES
A0c03: During access of I/O register, CPU did time out.
1) Check the HOLD signal, WAIT signal, clock signal, etc. The I/O register value may not be correct.
F0c04: External flash memory database file was not found.
F0c1f: Rewriting security ID code directly is prohibited.
F0c20: Guarded area can not be accessed.
F0c21: Memory was unready status.
W0c22: Memory unready status was canceled.
F0c23: Bus hold under continuation.
1) Check the setting of the target board, or mask the HOLD pin.
F0c24: It cannot shift to debug mode.
1) Check the clock signal. This may be caused by a stopped clock or a slow clock.
2) This error occurs when the monitor program does not respond after reset release. The following
cause is assumed. [MINICUBE2]
- There is a problem in connection with the target system (FLMD0)
F0c25: Flash macro service ROM was accessed or stepped in.
1) Please perform [Go] execution or CPU reset.
F0c26: FLMD terminal is in a write-protected state.
1) FLMD is not in the write-enabled status. Check the status of the FLMD0 and FLMD1 pins.
F0c27: Security flag is in a write-protected state.
1) The security flag of the flash memory has disabled writing, block erasure, or chip erasure. Nothing
can be written to the flash memory.
F0c28:
Internal RAM is not enough, the writing to flash memory is not made.
1) The internal RAM size is less than 4 KB and flash self-programming cannot be executed.
F0c29: The blank check of flash memory failed.
F0c2a:
The erasing of flash memory failed.
F0c2b: The writing of flash memory failed.
F0c2c: The internal verification of flash memory failed.
F0c2d: Failed in writing flash memory.
F0c2e: There is no response from flash macro service.
F0c2f : Response from flash macro service is not right.
F0c30: Flash I/O register operation prohibition setup needs to be canceled.
F0c31: STOP mode under continuation. Can not compulsory break. Please release STOP mode or reset the
CPU.
F0c32: Please write in flash memory in the single chip mode 0.
F0c33: Disabling the on-chip debug function is prohibited.
1) An attempt was made to write "0" to the MSB of the ID code.
Do not write 0 to the MSB; otherwise, on-chip debugging cannot be performed. [MINICUBE2]
User’s Manual
U18604EJ1V0UM
371
APPENDIX E MESSAGES
F0c34: Writing to the on-chip debug reserved area is prohibited.
1) An attempt was made to write an illegal value to the area reserved for on-chip debugging. Do not
write to reserved areas. [MINICUBE2]
2) The program failed to overwrite to a code that branches to the monitor program onto the reset entry
code. Change the reset entry code to the specified code. [MINICUBE2]
F0c35: Abnormal Internal ROM size. The size is different from the default of the device.
F0c36: Abnormal Internal ROM size. The size is different from the default of the device.
F0c37: The voltage is too low to operate flash programming.
F0c38: Extended monitor area is not blank.
F0c39: Real-time RAM monitoring failed.
F0c3a: Writing the data flash area is not supported.
F0c3b: Can not write the data flash memory because of it is not in the data flash environment.
F0c3c : External flash memory information is not set.
F0c3d: Can not erase external flash memory.
F0c3e: Can not write external flash memory.
F0c40: Status of effective event conditions cannot be changed.
F0c41: Coverage test is being executed.
F0c42: Monitor has failed in shift in the debugging mode.Please reset the CPU.
F0c43: Connection of emulator cannot be performed.
1) The switch setting may be wrong if a desktop computer is used and two or more PC cards are
inserted. Check the setting. Or it may have malfunctioned. [MINICUBE]
2) Check the power to the emulator and cable connections. The switch setting may be wrong if a
desktop computer is used and two or more PC cards are inserted. Check the setting.
Or it may
have malfunctioned. [IECUBE]
3) Check the power to the emulator and cable connections. [MINICUBE2]
F0c44: Coverage test is being executed.
F0c45: Inside of Power off reset emulation cannot carry out program execution.
F0c46: Change of Internal ROM size or Internal RAM size or RAM monitor or DMM is not valid during Flash
Self Emulation.
F0c47: Emulation of ROM correction has already been enabled.
F0c60: Event before execution cannot be set up other than break conditions.
1) Use an event-after-execution.
F0c61: Can not register event numbers which can not be used for hardware break.
F0c62: Event numbers reserved for hardware breaks can not be used.
F0c63: Event link conditions cannot set.
F0c64: Too many ROM-emulation-RAM areas.
F0c67:
372
Writing of flash memory during block is not made.
User’s Manual
U18604EJ1V0UM
APPENDIX E MESSAGES
F0c68:
Cannot emulate of ROM correction in undefined code.
F0c69: The address outside the data flash area was specified.
F0c6a: The address outside the external flash memory area was specified.
F0c70: DCU cannot be accessed.
1) The device file selection may be incorrect. Select a device file that supports the target chip in Chip
Selection in the Configuration Dialog Box. Check the power to the chip. Check the connection of the
signal lines (DCK, DMS, DDI, DDO, and DRSTZ). Check the noise level by a DCK waveform test on
the N-Wire Checker. [MINICUBE]
2) IE may be malfunctioning. [IECUBE]
F0c71: Reset cannot be performed.
1) Check the clock signal. This may be caused by a stopped clock or a slow clock.
2) This error occurs when the RESET pin of MINICUBE2 does not become low level after reset. The following cause is assumed. [MINICUBE2]
- There is a problem in connection with the target system (RESET).
F0c72: Monitor memory cannot be accessed.
1) Revise the Main OSC value in the Configuration Dialog Box. Check the setting of main clock in the
Configuration Dialog Box , the noise level by a DCK waveform test on the N-Wire Checker. The
problem may also be caused by an internal chip problem. [MINICUBE]
2) Revise the Main OSC value in the Configuration Dialog Box. If this does not solve the problem, IE
may be malfunctioning . [IECUBE]
3) This error occurs when writing to the monitor program fails.
The following causes are assumed.
- There is a problem in connection with the target system (communication pins or FLMD0 pin)
- Selecting UART or CSI is wrong in the Configuration Dialog Box.
- The oscillation frequency that has been input in the Clock area in the Configuration Dialog Box
differs from that of the device on the target system. [MINICUBE2]
F0c73: Monitor execution cannot be performed.
1) Check the noise level by a DCK waveform test on the N-Wire Checker. The problem may also be
caused by an internal chip problem. [MINICUBE]
2) IE may be malfunctioning. [IECUBE]
3) This error occurs when the ID code was changed during user program execution.Do not change the
ID code in the user program. [MINICUBE2]
User’s Manual
U18604EJ1V0UM
373
APPENDIX E MESSAGES
F0c74: CPU register cannot be accessed.
1) Check the noise level by a DCK waveform test on the N-Wire Checker. The problem may also be
caused by an internal chip problem. [MINICUBE]
2) The device file selection may be incorrect. Select a device file that supports the target chip in Chip
Selection in the Configuration Dialog Box. If this does not solve the problem, the IE may be
malfunctioning. [IECUBE]
3) An attempt was made to start the debugger with a monitor file that is not supported by the device on
the target system. Check if a device is selected correctly in the debugger. [MINICUBE2]
F0c75: Monitor has failed in shift in the debugging mode. Please reset the CPU.
F0c76: Initial state at the time of DCU access start is unusual.
1) Initial state at the time of DCU access start is unusual (does not start and remains in the reset state).
Check the connection of the signal lines (DCK, DMS, DDI, DDO, and DRSTZ). Check the noise
level by a DCK waveform test on the N-Wire Checker. [MINICUBE]
2) The device file selection may be incorrect. Select a device file that supports the target chip in Chip
Selection in the Configuration Dialog Box. If this does not solve the problem, the IE may be
malfunctioning . [IECUBE]
F0c77: DCU access is unusuall.
1) DCU access is unusuall (verify error). Check the connection of the signal lines (DCK, DMS, DDI,
DDO, and DRSTZ).
Check the noise level by a DCK waveform test on the N-Wire Checker.
[MINICUBE]
2) IE may be malfunctioning. [IECUBE]
F0c78: Failed in reading of trace data.
F0ca0: Can not communicate with ICE. Please confirm the power of ICE, connection of the interface cable, or
I/O address of the PC interface board.
F0ca1: Monitor file not found.
1) Necessary files may be damaged. Reinstall the debugger.
2) This error occurs when an unsupported device is selected. Check if the selected device is supported.
F0ca2: This device file does not include the on-chip debug information.
1) An attempt was made to start with a device file not supporting on-chip debugging. The device file
may be old. Install the latest device file. [MINICUBE] [MINICUBE2]
2) IE may be malfunctioning. [IECUBE]
F0ca3: Unsupported information is included in the on-chip debug information in the device file.
1) An unknown flag is included in the on-chip debug information of the device file.The exec module may
be old. Install the latest exec module.
F0ca4: This device file does not include the IECUBE information.
1) An attempt was made to start with a device file not supporting IECUBE. The device file may be old.
Install the latest device file.
F0caf:
374
Trace block can not be stepped over.
User’s Manual
U18604EJ1V0UM
APPENDIX E MESSAGES
(2) From X1000
A1000: Failed in initializing ICE.
A1001: No entry exists for specified number.
A1002: Can not relocate internal RAM.
F1003: Illegal relocation address.
F1004: Illegal condition.
A1005: Invalid attribute.
F1006: Illegal address.
A1007: Not enough memory on ICE.
A1008: Not enough memory for tables.
1) There is not enough system memory. Close the applications being executed and the open files.
A1009: Already initialized.
A100a: Not initialized.
F100b: User program is running.
F100c: Different bus size has been already specified.
F100d: Too large bus size.
F100e: Too large bus partition size.
W100f: Target is not turned on.
F1010: Illegal map range.
F1011: Failed in setting internal ROM and RAM.
F1012: This feature is not supported.
F1013: No terminal name.
W1014: Data is not exist.
A1015: Programmable-IOR does not exist.
F1016: Programmable-IOR does not movable.
1) Necessary files may be damaged. Reinstall the latest device file.
F1017: I/O Protect mapping is possible a target attribute only.
F1018: Illegal Internal ROM size.
F1019: Illegal internal ROM size or internal RAM size.
F101d: Data flash area does not movable.
F101e: Data flash area does not exist.
A10ff:
Can not communicate with ICE.
A1dbe: Error occurred inside debugger.
(3) From X2000
F2000: Illegal IOR name.
User’s Manual
U18604EJ1V0UM
375
APPENDIX E MESSAGES
A2001: Illegal address.
F2002: User program is running.
F2003: Illegal IOR number.
F2004: Illegal bit number.
W2005: IOR of Read Protect attribute was specified.
F2006: Hidden IOR was specified.
F2007: IOR of ban read or write was specified.
F2008: IOR not existing was specified.
A2009: Device file is damaged or error is in file.
F200a: Illegal value specified for IOR.
A200b: Can not copy.
A200c: Not enough memory.
1) There is not enough system memory. Close the applications being executed and the open files.
W200d: No initialize data for IOR.
F200e: IOR area can not be accessed.
A20ff:
Can not communicate with ICE.
A2222: Illegal condition.
(4) From X3000
F3000: No mapped address was accessed.
1) The allocation addresses of the program and the addresses of the debugger may not match.
Set the mapping to the external memory in the Configuration Dialog Box according to the allocation
addresses specified in the link directive file on compilation. When mapping to external memory has
been executed, change the register values necessary for accessing the external memory using the
IOR Window or Hook Procedure before download.
F3001: Memory has different value.
F3002: Illegal start address.
F3003: Illegal end address
F3004: Illegal start address and end address.
F3005: Illegal condition.
F3006: User program is running.
F3007: Verification error.
F3008: No condition specified.
F3009: Parameter size does not align with access size alignment.
F300a: Specified address does not align with access size alignment.
F300b: Source address does not align with access size alignment.
F300c: Destination address does not align with access size alignment.
376
User’s Manual
U18604EJ1V0UM
APPENDIX E MESSAGES
F300d: Illegal end address.
F300e: Different access size in specified area.
F300f: Different access size both in source and destination areas.
F3010: Different access size in destination area.
F3011: Different access size, source & destination.
A3012: Not enough memory.
1) There is not enough system memory. Close the applications being executed and the open files.
F3013: Failed in writing DMM.
F3014: Oveflowed mapping area.
F3015: Processing was interrupted.
F3016: This feature is not supported.
A30ff:
Can not communicate with ICE.
(5) From X4000
F4000: Can not delete specified event.
1) The specified event cannot be deleted as it is being used under another condition. Invalidate it for
other usages before deleting.
F4001: Illegal table number.
F4002: Illegal start address.
F4003: Illegal end address.
F4004: Illegal status.
F4005: Illegal data.
F4006: Specified event number has been already used.
F4007: Too many same events are registered.
F4008: Specified event has not been registered.
F4009: Illegal data size.
F400a: Illegal mode.
F400b: Setting value is inaccurate.
F400c: Event link conditions cannot be used for section trace conditions.
F400d: Too many identical events are registered (>= 32767).
F400e: Specified event condition does not exist.
F400f: Illegal event link condition.
F4010: Function not found.
A4011: Not enough memory.
1) There is not enough system memory. Close the applications being executed and the open files.
F4012: Timer is being disabled.
User’s Manual
U18604EJ1V0UM
377
APPENDIX E MESSAGES
W4013: Access size is different from its mapped bus size.
F4014: Can not use software break.
F4015: Can not use event condition specifying address range.
F4016: Can not change event condition.
F4017: Can not access word at odd address.
A4018: Not enough memory.
1) There is not enough system memory. Close the applications being executed and the open files.
F4019: This feature is not supported.
F401a: No Event.
F401b: Can not use tag-event.
W401c: Software break can not be set on this area.
F401d: Start event and end event of timer are not made to the same setup.
F401e: Too many trace-events.
F401f: Path count cannot be set up.
F4020: Address range cannot be set up in event before execution.
F4021: Event conditions number overflow.
F4022: Software DMM conditions number overflow.
F4023: Real-time call conditions number overflow.
F4024: Software break call conditions number overflow.
F4025: Illegal snap condition.
F4026: Too many event conditions cannot be set as Phase1 and Phase2 of event link conditions.
F4027: Software break conditions number which can be set as internal ROM was overflow.
F4318: Illegal memory bank setting.
(6) From X5000
A5000: Illegal device file type.
A5001: Not enough memory.
1) There is not enough system memory. Close the applications being executed and the open files.
A5002: Can not open device file.
A5003: Reading of device file went wrong.
A5004: Can not close device file.
A5005: Illegal device file format.
1) Necessary files may be damaged. Reinstall the device file.
A5006: Failed in initializing ICE.
A5007: Device file has broken or error is in a file.
378
User’s Manual
U18604EJ1V0UM
APPENDIX E MESSAGES
F5008: Can not open device file.
1) Necessary files may be damaged. Reinstall the device file.
F5009: Can not open ie703000.ie
F500a: Specified device file is illegal version.
1) Necessary files may be damaged. Reinstall the device file.
W500b: Specified device file does not relocate internal RAM.
A500c: Failed in reading expc.ini.
A500d: Not enough memory.
1) There is not enough system memory. Close the applications being executed and the open files.
W500e: No tag data which it was going to refer to device file.
A5300: Illegal device file type.
A5301: Not enough memory.
1) There is not enough system memory. Close the applications being executed and the open files.
A5302: Can not open database file.
1) Necessary files may be damaged. Reinstall the debugger and device file.
A5303: Reading of database file went wrong.
A5304: Can not close database file.
A5305: Illegal database file format.
1) Necessary files may be damaged. Reinstall the debugger, and device file.
A5306: Database information has been already initialized.
A5307: Database information does not exist.
F5308: Can not open specified database file.
1) Necessary files may be damaged. Reinstall the debugger.
F5309: Specified database file is illegal version.
1) Necessary files may be damaged. Reinstall the debugger, and the device file.
(7) From X6000
F6000: Current function does not exist.
F6001: Illegal symbol name.
F6002: Illegal condition.
F6003: Illegal function name.
F6004: Overflowed output buffer size.
F6005: Illegal expression.
(8) From X7000
F7000: Illegal mode.
User’s Manual
U18604EJ1V0UM
379
APPENDIX E MESSAGES
F7001: User program is running.
F7002: User program has been stopped.
F7003: Trace enabled.
F7004: Trace memory is not set.
F7005: Function return address does not exist, can not do step execution.
W7010: No source information exists.
W7011: Unknown result of step execution.
A7012: Not enough memory.
1) There is not enough system memory. Close the applications being executed and the open files.
A70fe: Bus hold error.
1) CPU is in the bus-hold status. Reset the debugger.
A70ff:
Can not communicate with ICE.
F7801: End waiting state of step execution was canceled.
F7802: End waiting state of step execution was canceled.
F7f00: Aborted step execution.
F7f02: Suspended step execution.
A7f03: Failed in canceling RUN/STEP.
F7f04: Can not execute non-mapped area.
F7f05: This feature is not supported.
(9) From X8000
F8000: Specified file was not found.
F8001: Illegal line number.
F8002: Current information is not set.
F8003: Illegal address.
F8004: This feature is not supported.
(10) From X9000
A9000: Specified register symbol does not exist.
A9001: Specified register symbol ID does not exist.
F9002: Illegal value.
A9003: Illegal condition.
A9004: Too large register size.
F9005: This feature is not supported.
380
User’s Manual
U18604EJ1V0UM
APPENDIX E MESSAGES
(11) From Xa000
Fa001: Illegal expression.
Fa002: Start address is bigger than the end address.
Fa003: Illegal source path.
Fa004: Too long expression.
Aa005: Not enough memory.
1) There is not enough system memory. Close the applications being executed and the open files.
Fa006: Illegal argument.
Fa007: Illegal program number.
Fa008: Source path is not set.
Fa009: File not found.
Fa00a: Can not open file.
1) The file is damaged or does not exist. Recreate the file.
Aa00b: Can not close file.
Aa00c: Failed in reading file.
1) The file is damaged or does not exist. Recreate the file.
Fa00d: Not source file of load module.
Fa00e: Illegal line number.
Fa00f: Variable does not exist.
Aa010: Can not communicate with ICE.
Fa011: Can not access register.
Fa012: Can not access memory.
Aa013: Reading of file went wrong.
Fa014: It was going to open the binary file.
Fa015: Can not get temporary path.
1) The disk is full. Delete or move unnecessary files and increase the available memory in the disk.
Fa016: Can not create temporary file.
1) The disk is full. Delete or move unnecessary files and increase the available memory in the disk.
Fa017: Can not remove temporary file.
Fa020: This feature is not supported.
Fa021: Symbol assigned to register cannot be specified.
Fa022: The character which cannot be used for the folder is contained or the folder does not exist.
(12) From Xb000
Fb000: Illegal command line.
Fb001: Program information does not exist in specified load module file.
User’s Manual
U18604EJ1V0UM
381
APPENDIX E MESSAGES
Fb002: File not found.
Fb003: Function not found.
Fb004: Selected load module different from kind (Chip) was loaded.
Fb005: Symbol not found.
1) The address could not be found. Specify a location holding address information.
Fb008: Illegal expression.
Ab009: Not enough memory.
1) There is not enough system memory. Close the applications being executed and the open files.
Fb00a: Illegal symbol in load module file.
Fb00b: Current program does not exist.
Fb00c: Current file does not exist.
Ab00d: Current function does not exist.
Ab00e: Current line does not exist.
Ab00f: Tag not found.
Ab010: Failed in loading symbol table.
Ab011: Illegal line number.
Fb012: Too large line number.
Ab015: Reading of file went wrong.
1) The file is damaged or does not exist. Recreate the file.
Ab016: Can not open file.
1) The file is damaged or does not exist. Recreate the file.
Ab017: Failed in writing file.
1) The file is damaged or does not exist. Recreate the file.
Ab019: Reading of file went wrong.
Ab01a: Can not close file.
Fb01b: Too long load module file name.
Ab01c: Too many entries of the task kind.
Fb01d: Address not found.
Wb01e: No debug information (not compiled in Debug Build mode).
Fb01f: Can not find structure member.
Fb020: Can not find value.
Fb021: There are neither debug information nor symbol information in load module file.
1) To create a load module with appended debug information, execute build in build mode of Debug
Build.
Fb022: Illegal line number.
Ab023: Current stack frame is not active.
Ab024: Different section.
382
User’s Manual
U18604EJ1V0UM
APPENDIX E MESSAGES
Fb026: Too many array dimensions (> 4).
Fb027: Found end of file.
1) The specified file may be damaged. Recreate the file.
Fb028: This feature is not supported.
Fb029: Illegal address.
Ab02a: Can not communicate with ICE.
Fb02b: Can not stack trace with current PC value.
Fb02c: Too many blocks for one function.
Fb02d: Illegal argument.
Fb02e: The file does not exist in the SOURCE PATH.
1) On stopping the program, the source that the debugger tried to display could not be found. Check if
the path connects to the source in the Debugger Option Dialog Box, or check if the source is in the
same directory as the out file. Refer to the Assemble Window on which the error message is
displayed, and check if the corresponding path connects.
Fb02f: Information has been deleted because of optimization.
Ab030: Monitor timed out.
1) Check the power of the emulator, cable connections, and setting of the interface board and restart
the debugger.
Ab031: Already set in memory.
Ab032: Out of scope.
Ab033: LP is not stored.
Fb034: Return execution from present PC position cannot be performed.
Wb036: Out of variable region.
Fb037: Too Many Line-Numbers Information.
Fb038: Compiler version mismatch.
1) Recreate the load module with the latest compiler.
Ab039: Failed in loading debug information.
Ab03a: No more section information.
Fb040: Specified file is not load module.
1) This is not a linker output file. Source debug cannot be executed with the load module before output
from the linker. Specify the load module output from the linker.
Ab041: Too many files in load module to download.
Wb042: Symbol module is not initialized.
Fb32e: Illegal port number.
Fb32f: Illegal port name.
Fb330: Illegal port position.
Fb331: Illegal increment number.
User’s Manual
U18604EJ1V0UM
383
APPENDIX E MESSAGES
Fb332: Port for memory bank is not set.
Fb333: Illegal bank number.
Fb334: Area for memory bank is not set.
Wb335: Too long symbol name.
(13) From Xc000
Fc001: Can not open file.
1) The file is damaged or does not exist. Recreate the file.
Ac002: Can not close file.
Ac003: Reading of file went wrong.
1) The file is damaged or does not exist. Recreate the file.
Ac004: Reading of file went wrong.
Fc005: Illegal file type.
Fc006: Kind (Chip) of load module is illegal.
Fc007: Specified file is not load module.
1) This is not a linker output file. Source debug cannot be executed with the load module before output
from the linker. Specify the load module output from the linker.
Fc008: Specified load module file (ELF) is old version.
Ac009: Not enough memory.
1) There is not enough system memory. Close the applications being executed and the open files.
Fc00a: No mapped address was accessed.
Fc00b: Load module is not loaded.
Fc00c: Illegal argument.
Fc00d: User program is running.
Fc00e: User program is being traced.
Fc00f:
Interrupted.
Ac010: Can not communicate with ICE.
Fc011: Illegal load module file format.
Fc012: Check sum error.
Fc013: Too wide address range to upload (> 1MB).
Fc014: Failed in writing file.
1) The file is damaged or does not exist. Recreate the file.
Fc015: Illegal program number.
Fc016: Load information is full.
Wc017: Symbol information is duplicated, please reset symbols.
384
User’s Manual
U18604EJ1V0UM
APPENDIX E MESSAGES
Fc018:Specified file is not load module.
1) This is not a linker output file. Source debug cannot be executed with the load module before output
from the linker. Specify the load module output from the linker.
Fc019: Failed in writing memory.
Wc01a: BSS area is assigned to non-mapped area.
1) When the program is executed, a non-map break may occur. Either allocate the BSS area to the
internal RAM by using a link directive, or map the emulation memory or target memory to the BSS
area using the Configuration Dialog Box of the debugger.
Fc01b: Programmable-IOR address not specified.
1) Necessary files may be damaged. Reinstall the debugger.
Wc01c: Programmable IOR address mismatch.
1) Necessary files may be damaged. Reinstall the debugger.
Wc01d: Selected load module different from kind (Chip) was loaded.
Fc01e: .Flash erase is not supported.
Fc01f: This feature is not supported.
Fc021: The debugger can't download at high speed because the object file has the code out of the internal
ROM and the internal RAM.
(14) From Xd000
Ad000: Error occurred inside debugger.
Ad001: Not enough memory.
1) There is not enough system memory. Close the applications being executed and the open files.
Ad002: Failed in reading initialization file (expc.ini).
Ad003: ICE is not connected.
Fd004: Can not find Dynamic Link Library.
(15) From Xe000
Fe000: Illegal argument.
Fe001: Illegal start address.
Fe002: Illegal end address.
Fe003: Too large size.
Fe004: Can not open file.
1) The file is damaged or does not exist. Recreate the file.
Fe005: Failed in reading file.
1) The file is damaged or does not exist. Recreate the file.
Fe006: Reading of file went wrong.
User’s Manual
U18604EJ1V0UM
385
APPENDIX E MESSAGES
Fe007: Failed in writing file.
1) The file is damaged or does not exist. Recreate the file.
Ae008: Not enough memory.
1) There is not enough system memory. Close the applications being executed and the open files.
Fe009: Illegal file format.
Fe00a: Verification error.
Fe010: This feature is not supported.
(16) From Xf000
Af000: Not enough memory.
1) There is not enough system memory. Close the applications being executed and the open files.
Ff000: Not enough memory.
Ff001: [XXX] not found.
Wf002: Not found [XXX]. Search from the beginning?
Wf003: Already exceed search region.
Ff004: Missing parameter.
Ff005: Illegal function name.
Ff006: Illegal number.
Ff007: Start address is bigger than end address.
Ff008: Illegal symbol or expression.
Ff009: [XXX] This file is illegal type.
Ff100: Disk cannot write or full.
Ff101: File not found.
Ff102: File not Create.
Ff103: Old project file version.
Ff104: Illegal project file format.
Ff105: This file is a project file for [XXX].Please select a correct file.
Wf106: CPU in the Project File was Changed. You must exit the debugger for the new CPU. Do you exit the
Debugger?
Wf107: CPU in the Project File was Changed. Do you start the Debugger with this CPU?
Wf108: Selected project file different [YYY] from chip [XXX] was opened. Does it open, although the chip cannot
be changed?
Wf109: Project Manager cannot be used with the debugger of this version. Please use PM+.
Wf200: No difference encountered.
Ff201: Memory mapping error.
386
User’s Manual
U18604EJ1V0UM
APPENDIX E MESSAGES
Ff202: Verify error.
1) External memory could not be accessed, as it is not set. Change the register values necessary for
accessing the external memory using the IOR Window or Hook Procedure before download .
Wf203: When a program is running, while rewriting a memory, program execution stops for a moment. Do you
wish to rewrite a memory?
Wf204: There is an enabled software break point, Failed in DMM.
Wf300: Would you like to save the changes made in [XXX]?
Ff301: The symbol being used on the event condition can't be evaluated.
Wf302: Delete: [XXX]
Wf303: [XXX] is edited. Delete: [YYY]?
Wf304: [XXX] is edited. Save: [YYY]?
Wf305: [XXX] is already exist. Do you replace it?
Ff306: This name is too long.
Ff307: There is the same name in other kinds.
Ff308: An address can't be omitted.
Ff309: Illegal address mask.
Ff30a: Illegal data mask.
Ff30b: Illegal ext probe mask.
Ff30c:
Illegal ext probe data.
Ff30d: Illegal pass count.
Ff30e: Illegal register name.
Ff30f:
Illegal register bank.
Ff310: Illegal delay count.
Wf311: Only one [XXX] can be enabled. Do you make this [YYY] to enable?
Ff312: [XXX] is already there.
Ff313: Event number already exist.
Ff314: Event name is not set.
Ff315: [XXX] is already there.
Ff316: Max number of enabled [XXX] event is over. Please disable other enabled [YYY] event.
Ff317: Max number of set event is over.
Ff31e: Illegal start address.
Ff31f:
Illegal end address.
Ff322: Illegal count rate.
Ff323: Illegal time out break count.
Ff324: Section and Qualify can be specified at the same time.
Wf325: User program is running. Do you want to stop user program for a moment and set it?
Wf326: User program is running. Do you want to stop user program for a moment and delete it?
User’s Manual
U18604EJ1V0UM
387
APPENDIX E MESSAGES
Ff327: RAM monitor was enabled, a software break point cannot be used.
Wf328: The software break conflicted with the hardware break.
There is a possibility of executing an illegal instruction by re-execution after the break.
1) Reset the CPU. If a fetch hardware break is set, do not set a software break in its neighborhood. If
an access hardware break is set, do not set a software break.
Ff350: There is a phase which event are not in the middle.
Ff351: The same event is contained in Link and Disable.
Ff352: An event isn't specified.
Ff357: AND event is in Phase.
Ff400: Coverage mapping error.
Wf401: Clear coverage?
Ff500: Illegal symbol.
Ff501: Illegal value.
Ff502: Illegal parameter.
Ff503: Max number of symbol is over.
Ff504: This variable cannot be set as a break.
1) Break cannot be set for the following variables.
- Local variables, static variables
- Array variables, member variables of structures/unions
- Register/peripheral I/O registers
- Variable expressions
Wf600: Save project file?
Wf601: When connecting the target system, please turn on the target system.
1) When a target system is not connected, simply click the <OK> button.
Wf602: Please change a MODE mask condition or connect the target system.
Ff603: Incorrect ID Code.
1) This may be caused by the following. [MINICUBE]
- The ID code is incorrect.
-> Input the correct ID code.
- The internal flash memory is in the write mode because the FLMD0 pin is high.
-> Make the FLMD0 pin low.
- The emulator connection prohibition mode is set because the ID code (bit 7 of address 0x79) is 0.
->Erase the internal flash memory once.
388
User’s Manual
U18604EJ1V0UM
APPENDIX E MESSAGES
Af604: Incorrect ID Code. Abort the debugger.
1) This may be caused by the following. [MINICUBE]
- The ID code is incorrect.
-> Input the correct ID code.
- The internal flash memory is in the write mode because the FLMD0 pin is high.
-> Make the FLMD0 pin low.
- The emulator connection prohibition mode is set because the ID code (bit 7 of address 0x79) is 0.
->Erase the internal flash memory once.
Ff605: Please check connection with the target board.
1) Check the connection of the target connector (TC). If a target system is not connected, review the
Target setting in the Configuration Dialog Box.
Ff606: Please check connection with the target board, and power on it.
1) Check the target system power supply. If a target system is not connected, review the Target setting
in the Configuration Dialog Box.
Wf607: Please check connection of the exchange adapter.
1) Check the connection of the exchange adapter (EA).
Recommend wearing of the exchange adapter, if the target system is not connected.
Ff608: Please disconnect the target board.
1) A current may flow from the internal power supply to the target system. Disconnect the target system
connector (TC) from the conversion adapter (EA). Review the setting in the Configuration Dialog Box
if the target system is not connected.
Ff609: Please power off the target board, and disconnect it.
Af60a: Incorrect ID Code. Flash memory was erased. Abort the debugger.
1) This message is displayed if ID authentication address 0x84 results in failure when the mode to erase
the flash memory contents has been set, and the flash memory contents are erased. [MINICUBE]
Af60b: Disabled ID Code. Flash memory was erased. Abort the debugger.
1) This message is displayed if the target system connection cable is disconnected when using the
debugger in power off emulation mode, when the debugger is activated after the target system power
is turned off, or when the flash memory contents are erased. [MINICUBE]
Af60c: During break Target was not turned on.
Wf60d: Because the Source Path had exceeded 8191 characters, it rounded it down.
Wf700: Do you want to download Load Module File?
Wf701: Do you load symbol information only?
Wf800: Configuration of Memory Bank is not set.
Wf801: BANK address must be in target memory.
Ff802: All events are deleted. because the use of external probe was changed.
Ff803: This event address is invalid on current configuration.
Ff804: Invalid PC value.
User’s Manual
U18604EJ1V0UM
389
APPENDIX E MESSAGES
Ff805: Cannot set temporary break on this address.
Ff806: External data is being used by Debugger.
Ff900: Illegal I/O port name.
Ff901: Memory mapping error.
1) The specification of the address is illegal. Check the addresses that can be specified in the Add I/O
Port Dialog Box.
Ff902: Illegal access size.
Ff903: Illegal access type.
Ff904: There is the same name.
Wf905: [XXX] is already exist. Do you replace it?
Wf906: Would you like to register the change made in [XXX]?
Ffa00: The [XXX] function of current program on PC position not found.
1) The symbol specified in main() label: in the Debugger Option Dialog Box could be found. Set a
symbol of the main routine of the program. Default is _main.
Ffa01: The line information on PC position not found.
1) The source file corresponding to program counter (PC) value when the program was stopped could
not be found. The following reasons are possible.
-The source file exists in a location that the source path does not connect to.
-The program stopped where the source files, such as library or RX, do not exist.
-The program looped, jumped to an address that is not used by the program, and stopped there.
Wfb00: User program is running. Do you want to stop user program?
1) <Yes> button is selected, execution of the user program is stopped and then the Exit Debugger
Dialog Box is displayed. If it is specified in the Debugger Option Dialog Box that the Exit Debugger
dialog box is not to be displayed, however, the ID850QB is terminated.
<No> button is selected, execution of the user program is not stopped and the Exit Debugger Dialog
Box is not displayed. The ID850QB is not terminated.
Wfb01: Since bit 7 of address 0x79 in the ID code are 0, The N-Wire emulator becomes prohibition of use
henceforth. Do you exit the debugger as it is?
Ffc00:
Online help window cannot be started. Please install HTML Help environment with reference to a users
manual.
Wfc01: There is a bank of write mode in the instruction RAM. (IRAMM=0x??) Do you go on to execute?
Ffd00: Failed to specify [XXX].
Ffe00: The maximum size of RRM was exceeded.
Wfe01: There is a duplicate RRM address.
Wfe0b: It shift to the flash mode. Is it completely cleared but is the present event. Doesn't it care?
Ffe0c:
RAM monitor is enabled.
The present software break points are completely disabled. Doesn't it care?
Fffff:
390
Interrupted.
User’s Manual
U18604EJ1V0UM
APPENDIX F INDEX
APPENDIX F INDEX
A
About Dialog Box ... 284
access monitor ... 205
Access monitor function ... 65
Active status and static status ... 95
Add I/O Port Dialog Box ... 227
Add Watch Dialog Box ... 193
Address Move Dialog Box ... 180
Assemble Search Dialog Box ... 178
Assemble Window ... 174
AZ850 ... 24
DWARF2 ... 25
E
Emulation RAM ... 43
Emulation ROM ... 43
Environment Setting File Load Dialog Box ... 281
Environment Setting File Save Dialog Box ... 280
Error messages at start up ... 33
Errors ... 366
Event Dialog Box ... 264
Event function ... 82
Event icon ... 86
Event Link Dialog Box ... 269
Event Manager ... 260
Event manages ... 86
Event Setting Status (Event Mark) ... 166
Exit Debugger Dialog Box ... 283
Expansion window ... 340
Expressions ... 360
Extended Option Dialog Box ... 127
B
break
breakpoint setting ... 51
setting break to variable ... 52
Break Dialog Box ... 272
break function ... 50
Browse Dialog Box ... 286
C
C0 coverage ... 78
CA850 ... 24
callback procedure ... 294
Cautions before starting ... 27
Change Watch Dialog Box ... 196
character set ... 357
clock ... 123
Code Coverage ... 78
Code Coverage Window ... 252
Come Here ... 57
command ... 285
Command reference ... 288
Complement mode ... 73
Conditional trace ... 74
Configuration Dialog Box ... 118
Console Window ... 285
Contents saved to project file ... 92
Context menu ... 105
Coverage-Address Dialog Box ... 255
Coverage-Color Dialog Box ... 257
F
Fail-safe Break Dialog Box ... 133
Flash Option Dialog Box ... 137
G
-G -dual_debug ... 25
-g option ... 24
GHS ... 25
H
hook procedure ... 295
I
I/O Protect ... 43
ID code ... 24
ID Tag ... 205
IECUBE ... 21
In-circuit emulator ... 23
input conventions ... 357
Installing ... 26
IOR Select Dialog Box ... 225
IOR Window ... 221
D
Data Flafh Memory ... 121
Data Flash Option Dialog Box ... 147
Debug function list ... 41
Debugger Option Dialog Box ... 150
Delay Count Dialog Box ... 250
Delay trigger trace ... 76
DMA ... 72
DMM Dialog Box ... 214
download ... 44
Download Dialog Box ... 158
drag & drop function ... 98
J
jump function ... 96
L
List Window ... 183
Load Module List Dialog Box ... 163
User’s Manual
U18604EJ1V0UM
391
APPENDIX F INDEX
Load/Save Function ... 92
Local Variable Window ... 198
Locations for which coverage measurement is
executed ... 80
M
Main Window ... 106
Mask ... 124
Memory Compare Dialog Box ... 212
Memory Compare Result Dialog Box ... 213
Memory Copy Dialog Box ... 211
Memory Fill Dialog Box ... 210
Memory manipulation function ... 64
Memory Search Dialog Box ... 208
Memory Window ... 203
Menu bar ... 107
Messages ... 366
Midas Lab ... 28
MINICUBE ... 22
MINICUBE2 ... 22
Mixed display mode
Source Window ... 48
Trace View Window ... 74
N
N-Wire CARD ... 22
N-Wire Checker ... 27
O
OCD Checker ... 27
Operating Environment ... 23
Operators ... 360
Others
Grep window ... 342
Hook window ... 344
Memory Mapped I/O dialog box ... 348
Memory Mapped I/O window ... 346
RRM window ... 343
Run Break Timer window ... 350
Sym Inspect window ... 349
P
PM+ ... 24, 36
Point mark area ... 166, 175
program code ... 167
Program execution function ... 56, 58
project file ... 92, 283
Project File Load Dialog Box ... 157
Project File Save Dialog Box ... 156
Q
Qualify trace ... 76
Quick Watch Dialog Box ... 191
R
Range of Radixes ... 362
Register Manipulation Function ... 67
392
User’s Manual
Register Select Dialog Box ... 219
Register Window ... 216
Relationship between the time tag counter division
ratio and maximum measurement time ... 128
Relationship between the timer count division ratio
and maximum measurement time ... 130
reset ... 282
Reset Debugger Dialog Box ... 282
RRM Setting Dialog Box ... 135
RTE-2000H-TP ... 28
rte4win32 ... 28
Run-Break event ... 70
S
Section trace ... 76
Security ID ... 24
Setting debugging environment ... 42
setting file ... 94
Setting mapping ... 43
Software Break Manager ... 258
Source Search Dialog Box ... 170
Source Text Move Dialog Box ... 172
Source Window ... 165
Stack trace display function ... 63
Stack Window ... 200
Start From Here ... 57
Startup option ... 29
Startup Routine ... 154
Status bar ... 116
Symbol To Address Dialog Box ... 181
T
Target ... 43
Target ROM ... 43
Tcl
assemble ... 299
batch ... 300
breakpoint ... 301
cache ... 303
dbgexit ... 304
dbgopt ... 305
download ... 306
efconfig ... 307
erase ... 309
extwin ... 310
finish ... 311
flop ... 312
go ... 313
help ... 314
hook ... 315
ie ... 316
inspect ... 317
jump ... 318
map ... 319
mdi ... 321
memory ... 322
module ... 323
next ... 324
refresh ... 325
register ... 326
reset ... 327
U18604EJ1V0UM
APPENDIX F INDEX
run ... 328
step ... 329
stop ... 330
tkcon ... 331
upload ... 332
version ... 333
watch ... 334
where ... 335
wish ... 336
xcoverage ... 337
xtime ... 338
xtrace ... 339
Tcl command list ... 289
Timer Dialog Box ... 229
Timer function ... 69
Timer Result Dialog Box ... 232
Trace complement ... 73
Trace Data Select Dialog Box ... 243
Trace Dialog Box ... 247
Trace function ... 72
trace memory ... 72
Trace Move Dialog Box ... 245
Trace Result with Linking Window ... 98
Trace Search Dialog Box ... 239
Tracer control mode ... 75
TW850 ... 24
Types of Messages ... 367
U
Unconditional trace ... 74
Uninstalling ... 26
upload ... 46
Upload Dialog Box ... 161
V
Verify check ... 131
view file ... 93
View File Load Dialog Box ... 278
View File Save Dialog Box ... 276
W
Watch function ... 60
Watch Window ... 186
window list ... 102
window reference ... 102
User’s Manual
U18604EJ1V0UM
393
For further information,
please contact:
NEC Electronics Corporation
1753, Shimonumabe, Nakahara-ku,
Kawasaki, Kanagawa 211-8668,
Japan
Tel: 044-435-5111
http://www.necel.com/
[America]
[Europe]
[Asia & Oceania]
NEC Electronics America, Inc.
2880 Scott Blvd.
Santa Clara, CA 95050-2554, U.S.A.
Tel: 408-588-6000
800-366-9782
http://www.am.necel.com/
NEC Electronics (Europe) GmbH
Arcadiastrasse 10
40472 Düsseldorf, Germany
Tel: 0211-65030
http://www.eu.necel.com/
NEC Electronics (China) Co., Ltd
7th Floor, Quantum Plaza, No. 27 ZhiChunLu Haidian
District, Beijing 100083, P.R.China
Tel: 010-8235-1155
http://www.cn.necel.com/
Hanover Office
Podbielskistrasse 166 B
30177 Hannover
Tel: 0 511 33 40 2-0
Munich Office
Werner-Eckert-Strasse 9
81829 München
Tel: 0 89 92 10 03-0
Stuttgart Office
Industriestrasse 3
70565 Stuttgart
Tel: 0 711 99 01 0-0
United Kingdom Branch
Cygnus House, Sunrise Parkway
Linford Wood, Milton Keynes
MK14 6NP, U.K.
Tel: 01908-691-133
Succursale Française
9, rue Paul Dautier, B.P. 52
78142 Velizy-Villacoublay Cédex
France
Tel: 01-3067-5800
Sucursal en España
Juan Esplandiu, 15
28007 Madrid, Spain
Tel: 091-504-2787
Tyskland Filial
Täby Centrum
Entrance S (7th floor)
18322 Täby, Sweden
Tel: 08 638 72 00
NEC Electronics Shanghai Ltd.
Room 2511-2512, Bank of China Tower,
200 Yincheng Road Central,
Pudong New Area, Shanghai P.R. China P.C:200120
Tel: 021-5888-5400
http://www.cn.necel.com/
NEC Electronics Hong Kong Ltd.
Unit 1601-1613, 16/F., Tower 2, Grand Century Place,
193 Prince Edward Road West, Mongkok, Kowloon, Hong Kong
Tel: 2886-9318
http://www.hk.necel.com/
NEC Electronics Taiwan Ltd.
7F, No. 363 Fu Shing North Road
Taipei, Taiwan, R. O. C.
Tel: 02-8175-9600
http://www.tw.necel.com/
NEC Electronics Singapore Pte. Ltd.
238A Thomson Road,
#12-08 Novena Square,
Singapore 307684
Tel: 6253-8311
http://www.sg.necel.com/
NEC Electronics Korea Ltd.
11F., Samik Lavied’or Bldg., 720-2,
Yeoksam-Dong, Kangnam-Ku,
Seoul, 135-080, Korea
Tel: 02-558-3737
http://www.kr.necel.com/
Filiale Italiana
Via Fabio Filzi, 25/A
20124 Milano, Italy
Tel: 02-667541
Branch The Netherlands
Steijgerweg 6
5616 HS Eindhoven
The Netherlands
Tel: 040 265 40 10
G07.1A