1
The PORTABLE POWER QUALITY ANALYZER
________________________________________
Connection, Operation and Troubleshooting
November 2003
Revision 01
© Elspec Engineering Ltd.
© Elspec North America, Inc.
While all care has been taken to ensure that the information contained in this publication
is correct, no responsibility can be accepted for any inaccuracy. We reserve the right to
alter or modify the information contained herein at any time in the light of technical or
other developments. Technical specifications are valid under normal operating conditions
only. We do not accept any responsibility for any misuse of the product and cannot be
held liable for indirect or consequential damages.
PPQ-USERMAN-112003-1
500 West South Street
Freeport, IL 61032
815.266.4210 (T)
815.266.8910 (F)
www.elspecna.com
Elspec
Portable Power Quality Analyzer User Manual
TABLE OF CONTENTS
1.
OVERVIEW ....................................................................................................5
1.1
INTRODUCTION.........................................................................................5
1.2
PRODUCT VERSIONS .................................................................................5
1.3
SAFETY PRECAUTIONS .............................................................................6
2.
CONNECTION ...............................................................................................7
3.
OPERATION ..................................................................................................8
3.1
FRONT PANEL ..........................................................................................8
3.2
FUNCTION KEYS & TAGS .........................................................................9
4.
PROGRAMMING ........................................................................................12
4.1
GENERAL ...............................................................................................12
4.2
SETUP PARAMETERS ..............................................................................12
4.3
INSTALLATION PROCEDURE ...................................................................12
5.
MONITORING .............................................................................................14
5.1
INTRODUCTION.......................................................................................14
5.2
NUMERIC DISPLAY .................................................................................14
5.3
GRAPHIC DISPLAY .................................................................................14
5.4
TEXT DISPLAY ........................................................................................15
5.5
FEEDER TRANSFORMER ANALYSIS (L-TO-L CURRENTS) .......................16
6.
POWERIQ SOFTWARE .............................................................................17
6.1
GENERAL ...............................................................................................17
6.2
INSTALLATION .......................................................................................17
6.3
OPERATION ............................................................................................17
6.4
HELP SYSTEM ........................................................................................17
7.
NETWORK ANALYSIS ..............................................................................18
7.1
GENERAL ...............................................................................................18
7.2
POWER QUALITY ....................................................................................18
7.3
MEASUREMENT PROCEDURE ..................................................................19
8.
TROUBLESHOOTING ...............................................................................21
APPENDIX A : SPECIFICATIONS ..................................................................23
APPENDIX B : DETAILED MENU DESCRIPTION......................................25
B.1
THREE-PHASE WYE CONFIGURATION ....................................................25
B.2
THREE-PHASE DELTA CONFIGURATION ................................................26
B.3
SINGLE-PHASE CONFIGURATION ............................................................26
3
Elspec
Portable Power Quality Analyzer User Manual
LIST OF FIGURES
FIGURE 1: PPQ-306 OVERVIEW ................................................................................7
FIGURE 2: FUNCTIONAL DISPLAY AREAS ..................................................................8
FIGURE 3: SYSTEM INFORMATION SCREEN .............................................................11
FIGURE 4: SYSTEM SETUP MENU ............................................................................12
FIGURE 5: TYPICAL NUMERIC DISPLAY ..................................................................14
FIGURE 6: TYPICAL HARMONIC SPECTRUM DISPLAY ..............................................14
FIGURE 7: TYPICAL WAVEFORM DISPLAY ..............................................................14
FIGURE 8: TYPICAL ENERGY DISPLAY ....................................................................15
FIGURE 9: EVENT DISPLAY .....................................................................................15
FIGURE 10: TYPICAL EVENT DISPLAY .....................................................................15
FIGURE 11: FEEDER TRANSFORMER ANALYSIS EXAMPLE.......................................16
FIGURE 12: CT CONNECTION EXAMPLE ..................................................................21
FIGURE 13: PARALLEL CT CONNECTION .................................................................21
LIST OF TABLES
TABLE 1: PRODUCT VERSIONS ..................................................................................5
TABLE 2: KEY FUNCTIONS IN DIFFERENT DISPLAY MODES ....................................10
TABLE 3: NEW AND OLD EVENTS ...........................................................................15
4
Elspec
Portable Power Quality Analyzer User Manual
1. OVERVIEW
1.1 Introduction
The Portable Power Quality Analyzer (PPQ-306) is a state-of-the-art device used for handy electrical network
analysis.
The PPQ features:
¾ Ultra-rapid (cycle by cycle) advanced electrical network analysis
¾ Complete network harmonics analysis, up to the 63rd harmonic
¾ High visibility, 5" graphic backlit LCD screen
¾ Supports virtually all type of clamps
¾ Display of neutral voltage and current
¾ Comprehensive data logging
¾ Feeder transformer analysis
¾ Compliance monitoring of international power quality standards
¾ 1024 KB of flash memory
¾ User-friendly PC software (PowerIQ)
¾ Menu driven operation
¾ Lightweight and rugged weather-proof case
¾ Easy connection, configuration and use
This manual describes connection and operation procedures of the PPQ.
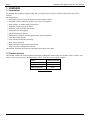
1.2 Product Versions
This manual includes all existing system functionality. Additional functions may be included in future versions, and
earlier versions may not have all functionality. Table 1 summarizes the existing versions.
Item
Latest Version
PPQ-306 Firmware
3.2.0
PPQ-306 Boot Loader
PowerIQ Software
1.5
2.6.0
Table 1: Product Versions
5
Elspec
Portable Power Quality Analyzer User Manual
1.3 Safety Precautions
Before working with the PPQ-306, please read this User Manual carefully. The manufacturer will not be responsible
for any misuse.
The following general safety guidelines apply to PPQ-306 connection and operation. When performing any operation
with the PPQ-306, always observe these safety precautions.
¾ The instructions contained in this manual are intended for qualified personnel only. To avoid personal
injury, do not perform any activity other than as contained herein unless you are qualified to do so.
¾ Before connecting cables to the PPQ, verify that the mains supply is disconnected.
¾ To prevent shock or fire hazard, do not expose the PPQ to rain or moisture.
¾ Avoid making unauthorized modifications to the PPQ.
¾ Always operate the PPQ within the specified power tolerances.
¾ The output of current transformers may be affected by high voltage due to cutout on the secondary coil.
Throughout connection and operation, check all transformer outputs for connection to loads and perform
the procedure systematically as specified. Failure to comply with this instruction may result in lifethreatening situations.
¾ To use and operate the PPQ, follow the specifications of this manual strictly. The manufacturer will not
be responsible for any damage or injury resulting from equipment misuse and/or unsafe work
practices.
6
Elspec
Portable Power Quality Analyzer User Manual
2. CONNECTION
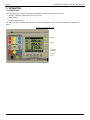
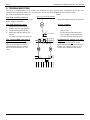
Figure 1 shows general overview of the PPQ-306. It includes connectors, the main display and softkeys. This
chapter describes the connection procedure of all connectors.
Figure 1: PPQ-306 Overview
2
6
5
4
1
7
3
The connection shall be done in the following order (in brackets the connectors’ number in Figure 1):
GND ( ) (1)
Connection to protective earth.
DC 6V (2)
Power supply input, 6V 1A DC Voltage. Connect the power supply to electricity outlet and then connect it to the
PPQ.
VOLTAGE INPUTS (3, 4)
Connection of the measured voltages. In delta networks, there is no need to connect the neutral (MP, 3). In singlephase networks, connect either L1 and N (MP), or L1 and L2. The phases are identified using different colors: Red –
L1, Yellow – L2, Blue – L3.
CURRENT INPUTS (5, 6)
The PPQ-306 support both voltage-output (e.g., 100mV/mA) and current-output (e.g., 2000A/5A) clamps. Voltageoutput clamps are connected using the BNC connectors (5) and the current-output clamps are connected using the
Banana Sockets (6). The upper Banana Socket is the positive input and the lower is the negative input. The phases
are identified using different colors: Red – L1, Yellow – L2, Blue – L3.
RS-232 (7)
Connect the RS-232 port to a serial port of a computer. For PowerIQ installation and operation, see Chapter 6.
7
Elspec
Portable Power Quality Analyzer User Manual
3. OPERATION
3.1 Front Panel
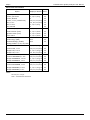
The front panel of the PPQ is divided into the following functional areas (see Figure 2):
¾ Header – showing product type and current time.
¾ Main Display.
¾ Function Keys & Tags.
The functions of the controls and indicators in each of these display areas are as described in the subsections
below.
Figure 2: Functional Display Areas
Header
Main
Function
Keys Tags
Function
Keys
8
Elspec
Portable Power Quality Analyzer User Manual
3.2 Function Keys & Tags
General
All PPQ functions are accessible from five function keys at the bottom of the front panel. The function of each key
changes according to the display mode and the information on the function key tag.
Three different display modes are available (see Chapter 5):
¾ Numeric display, comprising three large-set numbers with minimum and maximum values of the selected
measurement
¾ Graphic display, comprising waveforms and harmonics.
¾ Text display, comprising menus, system information, energy and events
Table 2 on the next page summarizes the various functions of the keys in each display mode and submode.
Note that in Energy Display mode, key functions are identical to those in Numeric Display mode.
The Favorites List
The PPQ contains a pre-defined list of favorite display windows. In Numeric Display mode, F4 and F5 function as S
(up) and T (down) keys, respectively, and serve to scroll up or down on the various favorites screen display
options. Screen position on the list remains unchanged, therefore these keys will always move to the next or
previous screen on the Favorites list whether the currently displayed screen was selected from the list or from
another menu.
9
Elspec
Portable Power Quality Analyzer User Manual
Key Display
Tag
Numeric
PU%
Displays the value as a fraction of its nominal value
Graphic
INFO
Opens the System Information screen
HELP
Displays a short help text for the specific screen, where available
INFO
Opens the System Information screen
F1
Text
Function
Numeric SETUP Activates the Installation Procedure
Graphic
F2
SETUP Activates the Installation Procedure
CANCEL Cancels the last operation and returns to the previous state
Text
CLOSE Closes the current window and returns to the previous one
BACK
Moves back one step in a setup procedure
Numeric
MENU
Opens system’s Main Menu
Graphic
MENU
Opens system’s Main Menu
F3
ENTER Opens the selected item
Text
CLOSE Closes the current window and returns to the previous one
NEXT
F4
F5
Accepts the value entered and moves to the next step in a setup procedure
Numeric
S
Moves to the previous window on the Favorites list
Graphic
W
Moves the cursor one step to the left
Text
S
Moves the selection one line up
Numeric
T
Moves to the next window on the Favorites list
Graphic
X
Moves the cursor one step to the right
Text
T
Moves the selection one line down
Table 2: Key Functions in Different Display Modes
10
Elspec
Portable Power Quality Analyzer User Manual
Menu Key
System’s Main Menu serves both to select display screens and to program the system. To open, use F3 in one of
the reading display modes.
See full menu description in Appendix B.
Menu operations are effected through key functions as listed below:
H EL P Fu nc tion
Use F1 to activate the HELP function, where a help screen is available for the menu displayed. Where no help
screen is available, this key is disabled.
CANC EL & BACK Funct ions
Use F2 to activate the CANCEL or the BACK functions. CANCEL will close the menu and return to the previous
display mode, while BACK will close the current submenu and return to the previous one.
Note that, in either case, all changes made will be ignored.
S E TU P F un ct io n
In all measurement display modes, use F2 to activate the Installation Procedure (Paragraph 4.3).
E N T ER , N E X T , S EL EC T & C L O S E F u n c t io n s
Use F3 to ENTER, NEXT, SELECT or CLOSE. All these functions are basically similar, serving to accept the
information entered.
ENTER will open a submenu and select a menu item. In the Installation procedure, NEXT will accept the data
entered and move to the next screen. SELECT will toggle between selected inputs (see CT Polarity screen), and
CLOSE will accept data and close the screen.
U P & DOWN F un ct ion s
Use F4 and F5 to activate the S (up) and T (down) functions (for S and T functions in the reading modes, see
"Favorites List").
In data entry windows, S (up) will increase the value by one while T (down) will decrease it by one. Hold down to
change the value in steps of 10.
In all other windows, S (up) will move the selection bar one line up and T (down) will move it one line down.
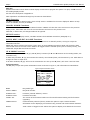
System Information
Use F1 (info) to open the System Information screen as shown in Figure 3, with information as listed below:
Figure 3: System Information Screen
Model
PPQ model type.
Serial Number
PPQ serial number.
Firmware Ver.
Firmware (internal software) version.
Firmware Code
Firmware built code.
Loader Ver.
The version of the firmware loader used for initial firmware booting and for firmware
upgrading.
Communication
Communication protocols (Elcom). Select this option to open a Communication
Information screen displaying current baud rate, protocol and communication statistics.
Events
Total number of logged events. Select this option to display more details of the events.
11
Elspec
Portable Power Quality Analyzer User Manual
4. PROGRAMMING
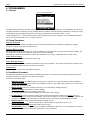
4.1 General
Figure 4: System Setup Menu
The PPQ-306 programming includes discrete parameters and Installation procedure. The Installation procedure is a
complete procedure designed to set up the PPQ-306 and, together with the discrete parameters, manage its setup.
To initiate the Setup (programming) Menu, first open the Main Menu, then select “More...” and
“Setup Parameters >>”. System’s Setup Menu will be displayed, as shown in Figure 4. The Installation Procedure
can be run either from this menu or using the F2 key.
4.2 Setup Parameters
D is p la y C o nt ras t
Set this parameter to adjust the display contrast. Contrast is affected by the ambient temperature, lighting
condition, viewing angle and user preferences.
D is p la y R e f res h Rat e
The PPQ measures all the data once per cycle and displays an average over several cycles, for easier reading. Set
this parameter to adjust the number of cycles to be used in averaging.
Note that the minimum and maximum values are checked for every cycle, regardless of the refresh value.
C le ar E ve n t h is t o r y
Select this option to entirely delete the "Event" log.
C le ar En erg y h i s t o r y
Select this option to delete the data accumulated by the "Energy Meters". The meters will show zero readings and
start accumulating data from the time they were cleared.
Installation
Use this option to invoke the Installation Procedure.
4.3 Installation Procedure
The PPQ-306 installation is done using the Installation procedure, which leads you through all parameter setups
required and helps you install the unit quickly and easily.
To install, follow these steps:
1.
Welcome Screen: The Welcome Screen will open to remind you to read this manual before installation.
2.
Date & Time Setting: In this field, select "Modify the above". The system will prompt you to set the year,
month, day, hour and minute.
3.
Network Type: Select low voltage network (LV) or medium/high voltage (MV/HV).
4.
Nominal Voltage: Set system’s nominal voltage.
In a three-phase system, the voltage is line-to-line.
For network type LV and nominal voltage less than 500V, skip to step 6.
5.
PT Secondary: Set the secondary rating of the step-down transformer. Where the primary of the PT
transformer is other than the nominal voltage, set the PT secondary to a value where the ratio between the
PT primary to the actual PT secondary will equal the ratio of nominal to programmed PT secondary.
6.
Nominal Current: Set the measured network nominal current.
7.
Network Configuration: Select 3-phase Wye, 3-phase Delta or single phase (L-N or L-L).
For network configurations other than Delta, skip to step 9.
8.
CT Connection: Set up the existing CTs in a Delta configuration. Where a CT is not connected, its current
will be calculated from the other two, assuming L1+L2+L3 equals 0.
12
Elspec
9.
Portable Power Quality Analyzer User Manual
Current Inputs Type: Select between current-output or voltage-output clamps (Chapter 2 - Connection).
For current-output clamps, skip to step 14.
10. Current Probe Output: For voltage-output clamps, select the full scale of the probe output.
11. Probe’s Output Signal: For voltage-output clamps, set the ratio of the clamp.
12. Current Probe Location: Defines whether the measurement is done directly or using existing CTs. If
direct measurement is selected, the installation procedure is finished.
13. Auxiliary CT Ratio: Defines the CT ratio of installed CTs, whose secondary is being measured. This is the
last step of the installation procedure for voltage-output clamps.
14. Current Probe Multiplier: Set the current probe ratio. If you use a …/1A CTs, set the ratio of the
CTs rather than the primary value, however this will have an adverse effect on accuracy.
13
Elspec
Portable Power Quality Analyzer User Manual
5. MONITORING
5.1 Introduction
To monitor, use system displays as applicable:
¾ Numeric display, comprising three large-set numbers with their minimum and maximum values (Figure 5).
¾ Graphic display, covering harmonics (Figure 6) and waveforms (Figure 7).
¾ Text display, covering menus, system information (Figure 3), energy (Figure 8) and events (Figure 9).
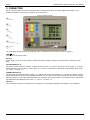
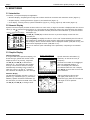
5.2 Numeric Display
System’s Numeric Display consists of three values. For each value, a large-set number is displayed with the current
value (1) and its minimum and maximum (2). The minimum and maximum values are reset whenever the display
3
is changed. This parameter includes phase and units indication (3) as well as screen
description (4).
Figure 5: Typical Numeric Display
1
Use F4 (S) and F5 (T) to select the next or previous display screen from the
Favorites list.
2
4
Click F1 (PU%) to display the value in a "Per Unit" format whereby the full scale of
the parameter is displayed as 100% and the value itself is displayed as a fraction.
For example, 392V in a 400V network will be displayed as 98% (392/400=0.98), and
408V will be displayed as 102% (408/400=1.02).
Per unit is useful for quick estimating of the parameter, comparing to its nominal
value.
5.3 Graphic Display
Harmonics Spectrum
In a typical Harmonic Spectrum Display, the
shows the type, phase and number of the
amperes/volts or in percent), angle and
Figure 6: Typical Harmonic
Spectrum Display
Use F4 (W) and F5 (X) to decrease or
harmonic (2). The harmonics are divided
through 31st harmonic and 32nd through
automatically according to the number of
when the cursor is on the 31st harmonic,
32nd harmonic and display the 32nd through
Waveform Display
The Waveform Display includes a cursor (1)
position (2), waveform type (3), and lower
addition, specific waveform information (5)
the waveform, as well as its RMS value, THD
specific harmonic information (1)
harmonic, as well as its level (in
frequency.
increase the number of the displayed
into two separated displays: 1st
62nd. The displays are switched
the selected harmonic. For example,
click F5 (X) to move the cursor to the
62nd harmonics.
1
2
Figure 7: Typical Waveform Display
3
Use F4 (W) and F5 (X) to change cursor
4
2
4
14
5
and the waveform value at this
and upper peak values (4). In
shows the type, phase and number of
and angle of cursor position.
position.
1
Elspec
Portable Power Quality Analyzer User Manual
5.4 Text display
General
System’s Text Display comprises menus, system information, energy and events.
See detailed menu descriptions in Appendix B and System Information on page 11.
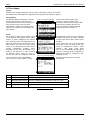
Energy Display
The Energy Display comprises 15-minute
showing the previous period total (15accumulated since the start of last period.
and reactive energy (kVAr) for both
information is stored in the flash memory
software can retrieve the information for
Time-Of-Use.
Events
The number of New Events (which were
on the System Information screen. When
(Figure 9) opens, displaying the number
are events that were not displayed yet on
Selecting “New Events” will open the most
“Old Events” will open the most recent
event is not necessarily the most recent
event’s
information
includes
event
description of the event and whether it is
scroll to the previous or next recorded
its old/new status. After an event is
and the next time it is displayed it will be
The entire Event log is downloadable
icon) to a PC, for easy reading, sorting
Step
Figure 8: Typical Energy Display
Figure 9: Event Display
Figure 10: Typical Event Display
meters and monthly totals, each
minutes or month) and the value
The values include active energy (kWh)
incoming and outgoing energy. The
every 15 minutes, and the PowerIQ
easy display and calculation of
not displayed on the screen) is displayed
selected, "Summary of Events" window
of "New" and "Old" events. “New” events
the PPQ.
recent event that is new, while selecting
event that is old. The most recent new
event, as explained in Table 3. Each
number,
code,
date,
time,
short
new or old. Use F4 (S) and F5 (T) to
event by numerical order, regardless of
displayed its status is changed to “old”
indicated as such.
through PowerIQ software ("Events"
and filtering.
Operation
Events
1
3 events are logged
Events 1 to 3 are new
2
Selecting “New Events”
Event 3 is displayed and changed its status to “old”
3
Pressing “Close”
Events 1 & 2 are new (total 2 new) and 3 is old (total 1)
4
Selecting “New Events”
Event 2 is displayed, although it is older than #3.
Table 3: New and Old Events
15
Elspec
Portable Power Quality Analyzer User Manual
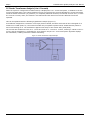
5.5 Feeder Transformer Analysis (L-to-L Currents)
When the system is configured as a Delta network, it displays the L-to-L current and power, in addition to the line
currents and total power. The system measures the line current from the CTs and calculates the current and power
inside the feeder transformer (or generator). In completely balanced networks, the internal currents are 1/√3 of the
line currents. In many cases, the network is not balanced and the internal currents are different from these
expected.
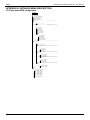
This can be explained with the following hypothetical example (Figure 11):
A transformer designed for a maximum current per phase of 2000A, therefore each internal line is designed for a
maximum of 1155A (2000/√3). The network includes only one phase to phase load of 1900A between phases L1
and L2 and nothing on L3. The transformer appears incorrectly to have a 95% load (1900/2000).
The currents are divided into 67% on L1- L2 line and 33% on L1- L3 and L3- L2 lines, resulting in 1267A on the L1L2 line, and the transformer is overloaded by 10%. Elspec’s unique L-to-L current and power algorithm displays
this information, enabling maximum network monitoring.
Figure 11: Feeder Transformer Analysis Example
16
Elspec
Portable Power Quality Analyzer User Manual
6. POWERIQ SOFTWARE
6.1 General
The PowerIQ software is an application running under Microsoft Windows, providing a graphical user interface for
ELSPEC products.
Minimum requirements are Pentium 166 MHz or higher, with minimum of 32 MB of memory, 50 MB of free space
on the hard disk and Microsoft Windows 98 or higher, with TCP/IP installed. Larger disk space is required for data
logging.
For best performance, use Pentium III 800 MHz or higher, with 128 MB of memory and Microsoft Windows XP
Professional.
6.2 Installation
To install PowerIQ, follow the procedure below:
(1) PowerIQ uses Windows’ TCP/IP. If your system does not have the TCP/IP installed, see Windows Help
under “TCP/IP protocol, installing”, to install.
(2) If you have another version of PowerIQ installed on your computer, reboot the computer before starting
the installation procedure.
(3) Insert the installation CD-ROM into the CD-ROM drive.
(4) Click “Start” and select submenu “Run...”
(5) Type “D:SETUP”, then click OK. Replace D: with your CD-ROM drive letter.
(6) Follow installation program instructions as they appear on the screen.
6.3 Operation
The software includes an application toolbar and client applications. The application toolbar also serves as a
communication server for the clients and for other computers (in the network version). The server collects all the
data requests from all clients and delivers the required information to all the clients. As many clients may be
opened simultaneously as required, whether of different or of the same type.
All clients are accessible through the PowerIQ Main Taskbar.
To activate, select “Start” » “Programs” » “PowerIQ” » “PowerIQ”.
6.4 Help System
For additional information on PowerIQ, seek PowerIQ on-line help.
To access on-line help, do one of the following:
(1) Use F1 to open the Help system for the specific function.
(2) Select “Help” from the PowerIQ Main Taskbar.
(3) Select “Start” » “Programs” » “PowerIQ” » “Help”.
17
Elspec
Portable Power Quality Analyzer User Manual
7. NETWORK ANALYSIS
7.1 General
This chapter includes network power quality analysis procedure guidelines. It is not intended to cover all power
quality issues and it is given as general idea only. It includes the measurement procedure. For more involved
engineering analysis, please contact Elspec.
7.2 Power Quality
What is Power Quality
Power Quality incorporates all issues concerning distorted power, including the voltage and the current waves.
The most common Power Quality issues are:
¾ Power Factor
¾ Harmonics (Voltage, Current)
¾ Voltage Sags & Swells
¾ Spikes (Transients)
¾ Flickering
Low Power Quality Implications
¾ Downtime
¾ Product Quality
¾ Energy Losses
¾ Service Utilization
¾ Maintenance Costs
Major Sources for PQ Problems
¾ Voltage Converters (e.g. DC Drives, Frequency Converters, UPS, Power Supplies)
¾ LV and MV Capacitors (Switching; Harmonics)
¾ Variable Loads (e.g. Welders, Motor Startup, Cranes)
¾ Service Utilization (most PQ events occur and peak demand)
¾ Backup Generators
¾ Long Lines
¾ Utility Company and Neighbors
18
Elspec
Portable Power Quality Analyzer User Manual
7.3 Measurement Procedure
The measurement procedure includes the following steps:
¾ Studying the Site
¾ Identifying the Connection Points
¾ Connection of the PPQ-306
¾ Taking Measurements
¾ Repeating for Multiple Conditions
¾ Continuing to Next Connection Point
Study the Site
The first of step of successful analysis is getting to know the site using, but not only, the following:
¾ 1-line diagram
¾ Potential Problematic Loads
¾ Existing PFC Solution
¾ Power Quality History (PFC and Others)
¾ Local Utility Regulations
¾ Electricity Bill (value and components)
¾ Other Raised Issues and Objectives
Identify Connection Points
Normally, analysis is done in more than one connection point. Typical connection points are:
¾ Main Switchboard
¾ Major MCCs
¾ Existing PFC Solution
¾ Large Loads
¾ Backup Generators
Connection of the PPQ-306
Connect the PPQ-306 at the first connection point (Chapter 2 - Connection). Verify correct connection using chapter
8 - Troubleshooting.
Take Measurements
Use the PowerIQ software (Chapter 6) to view and collect the data. From one side it is always better to collect
more data. On the other side, during fast analysis it is important to log only the necessary information for best
performance. The two contraries can be combined by performing them one after the other rather than
simultaneously.
Suggested Procedure:
¾ Use Table to brief all parameters in order to verify correct connection and setup
¾ Close Table before Data Logging for best performance
¾ Perform All Parameters Data Logging with few seconds resolution
¾ Perform Volt/Amp/kVAr Data Logging with Amp and Volt trigger
(verify best resolution – high baud rate, no other PowerIQ windows and minimum number of parameters)
¾ Save Harmonic Screen for all parameters, including Minimum and Maximums
¾ Save Waveform Screen for all parameters
Repeat for Multiple Conditions
Some of the power quality issues happen during normal operation, some may occur on particular time of the day or
week, and some may take place during certain network condition. It is good practice to repeat the analysis during
multiple conditions, such as:
¾ Normal Condition
¾ Full Loading (the best is to schedule the audit to the busiest period)
¾ Large Motor Startups (for example, large motors which starts once a week)
¾ With and Without Existing Capacitors (including step by step for resonance detection)
19
Elspec
Portable Power Quality Analyzer User Manual
Continue to Next Connection Point
Disconnect the PPQ-306 and continue to the next connection point. The next connection can be either planned or
new point, due to the measured data. For example, one of the loads causes power quality issue and need to be
monitored separately.
20
Elspec
Portable Power Quality Analyzer User Manual
8. TROUBLESHOOTING
The secret to troubleshooting is to examine the evidence you have, gain as much information as you can, and
eliminate the possibilities one by one. In most cases, the source of the problem will soon become clear.
below:
See common problems and solutions
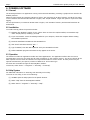
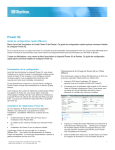
T he PPQ do es n't pow er up
Figure 12: CT Connection Example
Make sure that the PPQ is connected to
power supply is functional.
the power supply and that the external
T he P PQ dis p la ys a z e ro
c ur re nt r ea d in g
1.
Check the CTs connections.
2.
Confirm the CTs type (page 7).
3.
Verify the PPQ setup for the
4.
Make sure that the cable or the
current.
the edge of the bus bar where no
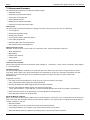
T he cu rren t R M S r ea d in gs of
a re d if f e ren t f r o m t ho se
Check for improper setting of the CT
input is surrounded by the CTs. A
parallel transformers or multiple
the CT is set to position "A", the
value.
9
89
Good - Option 1
Figure 13: Parallel CT connection
Bad
Good - Option 2
A
C
21
B
clamps type.
bus bar being measured carries
Tip: The PPQ may be measuring
current is flowing (see Figure 12).
a ll ph ase s a re similar , bu t th e y
e xp ecte d
ratio, or verify that ALL the power
typical bad connection is one with two
feeders. For example, in Figure 13, if
current will read 50% of the actual
Elspec
Portable Power Quality Analyzer User Manual
H ow t o m ea su re tw o p ar a l le l t ra nsf or m ers ?
There are three ways to measure two parallel transformers (Figure 13):
Option 1
Install one set of CTs on "A" and one set on "B" and connect them to the PPQ-306 using a summation CT.
Option 2
Install set of CTs on "C".
Option 3
Verify that the currents on "A” and on "B" are identical, then install CTs on either "A" or "B". Now set the CT ratio
to twice the actual ratio. However, this option is not recommended since, if the current is not identical or if one of
the transformers is disconnected, the readings will be incorrect.
T he vo l t age an d cu rre nt r ea d ing s a re OK , b ut t he pow er an d t h e p ow er f a cto r a re n ot
Check for a mismatch between the phases of the voltage connections and the CT.
To fix, switch between phases L1 and L3 on either the voltage or the CT (but not on both).
T he P PQ dis p la ys n e g at i ve ac t ive p ow er
Negative active energy indicates that the load supplies energy back to the network.
If the energy flows to the load, the connection of one or more of the CTs is reversed. To fix, change the CT polarity.
22
Elspec
Portable Power Quality Analyzer User Manual
APPENDIX A: SPECIFICATIONS
LCD Display Size
94x76 mm
LCD Display Resolution
Graphic 160x128 pixels
LCD Display Type
Black/White, FSTN, LED backlight
Ambient Temperature
-20˚C - +55˚C
Storage Temperature
-25˚C - +65˚C
Computer Software
Input Channels
PowerIQ Professional included.
10
4×Voltage Channels
3×Current Inputs (../5A)
3×Current Inputs (mA/mV)
Dimensions (closed)
270 × 246 × 123 mm [W×D×H]
Weight (w/o accessories)
1.9 kg
Power Supply
100-240V ~ 0.2A 50-60Hz
Direct Voltage Measurement
347/600 VAC Max.
EMC Compatibility
EN61000-4-2/3/4/5,
ENV50204, ENV50141
Safety Standards
EN61010-1, EN50439-1
Communication
Elcom (Elspec's Protocol)
Power Consumption
3 VA
Harmonic Analysis
1 through 63rd
23
Elspec
Portable Power Quality Analyzer User Manual
M ea su red Pa ra met ers
Option
Displayed Phases
Frequency
Accur.
0.1
Current, per Phase
L1, L2, L3, Avg
0.2
Current, Neutral
N
0.2
Current, L-to-L (Transformer)
L12, L23, L31, Avg
0.2
Volts, L-to-L
L12, L23, L31, Avg
0.2
Volts, L-to-N
L1, L2, L3, Avg
0.2
Volts, Neutral
N
0.2
Real Power (kW)
L1, L2, L3, Sum
0.3
Reactive Power (kVAr)
L1, L2, L3, Sum
0.3
Apparent Power (kVA)
L1, L2, L3, Sum
0.3
Power Factor
L1, L2, L3, Sum
0.3
- Real Energy (kWh)
Sum
0.5
- Reactive Energy (kVARh)
Sum
0.5
Time-of-Use (TOU):
- Energy Modes: in, out, net, total
Currents THD, L-to-N
L1, L2, L3, Avg, N
0.2
Currents THD, L-to-L
L12, L23, L31, Avg
0.2
Voltage THD, L-to-N
L1, L2, L3, Avg, N
0.2
Voltage THD, L-to-L
L12, L23, L31, Avg
0.2
Currents HARMONICS, L-to-N
L1, L2, L3, Avg, N
0.2
Currents HARMONICS, L-to-L
L12, L23, L31, Avg
0.2
Voltage HARMONICS, L-to-N
L1, L2, L3, Avg, N
0.2
Voltage HARMONICS, L-to-L
L12, L23, L31, Avg
0.2
Currents WAVEFORM, L-to-N
L1, L2, L3, Avg, N
0.2
Currents WAVEFORM, L-to-L
L12, L23, L31, Avg
0.2
Voltage WAVEFORM, L-to-N
L1, L2, L3, Avg, N
0.2
Voltage WAVEFORM, L-to-L
L12, L23, L31, Avg
0.2
Notes:
Accuracy is in ± digit.
THD = Total Harmonic Distortion.
24
Elspec
Portable Power Quality Analyzer User Manual
APPENDIX B: DETAILED MENU DESCRIPTION
B.1 Three-phase WYE configuration
Main Menu
Line Currents
Line to Line Voltages
Volt-Amp-Hz Meters
kVA-kW-PF Meters
kVA-kW-kVAr Meters
Energy Meters
(Product Series 2 and up)
Monthly totals
15 minute meters
Waveforms
(Product Series 3 and up)
L1 Current
L2 Current
L3 Current
L1-L2 Voltage
L2-L3 Voltage
L3-L1 Voltage
More...
L1-N Voltage
L2-N Voltage
L3-N Voltage
Neutral Voltage
Neutral Current
Harmonic Analysis
(Product Series 2 and up)
Line Current THD
L-L Voltage THD
L-N Voltage THD
Line Current Spectrum (Product Series 3 and up)
L1 Current
L2 Current
L3 Current
L-L Voltage Spectrum
(Product Series 3 and up)
L1-L2 Voltage
L2-L3 Voltage
L3-L1 Voltage
L-N Voltage Spectrum (Product Series 3 and up)
L1-N
L2-N
L3-N
Neutral Line
Voltage
Voltage
Voltage
Spectrum (Product Series 3 and up)
Neutral Voltage
Neutral Current
More...
Power Factor Meters
kVAr Phase Meters
kVA Phase Meters
kW
Phase Meters
L-N Voltage Meters
Neutral Conductor
-----------------Setup Parameters
25
Elspec
Portable Power Quality Analyzer User Manual
B.2 Three-phase DELTA configuration
Main Menu
Line Currents
Line to Line Voltages
Volt-Amp-Hz Meters
kVA-kW-PF Meters
kVA-kW-kVAr Meters
Energy Meters
(Product Series 2 and up)
Monthly totals
15 minute meters
Waveforms
(Product Series 3 and up)
L1 Current
L2 Current
L3 Current
L1-L2 Voltage
L2-L3 Voltage
L3-L1 Voltage
More...
L1-L2 Current
L2-L3 Current
L3-L1 Current
Harmonic Analysis
Line
L-L
L-L
Line
Current
Current
Voltage
Current
(Product Series 2 and up)
THD
THD
THD
Spectrum (Product Series 3 and up)
L1 Current
L2 Current
L3 Current
L-L Current Spectrum
(Product Series 3 and up)
L1-L2 Current
L2-L3 Current
L3-L1 Current
L-L Voltage Spectrum
(Product Series 3 and up)
L1-L2
L2-L3
L3-L1
Neutral Line
Voltage
Voltage
Voltage
Spectrum (Product Series 3 and up)
Neutral Voltage
Neutral Current
More...
Power Factor Meters
kVAr Phase Meters
kVA Phase Meters
kW
Phase Meters
L-L Current Meters
-----------------Setup Parameters
B.3 Single-Phase configuration
Main Menu
Volt-Amp-Hz Meters
kVA-kW-kVAr Meters
THDv-THDi-Hz Meters
Voltage Waveform
Current Waveform
Voltage Spectrum
Current Spectrum
Energy Meters
(Product Series 3 and up)
(Product Series 2 and up)
Monthly totals
15 minute meters
Setup Parameters
26
Elspec North America Headquarters:
500 West South Street
Freeport, IL 61032
USA
+1.815.266.4210 (Tel)
+1.815.266.8910 (Fax)
www.elspecna.com