1
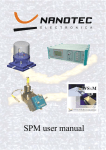
NanoManipulator DP-100/200 Functional Overview v1.2b 10/26/2006 Table of Contents Section 1 Features of the NanoManipulator 2 3.2.4 Lighting and Shading 6 1.1 3D Graphics 2 1.2 Visualization 2 4.1 The Phantom Desktop 6 1.3 Modification 2 4.2 Controlling the SPM For Scanning 7 1.4 Analysis 2 4.2.1 Modes – Oscillating or Contact 7 1.5 Store/Replay 3 4.3 Controlling the SPM For Modifications 7 3 4.3.1 Modes – Oscillating or Contact 7 2.1 SPM Connections 3 4.3.2 Modification Styles 7 2.2 Automatic Lab Notebook 3 4.3.3 Modification Tools 8 2.3 Static Scan Data Display 3 2.4 Saving Data 3 5.1 Calculated Data Planes 8 4 5.1.1 Flattened Plane 8 4 5.1.2 Sum Plane 8 Section 2 NanoManipulator Modes of Operation Section 3 NanoManipulator Visualization 3.1 Surface View 3.1.1 Screen Elements Section 4 Controlling the Scanning Probe Microscope Section 5 Analysis 6 8 4 5.2 Ruler Grid 8 6 5.3 Measure Lines 9 3.2.1 Height Plane 6 5.4 Strip chart 9 3.2.2 Color Map 6 3.2.3 Isovalue Contour Lines 6 3.2 Visual Settings NanoManipulator DP-100/200 Section 6 Documentation i 9 10/26/06 Section 1 FeaturesoftheNanoManipulator The NanoManipulator System is a growing set of integrated tools for users of Scanning Probe Microscopes (SPMs). These tools include an enhanced user interface, extensive 3D graphics, a force feedback user interface along with integrated sample manipulation capabilities, comprehensive record/replay/reanalyze functions for entire SPM sessions, and a portable 3D viewer for replay on additional systems. These capabilities are described briefly below. 1.1 3D Graphics Easily move, rotate and scale a real-time 3D view of the height field measured by the SPM. Interactively change lighting to highlight small surface features. Scale the Z dimension independently to exaggerate the display of height changes. Maintain interactivity at 200 x 200 display resolution or higher; scan is stored at full resolution and resampled, in real time, for display. 1.2 Visualization Display several data layers simultaneously using a variety of visualization techniques. Display highly detailed data with built-in or user-defined color maps. Display data with contour lines to visualize multiple layers of information. All display methods are updated in real time as new data arrives from the SPM. 1.3 Modification Precisely control the SPM tip for setting up and executing modifications to the sample – modifications that would be nearly impossible without the real-time, accurate surface information the NanoManipulator provides. Using the Phantom™ Desktop, a 6 degree-of-freedom positioning and force-feedback device, feel the shape of the sample as you control the motion of the tip to know exactly what features the tip is encountering. Precisely mark locations for the computer to make automatic modifications, or control the tip in real time and ‘feel’ the sample changing as you modify it. Transition between oscillating and contact modes without withdrawing the tip. Image your sample with the feather touch of oscillating mode, then modify it with a higher set point and more force in contact mode. Collect several types of data during a modification so you can examine the changes in topography, internal sensor and lateral force, as the modification is performed. 1.4 Analysis Several features assist in quantitative analysis of data received from the SPM. Export data in several formats, so it can be analyzed or graphed using packages with which you are already familiar. Superimpose a grid on the surface for quick size comparisons. Use the three measuring lines to compare lengths and angular measurements. Show the data collected during a modification in real-time oscilloscope trace ‘strip chart’, so you can track the progress of a modification visually, and examine it in more detail after completion. Flatten the data to remove bias due to sample tilt. NanoManipulator DP-100/200 2 10/26/06 1.5 Store/Replay Record all data collected during an experiment in an automatic lab notebook and use it to replay the entire procedure. This replay capability has proven extremely valuable in a research setting, as new theories can be postulated and can enable re-interpretation of the data. Extract data at any point during replay, for export to external programs such as slide presentations. Section 2 NanoManipulatorModesofOperation The NanoManipulator System functions in three basic modes of operation. One is the real-time interface with a scanning probe microscope. The other two provide for the display of, and interaction with, stored data. Though the real-time connection is key, practice has shown that the ability to replay and re-analyze complete investigations is an invaluable addition to the scientist’s toolkit. 2.1 SPM Connections The NanoManipulator interfaces to Nanotec® Electronica’s SPM, Asylum Research’s MFP™-3D AFM, and Veeco’s Explorer SPM and. While connected, the NanoManipulator provides real-time visualization, interaction and analysis of data provided by the SPM. It also enables a variety of modifications described later. The NanoManipulator is configured for a single SPM during installation. With an optional upgrade, it can be configured to use multiple SPMs, one at a time. 2.2 Automatic Lab Notebook During real-time connection with an SPM, the NanoManipulator can store a complete record of data collected during scans, modifications and when ‘force curves’ are taken. You can specify precisely which data is recorded from among parameters including Topography, Internal Sensor, Lateral Force, and Z Piezo, as well as the time and location of the probe. The extensive data collected is stored in a Stream file. Stream files can be read by the NanoManipulator at a later time, without use of the SPM, and can be ‘played back’. Playback enables sharing experiments with colleagues and students, re-analyzing data, and further exploration. Stream files can be played back in real time, sped up, or slowed down. You can also ‘jump’ to a particular point in time or rewind and begin again. During playback, you not only can view the entire record, you can use the haptic interface to feel the surface at any point in time. Naturally, new modifications are not possible during stream file playback. 2.3 Static Scan Data Display The NanoManipulator can display static scanned data from a variety of formats. These include TM Microscopes’ format, standard PNM image file, or text format. 2.4 Saving Data The NanoManipulator enables saving a variety of data other than stream files. Screen Data Saving the screen image allows you to store the image displayed in the Surface View window. Images may be saved in either tiff or pnm formats. You can record the image with or without the text annotations displayed. NanoManipulator DP-100/200 3 10/26/06 Plane Data A plane is a single layer of scan data. Saving plane data allows you to export scan data for analysis or display in another program. The supported save formats include Veeco’s format, standard PNM image file, or text format. Modification Data Modification data is the information generated from a particular modification action that has been recorded by the NanoManipulator. Saving the modification data allows you to store the information in a format that KaleidaGraph or Excel or another data processing program can read. The data collected during the modification usually includes the Topography, Internal Sensor, Lateral Force, and Z Piezo as well as the time of the modification, the length of the path and the position of the probe. Section 3 NanoManipulatorVisualization The NanoManipulator was designed to provide multiple visualizations of data during both real-time interface with an SPM and during playback of stored data. 3D data display can be customized using 3D interactions such as rotation and scaling, as well as using color maps, textures, contour lines, and grid lines. Visualizations can also include multiple variables such as topography combined with a force measurement or some other measured parameter. 3.1 Surface View The view of the surface is a perspective view, appropriate for simulating the look of the real world. Objects closer to us are larger than objects far away. This also means that lines that are parallel in 3 dimensions are sometimes not drawn parallel on your 2D screen. 3.1.1 Screen Elements Various elements of this typical screen view are labeled by numbers in this picture, and discussed below. NanoManipulator DP-100/200 4 10/26/06 1. Surface – 3D Display of the height information from the plane specified by the Height Plane control. 2. Orientation arrow - This red arrow shows which edge of the surface is ‘up’ (+Y). This edge is where the scan starts, and it always appears at the top of the image if the plane data is saved. 3. Measurement Lines - These red, yellow and blue lines start in the corners of the surface, and provide a way to make quick measurements of surface features. 4. The upper left corner of the screen is the time indicator. If you are connected to a live SPM, it says Live (23) where the number indicates the number of seconds you have been connected to the SPM. If you have opened a stream file, it says Play (23), Play 5x(23), or Pause (23). The multiplier indicates how much faster than real time you are replaying the stream file, and the number indicates the number of seconds that have elapsed in the recorded experiment. Pause indicates that time is not advancing. If you have opened a TM Microscopes data file or other static data file, it says Static File. 5. In the top center of the screen is an indicator of the mode of the Phantom Desktop device. 6. The measure line display shows the distances and angles between the three measure lines. 7. In the lower left corner, the Height Plane name (see below) and scale are displayed. On the next line the grid resolution and the size of the current scan area are displayed. And on the line at the bottom, if you are scanning or looking at a stream file, the point on the surface under the 3D cursor is displayed. If you are touching the surface, it will display the most recent point data sent by the SPM. 8. In the lower right corner, the set points used for image and modify modes are displayed. 9. The 3D cursor icon represents the position of the Phantom in the virtual environment. NanoManipulator DP-100/200 5 10/26/06 3.2 Visual Settings 3.2.1 Height Plane The height plane is the surface displayed in the Surface View Window. Position of the viewpoint and zoom are controlled with the Phantom. The z-scale controls the ratio of the image’s height to its length and width. Because it can exaggerate height, adjusting the z-scale can make certain features more obvious. 3.2.2 Color Map The color map is a linear scale of colors that represent data values at each point on a surface. It can be used to reinforce the height plane data or to display a different data layer from the height plane. Color maps vary in how well they represent different kinds of data. A color map that varies in intensity, such as one that ranges from black to white, will display data with high-frequency variation well. A color map that ranges in hue or saturation, such as one that ranges from red to gray to blue, displays lowerfrequency variations well. The NanoManipulator provides several different color maps from which to choose and enables you to define your own. Calculate Data Planes The sample substrate often has a slope that is difficult to eliminate by positioning the sample under the SPM scanner. The data can be automatically leveled using a flatten plane. 3.2.3 Isovalue Contour Lines Contour lines show the values in a dataset by displaying iso-lines for uniformly spaced data values. Contour lines are traditionally used in terrain maps to show points of equal elevation. 3.2.4 Lighting and Shading The surface displayed by the NanoManipulator is a grid of triangles whose vertices are data points returned from the SPM. This surface is displayed as a shaded surface. The surface can be opaque or partially transparent. Lighting Specular lighting is view-dependent. It produces white highlights, reflected off the surface from the light source. These change if you move the surface or the light. Diffuse lighting is not view-dependent, and contains the base color of the surface. The NanoManipulator lets you adjust the relative amounts of these lights. You can also control the sharpness of the specular highlight. The position of the light is controlled interactively with the Phantom. Section 4 ControllingtheScanningProbeMicroscope The NanoManipulator is more than a visualization system for an SPM. It provides a unique and powerful control mechanism for the SPM both during surface scanning and during sample modification. 4.1 The Phantom Desktop The Phantom Desktop is a six degree-of-freedom positioning and force-feedback device. It provides a simple, intuitive user interface for both viewing and manipulation where hand movements with the Phantom stylus correspond to movements in the NanoManipulator’s display or of the actual SPM probe. NanoManipulator DP-100/200 6 10/26/06 With the Phantom you can move the displayed surface, move the light, zoom in or out, move a virtual probe over the surface to feel different characteristics of the previously scanned surface, or move the actual probe to feel the surface or make modifications. 4.2 Controlling the SPM For Scanning During imaging, the NanoManipulator provides many of the same controls as those in TM Microscopes SPMLab software, Nanotec Electronica’s WSxM software, and IGOR software used with the Asylum Research AFM. These basically determine parameters of the SPM tip scanning the surface. The NanoManipulator adds force feedback and the ability to interact with the scanned surface. 4.2.1 Modes – Oscillating or Contact SPM software typically provides Oscillating mode or Contact mode during scanning. The NanoManipulator enables the same set of parameters provided by the SPM, as well as additional parameters for automatically switching modes. In addition, you can adjust the grid resolution to determine the number of samples collected during scanning. You can also use the Phantom interface to specify a new scan region with respect to the current scan region (a sub region or overlapping region). 4.3 Controlling the SPM For Modifications The parameters for modifications control how hard the SPM tip presses on the sample during a modification, how the tip moves, and whether it moves automatically or under the user's direct control. 4.3.1 Modes – Oscillating or Contact Oscillating and Contact modes are the same as those provided by the AFM software. There are additional parameters to automatically switch to a different mode and to higher force settings when you do a modification. Also, the NanoManipulator collects all data during both modify activities. The NanoManipulator will automatically switch from oscillating mode imaging to contact mode modifications without withdrawing the tip. This typically is used because contact mode can provide a higher force for modification than oscillating mode, and contact mode allows measurement of lateral force. 4.3.2 Modification Styles The style controls how the tip moves during one step of a modification. There are several styles. Sharp - The SPM tip stays on the surface using the feedback parameters to maintain a constant force. Sweep - The SPM tip stays on the surface maintaining a constant force. For each step forward, it makes a side-to-side motion with the width specified. This makes the tip act more like a spatula or a broom, pushing an object on the surface all along the width of the sweep, nudging it forward. It can also be used to clear an area of the surface. If you are using the freehand tool, the direction of the sweep is determined by the twist of the Phantom pen, and is indicated by lines flanking the hand icon. If you are using the line tool, the sweep is constrained to be perpendicular to each line segment. Sewing - The SPM tip punches down to the surface, then retracts and moves forward, punching down again. This mode avoids putting any lateral forces on the tip or the sample enabling a sharp cut in a sample without "snow-plow" effects. The force applied each time the tip punches down is controlled by the set point parameter of the Mode used. Force Curve - At each point, the tip will take a Force-Spectroscopy Curve, and return the results. NanoManipulator DP-100/200 7 10/26/06 4.3.3 Modification Tools The NanoManipulator provides several additional tools for performing modifications. Freehand tool - The tip follows the motion of your hand during a modification. The shape of the surface during the modification is displayed haptically – that is, by touch – providing accurate feedback to dynamic changes. Haptic feedback allows the user to compensate for drift. Line tool - The user specifies the endpoints of a line (or multiple line segments) that the tip is to follow, and a step size for how often the SPM is to collect data. The modification is performed automatically. When using the sharp style, the uniform tip motion allows sensitive measurements of the lateral force. When using the sweep style, the tip will move side-to-side as it moves along the line or line segment(s). At a turn it will sweep out an arc to turn the corner. The sweep is always perpendicular to the direction of motion. Constrained Freehand - The user specifies two endpoints of a line, and then any subsequent motions are constrained to that line. The user can feel the sample and modify while the tip motion is constrained. Slow Line - The user specifies the two endpoints of a line, or multiple line segments, and the tip starts at one endpoint. The motion of the tip is then controlled with commands of Play, Pause and Step, and Reverse for a tightly controlled modification. XY Lock – The user can constrain the probe to a single point and repeatedly sample. Section 5 Analysis The NanoManipulator provides tools to explore and compare data quantitatively. These include Calculated data planes, a Ruler grid, Measure lines and Strip Chart. 5.1 Calculated Data Planes 5.1.1 Flattened Plane Flattening the height plane eliminates the slope in the surface. For example, if the original sample was placed at an angle - higher at one end than at another - then flattening the height plane ‘levels’ the surface. 5.1.2 Sum Plane A Sum Plane is a calculated data plane based on the data in two other planes. This can be useful when comparing two planes of data, or when analyzing error signals. Each data point in the sum plane is calculated as: Sum plane point = (first plane point) + ((scale factor) * (second plane point)) These calculated data planes are dynamic - they are linked to source planes. As the source plane(s) change with new data from an SPM or from a stream file, the calculated plane is updated dynamically. 5.2 Ruler Grid The Ruler grid is a grid of lines, of a specified size and orientation, on the surface. The grid enables rapid estimation of the size of features on the surface, which helps in planning manipulations, or in understanding the general size of objects on your sample. NanoManipulator DP-100/200 8 10/26/06 5.3 Measure Lines The measure lines can be used to measure height and distance. 5.4 Strip chart The Strip chart graphs data collected during a modification. It can display the data collected as a function of time or as a function of a spatial dimension, and allows you to easily change the range of the data collected. It is designed to provide instant feedback during and after a modification. By default, the Strip chart shows both Topography and Lateral Force as a function of the arc-length of the modification so far. You can choose to graph data versus time, versus arc length in nanometers, or versus the X or Y coordinate where the data was collected. Section 6 Documentation The NanoManipulator DP-100 and DP-200 include an online user manual with complete documentation of all functions and interfaces. In addition, there are tutorials for all standard operations including modifications. NanoManipulator DP-100/200 9 10/26/06