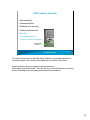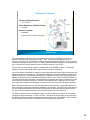
1
Antenna Measurements with the PNA Network Analyzer Presented by • Jim Puri • Applications Specialist Antenna Measurements with PNA Rev. 9-1-2006 1 Purpose During this presentation you will: 9Learn how Agilent instruments can be integrated into your configuration 9Learn about interface requirements between components 9Learn about issues related to selecting the equipment required to make antenna measurements 9Learn how to migrate from the 8510 or 8530A system to the PNA series network analyzer Antenna Measurements with PNA Rev. 9-1-2006 Slide 2 2 Agenda Overview of antenna applications (15min) Antenna Measurement Design Considerations (60min) Migrating from 8510/8530 to PNA (30min) Agilent’s Solutions (25min) Channel Partners (5min) Summary (5min) Antenna Measurements with PNA Rev. 9-1-2006 Slide 3 3 Agenda ¾Overview of antenna applications ¾ Key features in the PNA ¾ Near-field measurements ¾ Far-field measurements ¾ RCS measurements ¾ Banded millimeter-wave measurements Antenna Measurement Design Considerations Migrating from 8510/8530 to PNA Agilent’s Solutions Channel Partners Summary Antenna Measurements with PNA Rev. 9-1-2006 Slide 4 4 PNA key features for Antenna Measurements • High sensitivity • Increased Speed • Flexibility and accuracy • Pulsed measurements • Security Antenna Measurements with PNA Rev. 9-1-2006 Slide 5 The Agilent PNA series network analyzers incorporate new technologies and features to provide better performance and capabilities for antenna and radar crosssection (RCS) test applications. 5 PNA Feature: High Sensitivity Rear ¾High sensitivity Aux LO out (2-20 GHz) Option H11 YIG source Phase-locked loop Multipliers (1, 2) φ 8.33 MHz reference ¾ Mixer-based architecture X Vtu Offset receiver ne X LO Multipliers (1, 2, 4) Option UNL ¾ Selectable IFBW Offset LO ¾ Options H11 & 014 Option 080 •Increased speed Option 081 R1 Option H11 Option H11 IF gate IF gate •Pulsed measurements R2 AD C ADC •Flexibility and accuracy External IF in External IF in External IF in External IF in ADC A •Security Aux RF out (2-20 GHz) Option UNL ADC IF gate IF gate Option H11 Option H11 B Option 016 Front Option 014 Test port 1 Test port 2 Antenna Measurements with PNA Rev. 9-1-2006 Slide 6 The PNA analyzer has a mixer-based architecture providing excellent sensitivity. With the PNA series, you have the ability to select from a minimum of 29 different IF bandwidths. This allows you to optimize the sensitivity versus measurement speed tradeoff to fit particular measurement and application requirements. You can maximize sensitivity with remote mixing by adding Option H11, IF Access. This option allows you to use an externally generated 8.33 MHz IF and bypass the PNA’s internal first downconverter. Option 014 can also improve sensitivity by about 15 dB by adding reference links that allow you to bypass the coupler. 6 PNA Feature: Increased Speed • High sensitivity ¾Increased Speed ¾ Fast data transfers with COM/DCOM ¾ LAN connectivity • Flexibility and accuracy • Pulsed measurements • Security Antenna Measurements with PNA Rev. 9-1-2006 Slide 7 Extremely fast data transfer rates out of the network analyzers are accomplished using the COM/DCOM features. LAN connectivity through a built-in 10/100 Mb/s LAN interface enables the PC to be distanced from the test equipment. Together these features provide remote testing and reduced test time. 7 PNA Feature: Flexibility and Accuracy • Increased Speed Opt. 080 • High sensitivity φ X ¾Flexibility and accuracy LO R1 ¾ Four simultaneous test receivers R2 ¾ Option 080, frequency offset • Pulsed measurements • Security A B Test port 1 Test port 2 4 independents Receivers Antenna Measurements with PNA Rev. 9-1-2006 Slide 8 Up to four simultaneous test receivers (A, B, R1, R2) are available in the standard PNA with 16,001 data points available for each trace. Option 080 enables the PNA series to set the source frequency independently from where the receivers are tuned. The user may enter multiplier and offset values to describe how the instrument’s receivers track the source frequency. With Option 080, reference receiver power levels can be below the phase lock level since phase locking is performed separately. You can attain exceptionally accurate antenna measurements by combining Option H11, IF access, with Option 080, frequency-offset capability and advanced triggering. This combination supports synchronization with external signal generators greatly improving the accuracy of measurements. 8 PNA Feature: Pulsed Measurements • High sensitivity • Increased Speed • Flexibility and accuracy Phase-locked loop φ 8.33 MHz reference e Offset receiver YIG source (3-10 GHz) Vtun X Multipliers (2, 4, 8) Offset LO ¾Pulsed measurements ¾ Internal receiver gate ¾ Point-in-pulse testing • Security R1 A/D R2 LO A/D A B A/D A/D Test port 1 IF gate (at 8.33 MHz 1st IF) Test port 2 Minimum gate width = 20 ns Antenna Measurements with PNA Rev. 9-1-2006 Slide 9 Option H11 also adds internal receiver gates for use in pulsed-RF and pulsed antenna test applications. Combined with Option H08, these gates augment the PNA’s pulse measurement capability by enabling point-in-pulse testing, with pulse widths smaller than 100 ns. 9 PNA Feature: Security • High sensitivity • Increased Speed 4 new USBs • Flexibility and accuracy • Pulsed measurements ¾Security PNA-L ¾ Removable hard drive ¾ Memory clearing & sanitization Easily removable hard drive Antenna Measurements with PNA Rev. 9-1-2006 Slide 10 For secure environments, the PNA family features a removable hard drive to completely ensure the security of the data that is acquired by the PNA. Agilent maintains a security page for all instruments at www.agilent.com/find/security. Visit this site for current information on security issues, including memory clearing and sanitization procedures. 10 Near-field antenna measurements Measurement speed vs. sensitivity is the key for near-field measurements • Maximize speed by selecting widest IF bandwidth – Use PNA-L for further speed improvements Typical near-field configuration using a PNA with option 014 Antenna Measurements with PNA Rev. 9-1-2006 Slide 11 In near-field applications, the probe is located very close to the antenna under test (AUT), so sensitivity and dynamic range are not as important a performance consideration as in a far-field antenna range. The user selectable bandwidth feature can be used to optimize the measurement speed vs. sensitivity tradeoff. By selecting a bandwidth of 40 kHz, the widest bandwidth available, the measurement speed is maximized. The PNA analyzer is mixer based, with fundamental mixing to 20 GHz, providing a 24 dB increase in sensitivity and dynamic range over sampler based analyzers. This more than makes up for the sensitivity reduction realized when the IF bandwidth of the PNA is opened up to its maximum to measurement speed. Therefore, the PNA can achieve faster data acquisition speeds with increased sensitivity in near-field applications over legacy configurations. For further measurement speed improvement, the PNA-L may be used. The PNA-L allows wider IF BW, up to 250 kHz, providing speed improvements, but sensitivity is reduced (up to 24 dB less sensitivity at the highest frequencies, but only a few dB at the lowest frequencies). 11 Far-field measurements with external transmit source (PSG) High sensitivity required for far-field measurements • Use Option H11, IF Access Source antenna 85320A Test mixer Optional amplifier • Reduce IF BW 85320B Reference mixer PSG Synthesized source Positioner Power Supply LAN LO in 85309A Positioner controlle Amplifier 8.33 MHz LAN 8.33 MHz Trigger in Trigger out Measurement automation software SP4T PIN swi Option H11 External input Router/Hub LAN LAN PNA trigger out PNA trigger in 10 MHz reference Controller 1 RF outPNA with Option 014 & H11 Typical far-field configuration using a PNA, external source, and external mixing Antenna Measurements with PNA Rev. 9-1-2006 Slide 12 The PNA based system shown here uses 85320A/B broadband external mixers and a 85309A distributed frequency converter. The internal microwave synthesized source of the PNA is used as the LO source for the 85309A, saving the cost of an external LO source. Far-field antenna measurements require high sensitivity. Excellent sensitivity can be achieved by adding Option H11, IF Access. System noise figure improves from approximately 36 dB to less than 20 dB, resulting in excellent measurement sensitivity (-114 dBm with a 10 kHz IFBW setting). By reducing IF BW on the PNA, even greater sensitivity can be achieved. The PNA's fast data acquisition time makes it an ideal choice for a far-field antenna range. With the PNA bandwidth set to 10 kHz, the data acquisition time is 119 uS per point. This is useful in applications where the data acquisition is quite intensive such as in ranges with active array antennas, but may not be useful where there are antennas with limited positioner rotation speeds. Still, with faster data acquisition speeds, the IF bandwidth can be narrowed, significantly improving measurement sensitivity without increasing total measurement times. For long distance applications, the use of two global positioning system receivers to supply the 10 MHz reference may be used in place of the cable. 12 Far-field measurement without external source Replace the external transmit source (PSG) with an amplifier and use the internal source of the PNA • Excellent frequency agility • Speed improvement Typical far-field configuration using a PNA, no external source, and external mixing Antenna Measurements with PNA Rev. 9-1-2006 Slide 13 If the far-field range allows the use of amplifiers instead of a remote source, you can take advantage of the excellent frequency agility of the PNA which minimizes the frequency switching time for far-field measurements configurations. This figure shows a far-field configuration using the internal source of the PNA instead of a PSG. 13 RCS measurements Excellent measurement sensitivity, fast frequency agility and data acquisition speeds required for RCS measurements 81110A Pulse gen LAN Gating hardware • Sensitivity achieved though mixer-based architecture • Frequency agility and fast data acquisition achieved through source and receiver being located in same instrument • Receiver gating used to avoid overloading receiver during transmission of pulsed-RF signals Chamber Typical RCS configuration using a PNA with Option 014, and pulse hardware gating Antenna Measurements with PNA Rev. 9-1-2006 Slide 14 The PNA family provides the excellent measurement sensitivity, fast frequency agility and data acquisition speeds necessary for RCS measurements. Excellent measurement sensitivity is provided by mixer based down conversion technology; very fast frequency agility is achieved through the source and receiver being located in the same instrument. The PNA’s user selectable IF bandwidths, ranging from 1 Hz to 40 kHz, let you optimize the bandwidth and measurement speed tradeoff to meet a particular test requirement. High-power pulses are often used in RCS measurements to overcome the high losses due to low device reflection and two-way transmission path loss. For this reason, receiver gating is often required in RCS measurements to avoid overloading the receiver during the transmission of the pulsed-RF signal. This figure shows pulse hardware gating, which could easily be added to a PNA RCS configuration for those applications requiring pulse hardware gating. Several additional features of the PNA are particularly useful in RCS configurations. -- Having the source and receiver integrated into the same instrument, with a choice of frequency ranges is very cost effective in RCS applications. -- 16,001 data points are available per measurement trace. This provides extremely long alias-free down-range resolution for RCS measurements. Customers needing a much larger number of data points can use the PNA's 32 channels and effectively “stitch” each 16,001 trace together to create a trace with up to 512,032 data points. -- The PNA has a removable hard drive to comply with data security requirements. 14 Banded millimeter-wave measurements Make banded measurements up to 325 GHz • Use Millimeter-Wave Frequency Extension Modules – N5260AS15, WR-15 (50-75GHz), T/R & T-2 heads – N5260AS11, WR10 (75-110GHz), T/R & T-2 heads – N5260AW15, WR-15 (50 – 75 GHz), 2 T/R heads – N5260AW12, WR-12 (60 -90 GHz), 2 T/R heads – N5260AW10, WR-10 (75 -110 GHz), 2 T/R heads – N5260AW08, WR-8 (90 – 140 GHz), 2 T/R heads – N5260AW06, WR-6 (110 – 170 GHz), 2 T/R heads – N5260AW05, WR-5 (140 – 220 GHz), 2 T/R heads – N5260AW04, WR-4 (170 – 260 GHz), 2 T/R heads – N5260AW03, WR-3 (220 – 325 GHz), 2 T/R heads Typical Millimeter-wave configuration using Oleson Microwave Modules Antenna Measurements with PNA Rev. 9-1-2006 Slide 15 With firmware version A.04.00 or later, the PNA microwave E836x network analyzers are capable of supporting banded millimeter-wave modules, extending the frequency range of your network analyzer up to 325 GHz. Additionally, you can customize the most cost-effective solution specific for your application by purchasing just the module and frequency range you need. In order to obtain the solution shown here, several pieces of equipment are required: Microwave PNA series network analyzer with Options H11, UNL, 014, 080, and 081; N5260A millimeter-wave controller; Millimeterwave VNA frequency extension modules from Agilent or Oleson Microwave Labs This figure shows a PNA banded millimeter-wave solution applied to an outdoor antenna measurement. The transmit side (left) uses an OML Transmit/Receive (T/R) module, and the receive side (right) uses the OML Dual T module. Dual T modules are ideal for measuring both vertical and horizontal polarities of the antenna. Use of the T/R module also allows voltage standing wave ratio (VSWR) testing of the AUT. An important note for millimeter-wave heads from Oleson Microwave Laboratory (OML) that operate above 110GHz for S-parameter measurements (ratio) is that IF bandwidths of 10 or 100 Hz should be used to optimize performance. In addition, two external synthesizers (PSG series) can be used to enhance system dynamic range, especially at 220 GHz and above. For additional information about millimeter measurements, refer to Application Note 1408-15: Using the PNA in Banded Millimeter-wave Measurements. All literature numbers are referenced at the end of the presentation. 15 Agenda 9Overview of antenna applications ¾Antenna Measurement Design Considerations ¾ Transmit Site Configuration ¾ Receive Site Configuration ¾ Measurement Speed ¾ PNA Interface Requirements ¾ H11 ¾ Triggering Migrating from 8510/8530 to PNA Agilent’s Solutions Channel Partners Summary Antenna Measurements with PNA Rev. 9-1-2006 Slide 16 16 Design Considerations Designing an antenna system is an iterative process: • First design the transmit site • Next design the receive site • Then, return to the transmit site to make equipment adjustments required by the receive site • Finally, confirm power levels are adequate for entire system Antenna Measurements with PNA Rev. 9-1-2006 Slide 17 When designing an antenna measurement system, there are many parameters that must be considered in order to select the optimum equipment. Typically you’ll begin by considering the components for the transmit site, then move to the receive site. Designing a complete antenna system often requires you to configure the transmit site, then the receive site, and then make adjustments to the transmit site and recalculate the values for optimum performance. 17 Transmit Site Configuration Transmit antenna This figure shows a typical transmit site configuration. The following slides show how to calculate the various levels indicated. Optional amplifier L2 ERP Gamp L1 PSG Synthesized source OR Internal PNA source Antenna Measurements with PNA Rev. 9-1-2006 Slide 18 18 Select the Transmit Source & Amplifiers Considerations in selecting a transmit source: • Frequency range of AUT • Distance to transmit antenna • Source power • PNA’s internal source typically used for near-field and compact ranges. • External sources typically required for large outdoor ranges. • Speed requirements Antenna Measurements with PNA Rev. 9-1-2006 Slide 19 In selecting the transmit source, consider the frequency range of the antenna under test, the distance to the transmit antenna, the available power of the source, and the speed requirements for the measurements. For compact ranges and near-field ranges, the internal PNA source will typically be the best source to meet your measurement needs. The internal source is faster than an external source and may lower the cost of the complete system by eliminating a source. Large outdoor ranges may require an external source that can be placed at a remote transmit site. Begin by making your power calculations without an amplifier. If after doing the power calculations the transmit power is not high enough, then add an amplifier and run the calculations again. 19 Calculate the effective radiated power Effective Radiated Power (ERP): power level at the output of the transmit antenna. ERP = Psource – (L1 + L2) + Gamp + Gt Transmit antenna Optional amplifier L2 ERP Gamp Where: Psource = Power out of the source (dBm) L1 & L 2 = Loss from cable(s) between source and antenna (dB) Gamp = Gain of the amplifier (if used) (dBi) Gt = Gain of transmit antenna (dBi) L1 PSG Synthesized source OR Internal PNA source • Make power calculations first without an amplifier, add one only if required to achieve the desired transmit power Antenna Measurements with PNA Rev. 9-1-2006 Slide 20 The effective radiated power (ERP) is the power level at the output of the transmit antenna. It can be calculated using the equation shown. It is the power out of the source minus cable losses plus the gain of an amplifier if used and gain of the transmit antenna. 20 Calculate the free-space loss (power dissipation) Free-space loss (power dissipation, PD): difference in power levels between the output of the transmit antenna and the output of an isotropic (0dBi) antenna located at the receive site. PD = 32.45 + 20*log(R) + 20*log(F) Where: R F = Range length (meters) = Test frequency (GHz) This equation does not account for atmospheric attenuation, which can be a significant factor in certain milimeter-wave frequency ranges. A calculator which will derive this number for you can be found at: http://na.tm.agilent.com/pna/antenna Antenna Measurements with PNA Rev. 9-1-2006 Slide 21 The free-space loss (or power dissipation, PD) of an antenna range determines the difference in power levels between the output of the transmit antenna and the output of an isotropic (0dBi) antenna located at the receive site. This free-space loss is due to the dispersive nature of a transmitting antenna. A transmitting antenna radiates a spherical wavefront; only a portion of this spherical wavefront is captured by the receiving antenna. For a free-space, far-field range, this range transfer function is easily determined by the equation given. This equation does not account for atmospheric attenuation, which can be a significant factor in certain millimeter-wave frequency ranges. Compact antenna test ranges (CATRs) achieve greater transfer efficiency by collimating, or focusing the transmitted power using one or more shaped reflectors. Transfer functions for most CATRs are available from the manufacturer's data sheet or on request. If the transfer function is unavailable, use the free-space loss as a worst-case estimate. You should calculate your range transfer function for the minimum and maximum test frequencies. 21 Agenda 9Overview of antenna applications 9Antenna Measurement Design Considerations 9 Transmit Site Configuration ¾ Receive Site Configuration ¾ Measurement Speed ¾ PNA Interface Requirements ¾ H11 ¾ Triggering Migrating from 8510/8530 to PNA Agilent’s Solutions Channel Partners Summary Antenna Measurements with PNA Rev. 9-1-2006 Slide 22 22 Calculate the maximum power level at the output of the AUT P(AUT): power level present at the output of the antenna-under-test (AUT). P(AUT) = ERP – PD + G(AUT) Where: ERP PD = Effective Radiated Power (dBm) = Free-space loss (dB, at the maximum test frequency) G(AUT) = Expected maximum gain of AUT (dBi) Antenna Measurements with PNA Rev. 9-1-2006 Slide 23 The test channel received power level must be calculated to determine the approximate maximum power level present at the output of the antenna-under-test (AUT). The required measurement sensitivity is determined from the test channel received power level, the required dynamic range, and the required measurement accuracy. The maximum test channel received power level will occur when the AUT is bore sighted relative to the transmit antenna. Please note that this value must not exceed the specified compression input levels of the next components (typically either the PNA or in more complex systems, a mixer). Refer to the individual component specifications for detailed information. 23 Dynamic Range, Accuracy & Signal-to-Noise Ratio Required dynamic range is the difference between maximum bore site level and minimum AUT level that must be measured. Examples of measurements made are: Side-lobe levels, null depth and crosspolarization levels. Measurement accuracy is directly affected by the signal-to-noise ratio as shown in this figure. Antenna Measurements with PNA Rev. 9-1-2006 Slide 24 Dynamic Range The measurement dynamic range required to test the AUT is the difference, in decibels, between maximum bore site level and minimum AUT level that must be measured. This number is provided by the customer. Examples of these include side-lobe level, null depth, and cross-polarization levels. Measurement Accuracy/Signal-to-Noise Ratio Measurement accuracy is affected by the measurement sensitivity of the system. The signal-to-noise ratio will directly impact the measurement accuracy of the system for both amplitude and phase measurements. This figure illustrates the relationship between signal-to-noise ratio and magnitude and phase errors. 24 Calculate the Sensitivity for a Receive Site without External mixing Reference Sensitivity = P(AUT) – DR – S/N – L P(AUT) Where: P(AUT) = Power at the output of the AUT (dBm) DR = Required dynamic range (dB) S/N = Signal-to-noise ratio (dB) L = Cable loss (dB) from AUT to PNA input Test L Receiver #1 Receiver #2 Antenna Measurements with PNA Rev. 9-1-2006 Slide 25 The PNA should be located as closely as possible to the test antenna to minimize the RF cable lengths. The measurement sensitivity of the PNA must be degraded by the insertion loss of the RF cable(s) to determine system measurement sensitivity. To determine the sensitivity required of the PNA use the equation shown here. Note that this equation assumes the simplest antenna system with no remote mixing. 25 Choosing an analyzer Agilent has developed options for the PNA series specifically for antenna measurements. However, the PNA-L and ENA analyzers can also be used in less complex applications. Family ENA PNA-L PNA Model/Option Frequency range Frequency stepping Sensitivity at test Sensitivity at direct speed (10 MHz/pt at port with 1 kHz IFBW receiver input with 1 Power out @ Fmax max IFBW with no @ Fmax kHz IFBW (with Opt. band crossings 014) @ Fmax E5070B 300 kHz to 3 GHz Data not available < -92 dBm Option not available E5071B 300 kHz to 8.5 GHz Data not available < -80 dBm Option not available +10 dBm +5 dBm N5230A Opt. 020/025 300 kHz to 6 GHz 160 us < -99 dBm < -108 dBm +10 dBm N5230A Opt. 120/125 300 kHz to 13.5 GHz 160 us < -94 dBm < -108 dBm +2 dBm N5230A Opt. 220/225 10 MHz to 20 GHz 160 us < -85 dBm < -97 dBm +10 dBm N5230A Opt. 420/425 10 MHz to 40 GHz 160 us < -75 dBm < -86 dBm -5 dBm N5230A Opt. 520/525 10 MHz to 50 GHz 160 us < -70 dBm < -78 dBm -9 dBm E8362B 10 MHz to 20 GHz 278 us < -100 dBm < -114 dBm +3 dBm E8363B 10 MHz to 40 GHz 278 us < -94 dBm < -105 dBm -4 dBm E8364B 10 MHz to 50 GHz 278 us < -94 dBm < -103 dBm -10 dBm E8361A 10 MHz to 67 GHz 278 us < -79 dBm < -88 dBm -5 dBm Antenna Measurements with PNA Rev. 9-1-2006 Slide 26 Agilent offers three families of network analyzers: The PNA series, the PNA-L series and the ENA series. Agilent has developed options for the PNA series specifically for antenna measurements. Because of these options, the PNA series is often the preferred analyzer for antenna solutions. However, there are applications which do not require these options so the lower cost PNA-L series or ENA series analyzers may be the right solution. For secure environments, a PNA or PNA-L series analyzer must be used because the ENA does not have security features. 26 Calculate the Sensitivity for a Receive Site with External mixing When do you need external mixing? When the AUT is located far from the analyzer which requires long cables. The long cables reduce accuracy and dynamic range often to unacceptable levels. Benefit of remote mixers 85320A Test mixer • Down converts signal to an IF signal • Reduces RF cable losses 85320B Referenc e mixer LO in 85309A • Maximizes accuracy and dynamic range 8.33 MHz LO out 8.33 MHz Amplifier Antenna Measurements with PNA Rev. 9-1-2006 Slide 27 If the AUT is located far from the analyzer, requiring long cables, then the loss caused by the cables could be significant, reducing accuracy and dynamic range. You may also be unable to find an analyzer that meets your sensitivity requirements. In this situation, down converting the signal to an IF signal by using the 85309 LO/IF distribution unit with 85320A/B remote mixers brings the measurement closer to the AUT. This reduces RF cable loss and maximizes accuracy and dynamic range. Options H11 and 014 on the PNA network analyzers both support remote mixing configurations. 27 Receive Site Configuration This figure shows a typical receive site configuration. The following slides show how to calculate the various levels indicated. Antenna Measurements with PNA Rev. 9-1-2006 Slide 28 28 Select the LO Source Frequency Range Required: ¾ 0.3 to 18 GHz Power Required at 85309A LO Input: ¾ 0-6 dBm Sources Available: ¾ PSG/ESG ¾ Internal Source of PNA with amplifier Antenna Measurements with PNA Rev. 9-1-2006 Slide 29 The recommended microwave mixers use fundamental mixing from 300 MHz to 18 GHz, and harmonic mixing for frequencies above 18 GHz. Thus, an LO source that operates over the frequency range of 0.3 to 18 GHz will be adequate for all frequencies of operation. A large selection of sources is available for the LO source. In many situations the PNA can supply the LO signal since the LO sources only need to operate over the frequency range of 0.3 to 18 GHz. The LO source must be able to supply 0 to 6 dBm power at the 85309A LO input. To determine whether the source has enough power, cable losses must first be considered. Loss of LO cables is dependent on frequency; lower frequencies have lower loss per unit length, and higher frequencies have higher loss. Therefore the maximum LO frequency utilized will result in the maximum cable loss. The maximum LO frequency is dependent on the frequency specified for the antenna range and whether fundamental or harmonic mixing is used. There is a trade-off between LO frequency and system sensitivity. Fundamental mixing provides the lowest conversion loss in the mixer, and the best system sensitivity. Harmonic mixing allows lower LO frequencies to be used (with longer cable lengths), but has higher conversion loss in the mixer, and less system sensitivity. Before calculating cable loss, you must first determine the LO frequency. If using PNA Option H11, the LO frequency must be set such that an 8.33MHz IF is produced. The PNA’s LO is offset from its RF by 8.33 MHz automatically if the PNA is operated below 20 GHz and frequency offset is turned off. We will be discussing a little later how to set up the PNA LO for an 8.33 MHz IF. The PNA’s internal LO can be accessed through a rear panel output port if Option H11 is installed. Its frequency range is limited to 1.7 GHz to 20 GHz. The signal on the rear panel is very low power and always requires an amplifier to achieve the required power level at the 85309A. The front panel RF can only be used as the LO for the 85309A if it is not used as the system RF. 29 Calculate the Required Power of the LO Source Ps = Cable length (meters) X cable loss (dB/meter) + Pin Where Ps = Power out of the LO source Pin = Required power into 85309A (0 to 6 dBm) Sources Available: • PSG/ESG • Internal Source of PNA with amplifier Antenna Measurements with PNA Rev. 9-1-2006 Slide 30 Select a source that meets your individual preferences and needs. Higher-output power sources or an amplifier must be used if Pin is insufficient. 30 Reference Signal Level Requirement: • Signal must be high enough to achieve the desire accuracy Reference mixer provides: • A phase reference & a reference signal for a ratioed measurement (test/reference) • Ratios out any variations in signal levels from system Antenna Measurements with PNA Rev. 9-1-2006 Slide 31 The reference mixer provides a phase reference for the measurement and a reference signal for a ratioed measurement (test/reference), to ratio out any variations in signal levels from the system. If you use the internal source of the PNA, then phase locking the receiver is not required. The only requirement for the reference channel is that the signal level be high enough to achieve the desired accuracy for the measurement. The magnitude and phase errors chart shown earlier shows the errors as a function of signal-to-noise ratio; this also applies to errors contributed by the reference channel. For most applications, it is desirable to maintain a 50 to 60 dB signal-to-noise ratio. 31 Determine Cable Length from 85309A to Mixers Cable length must be calculated to assure adequate power to the 85309A Cable length (meters) = (Pout(85309A) – Pin(mixer)) / (cable loss/meter@frequency) 9 High quality, low loss, phase stable cables are recommended Antenna Measurements with PNA Rev. 9-1-2006 Slide 32 Mixers require a certain LO drive power level; the output power of the 85309A LO/IF distribution unit and the RF loss of the cables will determine the maximum allowable cable lengths. To assure you have enough power at your mixers, use the equation shown to calculate the maximum cable length allowed for your setup: Cable length (meters) = (Pout 85309A – Pin mixer)/(cable loss/meter@frequency) High quality, low loss, phase stable cables are recommended. Note: The same LO cable type and length is required for both the reference and test mixer modules. This is to ensure that the insertion losses through the reference and test mixer module LO paths are the same. Using the same LO cable type also optimizes cable phase tracking versus temperature and therefore, system phase measurement, stability, and accuracy. When a rotary joint is used, the equivalent cable length must be added to the reference mixer LO cable due to the rotary joint insertion loss. To determine the equivalent cable length, first determine the insertion loss from the input to the output of the rotary joint at the maximum LO frequency. Then, using insertion loss curves for the LO cables between the 85309A and the mixer module, calculate the equivalent length in meters at the maximum LO frequency. The reference LO cable length must be increased by this amount. 32 Power at Reference Mixer PRM = ERP – PD + G(REF) – L1 Where: PRM = Power level at the reference mixer (dBm) ERP = Effective radiated power (dBm) PD = Free space loss (power dissipation) (dB) G(REF) = Gain of reference antenna (dBi) L1 = cable loss between ref. antenna and ref. mixer (dB) Antenna Measurements with PNA Rev. 9-1-2006 Slide 33 Calculation of the power level at the reference mixer depends on the method used to obtain the reference signal. Almost all ranges obtain the reference channel signal using a stationary reference antenna to receive a portion of the radiated transmit signal. When using a radiated reference, the power at the reference mixer can be determined from the equation listed on the slide. Note: If the calculated power level at the mixer is insufficient to achieve the desired accuracy from the reference channel, the transmit power or the reference antenna gain must be increased. Caution: PRM must not exceed the maximum power level of the mixer PRM – Mixer conversion loss must be less than +5 dBm so as to not exceed the 1 dB compression level for the LO/IF input for the 85309A. When using a coupled reference, the reference channel power level can be determined by subtracting the cable insertion losses and the coupling factor of the directional coupler and adding amplifier gain, if any, to the output power of the transmit source. 33 Calculating the Power at the Test Mixer PTM = ERP – PD + G(AUT) –L2 Where: PTM = Power level at the test mixer (dBm) ERP = Effective radiated power (dBm) PD = Free-space loss (power dissipation) (dB) G(AUT) = Gain of the test antenna (dBi) L2 = Cable loss between AUT and test mixer (dB) Antenna Measurements with PNA Rev. 9-1-2006 Slide 34 Calculate the power level at the test mixer. The power at the test mixer is equivalent to the power at the output of the AUT (calculated earlier) if the mixer is attached directly to the AUT. Caution: PTM must not exceed the maximum power level of the mixer PTM – Mixer Conversion Loss must be less than +5 dBm so as to not exceed the 1 dB compression level for the IF input to the 85309A. 34 Power at the Analyzer Inputs IF power level at the receiver can be calculated by the following: ¾ PREF = PRM – conversion loss of mixers + conversion gain of 85309A – (L3+L5) ¾ PTEST = PTM – conversion loss of mixers + conversion gain of 85309A – (L4 +L6) Where L = Cable losses as shown in the figure. Conversion gain of 85309A = 23 dB (typical). Antenna Measurements with PNA Rev. 9-1-2006 Slide 35 Next calculate the IF power level at the receiver inputs. Use extreme caution -- These values must not exceed the maximum input power level (0.1 dB compression level) of the receiver (-27 dBm for Option H11 or -14 dBm for Option 014). Reduce the power level of the RF source if necessary or add attenuators prior to the mixers or the analyzer inputs. 35 Sensitivity for Receiver Sites with External Mixers Sensitivity required of the PNA can be calculated by the following: 85320A Test mixer Sensitivity = PREF – DR – S/N 85320B Reference mixer Where • DR = Required dynamic range • S/N = Signal-to-noise ratio determined earlier as required of measurement uncertainty LO in 85309A 8.33 MHz 9 Now, with this sensitivity number, select an analyzer 8.33 MHz Amplifier LO out Antenna Measurements with PNA Rev. 9-1-2006 Slide 36 Calculate the sensitivity of a system with external mixers. Then, select an analyzer from the prior table that meets your measurement needs. 36 Agenda 9Overview of antenna applications 9Antenna Measurement Design Considerations 9 Transmit Site Configuration 9 Receive Site Configuration ¾ Measurement Speed ¾ PNA Interface Requirements ¾ H11 ¾ Triggering Migrating from 8510/8530 to PNA Agilent’s Solutions Channel Partners Summary Antenna Measurements with PNA Rev. 9-1-2006 Slide 37 37 Measurement Speed Measurement speed is made up of many components. • The speed displayed on the analyzer is only one part of the actual speed. • Total measurement speed you can either measure it directly, or get an estimate from an equation. Antenna Measurements with PNA Rev. 9-1-2006 Slide 38 Calculating the measurement speed of your antenna test system is not straightforward. Two methods can be used to determine the speed of the PNA, either measure it directly or use the equation on the following slides to calculate the approximate speed. 38 Measuring the Speed • Use a program to time when the measurement is complete OR • Use an oscilloscope to monitor the Trigger Out on the rear panel BNC •Put the PNA in external trigger mode •Set it to the default of “hi level” trigger • Total measurement time is the spacing between “trig in” and “trig out” Antenna Measurements with PNA Rev. 9-1-2006 Slide 39 To measure the speed, either use a program to time when the PNA completes the measurement, or use an oscilloscope and monitor the “ready for Trigger” line out the rear panel BNC labeled I/O 2 (Trig Out). Put the PNA in external trigger mode, set it to the default of “hi level” trigger (If there is no trigger in, you do not have to enable Trigger Out). A pull up on the “trig in” line will cause the PNA to run at max speed. The total measurement time is the spacing between “trig outs”. 39 Calculating Approximate Speed The approximate speed of the PNA can be calculated: Total Measurement time = data taking + pre-sweep time + band crossing + retrace Data taking ~ 1/BW Pre-sweep ~ 222 uS (PNA), 56 uS (PNA-L) – Swept mode Band crossings ~ 4 -8 mS/crossing (PNA), 2 mS/crossing (PNA-L) Retrace ~ 10 – 15 mS (display on), 5 -8 mS (display off) Antenna Measurements with PNA Rev. 9-1-2006 Slide 40 The equation shown here allows you to calculate the approximate speed. Typical values for each part are shown. Data taking: Measurement time per point is determined by the larger of 1/BW or the maximum sweep rate. For wide spans with fewer points, sweep rate is more likely to dominate. Sweep rate is approximately 600 GHz/ms for the PNA and approximately 900 GHz/ms for the PNA-L. Pre-sweep time: In swept mode, pre-sweep time is 222 uS for the PNA and 56 uS for the PNA-L. In step mode, calculate the sweep time from the following information: PNA fastest step speed at 1 Hz/pt, max IF BW is 170 us, and at 10 MHz/pt, max IF BW is 278 us; PNA-L fastest step speed at 1 Hz/pt, max IF BW is 80 us, and at 10 MHz/pt, max IF BW is 160 us. Band crossings take on the order of 4 – 8 ms per crossing for the PNA and 2 ms for the PNA-L. However, the number of band crosses increases when in frequency offset mode. In that mode, band crossings of source and receiver may not coincide. Exact band crossing locations can be found in the Microwave PNA Service Manual on Table 5.2. Retrace takes 10-15 mSec with the display on, or 5-8 mSec with the display off. Retrace will take the system back to the start frequency of the previous sweep. 40 Measurement Speed Example Configuration: PNA with 201 points, 1 GHz span, 10 kHz BW sweep 1. Determine if step or swept. (IF BW <= 1kHz or time/point > 1 mS, then stepped otherwise swept.) 2. Data taking: 1/BW=1/10 kHz = 100 uS (Swept mode) >> 201 points * 100 uS/point = 20.1 mS 3. Pre-sweep time: 222 uS 4. Band crossings: None 5. Retrace time: 10 to 15 mS Total measurement time = 20.1 mS + 222 uS + 10 to 15 mS = 30 to 35 mS (NOMINAL) Antenna Measurements with PNA Rev. 9-1-2006 Slide 41 From the prior equation, you can calculate the measurement time for a PNA with 201 points, 1 GHz span and 10 kHz BW sweep. First, determine if most PNA points are in step or swept mode. If BW <= 1kHz or time/point > 1mS, all points will be stepped, otherwise it will be swept. In addition, source power cal, power sweep and frequency offset mode all force step mode. Data taking: time/point = 1/BW = 1/10 kHz = 100 uSec (since this is faster than 1 mS, the PNA is probably in swept mode) So, 201 points @ 100 uS/point is 20.1 mS Next, check the sweep rate limit. A 1 GHz span at 600 MHz/mSec = 1.7 mS . So, the sweep speed is dominated by “time/point” not sweep rate. Therefore, “data taking” = 20.1 mS Pre-sweep time: 222 uS Band-crossings: None Retrace time: 10 to 15 mS Total measurement time = 20.1 mS + 222 uS + 10 to 15 mS = 30 to 35 mS (NOMINAL) 41 Optimizing speed and dynamic range Improve sensitivity: • Option 014 (Direct Receiver Access) -- Sensitivity Improvements • Option H11 (IF MUX access) – Best Dynamic Range when using external mixers Other Tradeoffs: • Reduce IF BW -- improves dynamic range, reduces speed • Example: Changing IFBW from 1kHz to 100Hz • 10dB Improvement of dynamic range • 10 times reduction in speed Antenna Measurements with PNA Rev. 9-1-2006 Slide 42 Some applications require the fastest speed a system can provide, others are concerned with the best dynamic range available. With the PNA series network analyzer, users can adjust their setup according to their specific needs. Options available to improve sensitivity Opt. 014 (Direct Receiver access) – Sensitivity Improvements Opt. H11 (IF MUX access) – Best Dynamic Range when using external mixers Other tradeoffs Reducing the IF BW improves the dynamic range, but reduces the speed. Users must determine the optimum settings for their applications. For example changing from a 1 kHz IF BW to a 100 Hz IF BW gives a 10 dB improvement in dynamic range, but a 10 times reduction in speed 42 Agenda 9Overview of antenna applications 9Antenna Measurement Design Considerations 9 Transmit Site Configuration 9 Receive Site Configuration 9 Measurement Speed ¾ PNA Interface Requirements ¾ H11 ¾ Triggering Migrating from 8510/8530 to PNA Agilent’s Solutions Channel Partners Summary Antenna Measurements with PNA Rev. 9-1-2006 Slide 43 43 PNA interface - Front Panel PNA with option 014 Antenna Measurements with PNA Rev. 9-1-2006 Slide 44 PNA interface requirements When configuring the PNA it is critical that power levels are considered to avoid damaging the PNA. Ideally, power should not exceed the 0.1 dB compression levels indicated in the figure. Damage levels are printed on the analyzer. 44 PNA Interface – Rear Panel Triggering (remote access): •BNC connectors •Edge-triggering (pos/neg) •Trigger in/out •Remote access with SCPI •Available on PNA models E8361A, E836xB, and N5230A. Option H11 Connectors: •PNA RF source and LO outputs for external mixing •Pulsed measurement capability with Option H08 •Direct access to the internal IF PNA with option H11 Test set Pulse in 8.33 Mhz IF in 0.1 dB Compression point: -27 dBm Damage level: -20 dBm RF LO B R2 R1 A B R2 R1 A Minimum IF gate width: 20 nS for less than 1 dB deviation from theoretical performance (internal gates) DC damage level: 5.5 Volts Drive Voltage: TTL (0,+5.0) Volts Gate input impedance: 1Kohm Antenna Measurements with PNA Rev. 9-1-2006 Slide 45 The rear panel provides access to the BNC triggering connectors and option H11 connectors. Be sure the power and voltage levels remain below the 0.1 dB compression point for the IF inputs and the DC damage level for the pulse inputs. 45 Option H11 – IF Access Rear Aux LO out (2-20 GHz) Option H11 YIG source Phase-locked loop • Direct access to first IF stage Multipliers (1, 2) φ 8.33 MHz reference • Available only on PNA Aux RF out (2-20 GHz) X Vtu Offset receiver ne X LO Multipliers (1, 2, 4) Option UNL • Increases sensitivity by about 20 dB Offset LO Option 080 • Also provides access to RF & LO signals on rear panel Option 081 • If PNA LO is used as the LO for mixers, must also have Option 080 on the PNA R1 Option H11 Option H11 IF gate IF gate R2 AD C ADC External IF in External IF in External IF in External IF in ADC A Option UNL ADC IF gate IF gate Option H11 Option H11 B Option 016 Front Option 014 Test port 1 Test port 2 Antenna Measurements with PNA Rev. 9-1-2006 Slide 46 Option H11 is only available on the PNA Network Analyzers. H11 provides direct access to the first IF down conversion stage. The external IF input allows 8.33 MHz IF signals from remote mixers to input directly to the PNA digitizer, bypassing the PNA’s RF conversion stage. The test system becomes a distributed network analyzer with a tracking source and a tuned receiver. This shifts the dynamic range curves and increases sensitivity by approximately 20 dB. Option H11 also provides access to the RF and LO signal sources (from 1.7 to 20 GHz) of the PNA on the rear panel. This dual hybrid source eliminates the need for a separate stand alone synthesizer when remote mixing is used. There is no power control over the rear panel RF and LO signals. Power output ranges vary and external amplifiers may be needed to achieve the power level required by the mixers. Note that by using the PNA LO as LO to the external mixers requires the frequency offset option 080 of the PNA in order to achieve the necessary 8.33 MHz IF signal for the PNA. By removing the necessity for an external RF source the test time is reduced dramatically since the frequency stepping speed is solely a function of the PNA where the settling time is in the uS range compared to sources in the mS range. 46 Rear panel test port power levels Rear Panel LO Power (Typical) 1.7 GHz to 20 GHz -16 to -7 dBm Rear Panel RF Power for E8362B (Typical) 1.7 GHz to 20 GHz -16 to -5 dBm(at -5 dBm test port power1) Rear Panel RF Power for E8363B/E8364B (Typical) 1.7 GHz to 10 GHz -12 to -2 dBm (at -5 dBm test port power1) 10 GHz to 16 GHz -8 to 0 dBm (at -5 dBm test port power1) 16 GHz to 20 GHz -1 to +5 dBm (at -5 dBm test port power1) 1. Assumes RF power level high enough so a Drop Cal does not occur. Antenna Measurements with PNA Rev. 9-1-2006 Slide 47 This table shows the typical power levels available at the outputs. NOTE: Test port power has to be at a high enough level such that the Drop Cal does not occur. If Drop Cal occurs, then the power out of the rear panel RF connector will drop by about 15 dB. 47 PNA Option H11 and Option 014 Connection Requirements 85320A Test mixer RF in Pin <26 dBm 85320B Reference mixer RF in Pin <26 dBm Pin ~7.5 to 16 dBm LO in Pin ~7.5 to 16 dBm Pout =19 dBm Pout =19 dBm 85309A Test IF to PNA Ref IF to PNA LO Input Input Freq Max Input (.1db) Front 014 20 MHz -10 dBm 8.33 MHz -27 dBm A,B,R1,R2 Rear H11 A,B,R1,R2 RF Out from PNA To option H11 Inputs on PNA Attenuators required if power exceeds -27 dBm To option 014 Inputs of PNA Antenna Measurements with PNA Rev. 9-1-2006 Slide 48 This diagram shows the power levels required for options H11 and 014. The power levels are critical to be sure your configuration will function properly. 48 85309A & PNA configurations 85309A & PNA with Opt. 014 & 080 85320A Test mixer • Operates in frequency offset mode • 20 MHz signal required by the 85309A • Test & Reference signals inserted through front panel links (bypassing PNA’s internal coupler) 85320B Reference mixer LO in 85309A • Improved sensitivity 20 Mz (A) 20 MHz (B) LO out Using PNA RF output port as system LO source This example does not show Tx Ant. or Source Antenna Measurements with PNA Rev. 9-1-2006 Slide 49 The 85309 LO/IF distribution unit interfaces with the PNA in two different ways, providing either a 20 MHz signal or an 8.33 MHz signal. It is important to understand the differences in each configuration before setting up your measurement. For the setup with the PNA configures with Options 014 and 080, the PNA operates in frequency offset mode and the 85309A must create a 20 MHz IF signal. The receiver is set to 20 MHz and the RF and LO sources must be offset by 20 MHz. The test and reference signals are inserted through the front panel links, bypassing the PNA’s internal coupler. This configuration improves the PNA noise floor by approximately 10 to 38 dB, depending on frequency. However, operation in frequency offset mode results in a decrease of frequency stepping speed. 49 Calculate LO Freq for IF = 20.0 MHz • Transmit Frequency BELOW 20GHz – 85309A, Mixers & PNA operate in fundamental mode – Harmonic multiple, N is 1 Typically for a mixer: IF = N(LO) – RF LO = (IF+RF)/N where N = ext. mixer harmonic number • Since Offset must equal to IF or 20 MHz then Offset, 20MHz = N(LO) – RF LO (MHz) = (RF + 20.00MHz)/1 Example: Tx frequency = 8 – 12GHz LO (MHz) = 8.020 – 12.020GHz Antenna Measurements with PNA Rev. 9-1-2006 Slide 50 Using the PNA front panel Port 1 Source Out as the LO input for the 85309 the equations are given on this slide. To set the LO frequency of the 85309, simply set the RF output on the PNA to the frequency indicated. 50 Setting up PNA Front port RF output as System LO source & Receiver to IF = 20.0 MHz • Since PNA Opt. 080; Response = Offset+ (Multiplier/Divisor) x RF Where Divisor = Harmonic Multiplier = 1 • Response freq MUST be Receiver or IF frequency = 20MHz Where Multiplier = 0 to keep Receive freq. constant So, Response = 20MHz + (0/1) x RF = 20MHz . Receiver Freq Example: Tx frequency = 8 – 12GHz LO (MHz) = 8.020 – 12.02GHz LO Frequency Antenna Measurements with PNA Rev. 9-1-2006 Slide 51 To set the LO frequency of the 85309, simply set the RF output on the PNA to the frequency indicated. 51 Setting up PNA Front port RF output as System LO source & Receiver to IF = 20.0 MHz Demo FOM dialog Box . Receiver Freq Example: Tx frequency = 8 – 12GHz LO (MHz) = 8.020 – 12.02GHz LO Frequency Antenna Measurements with PNA Rev. 9-1-2006 Slide 52 To set the LO frequency of the 85309, simply set the RF output on the PNA to the frequency indicated. 52 Calculate LO Freq for IF = 20.0 MHz • Transmit Frequency ABOVE 20GHz – 85309A and Mixers operate in the third-harmonic mode – Harmonic multiple, N is 3 Typically for a mixer: IF = N(LO) – RF LO = (IF+RF)/N where N = ext. mixer harmonic number • Since Offset must equal to IF or 20 MHz then Offset, 20MHz = N(LO) – RF LO (MHz) = (RF + 20.00MHz)/3 Example: Tx frequency = 21 – 30GHz LO (MHz) = 7.00666 – 10.00666GHz Antenna Measurements with PNA Rev. 9-1-2006 Slide 53 Using the PNA front panel Port 1 Source Out as the LO input for the 85309 the equations are given on this slide. Above 20 GHz the PNA switches to 3rd harmonic mode so that RF – 3 XLO = 8.33MHz. To set the LO frequency of the 85309, simply set the RF output on the PNA to the frequency indicated. 53 Setting up PNA Front port RF output as System LO source & Receiver to IF = 20.0 MHz • Since PNA Opt. 080; Response = Offset+ (Multiplier/Divisor) x RF Where Divisor = Harmonic Multiplier = 3 • Response freq MUST be Receiver or IF frequency = 20MHz Where Multiplier = 0 to keep Receive freq. constant So, Response = 20MHz + (0/3) x RF = 20MHz . Receiver Freq Example: Tx frequency = 21 – 30GHz LO (MHz) = 7.00666 – 10.00666GHz LO Frequency Antenna Measurements with PNA Rev. 9-1-2006 Slide 54 To set the LO frequency of the 85309, simply set the RF output on the PNA to the frequency indicated. 54 85309A & PNA configurations 85309A & PNA with Opt. 014, 080, 081, UNL & H11 85320A Test mixer 85320B Reference mixer LO in 85309A LO out Using PNA opt H11 LO output port as system LO source 8.33 MHz (A) Amplifier 8.33 MHz (B) • 8.33 MHz signal required by the 85309A and PNA • Test & Reference signals inserted through rear panel IF inputs (bypassing the first PNA down converter stage) • Best sensitivity This example does not show Tx source or Ant Antenna Measurements with PNA Rev. 9-1-2006 Slide 55 The 85309 LO/IF distribution unit interfaces with the PNA in two different ways, providing either a 20 MHz signal or an 8.33 MHz signal. It is important to understand the differences in each configuration before setting up your measurement. For the setup with the PNA configured with Options 014, 080, 081, UNL, and H11, the 85309A must create an 8.33 MHz signal. The RF and LO sources must be offset by 8.33 MHz. Normal operation of the PNA automatically offsets the internal LO 8.33 MHz from the internal RF. This configuration allows the 85309A IF output to be connected to the PNA H11 rear panel IF inputs, bypassing the first PNA mixer. This configuration provides the best sensitivity. 55 Setting up PNA opt. H11 LO output as System LO source & Receiver = 8.33 MHz • PNA opt. H11 • LO output is always offset RF by 8.33MHz • Receiver inputs expected to receive 8.33MHz • By pass first converter • Since PNA Opt. 080; Response = Offset+ (Multiplier/Divisor) x RF So, Response = 0MHz + (1/1) x RF Expect Response freq for front panel inputs only. Example: Tx frequency = 21 – 30GHz LO (MHz) = 7.00666 – 10.00666GHz Equivalent of RF/Transmit Frequency Antenna Measurements with PNA Rev. 9-1-2006 Slide 56 Using the PNA option H11 LO output Port as the LO input for the 85309 the equations are given on this slide. To set the LO frequency of the 85309, simply set the RF output on the PNA to the frequency indicated. 56 Setting up PNA opt. H11 LO output as System LO source & Receiver = 8.33 MHz Demo FOM dialog Box Expect Response freq for front panel inputs only. Example: Tx frequency = 21 – 30GHz LO (MHz) = 7.00666 – 10.00666GHz Equivalent of RF/Transmit Frequency Antenna Measurements with PNA Rev. 9-1-2006 Slide 57 Using the PNA option H11 LO output Port as the LO input for the 85309 the equations are given on this slide. To set the LO frequency of the 85309, simply set the RF output on the PNA to the frequency indicated. 57 Turning on Option H11 Although Option H11 is installed, you must assure that the IF switch is set correctly for it to function properly. Select Channel > Advanced > IF Switch Configuration Then Select External for both IF Inputs Antenna Measurements with PNA Rev. 9-1-2006 Slide 58 One of the most common mistakes in configuring Option H11 is failing to turn it on. The IF input must be set to “External”, as shown in this slide, for H11 to function. 58 PNA Triggering • Required to synchronize the PNA’s data collecting with other hardware (sources & positioners) • Used to associate measurements with a given position or angle of an antenna • Typically done via edge triggering Antenna Measurements with PNA Rev. 9-1-2006 Slide 59 Typically in an antenna measurement system, the PNA is externally triggered. External triggering is required to synchronize the PNA’s data collecting with other hardware such as signal sources and antenna positioners. It is also used to associate measurements with a given position or angle of an antenna. Most triggering is done via edge triggering. 59 Triggering Set-up Select Sweep > Trigger > Trigger Set the Trigger Scope to Channel Click External Trigger and set parameters shown in Figure Antenna Measurements with PNA Rev. 9-1-2006 Slide 60 The trigger menus are shown here. Set the trigger parameters to meet your specific needs. In the External trigger menu, when “Accept Trigger Before Armed” is checked, as the PNA becomes armed (ready to be triggered), the PNA will immediately trigger if any triggers were received since the last data collection. The PNA remembers only one trigger signal. All others are ignored. When this checkbox is cleared, any trigger signal received before the PNA is armed is ignored. When “Enable Output” is checked the PNA is enabled to send trigger signals out the rear-panel I/O (TRIG OUT) BNC connector. Position “Before” or “After” determines if the trigger pulse output is sent either BEFORE or AFTER a receiver measurement. 60 Triggering Set-up Select Sweep > Trigger > Trigger Set the Trigger Scope to Channel Click External Trigger and set parameters shown in Figure Demo Trigger dialog Box Antenna Measurements with PNA Rev. 9-1-2006 Slide 61 The trigger menus are shown here. Set the trigger parameters to meet your specific needs. In the External trigger menu, when “Accept Trigger Before Armed” is checked, as the PNA becomes armed (ready to be triggered), the PNA will immediately trigger if any triggers were received since the last data collection. The PNA remembers only one trigger signal. All others are ignored. When this checkbox is cleared, any trigger signal received before the PNA is armed is ignored. When “Enable Output” is checked the PNA is enabled to send trigger signals out the rear-panel I/O (TRIG OUT) BNC connector. Position “Before” or “After” determines if the trigger pulse output is sent either BEFORE or AFTER a receiver measurement. 61 Near-field Data Set Trigger Errors Frequency multiplexing causes misalignment of rectangular near-field grid between forward & reverse data scans Solutions • Always scan in same direction – Doubles the data scan acquisition time • Scan frequencies in reverse order on reverse scan – Requires RF source that supports reverse frequency list mode ( PNA’s Arbitrary Segment sweep) Antenna Measurements with PNA Rev. 9-1-2006 Slide 62 Frequency multiplexing during a data scan/acquisition can result in a misalignment of the rectangular near-field grid between forward and reverse data scan directions. This introduces an error into the measured near-field data set which results in a farfield pattern. One way to eliminate this error is to always collect data measurements in the same scan direction, but this would double the data scan acquisition time. Another approach is to scan frequencies in reverse order on reverse scans. Using this reverse sweep in conjunction with correct triggering between forward and reverse passes insures that each frequency set is spatially aligned on the rectangular near-field grid. This technique requires an RF source that supports reverse frequency list mode of operation. 62 Near-Field Data Collection with the PNA PNA includes reverse sweep and edge triggering specifically designed for antenna measurements. F1 F2 F3 F1 F2 F3 F1 F2 F3 F1 F2 F3 Forward Reverse F3 F2 F1 F3 F2 F1 F3 F2 F1 F3 F2 F1 Bi-directional scanning can introduce errors in measured positions Forward F1 F2 F3 F1 F2 F3 F1 F2 F3 F1 F2 F3 Reverse F1 F2 F3 F1 F2 F3 F1 F2 F3 F1 F2 F3 Solution: Reverse frequency sweep and synchronous triggers Antenna Measurements with PNA Rev. 9-1-2006 Slide 63 The PNA network analyzer includes reverse sweep and edge triggering capability specifically designed for antenna measurements. Using reverse frequency sweep and synchronous triggers, alignment error are eliminated. 63 Agenda 9Overview of antenna applications 9Antenna Measurement Design Considerations ¾Migrating from 8510/8530 to PNA Agilent’s Solutions Channel Partners Summary Antenna Measurements with PNA Rev. 9-1-2006 Slide 64 64 PNA-Based Antenna Systems Example of New and Upgraded PNA-BASED Users Over 100 PNA-Based system worldwide Antenna Measurements with PNA Rev. 9-1-2006 Slide 65 65 85301B Antenna Systems to PNA System Components Description 8510C 8510C -008 Network Analyzer Network Analyzer with pulse capability 45 MHz – 20 GHz Test set 45 MHz – 26.5 GHz Test set 45 MHz – 50 GHz Test set Pulsed 2 – 20 GHz Test set 8514B 8515A 8517B 85110A Recommended PNA Solution Determined by test set Determined by test set Description E8362B E8363B E8364B E8362B with Options H11, H08, 014, 080, 081, UNL E8362B with Option H11, H08, 014, 080, 081, UNL 10 MHz – 20 GHz 10 MHz – 40 GHz 10 MHz – 50 GHz 10 MHz – 20 GHz with IF access and pulsed –RF measurement capability 10 MHz – 20 GHz with IF access and pulsed –RF measurement capability 85110L Pulsed 45 MHz – 2 GHz Test set 8530A 8511A Microwave receiver 45 MHz – 26.5 GHz Frequency converter 45 MHz – 50 GHz Frequency converter mmWave Test set controller Determined by test set E8363B with Opt. 014 33 – 50 GHz Test set module 40 – 60 GHz Test set module 50 – 75 GHz Test set module 75 – 110 GHz Test set module RF Sources E8364B or OML head E8361A or OML head N5250A or OML head N5250A or OML head 8511B 85105A Q85104A U85104A V85104A W85104A 8360 Series E8364B with Opt 014 N5260A 10 MHz – 40 GHz with configurable test set 10 MHz – 50 GHz with configurable test set mmWave test set and external hardware 10 MHz – 50 GHz 10 MHz – 67 GHz 10 MHz – 110 GHz 10 MHz – 110 GHz None required Antenna Measurements with PNA Rev. 9-1-2006 Slide 66 This table shows Agilent’s legacy antenna system components and the recommended PNA replacement solutions. Many of these replacements require power level adjustments and software changes to your configuration. 66 Typical 8530A RCS Configuration /B 1A 1 85 ng i s U Antenna Measurements with PNA Rev. 9-1-2006 Slide 67 67 Typical 8530A (85301C) Far Field Configuration /B 1A 1 85 ng i s U Antenna Measurements with PNA Rev. 9-1-2006 Slide 68 This configuration is using HPUX worstation to drive 8530A. Customer provided software in HPBASIC to control 8530A and positionner. 8360 series as RF sources driven by 8530 (system GPIB) Concept here is that signal comming from Antenna (DUT) and ref are downconverted to 20 MHz 2 types of measurements. Swept in frequency and fixed position , CW measurement but antenna is moving 68 PNA - RCS migration example Antenna Measurements with PNA Rev. 9-1-2006 Slide 69 In this RCS migration example, you can see that the 8530 Microwave Receiver, 83631B Synthesized Source and 8511 Test Set are replaced by the PNA series network analyzer. Note that the HP-IB extenders are replaced by LAN 69 Typical 8530A (85301B) Far Field Configuration Positioner controller Source antenna Meas Ant. g in Us 9A 30 5 8 8360 series Microwave Source Ref antenna 85320B Positioner GPIB Software 8530A HP 9000 workstation GPIB Extender 85320A GPIB 85309A Test Ref. 8360 series Microwave source GPIB Extenders Antenna Measurements with PNA Rev. 9-1-2006 Slide 70 This configuration is using HPUX worstation to drive 8530A. Customer provided software in HPBASIC to control 8530A and positionner. 8360 series as LO and RF sources driven by 8530 (system GPIB) Concept here is that signal comming from Antenna (DUT) and ref are downconverted to 20 MHz 2 types of measurements. Swept in frequency and fixed position , CW measurement but antenna is moving 70 PNA Far Field configuration with old 8360 Series source Positioner controller 85320A Tes Ant. Source antenna Ref Ant 85320B GPIB Positioner 8360 series Microwave Source 85309A Same Software B A PNA HP 9000 workstation GPIB Extender Test Ref. GPIB-USB GPIB Extenders 8360 series Microwave Source Antenna Measurements with PNA Rev. 9-1-2006 Slide 71 Now this is the new configuration, the only dif is that 8530 is replaced by PNA, all other elements of the system are identical, the hardware but also the software Notice that sources are connected by means of USB-GPIB converter (82357A) So the idea was disconnect GPIB cable and RF connection, remove 8530 from rack and replace by PNA and everything works as before. In reality both are still in the rack (easy compare) Of coures 8530 used from computer but also from PC for manaul meas. Meas and ref connected to detectors input (A and B), might use R1 but source lock problem 71 PNA option H11 Outdoor Configuration with PSG Source antenna Optional amplifier AU T 85320A Test mixer PSG Synthesized source Trigger in Trigger out Measurement automation software LAN LO in Positioner controller Amplifier O/E LO out Fiber Fiber Router/Hub E/O O/E LAN PNA trigger out PNA trigger in 8.33 MHz LAN LAN Positioner Power Supply 85309A 8.33 MHz E/O 85320B Reference mixer GPS sync 10 MHz in/out PNA and PSG Antenna Measurements with PNA Rev. 9-1-2006 Slide 72 The configuration for a PNA in a far-field antenna configuration is as shown here: The configuration is very similar to the existing 85301B systems, with some slight differences. The far-field PNA configuration utilizes the same 85320A/B external mixers, and the 85309A LO/IF distribution unit to provide the first down conversion. However, the first down conversion is to an IF frequency of 8.333 MHz, which is the second IF frequency of the PNA. Utilizing option H11 on the PNA allows direct access to the second down conversion stage in the PNA via rear panel connectors. By utilizing this second IF down conversion technique in the PNA, the noise figure is reduced, which allows achieving the excellent measurement sensitivity. As is the case for all far-field antenna ranges, controlling a remote microwave source across a significant distance is always a concern. This configuration utilizes a PSG microwave source, utilizing TTL handshake triggers between the PNA and the PSG source. With the advent of relatively low-cost fiber optic transducers, this is a technology that could/should be investigated to provide long-distance TTL transmission signals across a far-field antenna range. The frequency stepping speed of a far-field antenna range will be source dependent. There are many different sources which could be utilized. With the PSG source, we measured frequency stepping speeds of between 4-6 mS depending on step sizes. 72 Another Antenna Test Configuration: Dual PNA Speed advantage over PNA & PSG solution Optional amplifier 85320A Test mixer Source antenna 85320B Reference mixer LO in 85309A 8.33 MHz 58503B GPS Receiver LAN 58503B 10 dB attenuators Amplifier 10 MHz reference in Router/Hub LAN PNA trigger in PNA trigger out O/E E/O Fiber Fiber LAN E/O O/E PNA trigger out PNA trigger in RF out PNA with option 014 & H11 Antenna Measurements with PNA Rev. 9-1-2006 Slide 73 This configuration utilize the PNA as transmit source, which takes advantage of PNA sweep speed. 73 PNA Large Scale Remote Mixing Near Field Probe Antenna Measurements with PNA Rev. 9-1-2006 Slide 74 74 Pulsed Antenna Configuration Optional amplifier Source antenna 85320A Test mixer AUT 85320B Reference mixer Measurement automation software LO in 85309A 8.33 MHz GPIB 8.33 MHz Amplifier LAN Positioner Power Supply Positioner controller LO out Measurements: -Frequency coverage 50 GHz - Average, point-in-pulse, and Pulse profiling Antenna Measurements with PNA Rev. 9-1-2006 Slide 75 The configuration for a PNA in a far-field antenna configuration is as shown here: The configuration is very similar to the existing 85301B systems, with some slight differences. The far-field PNA configuration utilizes the same 85320A/B external mixers, and the 85309A LO/IF distribution unit to provide the first down conversion. However, the first down conversion is to an IF frequency of 8.333 MHz, which is the second IF frequency of the PNA. Utilizing option H11 on the PNA allows direct access to the second down conversion stage in the PNA via rear panel connectors. By utilizing this second IF down conversion technique in the PNA, the noise figure is reduced, which allows achieving the excellent measurement sensitivity. As is the case for all far-field antenna ranges, controlling a remote microwave source across a significant distance is always a concern. This configuration utilizes a PSG microwave source, utilizing TTL handshake triggers between the PNA and the PSG source. With the advent of relatively low-cost fiber optic transducers, this is a technology that could/should be investigated to provide long-distance TTL transmission signals across a far-field antenna range. The frequency stepping speed of a far-field antenna range will be source dependent. There are many different sources which could be utilized. With the PSG source, we measured frequency stepping speeds of between 4-6 mS depending on step sizes. 75 Migration Considerations • Remote mixing configurations, using Option H11 – Damage level is much lower with PNA (-27 dBm) • Internal source improves measurement speed • Sensitivity – IF BW setting on the PNA & PNA-L is adjustable • Software will not directly port code from 8510/8530 to PNA En p up fS O d e Lif ort 09 20 Antenna Measurements with PNA Rev. 9-1-2006 Slide 76 When migrating from an 8510/8530 to a PNA, it is important to recognize the differences in power, speed and sensitivity between the analyzers. In remote mixing configurations, using Option H11, the damage level of the PNA is much lower than the 8510/8530. You must assure that the power going into the analyzer does not exceed -27 dBm by placing attenuators between the 85309A and the H11 inputs as discussed earlier. The internal source of the PNA improves the measurement speed over an external source, however, the internal source is not always feasible to use. The IF BW setting on the PNA & PNA-L is adjustable, while it was fixed on the 8510/8530, so sensitivity can be changed by adjusting the IF BW setting. Software will not port directly from 8510/8530 code to PNA code. For fastest remote control of the PNA, the use of COM programming is recommended. Contact your Agilent Applications Engineer for additional assistance with programming. The following examples show conceptually how to migrate from an 8510/8530 to a PNA based antenna system. Since every system is unique, it is not feasible to show every modification necessary for the conversion. 76 PNA Features and Benefits for Antenna Test PNA Replaces 8530A for Antenna Measurements Antenna Test Features Benefits Requirements Sensitivity Speed Flexibility & Accuracy Pulsed Measurements Mixer-based architecture Improve sensitivity Selectable IFBW Trade off sensitivity for speed Options 014, Direct Receiver Access Increase sensitivity Option H11 Best sensitivity when using external mixers (Far field application) Fast data transfers with COM/DCOM Up to 10 times faster than using GPBI interface (8530A) LAN connectivity Built-in 10/100 Mbs LAN interface Four simultaneous test receivers 4 Independent receivers path (simultaneous Co-Pol/Cross-Pol) Option 080, frequency offset Eliminate Phase Lost Option H08, Spectrum Nulling Technique - Internal hardware gates - Average, Point-in-pulse, and Pulsed profile testing Removable hard drive Security Memory clearing & sanitization No security compromise when taking PNA of out secured environment Frequency blanking Antenna Measurements with PNA Rev. 9-1-2006 Slide 77 The PNA analyzer has a mixer-based architecture providing excellent sensitivity. With the PNA series, you have the ability to select from a minimum of 29 different IF bandwidths. This allows you to optimize the sensitivity versus measurement speed tradeoff to fit particular measurement and application requirements. You can maximize sensitivity with remote mixing by adding Option H11, IF Access. This option allows you to use an externally generated 8.33 MHz IF and bypass the PNA’s internal first down converter. Option 014 can also improve sensitivity by about 15 dB by adding reference links that allow you to bypass the coupler. 77 Engineering services for 8510/8530 to PNA series migration Transition Scenario Users migrating 8510 network analyzers to new PNA Series solutions Test Programmers converting automated 8510 network analyzer systems to PNA Series solutions Test Engineers creating a test plan that makes use of the new high performance PNA Series features Recommended Service H7215B-203 R1362A-116 H7215B-204 H7215B-205 R1361A-112 Description PNA Series network analyzer operation training course 8510 to PNA Series Test code conversion service PNA programming using SCPI training course PNA programming using COM training course Network analyzer test plan development service Antenna Measurements with PNA Rev. 9-1-2006 Slide 78 For current users of the 8510 Series of network analyzers who plan to migrate their applications to realize the innovative performance of the PNA Series, Agilent also offers a spectrum of engineering services that provide training, code conversion, and/or test plan design. 78 Agenda 9Overview of antenna applications 9Antenna Measurement Design Considerations 9Migrating from 8510/8530 to PNA ¾Agilent’s Solutions Channel Partners Summary Antenna Measurements with PNA Rev. 9-1-2006 Slide 79 79 Antenna Components Existing, Orderable system components compatible with PNA Accessories Description 85383A Control cable 85383B Expansion cable for 85331A/32A 85384A PIN switch control cable 85309A LO/IF distribution unit 85310A Distributed frequency converter 85320A Test mixer module 85320B Reference mixer module 85330A Multiple channel controller 85331B SP2T absorptive PIN switch, 0.045-50 GHz 85332B SP4T absorptive PIN switch, 0.045-40 GHz 83017A 2-26.5GHz Micriwave Amplier Antenna Measurements with PNA Rev. 9-1-2006 Slide 80 80 Antenna Components Network Analyzers • PNA network analyzers – – – – – Fast data acquisition, excellent sensitivity, wide dynamic range Multiple test channels Accurate 10 MHz to 67 GHz, expandable to 325 GHz Options designed with antenna measurements in mind • PNA-L network analyzers – 300 kHz to 50 GHz – Speed advantages over PNA, but give up sensitivity • ENA network analyzers – 300 kHz to 8.5 GHz – Lowest cost solution Antenna Measurements with PNA Rev. 9-1-2006 Slide 81 The microwave PNA series instruments are integrated vector network analyzers equipped with a built-in S-parameter test set, synthesized sources, hard and floppy disk drives, and an LCD display. They offer fast data acquisition speeds, excellent sensitivity, wide dynamic range, multiple test channels, and frequency agility – without compromising measurement accuracy. Frequency coverage is available from 10 MHz to 110 GHz with extensions to 325 GHz. Options were designed with antenna measurements in mind, such as Option H11, IF Access, and Option 080, Frequency Offset. The PNA-L offers frequency ranges down to 300 kHz, allows wider IF bandwidth settings than the PNA and has speed advantages over the PNA but has slightly less sensitivity. The PNA-L does not have any of the antenna specific options. The ENA is a low cost solution without the antenna specific options, but may be the right solution for your measurement. 81 Antenna Components Sources • Source built into PNA/ENA often sufficient • For external sources: PSG family – 250 kHz to 67 GHz • Millimeter-wave source modules – Extend frequency to 325 GHz Antenna Measurements with PNA Rev. 9-1-2006 Slide 82 The sources built into the PNA are typically sufficient for many antenna measurement systems. External sources may also be used and may be necessary with certain setups. Agilent offers a variety of signal generators with different frequency ranges and output power. 82 Antenna Components Additional Amplifiers • 0.01 to 26.5 GHz: 83006A • 0.045 to 50 GHz: 83051A • 0.5 to 26.5 GHz: 83017A • 2 to 8 GHz: 87415A • 2 to 26.5 GHz: 83018A and 83020A • 2 to 50 GHz: 83050A Antenna Measurements with PNA Rev. 9-1-2006 Slide 83 Agilent has a variety of amplifiers that find applications on antenna and RCS ranges. These amplifiers are small and compact, with high gain and output power. An external power supply is required for these amplifiers. 83 Demo PNA synchronization with PGS Antenna Measurements with PNA Rev. 9-1-2006 Slide 84 Agilent has a variety of amplifiers that find applications on antenna and RCS ranges. These amplifiers are small and compact, with high gain and output power. An external power supply is required for these amplifiers. 84 Agenda 9Overview of antenna applications 9Antenna Measurement Design Considerations 9Migrating from 8510/8530 to PNA 9Agilent’s Solutions Channel Partners ¾Summary Antenna Measurements with PNA Rev. 9-1-2006 Slide 85 85 Complete Antenna Test Solutions Agilent with Partners provide a complete solution http://www.orbitfr.com/ http://www.nearfield.com/ http://www.sysplan.com/ Antenna Measurements with PNA Rev. 9-1-2006 Slide 86 Agilent works with its channel partners to provide a complete antenna test solution. This includes positioner, software, chamber and installation. Agilent instruments, such as PNA's, ENA's, PSG's and accessories, are sold either directly to the end user or through the channel partners. 86 Agilent & Channel Partners Agilent Provides: • RF Instrumentation • World-Wide Service and Support • Applications Experience Channel Partners provide: • Scanner/Positioning System • System Engineering and Integration • Measurement and Analysis Software • Applications Experience Antenna Measurements with PNA Rev. 9-1-2006 Slide 87 Agilent works with its channel partners to provide a complete antenna test solution. This includes positioner, software, chamber and installation. Agilent instruments, such as PNA's, ENA's, PSG's and accessories, are sold either directly to the end user or through the channel partners. 87 Typical Agilent Based System Amplifier AUT Agilent PSG Synthesizer AL-4806 Positioner Controller OFR 442 ORBIT/FR Antenna Measurement Workstation Agilent Performance Network Analyzer (PNA) Antenna Measurements with PNA Rev. 9-1-2006 Farfield Antenna Measurements Slide 88 88 Typical Agilent Based System offer by NSI Antenna Measurements with PNA Rev. 9-1-2006 Slide 89 89 Agenda 9Overview of antenna applications 9Antenna Measurement Design Considerations 9Migrating from 8510/8530 to PNA 9Agilent’s Solutions 9 Channel Partners ¾Summary Antenna Measurements with PNA Rev. 9-1-2006 Slide 90 90 Summary • Designing Antenna Measurement Systems requires attention to many details • Agilent has the components to meet your Antenna measurement needs • Agilent’s channel partners can provide a complete antenna test solution Antenna Measurements with PNA Rev. 9-1-2006 Slide 91 91 Reference Literature Title Lit # Antenna Test Selection Guide 5968-6759E Application Note 1408-15: Using the PNA in Banded Millimeter-wave Measurements, literature number 5989-4089EN 83000A Series Microwave System Amplifiers 5963-5110E 87415A Technical Overview 5091-1358E 87405A Data Sheet 5091-3661E Go to www.agilent.com/find/antenna for more information. Antenna Measurements with PNA Rev. 9-1-2006 Slide 92 92 Visit Our Booth to Learn More Today! www.agilent.com/find/antenna Antenna Measurements with PNA Rev. 9-1-2006 Slide 93 93 Demo Guide Demo PNA synchronization with PGS Antenna Measurements with PNA Rev. 9-1-2006 Slide 94 94 AMTA 2006 Europe Demo Setup (Hardware Setup for Synchronization of PSG &PNA) Connect the PNA and PSG/ESG as shown (without PC) Ref. to R1 input LO RF Test to B input Antenna Measurements with PNA Rev. 9-1-2006 Slide 95 95 1. Setting up PSG: a) Start = 8.5GHz, Stop = 12.GHZ, Number of Point= 101 b) Sweep = Frequency c) Sweep Type = Step d) Sweep repeat = Continuous. e) Sweep trigger = Free run. f) Point trigger = Ext., Neg. g) Manual mode = On. h) Sweep direction to = up. i) Trigger out polarity = Negative. k) Set RF output power = 0dBm. l) Set RF output power = ON. 2. Setting up the PNA: a) Set up the input ratio. 1) Select Trace > Measure > S21 b) Set IF Bandwidth to 10 KHz. 1) Select Sweep > IF Bandwidth. 2) Type in “10 kHz” 3) Click OK. c) Open the Sweep Setup dialogue box. 1) Select Sweep > Sweep Setup. 2) Select Channel “1”. 2) Check Stepped Sweep. 3) Set dwell time to match dwell time in external source. (Usually > 2msec) 4) Click OK. (The dialogue box will close.) Antenna Measurements with PNA Rev. 9-1-2006 Slide 96 96 d) Open the Sweep Type dialog box: 1) Select Sweep > Sweep Type. 2) Select sweep type Linear Frequency. 3) Set Sweep Properties: start = 8.5GHz, stop 12.0GHz, and number of points = 101 (to match external source settings). 4) Click Apply; then OK. e) Open Trigger Dialog box. 1) Next select Sweep > Trigger > Trigger. 2) Set Trigger source to External. 3) Set Trigger scope to Channel. 4) Set Channel Trigger state to “Channel 1” (one). 5) Check Point sweep. 6) Select Continuous. Antenna Measurements with PNA Rev. 9-1-2006 Slide 97 97 7) Next click External Trigger (external trigger dialogue box opens) i ) Set channel trigger delay to “0usec”. ii) Select “Channel 1” (one). iii) Set source to TRIG IN BNC. iv) Set Level/Edge to Negative Edge. v) Check Accept Trigger Before Armed. vi) Check Enable Output. vii) Polarity – select Negative Pulse. viii) Position – select After. x) Click OK, OK f) On the PNA, open Frequency Offset Antenna Measurements with PNA Rev. 9-1-2006 Slide 98 98 h) On the PNA, open IF Switching Configuration. Set IF Input to External 3. Make measurement: a) External source set Manual Sweep Mode to ON. This will set the source to the first frequency in the list. b) PNA select Sweep > Trigger > Hold, and then Sweep > Trigger > Continuous (This places the PNA at the first point in its frequency list.) c) External source change Manual Sweep Mode from ON to OFF This will cause the external source to output a trigger pulse on the rear panel BNC in addition, that pulse will cause the PNA to increment one point in the frequency list. You should now have a trace sweeping relatively flat across the display of the PNA . Antenna Measurements with PNA Rev. 9-1-2006 Slide 99 99