1
99 Washington Street
Melrose, MA 02176
Fax 781-665-0780
TestEquipmentDepot.com
,
HP 8901B
Operation and Calibration Manual
Information for MAJOR changes is also provided for
instruments with serial-number prefixes not listed
in the above range.
Fa
HEWLETT
PACKARD
Saftey Considerations
Model 8901B
SAFETY CONSIDERATIONS
GENERAL
This product and related documentation must be reviewed for familiarization with safety markings and
instructions before operation.
This product is a Safety Class I instrument (provided
with a protective earth terminal).
BEFORE APPLYING POWER
Verify that the product is set to match the available
line voltage and the correct fuse is installed.
SAFETY EARTH GROUND
An uninterruptible safety earth ground must be provided from the main power source to the product input
wiring terminals, power cord, or supplied power cord
set.
SAFETY SYMBOLS
A
Instruction manual symbol: the product will
be marked with t h i s symbol when i t
is necessary for the user t o refer to the instruction
manual (refer t o Table of Contents).
f
Indicates hazardous voltages.
Indicates earth (ground) terminal.
T h e W A R N I N G sign denotes a
h a z a r d . I t calls a t t e n t i o n t o a
procedure, practice, or the like, which, if not correctly
performed or adhered to, could result in personal injury. Do not proceed beyond a WARNING sign until
the indicated conditions are fully understood and met.
The CAUTION sign denotes a hazard. I t calls a t t e n t i o n t o a n
operating procedure, practice, or the like, which, if not
correctly performed or adhered to, could result in damage to or destruction of part or all of the product. Do
not proceed beyond a CAUTION sign until the indicated conditions are fully understood and met.
iv
Any interruption of the protective (grounding) conductor (inside or outside the instrument) or disconnecting the protective earth
terminal will cause a potential shock hazard
that could result in personal injury. (Grounding one conductor of a two conductor outlet
is not sufficient protection).
Whenever it is likely that the protection has
been impaired, the instrument musl be made
inoperative and be secured against any unintended operation.
I f this instrument is to be energized via a n
autotransformer (for voltage reduction) make
sure the common terminal is connected to the
earth terminal of the power source.
Servicing instructions are for use by servicetrained personnel only. To avoid dangerous
electric shock, do not perform any servicing
unless qualified to do so.
Adjustments described in the manual are performed with power supplied to the instrument
while protective covers are removed. Energy
available at many points may, if contacted, result in personal injury.
Capacitors inside the instrument may still be
charged even if the instrument has been disconnected from its source of supply.
For continued protection against fire hazard,
replace the line fuse(s) only with 250V fuse(s)
of the same current rating and type (for example, normal blow, time delay, etc.). Do not use
repaired f u s e s o r s h o r t c i r c u i t e d
fuseholders.
Test Equipment Depot - 800.517.8431 - 99 Washington Street Melrose, MA 02176
FAX 781.665.0780 - TestEquipmentDepot.com
General Information
Model 8901B
MODEL 8901B
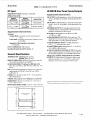
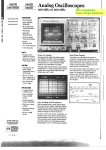
LINE POWER CABLE
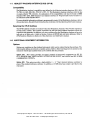
Figure 1-1. HP 8901B Modulation Analyzer and Supplied Accessories
1-0
Model 8901B
General Information
Contact the local Hewlett-Packard Sales and Service office for ordering information.
1-7. HEWLETT-PACKARD INTERFACE BUS (HP-IB)
Cornpatibility
The Modulation Analyzer’s capabilities are defmed by the following interface functions: SH1, AH1,
T5, TEO, L3, LEO, SR1, RL1, PPO, DC1, DT1,CO. The Modulation Analyzer interfaces with the bus
via open-collectorTTL circuitry. An explanation of the compatibility code may be found in IEEE
Standard 488- 1978, IEEE Standard and Digital Interface for Programmable Instrumentation or
the identical ANSI Standard MC 1.1.
For more detailed informationrelating to programmable control of the Modulation Analyzer, refer t o
Remote Operation, Hewlett-Packard Interface Bus in Section 3 of this Operating Information manual.
Selecting the HP-IB Address
The HP-IB address switches are located within the Modulation Analyzer. The switches represent a
five-bit binary number. This number represents the talk and listen address characters which the
controller must generate. In addition, two more switches allow the Modulation Analyzer to be set t o
talk only or t o listen only. A table in Section 2 shows all HP-IB talk and listen addresses. Refer to
HP-IB Address Selection in Section 2 of this Operation and Calibration manual.
1-8. ADDITIONAL EQUIPMENT INFORMATION
0ptions
Options are variations on the standard instrument which can be ordered during the purchase. The
following list defines all currently available options. Refer to Electrical Equipment Available in this
section for retrofit part numbers that can be ordered after the purchase.
Option 001. This option provides rear-panel (instead of front-panel) connections for RF INPUT, SENSOR input, MODULATION OUTPUT/AUDIO INPUT, and AMYFM and RF POWER
CALIBRATION OUTPUTS.
Option 002. This option provides a high-stability (1 x 10-g/day)internal reference oscillator in
place of the standard reference oscillator. In addition, a 10 MHz time base output is provided on the
rear panel.
rev.28MA Y93
1-3
Test Equipment Depot - 800.517.8431 - 99 Washington Street Melrose, MA 02176
FAX 781.665.0780 - TestEquipmentDepot.com
General Information
Model 8901B
Option 003. This option provides both an output for the internal local oscillator signal and an input
for an external local oscillator signal. Both connections are located on the rear panel. (Thisoutput is
provided automatically with option 030 series instruments.)
Option 004. This option allows operation at line frequencies ranging from 48 to 400 Hz. Operation
at frequencies greater than 66 Hz is restricted to less than 126.5 Vac line input.
Option 030. The High Selectivity Measurement option provides the capability to measure singlesideband carrier noise (AM or phase) quickly and accurately up to 1.3 GHz with an external LO. (An
output for the internal local oscillator and an input for an external local oscillator signal is provided
with these options.) This option is ordered with one of the following filter options:
Option 032. This option provides a 12.5 kHz adjacent channel filter.
Option 033. This option provides a 25 kHz adjacent channel filter.
Option 035. This option provides a 30 kHz (Cellular Radio) alternate channel filter.
Option 037. This option provides a carrier noise filter.
Options 907-909. These options are described in Mechanical Equipment Available.
Option 910. This option provides an extra copy of both the Operation and Calibration Manual and
the Service Manual.
Accessories Supplied
The Accessories Supplied are pieces of equipment which are shipped automatically with every
Modulation Analyzer.
Line Power Cable. The line power cable may be supplied in several plug configurations, depending
on the destination of the original shipment. Refer to Power Cables in Section 2 of this Operating
Information manual.
Fuses. F b e s with a 2.5A rating for 115 Vac (HP 2110-0083)and a 1.5A rating for 230 Vac (HP
2110-0043)are supplied. One fuse is factory installed according to the voltage available in the country
of original destination. Refer to Line Voltage and h e Selection in Section 2 of this Operating
Information manual.
Electrical Equipment Available
This equipment is available to be ordered for the Modulation Analyzer after the time of sale.
HP-IB Controller. The Modulation Analyzer has an HP-IB interface and can be used with any HP-IB
compatible computing controller or computer for automatic systems applications.
Sensor Module. The HP 11722A and 11792A Sensor Modules enable you to characterize a signal
using a single input connector. Switching back and forth between the Modulation Analyzer’s SENSOR
input and RF INPUT connectors happens automatically with these modules (which contain an internal
switch). The H P 11722A covers the Erequency range 100 kHz to 2.6 GHz; the H P 11792A covers the
range 50 MHz to 26.5 GHz and is intended for use with the H P 11793A Down Converter. Special care
is taken with each sensor module to minimize input SWR and resulting errors. A low SWR attenuator
isolates the power sensor from the source-under-test, reducing mismatch. Microwave hardware and a
selected RF input cable further improve SWR and insertion loss.
1-4
Model 8901B
General Information
Down Converter. The HP 11793A Down Converter, when used with a suitable local oscillator, extends
the useful range of the Modulation Analyzer into the microwave region. Provisions have been made in
the Modulation Analyzer to account for the frequency of the local oscillator and provide direct display
of the frequency of the microwave input signal.
Test Source. The H P 11715A AMFM Test Source produces extremely linear AM and FM at
high rates as well as a low-noise CW signal. This source is required for performance testing and
adjusting the Modulation Analyzer; however, it is an excellent stand-alone instrument for generating
very low-distortion FM in the broadcast band.
Service Accessory Kit. A Service Accessory Kit (HP 08901-60287) is available which contains
accessories (such as extender boards and cables) useful in servicing the Modulation Analyzer.
Front-to-Rear-Panel Connectors Retrofit Kit (Option 001). This kit contains all the necessary
components and full instructions for converting front-panel connections to rear-panel connections.
Order HP part number 08901-60282.
Rear-to-Front-Panel Connectors Retrofit Kit (Standard). This kit contains all the necessary
components and full instructions for converting Option 001 instruments with rear-panel connections
to instruments with front-panel connections. Order HP part number 08901-60283.
High-Stability, Internal-Reference Retrofit Kit (Option 002). This kit contains all the necessary
components and full instructions for installation of the high-stability, internal-reference oscillator.
Order HP part number 08901-60281.
Rear-Panel Local Oscillator Connections Retrofit Kit (Option 003). This kit contains all the
necessary components and full instructions for installation of rear-panel local oscillator connections.
Order HP part number 08901-60280. (These connections are already included in all Option 030
Series instruments.)
Conversion to 400 Hz Line Operation. Modulation Analyzers not equipped to operate at line power
frequencies greater than 66 Hz may be converted to operate at line frequencies from 48 to 440 Hz.
However, operation at line frequencies greater than 66 Hz will be restricted to line voltages less than
or equal to 126.5 Vac. To convert to 400 Hz operation, order H P part number 08901-60095. After
installation, performance will be identical to the H P 8901B Option 004.
Mechanical Equipment Available
The following kits might have been ordered and received with the Modulation Analyzer as options. If
they were not ordered with the original shipment and are now desired, they can be ordered from the
nearest Hewlett-Packard office using the appropriate part number.
Front-Handle Kit (Option 907). Ease of handling is increased with the front-panel handles. Order H P
part number 5061-9690 for the basic kit and 2190-0048 for lockwashers (8 required).
Rack-Flange Kit (Option 908). The Modulation Analyzer can be solidly mounted to the instrument
rack using the flange kit. Order HP part number 5061-9678.
Rack-Flange and Front-Handle Combination Kit (Option 909). This is not a front-handle kit and
a rack-flange kit packaged together; it is composed of a unique part which combines both functions.
Order HP part number 5061-9684 for the basic kit and 2190-9609 for lockwashers (8 required).
Test Equipment Depot - 800.517.8431 - 99 Washington Street Melrose, MA 02176
FAX 781.665.0780 - TestEquipmentDepot.com
1-5
General Information
Model 8901B
Chassis Slide-Mount Kit. This kit is extremely useful when the Modulation Analyzer is rack
mounted. Access to internal circuits and components or the rear panel is possible without removing
the instrument from the rack. Order H P part number 1494-0017 for 432 mm (17 in.) fixed slides. (To
order adapters for non-HP rack enclosures, use HP part number 1494-0023.)
Chassis-Tilt, Slide-Mount Kit. This kit is the same as the Chassis Slide Mount Kit above except it
also allows the tilting of the instrument up or down 90". Order HP part number 1494-0025 for 432 mm
(17 in.) tilting slides. To order adapters for non-HP rack enclosures, use HP part number 1494-0023.
1-9. DESCRIPTION OF THE MODULATION ANALYZER
The H P Model 8901B Modulation Analyzer is a complete measurement system for accurately
characterizing signals in the 150 kHz to 1300 MHz frequency range. It combines the capabilities
of four separate instruments in its ability to measure RF power, carrier frequency, modulation and
the characteristics of the demodulated audio signal (as well as those of external audio signals). This
flexibility allows you to make those measurements most commonly needed to totally characterize
a signal.
The Modulation Analyzer can measure an RF signal's frequency, frequency drift, power level
(broadband, and off-channel), amplitude modulation (AM), frequency modulation (FM), phase
modulation (@M),and AM and FM noise components. It recovers the modulating signal and can
measure the audio signal's frequency and distortion.
The Modulation Analyzer is fully automatic and all major measurements can be made by pushing a
single key. The Modulation Analyzer's large digital display shows measurement results with excellent
resolution and is easy to read. All Modulation Analyzer operations can be controlled and all
measurement results can be transferred via the Hewlett-Packard Interface Bus (HP-IB). (HP-IB is
Hewlett-Packard's implementation of IEEE Standard 488 and ANSI Standard MC1.l.)
RF Power Measurements
The Modulation Analyzer delivers the accuracy and resolution of a high-performance power meter.
The HP 8901B, with the H P 11722A Sensor Module, measures power from +30 dBm to -20 dBm
at frequencies from 100 kHz to 2.6 GHz. (Refer to Table 1-1, Specifications, for specified frequencies
limits using other power sensors. The H P 890lB also accepts all H P 8480 series power sensors for
extended measurement capability.)
Input Power Protection. The Modulation Analyzer is equipped with input power protection to prevent
damage from the accidental application of excessive power. (This is a common cause of damage in
equipment used to measure transmitters.) The Modulation Analyzer is tested for inputs up to 2W.
Protection is provided by limiting diodes and an RF relay. When excessive power is applied, the relay
opens and protects sensitive components, and the Modulation Analyzer displays an error message. The
circuit automatically resets whenever a key is depressed.
RF Power Calibration. RF Power Calibration is accomplished with the 50 MHz, 1 mW standard
available in every instrument. Also, the front-panel ZERO function enables you to zero the sensor
module without removing it from the source-under-test. After the ZERO key is pressed, the new zero
offsets are stored automatically.
RF Power Calibration Factors. RF Power Calibration Factors can be entered from the power sensor
into the Modulation Analyzer's non-volatile memory. The instrument automatically compensates for
the power sensor's efficiency and mismatch loss at each frequency.
1-6
Model 8901B
General Information
High Selectivity Measurements. Options 030-037 add selective power measurement capability to the
HP 8901B Modulation Analyzer. Used with a low-noise external LO, the HP 8901B performs fast,
accurate single-sideband (SSB) carrier noise measurements to 1.4 GHz.
RF Frequency Measurements
In automatic operation, the Modulation Analyzer has the performance of a high-quality, 150 kHz to
1300 MHz frequency counter. The frequency counter automatically adjusts itself as the input level
changes. There is no need to manually set or adjust the input attenuator. Because the Modulation
Analyzer is usually used to measure modulated signals, its frequency counter also accurately measures
signals with significant levels of AM.
Modulation Measurements
The Modulation Analyzer has extremely low internal noise. Incidental AM, FM, and QM can be
measured on a wide range of simple and complex modulated signals. To complement its modulation
measurement capability, the HP 8901B characterizes audio signal level, frequency, and distortion.
(These features are also available for external audio signals.)
Filters, De-emphasis Networks and Modulation Calibrators
Post-Detection Audio Filters. The Modulation Analyzer has two high-pass and three low-pass postdetection audio filters for filtering the recovered modulation. These filters can be selected individually
or in combination. Their cutoff frequencies have been chosen to match those needed for applications
such as transmitter or signal generator testing. The >20 kHz filter is a Bessel filter. It minimizes
overshoot for square-wave modulation so that this type of modulating waveform can also be accurately
measured.
De-Emphasis Networks. The Modulation Analyzer contains four de-emphasis networks that can be
used in addition to the audio filters. These are the ones commonly used in FM communications-25,
50, 75, and 750 ps. When selected, the de-emphasis networks always affect the demodulated output.
You can select whether the de-emphasis network affects the deviation measured. The ability to select
either the actual or “de-emphasized deviation” increases the usefulness of the Modulation Analyzer in
many applications.
Modulation Calibrators. One of the most difficult problems involved in making very accurate
measurements of AM depth or FM deviation is generating a precisely modulated signal to use as a
calibration standard. In all instruments, a precise AM and FM modulation standard is included.
When the output of the calibrator is connected to the Modulation Analyzer’s input, the amount
of modulation is measured to create a calibration factor. The calibration factor can be used to
automatically compensate all subsequent measurements. The calibration factor is the ratio of the
measured modulation to the internally-computed modulation of the calibrator, expressed in 7%.
Additional Features
Tuning Features. In automatic operation, the Modulation Analyzer automatically tunes to the input
signal and measures it.
In manual operation, you can determine the frequency to which the Modulation Analyzer tunes.
Entering the approximate frequency on the keyboard causes all but very close interfering signals to be
eliminated. This allows the Modulation Analyzer to selectively measure signals other ‘than the largest.
A track mode feature enables you to track a signal, as it changes frequency, from either automatic or
manual tune operation.
Test Equipment Depot - 800.517.8431 - 99 Washington Street Melrose, MA 02176
FAX 781.665.0780 - TestEquipmentDepot.com
1-7
General Information
Model 8901B
Store and Recall functions. These functions enable you to store eight complete instrument settings
in non-volatile memory and recall them as needed.
Display Flexibility. The Modulation Analyzer offers numerous data-display formats. For example, RF
power can be displayed in watts, a m , V, dBV, mV, dBmV, pV, and dBpV. Use the RATIO and
LOG/LIN keys to display results in dB or 7% relative to either a measured value or a value entered from
the keyboard. These features eliminate the need for recalculating measurement results.
Special Functions
The Modulation Analyzer can do more than is apparent from the front panel. Many functions are
accessed using the numeric keys and a Special Function key. The Special h c t i o n s provide access
to other measurements and functions, manual control of instrument functions, instrument operation
verification, and service aids.
All instrument functions not set using these Special Functions remain in the automatic mode. This
allows you to select any combination of manual or automatic operations. By depressing the special
key alone, the display shows ten digits that indicate which functions are in automatic and the state of
those manually set.
There are also numerous Special Functions that can be used in verifying that the instrument and its
various sections are operating properly. These, along with service special functions, make diagnosing
and repairing the Modulation Analyzer faster and easier.
Those Special Functions that are most commonly used in operating the Modulation Analyzer are
described on the Special hnction Information pull-out card under the front panel.
Extending Measurement Range
Operation to 42 GHz is accomplished when an external LO and mixer are included in the measurement
path. This system then functions as a single instrument making microwave modulation, frequency,
power, and level measurements. You control operation from the Modulation Analyzer's front panel.
When the external LO frequency must be changed, the Modulation Analyzer requests an external
controller to make the change. A separate, non-volatile calibration factor table is available in Frequency
Offset mode for your microwave power sensor.
Programmability
The Modulation Analyzer is completely programmable via the Hewlett-Packard Interface Bus (HPIB). This, coupled with the diversity of measurements the Modulation Analyzer can make, the speed
with which these measurements can be made, and the flexibility of the Special b c t i o n s , make the
instrument ideal for systems applications. In many instances it can reduce the number of instruments
in a system, speed measurements, reduce complexity and improve accuracy.
When the Modulation Analyzer is in remote, the front-panel annunciators make it very easy to
determine the state the instrument is in; whether it is in the talk, listen, or service request state.
1-10. PRINCIPLES OF OPERATION USING A SIMPLIFIED BLOCK DIAGRAM
The Modulation Analyzer is a calibrated, superheterodyne receiver, which converts the incoming
signal to a fixed, intermediate frequency (IF), which is then demodulated. As in a radio receiver,
the Modulation Analyzer contains an RF amplifier, a local oscillator (LO), a mixer, an IF' amplifier
and bandpass filter, a demodulator (detector or discriminator), and audio filters (tone controls). The
Modulation Analyzer, however, contains additional features which make it much more versatile:
automatic tuning,
selectable measurement mode: signal frequency, power level, or modulation (AM, FM, or Phase
Modulation (@MI),
selectable audio detector (peak, average, or rms responding),
audio counter,
1-8
Model 8901B
General Information
0
0
0
audio distortion analyzer,
measurement calibrators (AM, FM, or power level), and
HP-IB programmability.
The entire operation of the instrument is governed by a microprocessor-based Controller. The Controller
sets up the instrument at turnon, interprets keyboard entries, executes changes in internal hardware,
and displays measurement results and error messages. The computing capability of the Controller is
also used to simplify circuit operation. For example, it forms the last stage of the Counter, calculates
the AM or FM generated by the AM and FM Calibrators, and converts measurement results into ratios
(in % or dB).The Controller also contains routines useful for servicing the instrument.
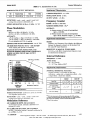
RF Circuitry
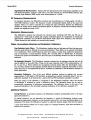
The RF input signal normally enters an external Sensor Module such as an H P 11722A. (See
Figure 1-2.) For all measurements except RF Power, the Sensor Module routes the signal to the FW
input connector of the Modulation Analyzer. For the RF Power measurement, the input signal passes
directly into the Power Sensor, which converts the RF power absorbed by the RF Power Sensor into
a low-frequency, chopped, ac voltage whose amplitude is proportional to the average RF power. The
Power Meter amplifies the chopped signal and converts it to a dc voltage which is then measured by the
voltmeter. (The voltmeter includes the Audio Peak Detector, Audio Average Detector, Voltage-to-Time
Converter, and Counter.) The calibration of the Power Meter can be verified by connecting the Sensor
Module to the CALIBRATION RF POWER OUTPUT connector on the front panel. (The 50 MHz
Power Reference Oscillator is an accurate 1 mW reference.)
The Power Sensor is unprotected against and is easily damaged by
sudden, large overloads. Refer to Table 1-1 under RF Power, Supplemental
Characteristics, RF Power Ranges of HP 8901B Modulation Analyzer with
HP 11722A Sensor Module, for information on maximum operating lemls.
When the RF Peak Detector senses that the input signal level exceeds lW, it opens the Overpower
Relay. This is done without intervention of the Controller. The output from the RF Peak Detector, read
by the voltmeter, is used to set the Input Attenuator to optimize the level applied to the Input Mixer.
The Input Mixer converts the input signal to the intermediate frequency (IF). For frequencies greater
than 10 MHz, the IF is 1.5 MHz with the Local Oscillator (LO) tuned 1.5 MHz above the input
frequency; an IF of 455 kHz can be manually selected for this frequency range. The 455 kHz IF is
selected automatically for input signals between 2.5 MHz and 10 MHz. Below 2.5 MHz, the input
passes directly through the Input Mixer without down-conversion.
NOTE
For the input signal to pass through the Input Mixer without downconversion, the LO must still be present to turn the mixer diodes on. A n
LO frequency of 101.5 MHz is arbitrarily used. Thus the instrument will
respond to input frequencies of 100 or 103 MHz as well as frequencies
between 150 kHz and 2.5 MHz.
The instrument can be manually tuned to a desired signal even in the presence of larger signals, although
filtering may be necessary since low-frequency signals pass directly into the IF. The RF High-Pass
Filter can be inserted (via a Special Function) in the RF path for this purpose.
To measure the input frequency, the Counter measures the frequency of the LO and the frequency
of the IF from the output of the IF Amplifier and Filter. The Controller computes and displays the
difference between the two frequencies. For input frequencies below 2.5 MHz, only the IF is counted,
which equals the input frequency.
Test Equipment Depot - 800.517.8431 - 99 Washington Street Melrose, MA 02176
FAX 781.665.0780 - TestEquipmentDepot.com
1-9
Model 8901B
General Information
LO Circuitry
The LO drives the high-level port of the Input Mixer and is one of several inputs to the Counter. The
LO has four main modes of operation:
a tuning to the frequency required to down-convert a signal whose frequency is entered from the
keyboard (manual tune mode),
a automatically searching for an input signal, then tuning the LO to the frequency required to
down-convert the signal (automatic tune mode),
a automatically searching for an input signal, then configuring the LO in a feedback loop that
automatically tracks the signal (automatic tune track mode), and
a tuning to the frequency required to down-convert a signal whose frequency is entered from the
keyboard, then configuring the LO in a feedback loop that automatically tracks the input signal
(manual tune track mode).
The manual tune track mode is useful when it is desired to follow an unstable signal in the presence
of other signals. The non-track modes are used when the LO noise (residual FM) must be minimized.
IF Circuitry
The gain of the IF Amplifier is fixed. The IF Filters determine the frequency response of the IF. When
the 1.5 MHz IF is selected, the IF filter consists of a 150 kHz to 2.5 MHz bandpass filter (with a
nominal center frequency of 1.5 MHz). When the 455 kHz IF is selected, the IF filter is the Wide
455 kHz Bandpass Filter (with a bandwidth of 200 kHz).
In instruments with Option Series 030, the IF signal is further processed by the Channel Filters (which
also include a precision, variable-gain amplifier) and detected by the IF RMS Detector. The Channel
Filters set the IF bandwidth and gain for the Selective Power measurement. The measurement is made
by entering a series of Special Functions which establish an IF reference in the center of the Channel
Filter, then allow the relative IF level to be displayed as the IF frequency is detuned by a pre-determined
offset.
Audio Circuitry
The modulation on the IF is demodulated by either the AM or the FM Demodulator. Phase modulation
is recovered by integrating the demodulated FM in the Audio Filters and Gain Control circuitry.
The demodulated signal is amplified and filtered in the Audio Filters and Gain Control circuitry. The
filters are selected from the front panel, and for FM, the filtering may also include de-emphasis. The
processed signal is passed to the front-panel MODULATION OUTPUT/AUDIO INPUT connector
and the voltmeter.
The audio signal from the Audio Filters and Gain Control is converted to a dc voltage by the Audio
Peak Detector, the Audio Average Detector or the Audio RMS detector. The Audio Average and RMS
Detectors are used primarily for measuring noise. The output from the detectors is routed into the
Voltage-to-Time Converter.
The Voltage-to-Time Converter within the voltmeter converts the dc input into a time interyal. During
the interval, the 10 MHz Time Base Reference is counted by the Counter, and the resultant count
represents the dc voltage. Other inputs to the voltmeter, which are not shown, include outputs from
an audio level detector and the AM calibrator.
The Distortion Analyzer measures the distortion of either the internal demodulated signal or an audio
signal applied externally to the MODULATION OUTPUT/AUDIO INPUT connector. The frequency
of the input signal must be either 1 kHz or 400 Hz. The distortion on the signal is determined by
measuring the amplitude of the signal before and after a notch filter that is set to 1kHz or 400 Hz.The
two ac signals are converted to dc by a the Audio RMS Detector and then measured by the voltmeter.
Distortion is computed as the ratio of the voltage out of the notch filter to the voltage into the filter.
(The Audio RMS Detector can also be used to measure the demodulated AM, FM, or OM internally
or the ac level of an external audio signal applied to the MODULATION OUTPUT/AUDIO INPUT
connector.)
1-11
General Information
Model 8901B
The frequency of the audio signal at the MODULATION OUTPUT/AUDIO INPUT connector,
whether internal or external, is measured by a reciprocal-type Audio Counter. In the Audio Counter,
the input signal is used to gate the 10 MHz Time Base Reference into the main Counter. (This gating
function is also used by the Voltage-to-Time Converter.) The number of time base pulses received
during the count is read by the Controller which computes and displays the signal frequency.
The AM and FM Calibrators provide a nominal 10.1 MHz signal with a precisely known amount of
AM or FM. When this signal is applied to the instrument’s RF INPUT connector (either directly
or via the Sensor Module), the modulation is measured and the calibration factor of the AM or FM
Demodulator is computed and displayed. Related front-panel functions are automatically set for proper
demodulation of the calibrator signal.
P
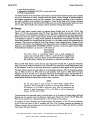
(a) BASEBAND SIGNAL
1.5
1.o
0.5
0
I
(b) AMPLITUDE MODULATED CARRIER
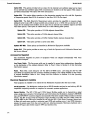
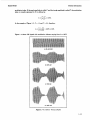
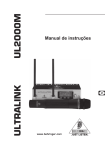
Figure 1-3. A Baseband Signal and the Corresponding Amplitude Modulated Carrier
1-1 1. MODULATION BASICS
The Modulation Analyzer can demodulate and measure three types of modulation: amplitude
modulation (AM), frequency modulation (FM), and phase modulation (@M).In general, modulation is
that characteristic of a signal which conveys the information. A signal without modulation is said to be a
continuous-wave (CW) signal. CW signals contain two information-carryingparameters: amplitude and
frequency. These two parameters, however, are static (time invariant). Consequently, the information
conveyed by them is scant-you know only that a signal is present at a certain frequency. When one
or both of these parameters is altered as a function of time, the signal is said to be modulated.
The RF signal which is modulated is called the carrier. The modulating signal is referred to as the
baseband signal and can be of any arbitrary form (for example, voice, tone, noise). Demodulation is
the process of recovering the baseband signal from the modulated carrier. The Modulation Analyzer
can measure the modulation on carriers in the range of 150 kHz to 1300 MHz. Measurement accuracy
is specified for modulation rates generally between 20 Hz and 100 kHz. The demodulated signal is
present at the MODULATION OUTPUT connector.
Amplitude Modulation
As the name implies, a carrier is amplitude modulated when its amplitude is varied as a function of
time. Figure 1-3 shows a carrier with amplitude modulation and, for reference, also shows the baseband
signal. As you can see, the tips of the carrier trace out a waveform that resembles the baseband signal.
This trace is called the envelope. The envelope rises to a maximum called the peak and drops to a
minimum called the trough. A quantity which describes the amount of AM or the AM depth is the
1-12
Test Equipment Depot - 800.517.8431 - 99 Washington Street Melrose, MA 02176
FAX 781.665.0780 - TestEquipmentDepot.com
Model 8901B
General Information
modulation index. If the peak amplitude is called P and the trough amplitude is called T, the modulation
index rn (usually expressed in %) is defined as
m=- P - T x 100%.
+
In the example of Figure 1-3, P = 1.5 and T = 0.5; therefore,
m=
1.5 - 0.5
x 100% = 50%.
1.5 + 0.5
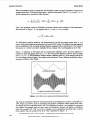
Figure 1-4 shows AM signals with modulation indexes varying from 0 to 100%.
(a) 0% AM (CW)
(b) 30% AM
(c) 70% AM
(d) 100% AM
Figure 1-4. AM for Various Depths
1-13
General Information
Model 8901B
When the baseband signal is symmetrical, the modulation index can also be expressed in terms of the
average carrier level, A , and the envelope peak, T , relative to the carrier. Then P = A + r , and T = A- r ,
and the expression for modulation index becomes
m=
27
r
A+r-A+r
x 100% = - x 100%= - x 100%.
A+r+A-r
2A
A
This is the expression which the Modulation Analyzer evaluates when making an AM measurement,
Referring back to Figure 1-3, it is apparent that A = 1 and T = 0.5 so, as before
m=0.5 x 100% = 50%
1
The Modulation Analyzer makes an AM measurement by forcing the average carrier level, A, to a
known, fixed level by means of an automatic level control (ALC) circuit. The signal is then demodulated,
and the amplitude of the recovered baseband signal is measured with a peak detector. The output of
the detector is r , which is (in effect) multiplied by the constant 1OO/A and displayed as the 9% AM.
I
r
(a) BASEBAND SIGNAL
I
(b) AMPLITUDE MODULATED CARRIER
Figure 1-5. AM with an Asymmetrical Baseband Signal
The range of modulation indexes for AM measurements by the Modulation Analyzer is essentially 0 to
100%. There are, however, types of modulation that produce modulation indexes greater than 100%.
An example of such is suppressed-carrier AM. The Modulation Analyzer is not intended for measuring
such signals. Nevertheless, there are cases, when the Modulation Analyzer will display a modulation
index that exceeds 100%. This can occur, for example, on an asymmetrical waveform where a narrow
peak is greater than the average carrier level. This is illustrated in Figure 1-6.
1-14
Test Equipment Depot - 800.517.8431 - 99 Washington Street Melrose, MA 02176
FAX 781.665.0780 - TestEquipmentDepot.com
Model 8901B
General Information
I
I
Figure 1-6. AM with Modulation Exceeding 100% as Measured by the PEAK+ Detector
Exponential Modulation
Exponential (or angular) modulation is the generic name given to modulation in which the frequency
or phase of the carrier is varied. Frequency and phase modulation are very closely related. In fact, it
is impossible to tell whether the signal was produced by a frequency modulator or phase modulator by
analyzing the received signal unless specific information about the baseband signal is given.
It is certainly true to say that a signal is frequency modulated when the modulation is generated by
a frequency modulator. A varactor diode across the tank circuit of an LC oscillator will produce FM
when the varactor bias is varied. It is also true that a signal is phase modulated when the modulation
is generated by a phase modulator. A varactor diode across an RF filter will produce QM when the
varactor bias is varied. (It is assumed that the carrier is on the slope of the filter and that the filter is
driven from a well-buffered carrier source. This modulator simultaneously produces AM.)
The signal from both modulators will show readings on the Modulation Analyzer when in both the
FM and QM measurement modes. When in FM, the quantity being measured is the peak frequency
deviation, which is the maximum frequency excursion from the average carrier frequency. When
measuring QM, the peak phase deviation is measured, which is the maximum phase excursion from
the average carrier phase. Phase and frequency have the relationship that phase is the integral of the
frequency or frequency is the derivative of the phase. In fact, the Modulation Analyzer demodulates
QM by integrating the demodulated FM.
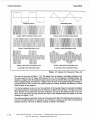
This relationship is most easily visualized by some examples. Look at Figure 1-7. The first baseband
signal shown is a square wave. The three waveforms under it are the result of applying this signal to
an FM, QM, and AM modulator respectively. (The AM waveform is included only for reference.) It is
assumed that the phase modulator doesn't produce AM-only QM. The FM waveform is as expected.
The frequency goes up on the positive peak of the baseband signal and down on the negative peak. The
phase modulated signal, however, is peculiar. The frequency is generally constant throughout except for
a discontinuity where the baseband signal switches amplitude. The waveform of the figure was contrived
so that a 180" phase shift occurred exactly at a zero crossing of the carrier. In general, a discontinuity
will occur when the baseband signal switches amplitude, but the phase shift is not necessarily 180" and
does not need to occur at a zero crossing of the carrier. Mathematically, the derivative of a square wave
is the constant zero except for a positive spike (impulse) where the baseband signal switches positive
and a negative spike where the square wave switches negative.
Now look at the triangle wave. The frequency modulator produces a continually increasing frequency as
the baseband signal slopes upward and a continually decreasing frequency as the signal slopes downward.
The phase modulator produces a signal that resembles the signal from the frequency modulator for the
square wave baseband signal. This is because the derivative of a constant slope is a constant. When the
slope is positive, the phase shift is continually increasing, thus producing a uniform frequency shift
upward. When the slope is negative, the phase shift is continually decreasing and produces a downward
frequency shift. For the triangle wave baseband signal, the shift in frequency when the slope changes
is proportional to the change in slope.
1-15
General Information
Model 8901B
u u
BASEBAND SIGNAL
BASEBAND SIGNAL
SIGNAL FROM FREQUENCY M 0 D U LATO R
SIGNAL F R O M F REQU ENCY MO DU LATO R
SIGNAL FROM PHASE MODULATOR
SIGNAL FROM PHASE MOOULATOR
SIGNAL FROM AMPLITUDE MODULATOR
SIGNAL FROM AMPLITUDE MODULATOR
(a) SQUARE WAVE BASEBAND SIGNAL
(b) TRIANGLE WAVE BASEBAND SIGNAL
Figure 1-7. Signals from Requency, Phase, and
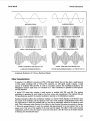
Now note the sine wave of Figure 1-7(c). The signals from the frequency and phase modulators look
the same except for the 90' phase shift between the two. For the frequency modulated signal, the
frequency is highest when the baseband signal is most positive and lowest when most negative. For the
phase modulated signal, the frequency is highest when the slope of the baseband signal is steepest in
a positive direction. This occurs at the positive-going zero crossing. Similarly, the frequency is lowest
when the slope is most negative.
If in the last example, the rate, but not the amplitude, of the baseband signal is increased, the highest
and lowest frequencies of the signal from the frequency modulator stay the same-they just occur more
often. However, for the signal from the phase modulator, not only do the frequency peaks occur more
often, but the excursions are large because the slopes of the baseband signal are steeper at the zero
crossings. See Figure 1-7(d).
1-16
The maximum frequency deviation which can be measured is 400 kHz. The maximum phase deviation is
TestorEquipment
Depot by
- 800.517.8431
- 99
Washington
Melrose,
MA AM,
02176
400 rad
400 kHz divided
the modulation
rate,
whicheverStreet
is smaller.
As with
an asymmetrical
baseband waveform
will781.665.0780
result in different
readings in PEAK+ than PEAK-.
FAX
- TestEquipmentDepot.com
Model 8901B
General Information
W
W
W
BASEBAND SIGNAL
BASEBAND SIGNAL
SIGNAL FROM FREQUENCY MODULATOR
SIGNAL FROM FREQUENCY MODULATOR
SIGNAL FROM PHASE MODULATOR
SIGNAL FROM PHASE MODULATOR
SIGNAL FROM AMPLITUDE MODULATOR
SIGNAL FROM AMPLITUDE MODULATOR
(c) SINE WAVE BASEBAND SIGNAL
(d) SINE WAVE BASEBAND SIGNAL: 3/2 THE RATE OF (c)
~~
Amplitude Modulators for Various Baseband Signals
Other Considerations
In practice, it is difficult to produce an FM or cPM signal which does not also have a small amount
of AM-called incidental AM or AM-on-FM. Likewise, an AM signal usually contains a small
amount of incidental FM and cPM. In order to accurately measure this incidental modulation, the
Modulation Analyzer itself must not contribute to it. This contribution is specified as AM rejection
and FM rejection.
A typical CW signal also contains a small amount of residual AM, FM, and ckM. The residual
modulation is generated by such things as line hum, noise, and microphonics. The residual AM and
FM specifications quantify the residual modulation internal to the Modulation Analyzer.
Residual modulation affects the modulation readings in a manner which depends on the detector used,
the nature of the residuals, and the signal-to-noise ratio. If the residual is predominately noise, when
the peak detector is used, the residuals add in a way that is statistically related to the signal-to-noise
ratio. This is discussed under Residual Noise Effectsin the Detailed Operating Instructions in Section
3. When the average detector is used, the residuals add approximately in an rms manner, that is, the
square root of the sum of the squares of the noise and the signal. The effect of this noise becomes
insignificant, however, when the signal-to-noiseratio rises above a few dB.Noise can be further reduced
by filtering the demodulated signal.
1-17
Model 8901B
General Information
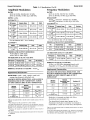
Table 1-1. Specifications (1 of 6)
RF Power
The HP 8901B Modulation Analyzer, with HP 11722A
Sensor Module, performs RF Power Measurements from
-20 dBm (10 pW) to +30 dBm (1W) at frequencies from
100 kHz to 2.6 GHz. The 8901B can be used with any of
the HP 8480 series power sensors (8481A/lB/lH/2A/
2B/2H/3A/4A/5A) to make power measurements from
-70 dBm (10 pW) to +44 dBm (25W) at frequencies from
100 kHz to 26.5 GHz. The 8480 series sensors also work
with the HP 435A and HP 436A Power Meters. Unless
otherwise specified, the specifications shown below refer
to the 8901B only. A detailed explanation of how the uncertainty specifications provided below affect the absolute power measurement accuracy of the 8901B is provided in Application Note 64-1.
RF POWER RESOLUTION':
0.1% of full scale in watts or volts mode.
0.01 dB in dBm or dBTelative
mode.
LINEARITY (includes sensor non-linearity):
RF range linearity 2 RF range-to-range change error.
RF RANGE LINEARITY (using Recorder Outputfi
20.02 dB, RF ranges 2-5.
20.03 dB, RF range 1.
Using front-panel display add 21 count of
least-significant digit.
RF RANGE-TO-RANGE CHANGE ERROR:
20.02 dB/RF Range Change from reference range.
ZERO DRIFT O F SENSORS (1 HOUR, A T CONSTANT
TEMPERATURE AFTER 24-HOUR WARM-UP):
20.1% offull scale of lowest range for 11722A Sensor
Module and 848IA/lB/l H/ZA/ZB/ZH/3A/SA
sensors.
22.0% of full scale of lowest range for 8484A sensor.
Decrease by a factor of 10 for each higher range.
RF O
' WE'
RANGES OF 8901B MoDULATzoN
ANALYZER WITH 11 7224 SENSOR MODULE:
-20 dBm to -10 dBm (10 pW to 100 pW), range 1.
-10 dBm to +O dBm (100pW to 1 mW), range 2.
$0 dBm to +10 dBm ( 1 mW to 10 mW), range 3.
+IO dBm to $20 dBm (10 mW to 100 mW), range 4.
f 2 0 dBm to $30 dBm (100mW to lW), range 5.
RESPONSE TIME (0 to 99% OF READING):
<IO seconds, range 1.
<I second, range 2.
<100 milliseconds, ranges 3-5.
DISPLAYED UNITS:
volts, mV,pV, dB V.
watts, dBm, dBreiotive,
%re ,,,
dB mV, dB pV.
INTERNAL NON-VOLATILE CAL-FACTOR TABLES
(user-modifiable using special functions):
MAXIMUM NUMBER OF CAL
FACTORIFREQUENCY ENTRIES:
Table # 1 (Primary): 16 pairs plus Reference CaI
Factor.
Table #2 (Frequency Offset): 22 pairs plus
Reference CaJ
Factor.
INPUT SWR: c1.15, using 11722A Sensor Module.
ZERO SET (DIGITAL SETTABILITP OF ZERO):
50.07% of full scale of lowest range.
Decrease by a factor of 10 for each higher range.
MAXIMUM ALLOWED FREQUENCY ENTRY:
200 GHz.
FREQUENCY ENTRY RESOLUTION: 50 kHz.
CAL FACTOR RANGE: 40 to 120%.
Supplemental
Characteristics:
_ _
CAL FACTOR RESOLUTION: 0.1 %.
ZERO DRIFT OF METER:
20.03% of full scale/"C of lowest range.
NOISE (at constant temperature, peak change over
a n y one-minute interval for the 11 722A Sensor
Module and 8481AIlBIlH/2A/2B/2H/3A/SA
Sensors):
0.4% of full scale on range 1 (lowest range).
0.13% of full scale on range 2.
0.013% of full scale on range 3.
0.0013% of full scale on range 4.
0.00013% ojfull scale on range 5.
For HP 8484A Sensor multiply noise by five on all
ranges.
The 8901B fundamental RF Power measurement units are watts. Further
internal processing is done on this number to displa!, all other units.
When using 8484A sensor the noise specification may mask the linearity
specification and became the predominont error. \\'hen operating on the
top AF power range. add the Power Sensor Linearity percentages found in
the power sensor specifications.
Power Reference
POWER OUTPUT:
1.00 mW. Factory set to 20.7% traceable to the U.S.
National Bureau of Standards.
ACCURACY: 21.2% worst case (20.9% rss) for one
year [ O O C to 55OC).
~
~~
~~~
Supplemental Characteristics:
FREQUENCY: 50 iMHz nominal.
SWR: 1.05 nominal.
FRONT PANEL CONNECTOR: Type-i\l female.
All parameters describe performance in automatic operation or properly set manual conditions. Specifications describe the instrument's warranted performance. Supplemental Characteristics (shown in italics) are intended to provide information useful in applying the instrument by giving typical, but non-warranted, performance parameters.
Test Equipment Depot - 800.517.8431 - 99 Washington Street Melrose, MA 02176
FAX 781.665.0780 - TestEquipmentDepot.com
1-19
General Information
Model 8901B
Table 1-1. Specifications (2 of 6)
Amplitude Modulation
RATES:
20 Hz to 10 kHz, 150 kHz Sf,< 10 MHz.
20 Hz to 100 kHz, 10 MHz 5fcl 1300 MHz.
DEPTH: to 99%.
ACCURACY3*4* 5:
AM Accuracy
‘2%
Of
reading
21 digit
I
I
I
23% of reading
21 digit
”%
+’%
Of
reading
21 digit
Of reading
2 1 digit
I
I
I
Frequency Range
Rates
Depths
150 kHz-10 MHz
50 Hz-10 kHz
5%-99%
150 kHz-10 MHz
10 MHz-1300 MHz
10 MHz-1300 MHz
I
I
I
20 Hz-10 kHz
50 Hz-50 kHz
20 Hz-100 kHz
I
I
I
to 99%
5%-99%
to 99%
FM Accuracy
Frequency Range
Rates
I I
I
I I
I
I
I pr5Xadlng
250 kHz-10 MHz
22’”,10f~$lng
+’%
Of reading
+l
dlglt
10 MHz-1300 MHz
10 MHz-1300 MHz
2 1 dlglt
I
1
I
Deviations
20 Hz-10 kHz
50 Hz-100 kHz
20 Hz-200 kHz
I
I
I
540 kHzpeak
5400 kHZpeak
5400 kHZpeak
I
I
I
For rms detector add 23% of reading.
DEMODULATED OUTPUT DISTORTION8, 9:
Flatness
Rates
Depths
90 Hz-10 kHz
20%-80%
Frequency Range
*0.3% of reading
2 1 digit
MHz-1300 MHz
I
THD
I
Frequency Range
I
Rates
I
<0.1%
I
400 kHz-10 MHz
I
20 Hz-10 kHz
DEMODULATED OUTPUT DISTORTION:
<0.3% THD for 550% depth.
<O.S% THD for 595% depth.
FM REJECTION (50 Hz TO 3 kHz BW)4:
AM Rejection
Frequency Range
<20 HZ peak
150 kHz-1300 MHz
deviation
~
Deviations
I <lo
20 Hz-100 kHZ
10 MHz-1300 MHz
<0.1%
I
kHz
I
I
<lo0 kHZ
Rates
AM Depths
400 Hz or 1 kHz
550%
~~
RESIDUAL FM (50 Hz to 3 kHz BW):
<8 Hz,,, at 1300 MHz, decreasing linearly with
frequency to <I Hz,,, for 100 MHz and below.
RESIDUAL AM (50 HZ to 3 kHz BW): <O.Ol%,,,.
Supplemental Characteristics:
MAXIMUM FM DEVIATION, RESOLUTION, AND
MAXIMUM DEMODULATED OUTPUT SENSITIVITY
ACROSS A N OPEN CIRCUIT (600Q OUTPUT
IMPEDANCEI7:
Supplemental Characteristics:
DETECTORS: +peak, -peak, kpeak/2, peak hold,
average [rms sinewave calibrated), rms.
MAXIMUM DEPTH, RESOLUTION, A N D MAXIMUM
DEMODULATED OUTPUT SENSITIVITY ACROSS
A N OPEN CIRCUIT (600Q OUTPUT IMPEDANCE)’:
Maximum
Demodulated Output
Sensitivity
Maximum
Resolution
1
100 Hz
AMpeak?40.0%
0.01%
0.1 V/percent
AMpeak<40.0%
0.001%
(rms detector only)
I
1
0.1 V/percent
AMrms<3.0%
I
But not to exceed: 50 Hz to 40 kHz rates for stoted accuracy with rms
detector.
Peak residuals must be accounted for in peak readings.
For peak measurements only: A M accuracy may be affected b!. distortion
generated by the Analyzer. In the worst case this distortion can decrease
accuracy by 0.1% of reading for each 0.1% of distortion.
I
0.01 mV/Hz
I
aF,,,r40
kHz
10 Hz
0.1 mV/Hz
4.0 kHz I
dF,,,,c40 kHz
1 HZ
1.0 mV/Hz
AF,,,<4 kHz
0.1 Hz
(rms detector only)
1.0 mV/Hz
4(ms<0.3 kHz
I
0.01 V/percent
Deviations (4F)
I
Depths
0.1%
Maximum
Demodulated Output
Sensitivity
Maximum
Resolution
Resolution is increased one digit with 750 ps
de-emphasis and pre-display on.
The demodulated output signal present at the
Modulation Out/Audio In connector is increased in
ampliiude by a factor of 10 with 750 ps de-emphasis.
6
But not to exceed: 20 kHz rates and 40 kHz peak deviations with 750 j ~ s
de-emphasis filter.
’ticForimpedonce.
optimum flatness. cables should be terminated trith their choracteris-
1Vith 750 F S de-emphasis and pre-display “off.”distortion is not specified
for modulation outputs >4V peak. This condition can occur near maximum deviation for a measurement ronge. at rates <2 kHz.
Flatness is the variation in indicated A M depth for constant depth on
input signal.
1-20
Model 8901B
General Information
lbble 1-1. Specifications (3 of 6)
Supplemental Characteristics:
~~
THD
-
4.3%
Rates
Frequency Range
150 kHZ-400 kHZ
CARRIER FREQUENCY: 10.1 MHz.
Deviations
20 HZ-10 kHZ
MODULATION RATE: 10 kHz.
4 0 kHz
OUTPUT LEVEL: -25 dBm.
DETECTORS: +peak, -peak, -.peak/2, peak hold,
average (rms sinewave calibrated], rms.
Frequency Counter
STEREO SEPARATION (50 H z to 25 kHz): >47 dB.
RANGE 150 kHz to 1300 MHz.
MAXIMUM RESOLUTION: 1 Hz.'O
ACCURACY:
f reference accuracy f 3 counts of least-significant
Phase Modulation
RATES:
200
200
digit, fc <lo0 MHz.
Hz to 10 kHz,150 kHzlfc<10 MHz.
Hz to 20 kHz,10 MHzlf,l 1300 MHz.
ACCURACY4:
24% of reading 21 digit, 150 kHzlf,<10 MHz.
+3% of reading 21 digit, 10 MHzlfcS1300 MHz.
For rms detector add 23% of reading.
DEMODULATED OUTPUT DISTORTION: <O.l% THD.
AM REJECTION (FOR 50% AM AT I kHz RATESY:
<0.03 radians peak (50Hz to 3 kHz BW).
- 200
:
u)
100
.n
MODES:
Frequency and Frequency Error [displays the difference
between the frequency entered via the keyboard and
the actual RF input frequency).
Internal Reference
FREQUENCY 10 MHz
AGING RATE:
<1 x 10⁻⁶/month.
<1 x 10-g/day (Option 002).11
150 kHzSf,<lO MHz
0.1 Radian
Resolution
0.01 VARaBRaqin
Output
Supplemental Characteristics:
SENSITIVITY IN MANUAL TUNING MODE:
0.22 mVrmP(-60 dBm). [Approximate frequency must
be entered from keyboard.)
MAXIMUM DEVIATION, RESOLUTION, AND
MAXIMUM DEMODULATED OUTPUT SENSITIVITY
ACROSS AN OPEN CIRCUIT (600Q OUTPUT
IMPEDANCE)':
400
f reference accuracy f 3 counts of least-significant
digit or 30 Hz, whichever is larger, fc 2 100 MHz.
nravlh,
Supplemental Characteristics:
.1 P
100 200
7 400
lk
rrns detector only
O.OOO1 Radian
Resolution
2k
4k
10k
Supplemental Characteristics:
20
Option 002
<1 x 10 -6/mo.
<1 x 10 -9/day
Lme Voltage Effects
(4%.
-10% Line Voltage
Change)
<1 x 10 -6
201
Modulation Rate (Hz)
MODULATION RATES: usable from
nith degraded performance.
Standard
Agmg Rate
Hz to 100 kHz
DETECTORS: +peak. -peak. +peak/2. peak hold.
average (rrns sinewave calibrated). rrns.
Modulation Reference
Short Term Stability
-
<6
X
10 -lo
<I x 10 -9 for
1
s average
lo 10 Hz for instmmentswith firmware date codes 234.1985 and below.
(Todisplay the firmware date code, select 42.0 SPCL.)To order a ROM set
that contains this capability, contact the nearest HP sales office.
"After 30-day warmup.
AM CALIBRATOR DEPTH AND ACCURACY:
33.33% depth nominal, internally calibrated to an
accuracy of +0.1O/0.
FM CALIBRATOR DEVIATION AND ACCURACY:
34 kHzpeak
deviation nominal, internally calibrated to
an accuracy of -.0.1%.
rev.19DEC88
Test Equipment Depot - 800.517.8431 - 99 Washington Street Melrose, MA 02176
FAX 781.665.0780 - TestEquipmentDepot.com
1-21
General Information
Model 8901B
Table 1-1. Specifications (4 of 6)
Audio Frequency Counter
Audio RMS Level
FREQUENCY RANGE:
20 Hz to 250 kHz.(Usable to 600 kHz.1
MAXIMUM EXTERNAL INPUT VOLTAGE: 3Vrms.
Accuracy (For Demodulated Signal~l:'~
FREQUENCY RANGE: 50 Hz to 40 kHz.
VOLTAGE RANGE: 100 mV to 3V.
ACCURACY: 2 4.0% of reading.
I
Supplemental Characteristics:
Accuracy
I
Frequency
I Modulation (Peak) I
> 1 kHz
AM 210%
FM 21.0 kHz
@M 2 1.5 radians
23 counts of least-significant digit
+Internal Reference Accuracy
20.02 Hz
t Internal
dl kHz
Reference Accuracy
-0.2 HZ
Reference Accuracy
(3 kHz low-pass filter inserted)
2 Internal
5 3 kHz
AM 210%
FM 2 1.0 kHz
@M 21.5 radians
1.5% d AM < 10%
0 15 kHz 5 FM
< 1.0 kHz
0 15 radian d @M
<15
radians
Accuracy (For External Signals):11
FULL RANGE DISPLAY: .3000V, 4.000v.
AC CONVERTER: true-rms responding for signals with
crest factor of 13.
MEASUREMENT RATE: 2 reading+.
AUDIO INPUT IMPEDANCE: 100 kR nominal.
Audio Filters
DE-EMPHASIS FILTERS: 25 ps, 50 ps, 75 ps, and
750 ps. De-emphasis filters are single-pole, low-pass
filters with 3 dB frequencies of 6366 Hz for 25 ps,
3183 Hz for 50 ps. 2122 Hz for 75 gs. and 212 Hz for
~
Accuracy
Frequency
+ 3 counts of least-significant digit
+Internal Reference
20.02 Hz
z Internal
Reference Accuracy
750 gs.
Level
50 HZ HIGH-PASS FILTER (2 POLE):
> 1 kHz
2100 mV,,
51 kHz
rlOO mVrms
Supplemental Characteristics:
DISPLAYED RESOLUTION: 6 digits.
MEASUREMENT RATE: 2 reading+.
COUNTING TECHNIQUE:
Reciprocal with internal 10 MHz time base.
AUDIO INPUT IMPEDANCE: 100 k R nominal.
Flatness:
at rates? 200 Hz.
300 HZ HIGH-PASS FILTER (2 POLE]:
Flatness: <I% at rates? 1 kHz.
3 kHz LOW-PASS FILTER (5 POLE):
Flatness: <I% at rates 11 kHz.
15 kHz LOW-PASS FILTER (5 POLE):
Flatness: <I% at rates 510 kHz.
>20 kHz LOW-PASS FILTER (9 POLE BESSEL)I4:
Flatness: <I% at rates 110 kHz.
Supplemental Characteristics:
~~
Audio Distortion
FUNDAMENTAL FREQUENCIES:
400 Hz 2 5% and 1 kHz 25%.
MAXIMUM EXTERNAL INPUT VOLTAGE: 3V.
DISPLAY RANGE:
0.01% to IOO.Ooio (-80.00 d B to 0.00 dB).
DISPLAYED RESOLUTION: 0.01% or 0.01 d B .
ACCURACY: 2 1 dB of reading.
SENSITIVITY:
Modulation: 0.15 kHz peak FLI. 1.5% peak A M or
0.6 radian peak &XI.
External: 100 myrms.
RESIDUAL NOISE AND DIST0RTIONI3:
0.3'0 (-50 dB). temperature <4O0C.
Supplemental Characteristics:
MEASUREMENT 3 dB BANDWIDTH: 20 Hz to 50 kHz.
DETECTION: True rrns.
MEASUREMENT RATE: I rradinp/s.
AUDIO INPC'T IMPEDA'VCE: 100 k!! n o m i n a l .
1-22
DE-EMPHASIS FILTER TIME CONSTANT
ACCURACY: 23%.
HIGH PASS AND LOW PASS FILTER 3 dB
FREQUENCY ACCURACY: 2 3 % .
>20 kHz LOW PASS FILTER:
3 dB Cutoff Frequency: 100 kHz nominal.
OVERSHOOT ON SQUARE WAVE MODULATION":
<IO/b.
12 I\'ith the loi~.passa n d high-puss audio fillers used l o stabilize frequency
readings.
13 For dernodulol~dsignals. the residuol noise generaled b!. the 8901B
must br uccounled for i n distortion measuremrnts i i . e residual A.M. F.M or
o.\l
j
14 The >?O i H z lon.pass filter is
squurwoix= nodulotion
intended for m i n i m u m
overshoot with
Model 8901B
lbble 1-1. Specijications (5 of 6)
HP 8901B Rear Panel Inputs/Outputs
RF Input
FREQUENCY RANGE: 150 kHz to 1300 MHz.
OPERATING LEVEL:
I
I
General Information
Minimum
Operatinglevel
12 mVrms(-25 dBm)
I
I
Maximum
Operatinglevel
'lms
("peak)
Source SWR e4
I
I
Frequency Range
150 kHz-650 MHz
Supplemental Characteristics:
TUNING:
Normal Mode: Automatic and manual frequency
entry.
Track Mode: Automatic and manual frequency entry,
f, 210 MHz.
Acquisition Time (automatic operation):
-I .5 seconds.
INPUT IMPEDANCE: 50R nominal.
MAXIMUM SAFE DC INPUT LEVEL: 5V.
General Specifications
TEMPERATURE: Operating: O°C to 55OC.
Storage: -55% to 75OC.
REMOTE OPERATION: HP-IB; alI functions except the
line switch are remotely controllable.
HP-IB COMPATIBILITY (defined in IEEE 488-1978):
SHI, AHI, T5, TEO. L3, LEO. SRI,R L I . PPO. DC1. DT1,
Supplemental Characteristics:
FM OUTPUT: 10 kR impedance, -9V to 6V into an open
circuit: -6V/MHz, dc coupled, 16 kHz bandwidth (one ,
pole).
AM OUTPUT: 10 kR impedance, -4V to OV into a n open
circuit, -8 mV/%, dc coupled, 16 kHz bandwidth (one
pole).
RECORDER OUTPUT: DC voltage proportional to the
measured results, 1 kR impedance, OV to 4VfOr each
resolution range into a n open circuit.
IF OUTPUT: 50R impedance, 150 kHz to 2.5 MHz,
-27 dBm to -3 dBm.
10 MHz REFERENCE OUTPUT: 50R impedance, TTL
levels (OV to >2.2V into an open circuit). Available only
with Option 002 Ixlo-g/day internal reference.
10 M H z REFERENCE INPUT15 >500R impedance,
0.5Vpeak.lo.peak
minimum input level.
LO INPUT (Option 003): 5OR impedance, -1.27 MHz to
1301.5 MHz, 0 dBm nominal.
RF SWITCH REMOTE CONTROL OUTPUT: Provides
output signals necessary to remotely control either an
HP 3331 1B/C Option 01 1 or an HP 8761A RF switch.
FREQUENCY OFFSET MODE REMOTE CONTROL
OUTPUT: TTL high output if in frequency offset mode
(Special Function 27.1 or 27.3) with an external LO
frequency >O, TTL low output for all other cases.
CO, E l .
EMI: Conducted and radiated interference is within the
requirements of VDE 0871 (Level B).and CISPR
publication 11.
POWER: 100.120, 220. or 240V (+5%. -lO0/o): 48-66 Hz:
200 VA maximum.
WEIGHT: Net 23.4 kg. (51.5 lb.); Shipping 31.1 kg (68.5 lb).
DIMENSIONS: 190 mm. H
(7.5" X 16.8" X 21.7").
X
426 mm. M'
X
551 mm. D
' 5 ~ x t e r n a i reference accuracy affects accuracy ut ail iiie~asurements.
HP SYSTEM I1 MODULE SIZE: 177.0 H X 1 MLY X 497.8 D.
Test Equipment Depot - 800.517.8431 - 99 Washington Street Melrose, MA 02176
FAX 781.665.0780 - TestEquipmentDepot.com
1-23
General Information
Model 8901B
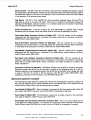
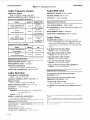
Table 1-1. Specifications (6 of 6)
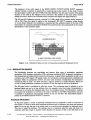
Carrier Noise (Options 030-037)
FREQUENCY RANGE: 10 MHz to 1300 MHz.
CARRIER POWER RANGE: +30 dBm to -20 dBm;
12.5 kHz, 25 kHz and 30 kHz filters.
+30 dBm to -10 dBm; carrier noise filter.
DYNAMIC RANGE: 115 dB.
CARRIER REJECI'ION (temp. 135'C) >90 dB; for offsets of
at least 1 channel spacing or 5 kHz, whichever is greater.
RELATIVE MEASUREMENT ACCURACY: 5 0.5 dB;
levels 2 - 9 5 dBc; 12.5 kHz, 25 kHz and 30 kHz filters.
50.5 dB; levels 1 - 1 2 9 dBc/Hz; carrier noise filter.
CARRIER NOISE FILTER:
Filter Noise Bandwidth: 2.5 kHz nominal.
Noise Bandwidth Correction Accuracy (stored in
non-volatile memory): 20.2 dB.
Supplemental Characteristics:
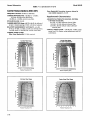
ADJACENTIALTERNATE CHANNEL FILTERS:
6 d B Filter Bandwidth:
8.5 kHz, 12.5 kHz adjacent-channel filter.
16.0 kHz, 25 kHz adjacent-channel filter.
30.0 kHz, 30 kHz (cellular radio) alternatechannel filter.
TYPICAL NOISE FLOOR: -150 dBc/Hz, 0 dBm carrier
power level. For System noise performance add LO
contribution.
25 kHz Filter Shape
and CEPT Specification
12.5 kHz Filter Shape
0
0
-10
-10
-20
-20
-30
-
E
0 -40
k
C
.-5
-30
4 0
0
._
-50
m
'3
a-w
.-
0
-50
a
-60
-70
-70
-80
-80
-90
-90
-6 -4 - 2
0 2 4 6 8 10 12 14 16 18 20
-6 -4 - 2 0 2 4
Relative Frequency (kHz)
30.0
6 8 10 12 14 16 1 8 2 0 2 2 2 4 2 6
Relative Frequency (kHz)
kHz Filter Shape
Carrier Noise Filter Shape
0
-10
-20
-
-30
!
i
-40
C
0
i5
%
a
-50
-60
-70
-80
-90
-12 - 8 -4
0 4 8 12 16 20 24 28 32 36 40
Relative Frequency (kHz)
1-24
- 2 - 1
0
f
2
3
4
Relative Frequency (kHz)
5
6
Model 8901B
General Information
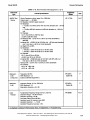
Table 1-2. Recommended Test Equipment (1 of 4)
~~
Instrument
Type
~~~~
~
~
Critical Specifications
Suggested
Model
AM/FM Test
Source
Carrier Frequency: within range 10 to 1300 MHz
Output Level: > -20 dBm
FM Deviation: 400 kHz peak maximum
FM Distortion:
< -72 dB at 12.5 MHz carrier with 12.5 kHz deviation and 4 0 kH
rate
< -72 dB at 400 MHz carrier and 400 kHz deviation at 4 0 0 kHz
rate
FM Flatness:
10.1% from 20 Hz to 100 kHz rates
k0.2570to 200 kHz rates
CW Residual FM: <3 Hz rms in a 50 Hz to 3 kHz bandwidth at
560 MHz
incidental AM: <0.08% AM at 100 MHz with 4 0 kHz peak deviatioi
and 1 kHz rate in a 50 Hz to 3 kHz bandwidth
AM Depth: 5% to 99%
AM Distortion:
< -66 dB at -30% AM at 20 Hz to 100 kHz rates
< -60 dB at 4 5 % AM at 20 Hz to 100 kHz rates
AM Flatness:
iO.1% from 50 Hz to 50 kHz
f0.25% from 20 Hz to 100 kHz
incidental QM: <0.008 rad peak at 12.5 MHz with 50% AM at a 1
kHz rate in a 50 Hz to 3 kHz bandwidth
Residual AM: <0.01% rms in a 50 Hz to 3 kHz bandwidth
AM Linearity:
fO.lYO at <95% AM
3~0.2%at 4 9 % AM
HP 11715A
Attenuator,
3 dB
(2required)
Frequency: 30 MHz
SWR Maximum: 1.2
(Used as alternate equipment.)
HP 8491A
Option 03
Attenuator,
6 d0
Frequency Range: 0.15 to 1300 MHz
SWR Maximum: 1.2
Attenuation Accuracy: f0.4dB
HP 8491A
Option 06
Audio
Analyzer
Fundamental Frequency Range: 20 Hz to 100 kHz
Distortion Range: -70 dB minimum
Distortion Accuracy: f2 dB
Low-Pass Filters: 30 and 80 kHz
Oscillator Level: 3V maximum into 600R
Oscillator Distortion: < -70 dB
Oscillator Frequency Accuracy: f 2 %
HP 89038
*C=Operator'$ hecks; P=Performance Tests: A=Adjustments; T=Troubleshooting
Test Equipment Depot - 800.517.8431 - 99 Washington Street Melrose, MA 02176
FAX 781.665.0780 - TestEquipmentDepot.com
1-25
Model 8901B
General Information
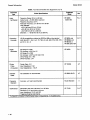
n b l e 1-2. Recommended Test Equipment (2 of 4)
~
Instrument
Type
Critical Specifications
Suggested
Model
Audio
Synthesizer
Frequency Range: 20 Hz to 400 kHz
Output Level: +16 dBm (50R) maximum
Frequency Accuracy: f O . l O/O
Attenuator Accuracy: fO.l dB from 0 to 20 dB
Level Flatness:
f0.015 dB from 90 Hz to 10 kHz
f0.3 dB from 50 Hz to 100 kHz
f0.07 dB from 20 Hz to 200 kHz
Distortion: < -50 dB from 20 Hz to 200 kHz
HP 3336C
Option 005
Computing
Controller
HP-IB compatibility as defined by IEEE Std 488 and the identical
ANSI Std MC1.l: SH1, AH1, T2, TEO, L2, LEO, SRO, PPO, DCO, DTO,
and Cl,2, 3, 4,5.
HP 9825A and
HP 98034A and
HP 98213A or
HP 858 Option 00;
Digital
Multimeter
DC Range: 0 to 50V
DC Accuracy: f0.01% at 1V
AC Range: 0 to lOOV
AC Accuracy: f0.01 YO at 2V and 2 kHz
Ohms Range: 0 to 1 Mfl
Ohms Accuracy: f l %
HP 3455A
Divider
Probe
(2 required)
Divider Ratio: 1O:l
Input Impedance: 1 MR
Input Capacitance: <lo pF
HP 10040A
~
~
Extender
Cable
No substitution is recommended.
HP 08901-60179
Frequency
Standard
Accuracy: k O . l ppm recommended
House Standard
Oscilloscope
‘C=Operator’!
1-26
Bandwidth: less than 3 dB down 0 to 100 MHz
Sensitivity: 5 mV per division minimum
Input Impedance: 10 MR and 500
Triggering: External and Internal
:becks; P=Performance Tests: A=Adjustments; T=Troubleshooting
HP 1740A
Model 8901B
General Information
Table 1-2. Recommended Test Equipment (3 of 4)
Instrument
Type
Suggested
Critical Specifications
Model
Power Meter
Power Range: 1 mW
Transfer Accuracy (input-to-output): 0.2%
HP 432A
Thermistor
Mount
SWR: 1.0550 MHz
Accuracy: f 0.5% at 50 MHz
HP 478A-H75** or
HP 478A-H76***
Power
Reference
Power Output: 1.OO mW, factory set to f0.770, NBS calibrated
Accuracy: f(1.2% worst case +0.9% rss) for one year; 0 to 50’ C
HP 435A
Option KO5
Power Supply
Output Range: 0 to 25 Vdc
HP 6215A
Range
Calibrator
Calibration Functions: outputs corresponding to power displays of
10 pW, 100 pW, 1 mW, 10 mW, and 100 mW
Calibration Uncertainty: f0.25% in all ranges
HP 11683A
RF
Spectrum
Analyzer
Frequency Range: 0 to 2 GHz
Input Level: f f O dBm maximum
Display Range: 60 dB
HP 8559A and
HP 182T
Sensor
Module
Compatible with HP 8901B
Input SWR:
4 . 3 , at RF Input, RF Ranges 1 and 2
4 . 5 , at RF Input, RF Range 3
4 . 3 , at RF Input, RF Range 3 with Modulation Analyzer’s
Special Function 1.9
HP 11722A
Service
Accessory
Kit
No substitution recommended.
HP 08901-60287
Signal
Generator
Frequency Range: 0.5 to 1100 MHz
Output Level:
$19 dBm maximum to 500 MHz
+13 dBm maximum to 1100 MHz
Output Level Accuracy: f l dB
Frequency Accuracy: f l %
Frequency Resolution: 1 kHz
Modulation Capability: AM and FM
AM Depth: 0 to 95%
AM Accuracy: f 1 0 %
FM Range: 0 to 400 kHz peak deviation
FM Accuracy: f10%
HP 86408
Options 001 and
002
~~
~
I
‘C=Operator’s :hecks; P=Performance Tests; A=Adjustments; T=Troubleshooting
“HP 478A-H75 must be calibrated at the National Bureau of Standards (NBS) for this accuracy.
“‘HP 478A-H76 includes HP standards lab calibration to f0.58% at 50 MHz (traceable to NBS).
rev.21JUL87
Test Equipment Depot - 800.517.8431 - 99 Washington Street Melrose, MA 02176
FAX 781.665.0780 - TestEquipmentDepot.com
1-27