1
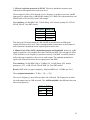
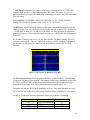
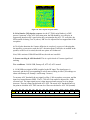
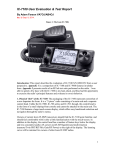
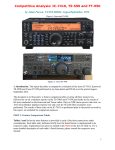
IC-7200 User Evaluation & Test Report By Adam Farson VA7OJ/AB4OJ Iss. 4, 13 January 2013.Supersedes Iss. 3, December 3, 2008. Introduction: This report describes the evaluation of IC-7200 S/N 0201013 from a user perspective, as well as the results of several RF lab tests performed on the radio. I was able to spend a number of days with the IC-7200 in my ham-shack, and thus had the opportunity to exercise the radio’s principal features and evaluate its on-air behavior. Appendix 1 is the detailed test report. 1. Physical “feel” of the IC-7200: The IC-7200 conveys the solidity typical of a military tactical mobile radio set. I found the overall feel of the main tuning knob and other controls very smooth and pleasant. The rugged construction of the case and front panel, with the positive tactile feel of the Neoprene push keys, adds to this impression of solidity. The main tuning knob, with its chunky Neoprene grip, feels very smooth and has less than 0.5 mm side-play. The other rotary controls, some of which are detented, also have a positive feel. The large, concentric Twin PBT knobs are very comfortable to use; although the IC-7200 lacks the PBT CLR key found on other Icom DSP radios, the center detent facilitates setting Twin PBT to the neutral position. The radio is solidly constructed and superbly finished. It conveys a smooth, precise overall feel. The rear bumper protects the rear-panel connectors and heat-dissipator fins, and the optional front handles (if fitted) will protect the front panel and its controls from accidental damage. Installation of these handles is strongly recommended. 2. Multiple key functions and menus: Most of the front-panel keys have secondary functions which are accessed by pressing and holding the key for 1 sec. The digit-entry function of the numerical keys is actually secondary, and is entered by pressing the F-INP key. The yellow numerical digits are a clue to this, as the F-INP marking is yellow. The secondary BAND (band-selection) function of the F-INP key is marked in white, in keeping with the band markings on the numerical keys (band selection is their tertiary function!) All this may sound more confusing than it actually is. I found the process fairly intuitive after a quick read of the relevant user-manual sections. The SET menu familiar to users of other Icom DSP radios has two levels, accessible by pressing and holding the M-CH/RIT key. Press & hold once to enter the QUICK SET menu – transmit power output, MIC Gain, etc. Press & hold again to enter the in-depth SET menu. This menu is similar to SET/OTHERS on other Icom DSP radios. The MCH/RIT key also serves as an EXIT key. Similarly, M-CL restores a selected parameter to its default value. I found RIT activation a bit tricky. To change the M-CH/RIT control to RIT, the RIT key must first be pressed to activate RIT. The M-CH/RIT knob will switch to RIT 1 automatically when RIT is active (RIT icon displayed). Again, a quick read of the relevant chapter in the user manual was most helpful. The filter selection and adjustment procedure is similar to that on other Icom DSP radios. Press and hold the FILTER key for 1 sec. to adjust the filter bandwidth. All filters are continuously adjustable. The CW Pitch control is a QUICK SET menu item, rather than a separate control. I found it via the user manual! Pressing and holding the Preamp key inserts a 20 dB attenuator in the RF signal path, in place of the preamp. The radio’s controls and menus were easy to use once I grew accustomed to them. This is certainly a very good way of saving front-panel space without hurting the radio’s ergonomics. A user familiar with a radio such as the IC-756Pro3 or IC-7700 should find the IC-7200’s learning curve minimal. . 3. LCD display: Although the IC-7200’s monochrome LCD display is fairly small (64 x 24 mm), I found it sharp, highly legible and sufficiently contrasty for comfortable viewing in bright room light or outdoors. There are 3 backlight settings: HI, LO and off. HI is the default. Filter selections and feature activation are displayed via on-screen icons. Some of these are quite small, but I found them easily readable. 4. USB PC interface: The IC-7200 is equipped with a rear-panel USB “B” port. Thus, the radio can be directly connected to a laptop or other PC via a standard USB “A-B” cable. This is without doubt one of the IC-7200’s strongest features. The USB port transports not only CI-V data, but also TX and RX PCM baseband between the IC-7200 and the computer. As a result, the USB cable is the only radio/PC connection required. Gone forever is the mess of cables, level converters and interface boxes! This is a feature which I would really like to see on all future Icom HF radios. 5. Filter selections and Twin PBT: As do the other Icom DSP transceivers, the IC-7200 offers fully configurable RX IF selectivity filters for all modes. Default Wide, Mid and Narrow filter selections are available for all modes, with continuously variable bandwidth via menu. In addition, there are selectable Sharp and Soft shape factors for SSB and CW. As mentioned in Section 1, the Twin PBT controls have a center detent which facilitates setting Twin PBT to the neutral position (nominal bandwidth, no passband shift). The IC7200 Twin PBT feature operates similarly to that of all other Icom DSP radios, except that there is no BPF icon or visual indication of passband modification on the LCD. This places the user at a slight disadvantage when configuring a “non-BPF” filter. 2 6. BPF vs. non-BPF filters: As in the IC-756Pro series and the IC-746Pro, the IC7200 allows the user to select two additional shapes for 500 Hz or narrower filters, in addition to SHARP and SOFT. These are BPF (steeper skirts) and non-BPF (softer skirts). To configure a BPF filter, select a 500 Hz or narrower CW, RTTY or SSB-D filter with Twin PBT neutral. To set up a non-BPF filter, select a filter with BW > 500 Hz, and narrow the filter to 500 Hz or less by rotating the Twin PBT controls. On the IC-7200, this must be done “by ear” (or by means of spectral-analysis software in the connected PC.) Examples are illustrated in Figures 3 & 4 (Page 8). 7. Notch Filters: The tunable manual notch filter (MNF) is inside the AGC loop, and is very effective. The MNF has 3 width settings (Wide, Mid and Narrow); its stopband attenuation is at least 70 dB. The manual notch suppresses an interfering carrier before it can stimulate AGC action, thus preventing swamping. The auto notch filter (ANF) is post-AGC. It suppresses single and multiple tones, but strong undesired signals can still cause AGC action and swamp the receiver. MNF and ANF are mutually exclusive, and ANF is inoperative in CW mode. 8. NR (noise reduction): The DSP NR functionality works very well. In SSB mode, the maximum noise reduction occurs at a level setting of 10 (max. = 15). As NR level is increased, there is some loss of “highs” in the received audio; this is as expected. The measured SINAD increase in SSB mode was about 6 dB. 9. NB (noise blanker): I found the DSP NB somewhat more effective than the IC756Pro III’s analog NB. It will strongly attenuate fast-rising noise pulses, but is somewhat less effective on power-line hash. NB works best in conjunction with NR. 10. Transmit audio parameters: The IC-7200 has only two transmit audio menu items, Mic Gain and compression level. The DSP IF-level compressor is similar to that provided on other Icom DSP radios. It works very smoothly, and does not distort at the default compression level value of 5 (approx. 6 dB compression). The IC-7200 supports emission designator 2K8J3E (to ensure FCC compliance on 60m.) Thus, no transmit bandwidth or equalization menus are provided. The corresponding AM designator is 5K6A3E (double-sideband). The RTTY mode supports F1B (FSK, TX only) and F2B (AFSK). Note that the IC-7200 is not fitted with a transmitter audio monitor. 11. Metering: Three selectable transmit meter scales are provided - Po (RF output), SWR and ALC. Only one of these is displayed. In receive, the on-screen bar-graph indicator is always the S-meter. 3 12. Interfacing with Ham Radio Deluxe (HRD). Simon Brown HB9DRV and I worked together over a period of several evenings to interface his well-known software suite to the IC-7200. The single USB interconnection greatly facilitated this task. I installed the Icom USB drivers (downloadable from the Icom Japan world-wide support site) and HRD on my laptop. The IC-7200 showed up in the computer as “USB Audio Codec”. Once I had set the levels correctly, HRD started working, and was displaying PSK31 and RTTY traffic and waterfalls. A level problem was discovered in the course of this task. Simon reported that the PCM baseband level at the input to HRD was 20 to 30 dB below the expected value. A singletone test on the radio then revealed that the analog baseband level at the line audio output (ACC socket, Pin 12) was only 30 mV; the specification calls for 100 to 300 mV. As the line audio output drives the USB audio codec directly, this explained the low PCM level which Simon reported. This issue has been reported to Icom. (Refer to Appendix 2-A.) 13. Brief “on-air” report: After completing the test suite, I moved the IC-7200 to my shack and connected it to my solid-state 1 kW amplifier and multi-band vertical antenna. The interface was straightforward – RF drive, PTT, ALC and carrier request (for amplifier autotuning). Once I had set up the ALC for 1 kW output, I was off and running. On tuning around 20m SSB, I noted that the receive audio sounded clear and crisp on the IC-7200’s internal speaker, and excellent on my SP-20. The NB was quite effective against my local power-line noise, but did not eliminate it completely as does the NB on my IC-7700. The NR was very effective, and compared favorably with that of the IC756Pro3. The preamp (10 dB gain) brought weak KL7 stations up to very comfortable copy without S/N degradation. I did not have the opportunity to operate the radio under very strong signal conditions. The SSB filters were excellent, as we have come to expect from other Icom DSP radios. The MNF and ANF were extremely helpful. I was able to notch out single tones with the MNF; the ANF reduced the levels of multiple tones, suppressing the higher-pitched tone and reducing the level of the lower-pitched tone by about 20 dB. Two stations I worked on 20m SSB both reported that the transmit audio with the stock HM-36 hand microphone was “a little on the mellow side” and “lacking in highs”. When I substituted my Heil GM-5 for the HM-36, one of these stations complimented me on the audio quality. I also worked a station on 40m CW, using a straight key and semi-break-in. I did not check for “dit-clipping”. Slight filter ringing was evident when using the CW-M (500 Hz) and CW-N (250 Hz) filters with the Sharp shape factor, preamp on and fast AGC. There is noticeably less ringing if the Soft shape factor is selected. Ringing can be reduced even further by selecting the CW-W (1.2 kHz) filter and narrowing it with Twin PBT (“nonBPF”). 4 In a quick check of AM reception, I listened to various MF and HF broadcast stations. A local station on 690 kHz and a music broadcast on 13690 kHz sounded good on the IC7200’s internal speaker, but much clearer (as one would expect) on my SP-20. The AM Wide filter (8 kHz) yielded the best frequency response, but Mid (6 kHz) sounded somewhat “smoother” and Narrow (3 kHz) cut the “highs” excessively. Unlike other Icom DSP radios in which Twin PBT becomes IF Shift on AM, the IC-7200’s Twin PBT is fully functional in this mode. The default (Normal) AGC setting was fine under average to good signal conditions, but I found the Fast setting (AGC-F) quite useful in dealing with rapid selective fading. I found that the NR was quite effective in improving the S/N ratio of weak AM signals, but a setting above 6 cut the “highs” severely. The NB caused noticeable distortion on modulation peaks, and caused unacceptable “pumping” at settings above 80%. The ANF is effective in suppressing unwanted tones and heterodynes, but MNF causes distortion when tuned across the signal. The reason for this is that MNF suppresses the carrier in a manner similar to selective fading. An EMC issue was observed when using a headset plugged into the IC-7200’s PHONES jack. Distorted RF feedback was heard when transmitting SSB; it was quite severe at 100W and much worse at 1 kW. This problem was observed on 40, 20 and 17m only, and disappeared when a dummy load was substituted for the antenna feedline. (Refer to Appendix 2-B.) 14. Conclusion: After several days’ worth of “cockpit time” on the IC-7200, I am very favorably impressed by its solid, refined construction, smooth operating “feel”, impressive array of features and excellent on-air performance. This is a lot of radio in a very compact package. And Icom have truly scored a coup with the straightforward USB computer interface. 15. Acknowledgements: I would like to thank Ray Novak N9JA at Icom America, and Paul Veel VE7PVL at Icom Canada for making an IC-7200 available to me for testing and evaluation. I would also like to thank Simon Brown HB9DRV for his enthusiasm and help in interfacing HRD to the IC-7200. Adam Farson, VA7OJ/AB4OJ e-mail: [email protected] http://www.ab4oj.com/ October 11, 2008 Copyright © 2008 A. Farson VA7OJ/AB4OJ. All rights reserved. 5 Appendix 1: Some Performance Tests As performed in my home RF lab, October 6 – 11, 2008. Rev. 2, November 28, 2008; Tests 12 & 13 re-run with HP 8563E spectrum analyzer. Rev.3: Test 14 (Power-output tests) added. Rev 4: Test 2b: DR3/IP3 test added. IC-7200 S/N 0201013 A. Receiver Tests 1. MDS (Minimum Discernible Signal) is a measure of ultimate receiver sensitivity. In this test, MDS is defined as the RF input power which yields a 3 dB increase in the receiver noise floor, as measured at the audio output. Test Conditions: ATT off, NR off, NB off. Levels in dBm. Preamp off on 3.6 MHz SSB 2.4 kHz CW 500 Hz -124 -130 -136.5 -140 14.1 MHz SSB 2.4 kHz CW 500 Hz -124 -129 -136 -142 50.1 MHz SSB 2.4 kHz CW 500 Hz -131 -134 -139 -145 1a. AM Sensitivity. Here, an AM test signal with 30% modulation at 1 kHz is applied to the RF input. The RF input power which yields 10 dB (S+N)/N is recorded. Test Conditions: ATT off, NR off, NB off, Wide (8 kHz) filter. Levels in dBm. Preamp off on 0.9 MHz -97 -107 3.9 MHz -107 -117 14.1 MHz -107 -115 2a. Reciprocal Mixing Noise occurs in a superheterodyne receiver when the noise sidebands of the local oscillator (LO) mix with strong signals close in frequency to the wanted signal, producing unwanted noise products at the IF and degrading the receiver sensitivity. Reciprocal mixing noise is a measure of LO spectral purity. In this test, a strong "undesired" signal is injected into the receiver's RF input at a fixed offset from the operating frequency. The RF input power is increased until the receiver noise floor increases by 3 dB, as measured at the audio output. Reciprocal mixing noise, expressed as a figure of merit, is the difference between this RF input power and measured MDS. The test is run with preamp off. The higher the value, the better. Test Conditions: SSB mode, 2.4 kHz filter, preamp off, ATT off, NR off, NB off, Preamp off. Offset kHz 2 3 5 10 Reciprocal mixing noise dB 3.6 MHz LSB 14.1 MHz USB 78 76 83 79 94.5 94 98.5 98 6 2b. Two-Tone 3rd-Order Dynamic Range (DR3) & Third-Order Intercept (IP3). The purpose of this test is to determine the range of signals which the receiver can tolerate while essentially generating no spurious responses. In this test, two signals of equal amplitude and separated by a known offset are injected into the receiver input. If the signal frequencies are f1 and f2, the offset f = f2 - f1 and the 3rd-order intermodulation products appear at (2 f2 - f1) and (2 f1 - f2). The two test signals are combined in a passive hybrid combiner and applied to the receiver input via a step attenuator. The receiver is tuned to the lower 3 rd-order IMD product (2 f1 - f2) and then to the upper product (2 f1 - f2). These appear as a 600 Hz tone in the speaker. The input signal power level is adjusted to raise the receiver noise floor by 3 dB, as measured at the audio output. The average of the DR3 values for the lower and upper products is shown in the table. DR3 = Pi – MDS where Pi is the power level of either f1 or f2. IP3 = (1.5 * DR3) + MDS. Test Conditions: CW mode, 500 Hz filter, AGC on (normal), ATT off, NR off, NB off, Preamp off, CW Pitch = 60 (default). Measured MDS at 14.1 MHz = -133 dBm (preamp off). Δf kHz DR3 dB IP3 dBm 2 66 -34 5 85 -5 20 99 +16 7 3. IF filter shape factor (-6/-60 dB). This is the ratio of the -60 dB bandwidth to the -6 dB bandwidth, which is a figure of merit for the filter’s adjacent-channel’s rejection. The lower the shape factor, the “tighter” the filter. In this test, an approximate method is used. An RF test signal is applied at a power level approx. 60 dB above the level where the S-meter just drops from S1 to S0. The bandwidths at -6 and -60 dB relative to the input power are determined by tuning the signal generator across the passband and observing the S-meter. Reciprocal mixing noise limits the level range to 60 dB or less. Test Conditions: 10.000 MHz, SSB/CW modes, preamp off, AGC normal, ATT off, NR off, NB off. Filter Sharp Soft 2.4 kHz SSB 1.2 1.55 500 Hz CW 1.26 2.17 250 Hz CW 1.4 2.56 4. SSB filter roll-off. An RF test signal is applied at a level 6 dB below AGC threshold, with AGC off. The signal is offset 1 kHz from the receive frequency to produce a test tone. While tuning the signal generator across the IF passband, the frequency and audio level are noted at several points on the filter flank. Test Conditions: 10.000 MHz, SSB 2.4 kHz filter, preamp off, AGC off, ATT off, NR off, NB off. Input signal level -101 dBm (6 dB below measured -95 dBm AGC threshold.) Roll-off in dB. Offset Hz Sharp Soft 250 -5 300 -3 400 -1.5 -9 500 -1 -3 750 0 0 1000 0 0 2000 -0.5 -0.7 2500 -1.5 -3 Figure 1: 2.4 kHz SSB filter (Sharp) 8 Figure 2: 2.4 kHz SSB filter (Soft) Figure 3: 500 Hz CW filter (Sharp, BPF) Figure 4: 500 Hz CW filter (Sharp, non-BPF) Figure 5: 500 Hz CW filter (Soft) The above examples depict typical filter passbands. Due to the limited dynamic range of the measurement method, the amplitude scale is not accurate. 9 5. NR noise reduction, measured as SINAD. This test is intended to measure noise reduction on SSB signals close to the noise level. The test signal is offset 1 kHz from the receive frequency to produce a test tone, and RF input power is adjusted for a 6 dB SINAD reading (-121 dBm). NR is then turned on, and SINAD read at 30% and 50% (max.) NR settings. Test conditions: 10.000 MHz LSB, 2.4 kHz Sharp, AGC normal, preamp off, ATT off, NR off, NB off, Twin PBT neutral. NR Level SINAD dB 0 6 5 9 6 10 8 to 9 12 (max.) This shows an S/N improvement of 6 dB with NR at maximum for an SSB signal roughly 6 dB above noise level. This is an approximate measurement, as the amount of noise reduction is dependent on the original signal-to-noise ratio. 6. Manual Notch Filter (MNF) stopband attenuation and bandwidth. In this test, an RF signal is applied at a level slightly more than 70 dB above MDS. The test signal is offset 1 kHz from the receive frequency to produce a test tone. The MNF is carefully tuned to null out the tone completely at the receiver audio output. The stopband attenuation is equal to the difference between the test signal power and MDS. Test conditions: 14.100 MHz USB at -70 dBm (S9), 2.4 kHz Sharp, AGC normal, preamp on, ATT = 0 dB, NR off, NB off, MNF on, Twin PBT neutral. Results: MNF nulls out signal completely. Measured MDS was -142 dBm per Test 1. Thus, stopband attenuation ≈ 72 dB (= -142 – {-70}) The receive frequency is now offset on either side of the null. The frequencies at which the audio output rises by 6 dB are noted. The -6 dB bandwidth is the difference between these two frequencies. MNF -6 dB BW Wide 91 Hz Mid 48 Hz Narrow 30 Hz 10 Figure 6: Manual Notch Filter (W). Figure 7: Manual Notch Filter (M). Figure 8: Manual Notch Filter (N). The above figures depict the Manual Notch Filter stopband for Wide, Mid and Narrow settings. Due to the limited dynamic range of the measurement method, the amplitude scale is not accurate. 11 7. AGC impulse response. The purpose of this test is to determine the IC-7200's AGC response in the presence of fast-rising impulsive RF events. Two types of event are applied to the receiver input; RF bursts with a fast-rising wavefront, and pulse trains with short rise times. Test conditions: 14.100 MHz USB for 7a (2.000 MHz for 7b), 2.4 kHz SSB filter (Sharp), NR off, NB off, Preamp off for 7a (on for 7b), AGC Fast. 7a. RF bursts. A pulse generator applies a pulse train to the modulation input of the RF signal generator. The test is performed at two steady-state RF power levels: -20 dBm (S9 + 50 dB) and -10 dBm (S9 + 60 dB) at 14.100 MHz. The pulse generator is adjusted to generate RF bursts of 1.2 µS duration. Burst rise time (to -3 dBr) is 200 nS. Pulse period is 600 mS. At -10 dBm, S-meter peaks to S9 + 20 dB. The result for -20 dBm is similar. The AGC recovers completely in ≈ 200 mS. There is no evidence of AGC clamping. In Figure 9, the blue bars are the inter-pulse intervals, and the black bars are the AGC recovery intervals. Figure 9: AGC response for RF bursts at -10 dBm. 7b. Test with pulse trains. Here, the pulse generator is coupled to the IC-7200 RF input via the pick-off port of a line sampler. The sampler's main port is terminated in 50Ω. The IC-7200 is tuned to 2 MHz, as the RF spectral distribution of the test pulse train has a strong peak in that band. AGC Fast is selected as before, but Preamp is on. The pulse rise time (to 70% of peak amplitude) is 10 nS. Three pulse durations are used: 30, 50 and 100 nS. In all cases, pulse period is 600 mS. Pulse amplitude is 16V pk (e.m.f.) As in Test 7a, the AGC recovers completely; there is no evidence of clamping. Pulse duration nS 30 50 100 AGC recovery mS S-meter reading ≈ 100 (no clamping) S7 ≈ 100 (no clamping) S9 ≈ 100 (no clamping) S9 12 Figure 10: AGC response for pulse trains. 8: Noise blanker (NB) impulse response. As the IC-7200's noise blanker is a DSP process "upstream" of the AGC derivation point, the NB should be very effective in suppressing impulsive RF events before they can stimulate the AGC. To verify this, the NB is turned on during Test 7b (above). NB Level is adjusted for best suppression of the test pulses. At 30 nS pulse duration, the S-meter deflection is completely suppressed, showing that the impulsive events never reach the AGC derivation point. Faint ticks are audible in the speaker; as NB Level is varied, the ticks are quieter at 100 than at 0. Next, NR is activated. With NR and NB on, the ticks are inaudible. 9: S-meter tracking & AGC threshold. This is a quick check of S-meter signal level tracking. Test conditions: 2.4 kHz USB, Preamp off, ATT off, AGC normal. A 14.100 MHz test signal at MDS is applied to the RF input. The signal power is increased, and the level corresponding to each S-meter reading is noted. (S9 readings are taken with Preamp off, Preamp 1 and Preamp 2 in turn.) To measure AGC threshold, the test signal is offset -1 kHz to produce a test tone, and the input level turned down to MDS. The IC-7200 AF Gain control is adjusted for -6 dBr test tone level. The input signal power is then increased until test tone level no longer increases. The test is then repeated with AGC OFF. The actual AGC threshold (knee) is the point at which the AGC OFF test tone level first exceeds that for AGC ON (normal). S dBm S0 -93 S1 -91 S2 -89 S3 -86 S4 S5 S6 S7 S8 S9 S9+10 S9+20 S9+30 -84 -81 -78 -76 -73 -70 -60 -51 -40 Preamp on: S9 = -84 dBm. ATT on: S9 = -50 dBm. Measured AGC threshold (preamp OFF): -95 dBm. S9+40 -32 S9+50 -25 S9+60 -16 13 B. Transmitter Tests 10. CW Power Output. In this test, the RF power output into a 50Ω load is measured at 14.100 MHz in CW or RTTY mode, at a primary DC supply voltage of +13.8V. RF Power Setting Po Meter % Power Output W 75 70 100 100 100 130 11. SSB Peak Envelope Power (PEP). Here, an oscilloscope is loosely coupled to the IC7200 RF output via a line sampler. At 100W CW, the line sampler is adjusted for a peakto-peak vertical deflection of 6 divisions. Test conditions: USB mode, Mic Gain 50, Comp Level 10, supply voltage +13.8V. Speak loudly into the microphone for full-scale ALC reading. Figures 11 & 12 show the envelope for 100W PEP, without and with compression respectively. (Note that here, COMP LVL = 10 to show the effect of compression. In practice, COMP LVL should be 5 or lower.) Figure 11: 100W PEP speech envelope, no compression Figure 12: 100W PEP speech envelope, with compression 14 12. Transmitter 2-tone IMD test. In this test, a 2-tone test signal is applied to the USB port from a tone-generator program running on a laptop computer. A spectrum analyzer is loosely coupled to the IC-7200 RF output via a line sampler. At 100W CW, the line sampler is adjusted for a convenient 0 dBc reference (here 10 dB below reference level.) Test Conditions: DC supply 13.8V, measured at DC power socket. 14100 kHz USB-D, DATA on, D-Mod = u, USB Level 100. Test tones: 700 and 1700 Hz, at equal amplitudes. On computer, adjust USB Codec device volume for -6 dBc test tone level ( = 100W PEP). Figure 13 shows the two test tones and the associated IMD products. Figure 13: Spectral display of 2-tone IMD at 100W PEP. 2-tone IMD Products at 100W PEP IMD Products Relative level (0 dBc = 2-tone PEP) IMD3 (3rd-order) -33 dBc th IMD5 (5 -order) -37 dBc th IMD7 (7 -order) -50 dBc IMD9 (9th-order) -59 dBc 15 13. AM spectrum and THD with single-tone modulation. As in Test 12 above, the spectrum analyzer is loosely coupled to the IC-7200 RF output via a line sampler. On the IC-7200, RF Power is adjusted for 25W resting carrier. The line sampler is adjusted to set the carrier at a convenient 0 dBc reference. A 1 kHz test tone is applied to the USB port from the tone-generator program running on the laptop computer. Test Conditions: 14100 kHz AM, DATA on, Mod = u, USB Level = 100. On computer, adjust USB Codec device volume for -7 dBc test tone level (90% modulation.) Figure 14 shows the carrier and sidebands. Note the additional sidebands due to harmonic distortion at the high modulation level. The 2nd and 3rd harmonics are at -32 and -37 dBc respectively, corresponding to ≈ 2.8% THD. Figure 14: AM carrier and sidebands. Harmonic Sidebands at 25W Carrier, 90% Mod. Harmonic Relative level (0 dBc = carrier) 2nd -33 dBc rd 3 -36 dBc 4th -47 dBc th 5 -58 dBc 16 14. Power-output tests (December 3, 2008). Several IC-7200 owners who operate their radios in mobile/portable configurations or on sailboats have expressed interest in the transmitter output as a function of battery voltage, and also in the DC input current at reduced RF power output. The following tests should address these concerns. Test Conditions: 14.100 MHz, RTTY mode for all tests except 14c: 12V TX IMD (USB-D). 14a. RF power output Po vs. DC input current Iin with supply voltage Vin = 13.8V (as measured at DC input socket). In this test, Po is initially set at 100W via menu, then reduced as per the table. Iin is recorded for each Po value. Vin (V) 13.8 Iin (A) 20 18 16 15 10 9 8 Po (W) 100 75 50 25 20 10 5 The IC-7200's efficiency deteriorates markedly at reduced Po. 14b. Po vs. Vin (as measured at DC input socket). In this test, Vin is initially set at 13.8V, then reduced as per the table. Po is recorded for each Vin value. Vin (V) 13.8 13.0 12.5 12.0 11.5 11.0 Po (W) 100 100 100 95 80 67 14c. Transmitted 2-tone IMD Products at Vin = 12V, Po = 100W PEP. The test procedure here is the same as for Test 12, except that Vin = 12V. 2-tone IMD Products at Vin = 12V, Po = 100W PEP Relative level (0 dBc = 2-tone PEP) IMD Products rd IMD3 (3 -order) -36 dBc th IMD5 (5 -order) -35 dBc th IMD7 (7 -order) -45 dBc th IMD9 (9 -order) -59 dBc Note that IMD5 is worse than IMD3 at reduced Vin. 17 Appendix 2: Issues encountered during review and testing A. Low Baseband Output (ACC Pin 12 and USB Codec Output) IC-7200 S/N 0201013. Test date: 9 October 2008 In the course of Ham Radio Deluxe debugging, it was determined that the PCM level arriving at the Digital Master 780 (DM780) Monitor was very low, even on strong PSK31 signals. The program indicated that the PCM level arriving at the soundcard via the USB line was only 4% of the maximum possible value. This can be seen in Figure 15, where the percentage level shown in the DM780 Monitor window is only 4 to 5% of maximum. This low level greatly reduces the dynamic range of the PSK31/RTTY decoder in HRD. Figure 15: DM780 Monitor for IC-7200 USB Output. To investigate further, I looked at the block diagram of the IC-7200. (Page 16 is an annotated partial block diagram showing the area of interest.) D/A converter IC1292 feeds receiver baseband to the AAFO line, which in turn drives ACC Pin 12 (AF OUT) and USB Codec IC3202. The PCM baseband from the USB Codec is sent in digital form to the PC. I set up a single-tone test as follows: Tune the IC-7200 to 14399 kHz USB-D (Data ON), apply an RF signal at 14100 kHz and -70 dBm (S9) to the antenna socket. Measure the RX baseband (1 kHz test tone) level at ACC Pin 12 with a high-impedance RMS AC voltmeter. The measured voltage at Pin 12 is 30 to 32 mV. Per the user manual, the spec is 100 to 300 mV. I repeated the test on my IC-756Pro3 and IC-703+, and the corresponding baseband levels at ACC1 Pin 4 (AF Out) were 320 mV and 100 mV respectively. I do not think there is an AAFO level adjustment unless there is one in the alignment menu. Not having a service manual, I do not know whether this is the case. I suspect that a firmware change may be required. B. Headphone EMC issue An EMC problem was observed when using a headset plugged into the IC-7200’s PHONES jack. Distorted RF feedback was heard when transmitting SSB; it was quite severe at 100W and much worse at 1 kW. This problem was observed on 40, 20 and 17m only, and disappeared when a dummy load was substituted for the antenna feedline. This issue may have been local to my shack, as Icom were unable to duplicate it. Copyright © 2008 A. Farson VA7OJ/AB4OJ. All rights reserved. December 3, 2008. 18 19