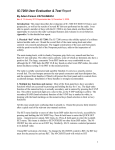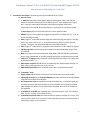
1
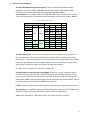
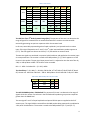
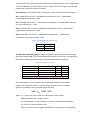
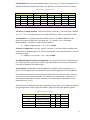
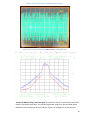
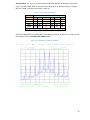
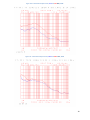
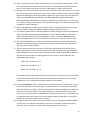
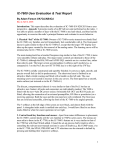
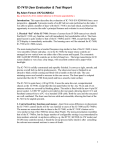
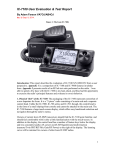
Test Report: Yaesu FT-991, S/N 4N02453 (loaned by Bill Trippett W7VP) Adam M. Farson VA7OJ/AB4OJ, 18-25 July 2015 1. Introduction and Scope: The following tests were conducted on the FT-991: A. Receiver Tests: 1. a: MDS (Minimum Discernible Signal): MDS was measured on 20m in CW and SSB modes, to provide a datum point for the DR3 (2-signal 3rd-order IMD dynamic range) test. It was also measured in SSB mode at the NPR (noise power ratio) notch frequencies in the 160, 80, 60 and 40m bands as required for the calculation of NPR. b: Noise figure (NF) was also measured at 50.1, 144.1 and 432.1 MHz. 2. RMDR (reciprocal mixing dynamic range) was measured at 14.1 MHz with 2, 3, 5, 10, 20 and 50 kHz offset and IPO. 3. DR3 (2-signal 3rd-order IMD dynamic range) was measured using test signals in the 20m band. Test cases were run at 2, 5, 10 and 20 kHz spacing, with all possible preamp settings. The classic non-subtractive DR3 test method was employed. 4. DR2 (2-signal 2nd-order dynamic range) was measured with 6.1 and 8.1 MHz test signals. 5. FM IMD rejection at 20 kHz spacing was measured at 146 and 446 MHz, using the EIA test method. 6. NPR (noise power ratio) was measured at 1940, 3886, 5340 and 7600 kHz in SSB mode with 2.4 kHz IF bandwidth. All possible preamp/roofing filter combinations were tested. 7. Image & 1st IF rejection were measured at 95.01 MHz (the first image of 14.1 MHz) and at the 40.455 MHz 1st IF. 8. AGC impulse response and NB efficacy in suppressing this response were tested at 3.6 MHz, using a pulse generator with 10 ns rise-time. 9. DNR SINAD Improvement was measured at 14.1 MHz, using a distortion meter. B. Transmitter Tests: 1. Power output and autotuner insertion loss were measured at 14.1 and 50.1 MHz. 2. CW keying envelope (2a) and keying sidebands (2b) were measured at 14.1 MHz/100W, using the internal keyer set to 60 wpm. 3. ALC compression tests were performed using voice audio (3a), a 2-tone test signal (3b) and white noise (3c) applied to the MIC input. The objective was to identify increased IMD caused by ALC action, and to check for ALC overshoot. No overshoot whatsoever was detected. 4. Transmitted 2-tone IMD was measured with a spectrum analyser at 3.6, 14.1 and 50.1 MHz. This is a measure of transmitter linearity. 5. Transmitted composite noise was measured with a spectrum analyser at 3.6, 14.1, 50.1, 144.1 and 432.1 MHz. This is a measure of LO phase noise plus the noise contribution of downstream stages in the transmitter. 1 2. Receiver Tests and Results: Test A1a: MDS (Minimum Discernible Signal): This is a measure of ultimate receiver sensitivity. In this test, MDS is defined as the RF input power which yields a 3 dB increase in the receiver noise floor, as measured at the audio output. Test Conditions: ATT off, DNR off, NB off, DNF off, Notch off, Contour off. AGC Slow. Roofing filter: 3 kHz (selected for all modes except AM, FM, C4FM). Test results are shown in Table 1. Table 1: MDS & Noise Figure. MDS dBm NF dB Freq. MHz Mode IF BW IPO AMP 1 AMP 2 3.6 -125 -138 -143 14.1 -125 -137 -144 28.1 -122 -135 -143 CW 500 Hz 50.1 -119 -132 -140 8* 144.1 -142 5 432.1 -143 4 1.94 -118 -131 -137 LSB 3.886 -120 -132 -139 2.4 kHz 5.34 USB -120 -132 -139 7.6 LSB -120 -132 -139 *50.1 MHz NF: IPO, 29 dB. AMP1, 17 dB. AMP2, 8 dB. Test A1b: Noise Figure: A noise source is connected to the antenna port via a precision DC - 2 GHz step attenuator. First, the antenna port is terminated in 50and a 0 dBr receive audio reference set. Then, the noise source is connected and the noise loading adjusted for a +3 dBr audio level. The attenuator setting is noted. As the noise source is calibrated, its noise power density PSD (in dBm/Hz) is known. Noise figure NF is derived as follows: NF ≈ PSD - ATT +174 where ATT = attenuator setting in dB. Test A2: Reciprocal mixing dynamic range (RMDR): In this test, a strong "undesired" signal is injected into the receiver's RF input at a fixed offset Δf from the operating frequency. The RF input power Pi is increased until the receiver noise floor increases by 3 dB, as measured at the audio output. RMDR is the difference between this RF input power and measured MDS. The test is run with preamp off. The higher the RMDR value, the better. If RMDR is lower, than DR3, reciprocal mixing noise is the dominant impairment and vice versa. Test Conditions: f0 = 14100 kHz, CW mode, 500 Hz IF BW, IPO (preamp off), ATT off, DNR off, NB off, DNF off, Notch off, Contour off. AGC Slow, offset relative to virtual carrier. RMDR in dB = input power – MDS (both in dBm). Test results are shown in Table 2. 2 Table 2: Reciprocal Mixing Dynamic Range RMDR f0 MHz 14.1 144.1 432.1 Δf kHz Pi dBm RMDR dB Pi dBm RMDR dB Pi dBm RMDR dB 1 -55 70 2 -48 77 -78 64 -96 47 3 -45 80 -75 67 -82 61 5 -39 86 -70 72 -76 67 7 -35 90 10 -30 95 -61 81 -67 76 20 -23 102 -54 88 -58 85 50 -19 106 -46 96 -59 84 Test A3: 2-signal 3rd-order IMD dynamic range(DR3): The purpose of this test is to determine the range of signals which the receiver can tolerate while essentially generating no spurious responses. In this test, two signals of equal amplitude Pi and separated by a known offset Δf are combined and injected into the receiver input. If the test signal frequencies are f1 and f2, the offset Δf = f2 - f1 and the 3rd-order intermodulation products appear at (2 f2 - f1) and (2 f1 - f2). The two test signals are combined in a passive hybrid combiner and applied to the DUT antenna input via a step attenuator. The receiver is tuned to the upper and lower 3rd-order IMD products (2f2 – f1 and 2f1 - f2 respectively) which appear as a 700 Hz tone in the speaker. The per-signal input power level Pi is adjusted to raise the noise floor by 3 dB, i.e. IMD products at MDS. The Pi values for the upper and lower products are recorded. DR3 is calculated by subtracting MDS from the worst-case Pi value. Note: If the audio output drops by less than 3 dB when one of the test signals is removed, the measurement is noise-limited (indicated by NL in Table 3.) The test signal frequencies can also be varied slightly to verify that the measured IMD products are genuine and not spurs. DR3 = Pi - MDS. Calculated IP3 = (1.5 * DR3) - MDS Test Conditions: f1 = 14.100/144.100/432.100MHz, f2 = (f1 + Δf ) kHz, 500 Hz CW, ATT off, DNR off, NB off, DNF off, Notch off, Contour off. AGC Slow. CW Pitch = 700 Hz. DR3 in dB; IP3 in dBm. NL = reciprocal mixing noise limited (IMD + reciprocal mixing). Test results are shown in Table 3. 3 Table 3: DR3 and IP3 f1 MHz Δf kHz MDS dBm Preamp Pi dBm DR3 dB IP3 dBm NL 2 -125 IPO -54 71 -18.5 Y 2 -137 AMP 1 -68 69 -33.5 Y 14.1 2 -144 AMP 2 -69 74 -33 Y 5 -125 IPO -39 86 +4 Y 20 -125 IPO -23 102 +28 2 -79 63 -47.5 Y 144.1 5 -142* IPO -71 71 -35.5 Y 20 -53 89 -8.5 2 -78 65 -45.5 Y 432.1 5 -143* IPO -58 85 -15.5 Y 20 -39 104 +13 * No selectable preamp for VHF/UHF. Test A4: Two-Tone 2nd-Order Dynamic Range (DR2): The purpose of this test is to determine the range of signals far removed from an amateur band which the receiver can tolerate while essentially generating no spurious responses within the amateur band. In this test, two widely-separated signals of equal amplitude Pi are injected into the receiver input. If the signal frequencies are f1 and f2, the 2nd-order intermodulation product appears at (f1+ f2). The test signals are chosen such that (f1 + f2) falls within an amateur band. The two test signals are combined in a passive hybrid combiner and applied to the receiver input via a step attenuator. The receiver is tuned to the IMD product (f1 + f2 ) which appears as a 700 Hz tone in the speaker. The per-signal input power level Pi is adjusted to raise the noise floor by 3 dB, i.e. IMD product at MDS. The Pi value is then recorded. DR2 = Pi - MDS. Calculated IP2 = (2 * DR2) + MDS. Test Conditions: f1 = 6.1 MHz, f2 = 8.1 MHz, 500 Hz CW, ATT off, DNR off, NB off, DNF off, Notch off, Contour off. AGC Slow. CW Pitch = 700 Hz. IMD product at 14.2 MHz. DR3 in dB; IP3 in dBm. Table 4: DR2. MDS in dBm, DR2 in dB, IP2 in dBm. Preamp MDS, 14.2 MHz IPO -125 AMP 1 -137 AMP 2 -144 DR2 106 106 108 IP2 +87 +75 +72 Test A5: FM IMD Rejection, EIA Method: The purpose of this test is to determine the range of signals which the receiver can tolerate in the FM mode while producing no spurious responses greater than the SINAD level. Two test signals f1 and f2 of equal amplitude and spaced 20 kHz apart are applied to the DUT antenna port. The signal 40 kHz removed from the IMD product being measured is modulated at 1 kHz, with 3 kHz deviation. The receiver is tuned to the IMD products (2f1- f2) and (2f2- f1). 4 The test signal levels are then increased simultaneously by equal amounts until the IMD product reads 12 dB SINAD on the audio distortion meter. The DR values for the upper and lower IMD products are averaged to yield the final result. Test Conditions: ATT off, DNR off, NB off. Distortion meter connected to DUT audio output. 2m, I: 146 MHz, FM, 15 kHz. f1 = 146.000 MHz modulated at 1 kHz, f2 = 146.020 MHz unmodulated. Peak deviation = 3 kHz. 2m, II: 146 MHz, FM, 15 kHz. f1 = 146.000 MHz unmodulated, f2 = 146.020 MHz modulated at 1 kHz. Peak deviation = 3 kHz. 70cm, I: 446 MHz, FM, 15 kHz. f1 = 446.000 MHz modulated at 1 kHz, f2 = 446.020 MHz unmodulated. Peak deviation = 3 kHz. 70cm, II: 446 MHz, FM, 15 kHz. f1 = 446.000 MHz unmodulated, f2 = 446.020 MHz modulated at 1 kHz. Peak deviation = 3 kHz. Table 5. FM IMD Rejection at 20 kHz spacing. Freq. MHz IMD Rej. dB 146 70 446 80 Test A6: Noise Power Ratio (NPR): An NPR test was performed, using the test methodology described in detail in Ref. 1. The noise-loading source used for this test was a noise generator fitted with the following selectable filter pairs (bandstop & band-limiting filters): Table 6: Noise Generator Filter Pairs Bandstop filter f0 kHz Band limiting filter kHz BRF kHz BWR dB 1940 60 - 2048 1985 29.2 3886 60 - 4100 4037 32.3 5340 60 - 5600 5537 33.6 7600 316 - 8100 7781 35.1 Bandstop filter stopband: depth ≈ 100 dB, width ≈ 3 kHz. The noise loading PTOT was increased until the audio level measured at the external speaker jack increased by 3 dB. PTOT was read off the attenuator scale on the noise generator, and NPR was then calculated using the formula NPR = PTOT - BWR - MDS where PTOT = total noise power in dBm for 3 dB increase in audio output BWR = bandwidth ratio = 10 log10 (BRF/BIF) BRF = RF bandwidth or noise bandwidth in kHz (noise source band-limiting filter) BIF = receiver IF filter bandwidth in kHz MDS = minimum discernible signal (specified at BIF), measured prior to NPR testing 5 Test Conditions: Receiver tuned to bandstop filter centre freq. f0 ± 1.5 kHz, 2.4 kHz SSB, ATT off, DNR off, NB off, DNF off, Notch off, Contour off, AGC Slow. Test results are shown in Table 5. Table 7: Noise Power Ratio (NPR) BIF = 2.4 kHz IPO AMP 1 AMP 2 f0 kHz BWR dB Mode PTOT dBm NPR dB PTOT dBm NPR dB PTOT dBm NPR dB 1940 29.2 LSB -13 75 -22.5 79 -27.7 80 3886 32.3 LSB -10.3 77 -25.2 74 32.3 75 5340 33.6 USB -11.2 75 -26.6 71 -35.8 69 7600 35.1 LSB -12.6 72 -27.1 69 -35.2 68 Note: Roofing filter always 3 kHz. Test A7a: 1st-IF Image Rejection: In this test, the DUT is tuned to f0, and a test signal is applied at f0 + 2 * 1st IF. The test signal power is increased sufficiently to raise the noise floor by 3 dB. Test Conditions: f0 = 14.1 MHz, CW, 500 Hz IF filter, IPO, ATT off, DNR off, NB off, DNF off, Notch off, Contour off, AGC Slow. Test signal freq. = (2 * 40.455) + 14.1 = 95.01 MHz. Measured MDS = -125 dBm. For 3 dB noise floor increase: Pi = -10 dBm. Image rejection = -10 - (-125) = 115 dB. Test A7b: 1st-IF Rejection: In this test, the DUT is tuned to f0, and a test signal is applied to the antenna port at the 40.455 MHz 1st IF. The test signal power is increased sufficiently to raise the noise floor by 3 dB. Pi = -10 dBm. 1st IF rejection = -10 – (-120) = 110 dB. Test A8a: AGC impulse response and suppression: The purpose of this test is to determine the DUT’s AGC response in the presence of fast-rising impulsive RF events. Pulse trains with short rise times are applied to the receiver input. Test Conditions: 3.6 MHz LSB, 2.4 kHz SSB, NB off/on, IPO/AMP 2, AGC Fast (decay time at 20 ms), ATT off, DNR off, DNF off, Contour off. Step attenuator adjusted for S7 with AMP2 on. The pulse generator output is connected to the antenna port via a step attenuator. Pulse rise time < 10 ns (to 70% of peak amplitude). Pulse duration is increased until a “sweet spot” is observed (no audible ticks or S-meter deflection.) In all cases, pulse period is 600 ms. Pulse amplitude is 16Vpk (e.m.f.) The AGC recovers completely within the preset decay interval; there is no evidence of clamping. Each pulse produces a distinct tick in the speaker, and the S-meter flicks upwards (Table 6). Table 8: AGC impulse response. Pulse duration ns 10 30 50 100 560 (sweet spot) AGC recovery ms Ticks S: IPO S: AMP 2 ≈ 100 (no clamping) Y S0 S3 ≈ 100 (no clamping) Y S0 S5 ≈ 100 (no clamping) Y <S1 S6 ≈ 100 (no clamping) Y S1 S7 No AGC effect N S0 S0 6 Test A8b: NB action on AGC impulse response: At 12.5 ns pulse duration and 50% NB level, the DSP noise blanker reduces S-meter deflection from S3 to ≈ S1, but does not suppress the ticks. With DNR at maximum and NB at 50%, the ticks are suppressed but the S-meter still deflects on the pulses. With DNR at maximum and NB off, faint ticks are still heard. Test A9: DNR SINAD Improvement: In this test, a test signal is applied to the DUT antenna input and a distortion meter is connected to the audio output. The input level is adjusted for 6 dB SINAD with DNR off. DNR is then activated and its level increased. The SINAD improvement for each DNR step is recorded. Test Conditions: 14.1 MHz USB, 2.4 kHz BW, IPO, AGC Fast. ATT off, DNR off, NB off, DNF off, Contour off. Input level set for 6 dB SINAD. Table 9: DNR SINAD improvement. DNR off 1 2 3 4 SINAD dB -6 -26 -26 -24 out of range Improvement dB 0 -20 -20 -18 -- 7 3. Transmitter Tests and Results: Test B1: Transmitter power output: The FT-991 was terminated in 50Ω resistive, and the DC supply current, RF power output and ATU insertion loss checked in RTTY mode. Test Conditions: 13.8V DC supply, RTTY mode, PO at 100%, Menus 139-141 MAX TX PWR at maximum. Test results in Table 10. Table 10: Maximum TX output, DC supply current & ATU loss. Freq. MHz 1.6 14.1 28.1 50.1 144.1 432.1 IIN A PO W ATU loss dB 16.4 115 < 0.1 15.8 105 < 0.1 15.4 104 < 0.1 14.7 105 < 0.1 11.1 55.3 13.2 56.3 Test B2a: CW keying envelope: The oscilloscope is terminated in 50 and coupled to the DUT RF output via the line sampler. A series of dits is transmitted from the internal keyer at 60 wpm. Test Conditions: 14.1MHz CW, 100W output to 50Ω load. Keying speed 60 wpm using internal keyer. CW rise time = 4 ms (default) & 6 ms. Refer to Figures 1 and 2 below. Figure 1: CW keying envelope, 60 wpm, 4 ms rise-time, 100W. 10 ms/hor. div. 8 Figure 2: CW keying envelope, 60 wpm, 2ms rise-time, 100W. 10 ms/hor. div. Test B2b: CW keying sidebands: The spectrum analyser is coupled to the DUT RF output via the line sampler. The -10 dBm reference level equates to 100W. A series of dits is transmitted at 60 wpm. Test Conditions: 14.1 MHz CW, 100W output to 50Ω load. Keying speed 60 wpm using internal keyer. CW rise-time = 4 ms (default) & 2 ms. Spectrum analyser RBW is 10 Hz, video-averaged; sweep < 4 sec. Figure 3 shows the transmitter output ±5 kHz from the carrier. It will be seen that the rise-time has little effect on the keying spectrum. 9 Figure 3. Spectral display of keying sidebands. Test B3: ALC compression tests: The purpose of these tests is to identify increased transmitter IMD caused by ALC action at high baseband levels, and to check for ALC overshoot (power spikes). It should be noted here that no overshoot whatsoever was detected. These tests were performed using mic voice audio, and also a 2-tone test signal and white noise applied digitally to the USB port. Test B3a: ALC compression test using voice audio: The oscilloscope is terminated in 50 and coupled to the DUT RF output via the line sampler. The stock MH-31 mic is connected to the DUT MIC input. Test Conditions: 14.1 MHz USB, Menu 139 HF MAX TX PWR = 100W. Menu 112 SSB TX BPF 3002700 Hz, PROC off, MIC EQ off. Mic Gain adjusted for ≈ 15% ALC meter reading on voice peaks (Figure 4), then for no ALC activity (Figure 5). Severe ALC compression can be seen in Figure 4. In Figure 5, measured output is 81W PEP, but there is no ALC compression. No ALC overshoot or spike was observed at any time during this test. 10 Figure 4: SSB RF envelope at 100W PEP, ≈ 15% ALC. Note severe ALC compression on voice peaks. Figure 5: SSB RF envelope at 100W PEP nominal (81W PEP measured), 0% ALC. No ALC compression. Test B3b: ALC compression test using 2-tone test signal: The oscilloscope terminated in 50is connected to the DUT RF output via a suitable power attenuator. A tone/noise generator program in the connected laptop feeds the 2-tone test signal to the DUT USB port. Test Conditions: 14.1 MHz USB, Menu 139 HF MAX TX PWR = 100W. PROC off, Menu 112 SSB TX BPF 300-2700 Hz. Test signal level adjusted for no ALC activity (measured output 81W PEP). 11 Figure 5 illustrates an ideal 2-tone SSB envelope, and Figure 7 shows some flattopping on peaks due to ALC compression The flat-topping is a sign of degraded linearity, as confirmed by Fig. 11b. No ALC overshoot or spike was observed at any time during this test. Figure 6: Ideal 2-tone SSB envelope. Figure 7: 2-tone RF envelope at 81W PEP (measured). Note ALC compression on peaks. 12 Test B3c: ALC compression tests using white noise: The test instrument (oscilloscope terminated in 50then spectrum analyser) is cnnected to the DUT RF output via the power attenuator. The tone/noise generator program in the connected laptop feeds white noise to the DUT USB port. Test Conditions: 14.1 MHz USB, Menu 139 HF MAX TX PWR = 100W. PROC off, Menu 112 SSB TX BPF 300-2700 Hz. Noise gen. output adjusted for 50W PEP, then for 100W PEP. A short overshoot spike (100W max. amplitude) was observed on HF and 6m, but not on 2m or 70cm, when unkeying the transmitter with white noise modulation. It was not possible to capture it in a screenshot. The overshoot did not appear with speech input via the mic. In Figure 10, we see that at 105W PEP output, the skirts caused by IMD products begin 15-20 dB higher up the transmit filter flank than at 50W PEP (0% ALC). The skirts are also wider for the 105W case. These are signs that the transmitter IMD degrades rapidly as PO approaches 105W. This is the result of ALC compression, and is also confirmed by Fig. 11b. Figure 8: White noise RF envelope at ≈ 50W PEP. Occasional ALC overshoot to 100W on unkeying. 13 Figure 9: White noise RF envelope at 100W PEP. No ALC overshoot. Figure 10: Spectrogram of white noise at 100W & 50W PEP, showing IMD skirts. Test B4: TX IMD test using 2-tone test signal: The spectrum analyser is connected to the DUT RF output via the power attenuator. The tone/noise generator program in the connected laptop feeds the 2-tone test signal to the DUT USB port. Figures 11a through 11e are the test plots. 14 Test Conditions: 3.6, 14.1, 50.1, 144.1 and 432.1 MHz SSB, Menus 139 through 142 at default (max.) Test tones 700 & 1700 Hz. Test tone levels adjusted for -6 dBc (both tones). -10.0 dBm REF LEV = 100W. Test results are shown in Table 11. Table 11: 2-tone TX IMD at 100W PEP. Rel. Level dBc (ref. 1 of 2 tones) Freq. MHz 3.6 14.1 14.1/80W 50.1 144.1 IMD3 -20 -22 -27 -18 -20 IMD5 -32 -33 -33 -32 -40 IMD7 -40 -40 -44 -40 -41 IMD9 -44 -44 -46 -43 -45 For IMD ref. 2-tone PEP, subtract 6 dB. 432.1 -18 -33 -44 -45 Note that at 80W PEP on 14.1 MHz, IMD is a few dB lower than for 100W. This is an effect of ALC compression (refer to Tests B3a, B3b and B3c above.) Figure 11a: 2-tone IMD at 3.6 MHz LSB, 100W PEP. 15 Figure 11b: 2-tone IMD at 14.1 MHz USB, 100W & 80W PEP. Figure 11c: 2-tone IMD at 50.1 MHz USB, 100W PEP. 16 Figure 11d: 2-tone IMD at 144.1 MHz USB, 50W PEP. Figure 11e: 2-tone IMD at 432.1 MHz USB, 50W PEP. 17 Test B5: Transmitted composite noise. As before, the The spectrum analyser is connected to the DUT RF output via the power attenuator. The spectrum analyser’s phase-noise utility is started. Figures 12a through 12c are the resulting composite-noise plots. (Note: The limitation of this measurement method is that the lowest values of measured noise power are close to the spectrum analyser’s own noise floor.) Test Conditions: 3.6, 14.1, 50.1 MHz RTTY, 100W output to 50Ω load. 144.1, 432.1 MHz RTTY, 50W output to 50Ω load. Utility minimum/maximum offset and spot frequencies configured as shown in Figures 12a through 12c. Figure 12a: Transmitted composite noise, 3.6 and 14.1 MHz, 100W. 18 Figure 12b: Transmitted composite noise, 14.1 and 50.1 MHz, 100W. Figure 12c: Transmitted composite noise, 144.1 and 432.1 MHz, 100W. 19 4. Comments on test results: 4.1. It will be seen from Tables 2 (RMDR) and 3 (DR3) that at 2 kHz spacing, the measured 77 dB RMDR value exceeds measured DR3 by 3 dB. This indicates that although the measurement is phase-noise limited, there is still a measurable component due to front-end non-linearity. At 5 kHz spacing, RMDR and DR3 are both 86 dB, indicating a fairly rapid improvement in DR3 and RMDR between 2 and 5 kHz spacing. This is borne out by the 14.1 MHz curve in Figure 12a. 4.2. The results in Table 3 (NPR) for the IPO test cases are in the “mid to upper mid” range of the NPR test data presented in Tables 1 and 1a of Ref. 1. Some NPR degradation is seen in the AMP 1 and AMP 2 test cases; this is to be expected, as it is likely that the high noise loading will tend to overload the preamps, causing many distortion products which will degrade the test results. Overall, the NPR performance compares very well with that of comparable transceivers such as the FT-1200 and FT-950 (see Ref.1). The increase in NPR reading at 1940 kHz with AMP1 and AMP2 selected suggests slight passive IMD in the 160m RF BPF; with the preamps in the signal path, the noise loading PTOT applied to the filter decreases. The noise attributable to the passive IMD will fall off steeply as it is a 2nd, 3rd and higher order effect. 4.3. As one would expect of a high 1st IF (“up-conversion”) superhet architecture, image and 1st IF rejection are superb (115 and 110 dB respectively). These figures are unattainable with an inband (“down-conversion”) 1st IF design. 4.4. The FT-991 exhibits the AGC response to fast-rising impulsive RF events typical of many IF-DSP based receivers, but the DSP noise blanker and noise reduction mitigate this response quite effectively without compromising received audio quality. 4.5. CW keying characteristics appear very good, judging by the tests performed. The keying envelope is clean, and the CW spectrum is quite narrow (< 1.5 kHz at -50 dBc) and free of keying artefacts. 4.6. As mentioned in the test descriptions above, no trace of ALC overshoot or spikes was observed at any time except for an occasional 100W spike on unkeying when transmitting white noise. Nonetheless, ALC compression is quite aggressive in the 80 – 105W PEP range. Transmitter IMD degrades rapidly at 80W < PO < 100W. It thus appears desirable to transmit SSB at 80W PEP or less, or just below the onset of ALC meter deflection. 4.7. Measured transmitter IMD3 at rated power output is worse than the ITU-R guideline of -25 dBc (referred to one of two equal tones). IMD3 is especially degraded on 6m and 70cm. The higherorder IMD results are acceptable. Transmitted composite noise is comparable to that of other transceivers in the FT-991’s price category. 4.8. Overall, it is felt that the FT-991 is a good contender in the fairly crowded mid-price HF+ group. Its VHF/UHF coverage will appeal to purchasers desiring a compact home station or a mobile/portable setup. 5. Comments regarding “on-air” testing: 5.1 After building a TUN/LIN to PTT cable, I was able to connect the FT-991 to my Quadra amplifier as Exciter #2. I used a tip/ring/sleeve 3mm plug cable to dual RCA audio cable to connect the ALC and Band Data 2 (TX REQ) lines. The FT-991 drove the Quadra to 1 kW output to my Cushcraft R8 vertical antenna with ≈ 65W drive power; the ALC, F SET and TUNE functions worked flawlessly. In general, I found the integration of the FT-991 into my station very straightforward. 20 5.2 Next, I made contact with a group of friends who run an evening round-table on 40m. As they are acquainted with the sound of my regular station, I felt that they would be well-placed to give me critical audio reports and assist me in optimising the FT-991’s audio settings. 5.3 During the first on-air test session, there was an S9 electrical noise level on 40m. This may have been emanating from a wet HV power-line or from nearby industrial sources. I found that DNR (Digital Noise Reduction) alone was ineffective against this raspy buzzing noise, but that NB in conjunction with DNR was quite effective. By adjusting NB LEVEL, Menus 023/ 024 NB WIDTH/REJECTION and DNR LEVEL, I was able to suppress the electrical noise – but at the cost of a “watery, burbling” sound quality in the received voice signals. This effect compromised the intelligibility of weak SSB signals. 5.4 When using DNR alone to reduce the band noise level on a reasonably quiet band, the same “watery, burbling” effect was audible for DNR level settings higher than 2 or 3. 5.5 The IF Notch (manual notch) and DNF (Digital Notch Filter) were quite effective in suppressing single and multiple interfering tones, respectively. As the IF Notch is within the AGC loop, it prevents an unwanted carrier from swamping the receiver. I found the NARROW setting (Menu 116) most effective. DNF is post-AGC, and can be used in conjunction with IF Notch. 5.6 The IF SHIFT and WIDTH controls were very handy for tailoring the IF filter passband to the bandwidth of the received signal. During this test, the SSB receive audio filters (Menus 104 – 107) were at their default settings. 5.7 Transmit audio setup was the next step. Initial reports with MIC GAIN 33, MIC EQ off and PROC (compression) set for ≈ 6 dB of compression on voice peaks were that my transmitted audio “had plenty of presence, but was nasal and muffled”. I used the stock MH-31 hand mic. I was able to improve matters by reducing Mic Gain from 33 to 25, setting PROC OFF and adjusting MIC EQ as follows: Menus 121-123: 300 Hz, -15, 2 Menus 124-126: 900 Hz, -8, -2 Menus 127-129: 2100, +10, +2 One member of the group made a sound-clip and played it back to me over the air; it sounded fairly clean and easy to copy. With a better microphone and more effort put into the audio configuration, I am confident that excellent results will be attainable. 5.8 I found the ergonomics and user interface of the FT-991 much easier to master than in any of my previous encounters with Yaesu radios. I found the colour TFT touch screen aesthetically attractive and easy to navigate. There are essentially three levels; the highest is the default or power-up screen, which presents the A & B VFO displays, scope and meter as well as main control touch-keys which can be changed from the next level down (F key). If a control key has an adjustable value e.g. RF PWR, this is set by rotating the MULTI knob which is temporarily assigned to that function when the key is touched. 5.9 Although the spectrum scope is non-real-time (single-shot), its resolution bandwidth (RBW) is ≈ 2 kHz. Thus, the scope will clearly display two carriers 2 kHz apart. As the scope function “borrows” the main receiver, reception is briefly muted during scope sweep. 21 5.10 The third level down is the rolling menu list, which is accessed by pressing the MENU (SETUP) button. Each menu is identified by a 3-digit number and an easily understood descriptor in plain English with some acronyms. The displayed alphanumerics are easily legible. This is a significant improvement over previous Yaesu models, which attempted to form characters from available segments on a vacuum-fluorescent or LED display. This forced the user to refer constantly to the user manual. I found that once I had mastered the basics, I was usually able to change settings without consulting the manual. 5.11 To set a menu item, the MULTI knob is rotated to select the desired item. The SELECT softkey is touched, and then the desired value is selected by rotating the MULTI knob again. When done, the ENTER and BACK softkeys are touched to return to the previous display level. 5.12 In concluding, I would say that the FT-991 is a very pleasant radio to operate. It is wellconstructed and nicely engineered, has a very reasonable learning curve for a user not accustomed to Yaesu HF transceivers, and handles itself very well for a radio in its price category. 6. References: 1. “Noise Power Ratio (NPR) Testing of HF Receivers”, A. Farson VA7OJ/AB4OJ. http://www.ab4oj.com/test/docs/npr_test.pdf 2. Yaesu FT-991 Operating Manual. Adam Farson VA7OJ/AB4OJ e-mail July 25, 2015 Copyright © 2015 A. Farson VA7OJ/AB4OJ, including images. All rights reserved. 22