1
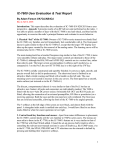
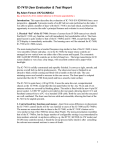
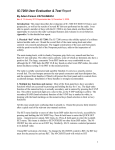
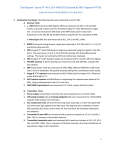
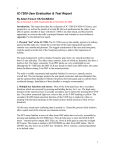
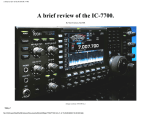
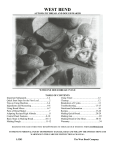
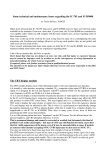
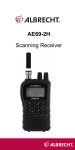
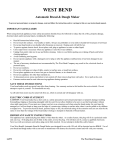
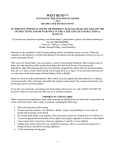
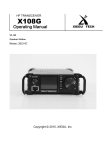
IC-7100 User Evaluation & Test Report By Adam Farson VA7OJ/AB4OJ Iss. 3, Sept. 9, 2014. Figure 1: The Icom IC-7100. Introduction: This report describes the evaluation of IC-7100 S/N 02001352 from a user perspective. Appendix 1 is a comparison of IC-7100 and IC-7000 features in tabular form. Appendix 2 presents results of an RF lab test suite performed on the radio. I was able to spend a few days with the IC-7100 in my ham-shack, and thus had the opportunity to exercise the radio’s principal features and evaluate its on-air behavior. 1. Physical “feel” of the IC-7100: The packaging of the IC-7100 represents somewhat of a new departure for Icom. It is a “2-piece” radio consisting of a main unit and a separate control head. Unlike the IC-7000, IC-706 series and IC-703, though, the control head is in the form of a small sloping-front console and cannot be attached to the main unit. The IC-7100 features a large touch-screen display, which offers easy band/mode selection and navigation through the radio’s menus. Owners of current Icom IF-DSP transceivers should find the IC-7100 quite familiar, and should feel comfortable with it after a little familiarization with the touch-screen. In addition to the display, the control head has a number of feature keys below the display and two concentric knobs (AF, power on/off, RF/Squelch) and multi-function (memory/Twin PBT/RIT/Mic Gain/RF Power) to the right of the display. The learning curve will be minimal for owners of other Icom IF-DSP radios. 1 The main tuning knob is lightly detented and has a knurled Neoprene ring; it turns very smoothly with minimal side-play. RJ-45 jacks for the control and mic cables, and 3.5mm PHONES and ELEC KEY jacks, are on the rear panel of the control head. A slide switch on the bottom of the control allows connection of an external speaker or headphones to the PHONES jack. The supplied HM-198 hand mic, the optional HM-151 control mic or the OPC-589 8-pin round/modular adapter cable can be plugged into the mic jack. The IC-7100 is solidly constructed and superbly finished. It conveys a tight, smooth, and precise overall feel (as do other Icom radios). The main unit is built in a die-cast alloy chassis, and its sheet-steel case is finished in an attractive black crinkle coating. The control head has a smooth, matte surface. The IC-7100 main unit weighs 2.3kg and the control head 500g. The radio is fitted with the new 4-pin DC power socket. A mini-USB socket is provided on the rear panel, allowing direct CI-V and baseband connectivity to a PC via the supplied USB cable. Both the case and the rear panel are well-ventilated. The air-intake grille and the SD card slot are on the front panel of the main unit. 2. Control knob/key and touch-screen functions and menus: Apart from some differences in placement, the IC-7100’s control knobs will be familiar to users of the IC7000, IC-706 series and IC-703. The concentric multi-function controls and MIC GAIN/RF-SQL knobs are to the left of the screen. The multi-function controls are multi-turn and detented. The large monochrome touch-screen displays a very clear, crisp image, with excellent contrast and a white backlight. The touch-activated menu softkeys in the lower field of the screen change with menu selection via the MENU key. Pressing the MIC/RF PWR or SPEED/PITCH key in the lower row (below the screen) redefines the multi-function controls correspondingly, and an appropriate pop-up is displayed in the lower field of the screen. I found that even with a bright desk lamp shining on it, the display was still highly legible and did not “wash out”. Figure 2: Control head, with screen and panel. 2 Pressing the inner multi-function knob switches the controls to Twin PBT. A bandwidth/shift pop-up appears, and the green PBT LED is lit. When the RIT key is pressed, the yellow RIT LED is lit. Pressing the inner knob now toggles between memory, PBT and RIT functions. When RIT is activated, an RIT pop-up is displayed. Pressing and holding the inner knob now clears the PBT or RIT setting (as selected). The menus are somewhat akin to those in other Icom radios, allowing for the addition of menus for D-Star Digital Voice (DV) and GPS functions. The row of touch-activated menu softkeys at the bottom of the screen, in effect, adds a third row of feature keys to the control head. I found the set-up process fairly intuitive after consulting the relevant user-manual sections in cases of doubt. Icom continues the use of a “Smart Menu” system which changes available functions based on the mode currently in use. Menus are selected by pressing the MENU key on the bottom left of the screen; this key also serves as an EXIT key. Menu selections with default values can be returned to default by pressing and holding their DEF softkey. For several menu items, the F-3 key serves this purpose even though it is not marked DEF. Touching the leading (MHz) digits of the frequency display opens a band-selection matrix; the desired band is selected by touching its designator. Mode selection is similar; touching the current mode icon opens the mode-selection matrix. Tuning steps for kHz and Hz are set by touch, or by touch/hold, on the respective digit groups. In addition a touch-matrix can be opened for DTMF digit keysending. The filter selection and adjustment procedure is similar to that on other Icom DSP radios. Touch the FIL-(n) icon to toggle between FIL-1, FIL-2 and FIL-3. Touch and hold this icon to adjust the filter bandwidth and select CW/SSB Sharp/Soft shape. All IF filters are continuously adjustable. As in other Icom IF-DSP radios, filters with 500 Hz or narrower bandwidth have the BPF shape factor, but a non-BPF filter can be configured via Twin PBT. The P.AMP/ATT key toggles between preamps 1 sand 2, and a 20 dB RF attenuator. The DR key brings up the D-Star (DV) menu. The SET key opens easily navigable setup menus, and the QUICK key opens a menu of common feature selections. Many of the menu values can be selected by touching a bar, and touch arrows for up/down scrolling and return to the previous screen are provided. The DR key accesses a D-Star repeater setup menu, facilitating D-Star service configuration. The DR mode is the “enhanced” user interface for VHF/UHF D-Star operation. For HF D-Star, or for those more accustomed to the basic D-Star operation, simply selecting DV will give access to the D-Star mode. The Time-Out Timer feature limits transmissions to a preset duration (3, 5, 10, 20 or 30 minutes, selectable by menu.) The PTT Lock function inhibits transmit. This feature is useful when receiving via active antennas or mast-mounted preamplifiers without T/R switching, or to avoid damaging test equipment when conducting receiver measurements. 3 Being a current IC-7700 and IC-7600 owner, I found that the IC-7100’s controls and menus fell readily to hand. A user familiar with a radio such as the IC-756Pro3 or IC7000 should find the IC-7100’s learning curve manageable. The IC-7100’s default settings are very usable, allowing the radio to be placed in service with minimal initial set-up. 3. LCD display screen: The monochrome LCD screen is 80 x 50mm (H x W). The display is very bright and crisp, and presents all radio parameters. The display layout is somewhat similar to that of the IC-7410. The IC-7100 offers a limited, non-real-time spectrum scope and SWR Plot indicator very similar to those of the IC-7000. To use SWR Plot (IC-7100 user manual, p. 6-14): 1. Tune VFO to desired SWR measuring frequency. 2. In Menu M-3, touch SWR. 3. Touch SET, then set desired SWR measuring step size. 4. Touch ►■ to start sweep. ▲mark below the graph bar shows sweep progress. 5. When sweep is complete, an SWR/frequency bar-graph is displayed. The spectrum scope is initiated via menu and displays an approximate, qualitative histogram of band occupancy in the lower field of the screen. It mutes the receiver during its acquisition cycle. Scope span is configurable in the range 0.5 to 25 kHz. The SWR indicator operates in a similar manner. Touching the currently-displayed meter scale toggles between scales. Touching and holding the meter scale opens the multi-function meter, which displays all scales simultaneously. The Notch, NR and NB keys, and the Twin PBT controls, open pop-ups in the lower field of the screen. These can be used to select notch width, NR level, NB parameters and filter/PBT bandwidth respectively. 5. USB interfaces: The IC-7100 is equipped with a rear-panel mini-USB “B” port. The radio can be directly connected via the “B” port to a laptop or other PC via the supplied USB cable. This is without doubt one of the IC-7100’s strongest features. The USB port transports not only CI-V data, but also TX and RX PCM baseband between the IC-7100 and the computer. As a result, the USB cable is the only radio/PC connection required. Gone forever is the mess of cables, level converters and interface boxes! This feature is now standard on all Icom HF radios released since 2009. An Icom driver is required in the PC; this is downloadable from the Icom Japan World website. Note that not all rig-control software will support the IC-7100; the CI-V PTT command, introduced with the IC-756Pro3, has encountered issues with certain programs such as MMTTY. 6. Filter selections and Twin PBT: As do the other Icom DSP transceivers, the IC-7100 offers fully-configurable RX IF selectivity filters for all modes. Three default filter selections are available via the touch-screen for each mode, with continuously variable bandwidth via the FILTER menu. In addition, there are selectable Sharp and Soft shape factors for SSB and CW. The BPF filter configuration feature (for filter bandwidths of 500 Hz or less) operates in the same manner as on other Icom IF-DSP radios. 4 Twin PBT is one of the modes of the concentric multi-function controls. Pressing and holding the inner knob [CLR] restores PBT to neutral. The TPF menu item in the RTTY SET menu selects the Twin Peak Filter (TPF) in RTTY mode. No CW APF (Audio Peak Filter) is provided. However, the CW RX LPF and HPF in the TONE SET menu are a reasonable alternative to the "missing" APF; their ranges are 100 - 2000 and 500 - 2400 Hz respectively. The HPF and LPF can be set to "bracket" the received CW tone in a tight 100 Hz audio bandwidth. The DEF softkey restores these filters to default (off). 7. BPF vs. non-BPF filters: As in other Icom IF-DSP radios, the IC-7100 allows the user to select two additional shapes for 500 Hz or narrower filters, in addition to SHARP and SOFT. These are BPF (steeper skirts) and non-BPF (softer skirts). To configure a BPF filter, select a 500 Hz or narrower CW, RTTY or SSB-D filter with Twin PBT neutral. To set up a non-BPF filter, select a filter with BW > 500 Hz, and narrow the filter to 500 Hz or less by rotating the Twin PBT controls. When Twin PBT is displaced from its neutral position, a dot appears to the right of the filter icon at the top of the screen. Examples of BPF and non-BPF filter passbands are illustrated in Figures 5 & 6 (Page 15). Figures 5 & 6 show clearly that the much wider skirts of the non-BPF filter will degrade the rejection of band noise and adjacent-channel interference. 8. Notch Filters: The tunable manual notch filter (MN) is inside the AGC loop, and is extremely effective. The MN has 3 width settings (WIDE, MID and NAR); its stopband attenuation is at least 70 dB. The manual notch suppresses an interfering carrier before it can stimulate AGC action; it thus prevents swamping. To adjust the notch frequency precisely, press and hold the NOTCH key, then rotate the main tuning knob. The auto notch filter (AN) is post-AGC. It suppresses single and multiple tones, but strong undesired signals can still cause AGC action and swamp the receiver. MN and AN are mutually exclusive, and AN is inoperative in CW mode. The NOTCH key toggles OFF – AN – MN. When MN is selected, a pop-up field is displayed at the bottom of the screen, allowing selection of WIDE, MID or NAR (narrow) notch by pressing and holding the NOTCH key. 10. NR (noise reduction): The DSP NR is very effective. In SSB mode, the maximum noise reduction occurs at an NR control setting of 10. As NR level is increased, there is a slight loss of “highs” in the received audio; this is as expected. The measured SINAD increase in SSB mode was about 8 dB. For precise NR adjustment, press and hold the NR key, then rotate the main tuning knob. 11. NB (noise blanker): The IF-level DSP-based noise blanker is arguably one of the IC7100’s strongest features. I found it to be extremely effective in suppressing fast-rising impulsive RF events before they can stimulate AGC action within the DSP algorithm. The NB completely blanks noise impulses which would otherwise cause AGC clamping. I found its performance comparable to that of the IC-7700’s NB. The NB menu (threshold, depth and width) is accessed by pressing and holding the NB key. The NB works very effectively in conjunction with NR. 5 12. AGC system: The IC-7100 has dual AGC loops. The primary loop samples the digitized 36 kHz IF at the ADC output. This loop limits the IF signal power applied to the ADC input, thereby preventing ADC over-ranging even in the presence of extremely strong signals. The digital AGC detector for the secondary loop is within the DSP algorithm. Level indications from both detectors are processed in the DSP for AGC management. This architecture prevents strong adjacent signals from swamping the AGC, and allows full exploitation of the ADC’s dynamic range. The AGC menu is similar to that of other Icom IF-DSP radios. The Slow, Mid and Fast AGC settings are customizable via menu for each mode, and AGC can be turned OFF via menu. 13. Receive and transmit audio menus: The IC-7100 TONE SET menu offers the same generous selection of audio configuration parameters as that of the IC-7600 and IC-7700: TBW (low and high cutoff frequencies), RX and TX Bass/Treble EQ, RX HPF and LPF, transmit compression, etc. All audio settings are grouped under the M2/TCON softkey (F-4 in menu M2). 14. Metering: The on-screen bar-graph meter displays the S-meter at all times; touching the scale toggles between PO, SWR, ALC and COMP. Touch and hold displays the multifunction meter. 15. RTTY decoder and memory keyer: The IC-7100 features an on-screen RTTY decoder/display as well as an 8 x 70 chars RTTY memory keyer for transmitting short messages. 16. VFO/Memory management: The IC-7100 offers the same VFO and memory management features as other current Icom HF+ transceivers: VFO/memory toggle and transfer, memory write/clear, memo-pad, Split, VFO A/B swap [A/B] and equalize [touch and hold A/B], etc. 17. Brief “on-air” report: Upon completing the test suite, I installed the IC-7100 in my shack and connected it to my multi-band HF/6m vertical antenna and to a 2m vertical dipole. a) SSB: I made a few 20m SSB QSO’s with friends who are familiar with my voice and the sound of my signal. Distant stations reported that the audio quality of my transmissions was "excellent” when using the Heil PR-781 desk mic plugged into the radio’s MIC socket via an OPC-589 adapter cable. Two stations I worked on 20m SSB assisted me in optimizing transmit audio settings for the PR-781 and supplied HM-198. Slight audio “break-up” was observed on voice peaks (on-air and in the TX Monitor) when using the HM-198. This could be due to a faulty mic, as no break-up was heard when using other microphones. 6 The following are the settings I used in the SSB trials: Table 1: Transmit audio settings. Mic Band Conditions Mic Gain TBW PR-781 20m S9+ 60% WIDE HM-198 20m S9+ 60% WIDE COMP Bass Treble ≈ 6 dB +3 +5 ≈ 6 dB 0 +5 As discussed in 11. above, the DSP-based noise blanker is superb. It does not distort the signal at all, and can be left on at all times; it is every bit as good as the IC-7700 or IC7600 blanker. At my QTH, with Level 5, Width 8 and Depth 80, the NB suppressed fastrising noise spikes and almost completely eliminated locally-generated electrical noise from HV power lines and industrial processes. As discussed in Section 10 above, I found the NR very effective on SSB. Even at 10, NR did not attenuate “highs” excessively. NR is very effective in conjunction with NB. Preamps 1 and 2 (10 and 16 dB gain, respectively) brought weak stations up to very comfortable copy without S/N degradation. The SSB filters and Twin PBT were excellent, as we have come to expect from other Icom DSP radios. MN and AN were extremely helpful. I was able to notch out single tones with MN; also, AN reduced the levels of multiple tones. Regrettably, I was unable to try out on-air 2m, 70cm or 23cm SSB or CW operating as I do not have suitable antenna systems at my station. Overall, I found that band noise on SSB at my QTH was sufficiently obtrusive to require the use of NR (Level 10) at all times. Still, SSB operation on 20m with a mix of strong and weak signals was quite comfortable and pleasant. Receive audio quality was crisp and smooth. b) CW: Due to time constraints, I did not operate the IC-7100 on CW, but listened to some CW signals on 20m. With 500 and 250 Hz CW filters (Sharp, BPF) and NR/NB on, ringing was minimal with Preamp off. I then set up a 250 Hz filter (Soft, non-BPF) with NR on and Preamp off. Again, there was virtually no audible ringing, and the received CW note was very smooth. Activating Preamp 1 or 2 raised the noise level, causing slight ringing which was more noticeable in the absence of signals. In a brief test of full-break-in operation at 25 wpm, I found this mode very smooth and pleasant, with virtually instantaneous receiver recovery. No keying artifacts were audible in the headphones. c) AM: In a quick check of AM reception, I listened to various MF and HF broadcast stations. A local station on 690 kHz and a music broadcast on 5995 kHz sounded good on the IC-7100’s internal speaker, but much clearer (as one would expect) on my external speaker or on the headset. I did note that the AM IF filters cut off quite steeply below 200 Hz. 7 The 9 kHz AM filter offered the best frequency response, but the 6 kHz setting sounded somewhat “smoother” and 3 kHz cut the “highs” excessively. The IC-7100’s Twin PBT is fully functional in this mode. Mid AGC was best for average to good signal conditions, but Fast AGC handled rapid selective fading more effectively. NR was quite effective in improving the S/N ratio of weak AM signals. The NR did not distort the recovered audio. NR Level 4 was the “sweet spot”, providing optimum noise reduction with minimal attenuation of highs. Higher NR settings cut the highs excessively. Above 10, the NR control had no further effect. (Note that the AM bass and treble EQ settings were both 0 dB, with HPF off.) AN was effective in suppressing interfering tones and heterodynes, but MN caused some distortion when tuned across the signal. The reason for this is that MN suppresses the carrier in a manner similar to selective fading. No hiss was evident when receiving weak AM signals. d) RTTY: Unfortunately, due to time constraints and poor HF propagation, I was unable to find any RTTY activity during the on-air test. e) FM: A brief QSO on our local repeater yielded very favorable audio reports from distant stations. f) DV: After registering with the local gateway, I was able to access our local 2m D-Star repeater without any difficulty – but was unable to raise any other users! 17. Baseband Level Check: During receiver testing, I checked the receive baseband levels at the USB port using a spectrum-analysis program, and at ACC Pin 12 using a level meter and a baseband spectrum analyzer. All levels were well within specifications. To use the USB port I installed the Ver. 1.2 Icom USB drivers (downloadable from the Icom Japan world-wide support site). http://www.icom.co.jp/world/support/download/firm/ 18. Case temperature: The radio showed no signs of excessive heating even after 2 hours’ “rag-chew” SSB operation at 100W PEP output. Average case temperature was 32°C, rising to 46°C at the hottest point after several minutes’ key-down transmit at 100W during transmitter testing (14-16 bars on the TEMP indicator). Cool-down was quite rapid; the fan was quiet and not disturbing. 19. Conclusion: After a few days’ “cockpit time” on the IC-7100, I am very favorably impressed by its solid, refined construction, clear and informative display, easy familiarization experience, smooth operating “feel”, impressive array of frequency ranges and features and excellent on-air performance. This radio is unique in that it offers allband, all-mode capability (including D-Star) and convenient operation in an attractive, compact package. Once again, Icom have a winner with the intuitive touch-screen and the straightforward USB computer interface. 8 20. Acknowledgements: I would like to thank Ray Novak N9JA at Icom America, and Paul Veel VE7PVL and Jim Backeland VE7JMB at Icom Canada for making an IC-7100 available to me for testing and evaluation. Adam Farson, VA7OJ/AB4OJ e-mail: [email protected] http://www.ab4oj.com/ August 16, 2013. Update history: Iss. 1: Pre-release, August 25, 2013. Iss.2: IC-7100/IC-7000 comparison added, August 25, 2013. Iss. 3: Table 22 (432.1 MHz 100% power output) corrected, September 9, 2014. Copyright © 2013-2014 A. Farson VA7OJ/AB4OJ. All rights reserved. 9 Appendix 1: IC-7100/IC-7000 Feature Comparison Feature Display Screen Control head D-Star (DV) features IF-level DSP Final (DSP) IF Dual DSP IC’s Band scope Built-in SD card slot RTTY demod/decoder RTTY Twin Peak Filter Graphic SWR display Memory channels DR memory slots DVR (record/playback) 4m coverage, 50W TX ± 0.5ppm master osc. PC connectivity GPS connectivity RS-BA1 software Line audio I/O TX audio TBW adjust TX/RX bass/treble EQ RX audio HPF/LPF Dual DSP manual notch DSP NR/NB DSP IF filters/Twin PBT DSP RF compressor VSC (voice squelch) Composite video out DTMF keypad Supplied hand mic Temperature gauge IC-7100 Mono touch-screen Separate, w/cable Y TI 36 kHz Y Y Y Y Y Y 505 900 Y EU only Y USB, CI-V Y Via USB port USB/ACC/DATA Tone Control menu Tone Control menu Tone Control menu N Y Y Y Y N On-screen HM-198 Y IC-7000 Color TFT Detachable N ADI Blackfin 16.15 kHz Y Y N Y Y Y 503 N/A Y N Y CI-V only N Limited, via interface ACC/DATA Y N N Y Y Y Y Y Y N HM-151 Y Remarks Optional cable (IC-7000) IC-7100 more powerful Non real-time For D-Star repeaters USB carries CI-V, audio 10 Appendix 2: Performance Tests on IC-7100 S/N 02001066 As performed in my home RF lab, August 8 – 16, 2013. A. HF/6m Receiver Tests 1: MDS (Minimum Discernible Signal) is a measure of ultimate receiver sensitivity. In this test, MDS is defined as the RF input power which yields a 3 dB increase in the receiver noise floor, as measured at the audio output. Test Conditions: ATT off, NR off, NB off, Notch off. AGC-M. SHARP. Levels in dBm. Preamp Off 1 2 Table 2: MDS (HF, 6m). 3.6 MHz 14.1 MHz SSB 2.4 kHz CW 500 Hz SSB 2.4 kHz CW 500 Hz -122 -128 -123 -129 -132 -139 -133 -140 -134 -141 -135 -142 50.1 MHz SSB 2.4 kHz CW 500 Hz -123 -129 -133 -140 -135 -141 1a: AM Sensitivity. Here, an AM test signal with 30% modulation at 1 kHz is applied to the RF input. The RF input power which yields 10 dB (S+N)/N is recorded (Table 3). Test Conditions: ATT off, NR off, NB off, Notch off. AGC-M. Wide (9 kHz) AM filter. Levels in dBm. Table 3: AM Sensitivity. Preamp 0.9 MHz 3.9 MHz 14.1 MHz Off -102 -103 -104 1 -112 -113 -114 2 -113 -115 -115 Note: No RF attenuation below 1.6 MHz Notes: 1. The IC-7100 does not insert attenuation at f < 1.6 MHz. 2. Very clean demodulation; full quieting at -80 dBm (preamp off). 3. No disturbing high-frequency hiss at low signal levels. Unmodulated carrier at -110 dBm (preamp off) increases noise floor by 5 dB. 1b. 12 dB SINAD FM sensitivity: In this test, a distortion meter is connected to the external speaker jack, and an FM signal modulated by a 1 kHz tone with 3 kHz peak deviation is applied to the RF input. The input signal power for 12 dB SINAD is recorded (Table 4). Table 4: FM 12 dB SINAD Sensitivity in dBm. Preamp 29.5 MHz 52.525 MHz Off -109 -109 1 -120 -119 2 -122 -121 1c. 12 dB SINAD WFM sensitivity. Here, the peak deviation is 45 kHz. Table 4a. WFM 12 dB SINAD Sensitivity in dBm. Preamp 101.1 MHz Off -95 1 -107 11 2: Reciprocal Mixing Noise occurs in a superheterodyne receiver when the noise sidebands of the local oscillator (LO) mix with strong signals close in frequency to the wanted signal, producing unwanted noise products at the IF and degrading the receiver sensitivity. Reciprocal mixing noise is a measure of LO spectral purity. In this test, a strong "undesired" signal is injected into the receiver's RF input at a fixed offset from the operating frequency. The RF input power is increased until the receiver noise floor increases by 3 dB, as measured at the audio output. Reciprocal mixing noise, expressed as a figure of merit, is the difference between this RF input power and measured MDS. The test is run with preamp off. The higher the value, the better. Test Conditions: CW mode, 500 Hz filter, preamp off, ATT off, NR off, AGC-M, NB off, negative offset. Reciprocal mixing in dB = input power – MDS (both in dBm). Table 5: Reciprocal Mixing Noise in dB (HF/6m). Δf kHz 3.6 MHz 14.1 MHz 50.1 MHz 2 86 85 85 5 88 88 87 10 94 93 92 20 103 103 101 3: IF filter shape factor (-6/-60 dB). This is the ratio of the -60 dB bandwidth to the -6 dB bandwidth, which is a figure of merit for the filter’s adjacent-channel’s rejection. The lower the shape factor, the “tighter” the filter. In this test, an approximate method is used. An RF test signal is applied at a power level approx. 60 dB above the level where the S-meter just drops from S1 to S0. The bandwidths at -6 and -60 dB relative to the input power are determined by tuning the signal generator across the passband and observing the S-meter. Reciprocal mixing noise limits the level range to 60 dB or less. Test Conditions: 10.100 MHz, SSB/CW modes, preamp off, AGC-M, ATT off, NR off, NB off. Table 6: IF Filter Shape Factors. Shape Factor 6 dB BW kHz Sharp Soft Sharp Soft 2.4 kHz SSB 1.36 1.42 2.57 2.47 500 Hz CW 1.50 1.45 0.49 0.58 250 Hz CW 1.64 2.43 0.26 0.25 Filter 12 4: AGC threshold & SSB filter roll-off. An RF test signal is applied at a level 6 dB below AGC threshold, with AGC off. The signal is offset 1 kHz from the receive frequency to produce a test tone. While tuning the signal generator across the IF passband, the frequency and audio level are noted at several points on the filter flank. Test Conditions: 14.100 MHz, 2.4 kHz USB, Preamp off, AGC M, then off, ATT off, NR off, NB off. Input signal level -101 dBm (6 dB below measured -95 dBm AGC threshold.) 4a. AGC threshold: With AGC-M, increase RF input power until baseband level increases < 1 dB for a 1 dB increase in input level. Measured value = -95 dBm. 4b. Roll-off: With AGC off, reduce RF input power to 6 dB below AGC threshold = -101 dBm. Test data in Table 7 (roll-off in dB). Table 7: IF Filter Roll-off. Offset Hz Sharp Soft 250 -3 -7.7 300 0.2 -5.3 400 0 -4.5 500 0 -3.1 750 -0.1 -1.2 1000 0 0 2000 -0.8 -0.6 2500 -1.4 -4.7 2700 -2 -7.5 2750 -7 -11 2800 -22 -23 4c. Typical IF filter passband curves: The examples illustrated below depict typical filter passbands. Due to the limited dynamic range of the measurement method, the accuracy of the amplitude scale is limited. In this test, a flat noise spectrum (band-limited to 30 MHz) from an RF noise source is applied to the antenna input, and the filter passband curve is captured by a baseband spectrum-analysis program running in a PC connected to the IC-7100 via the USB port. Test Conditions: Noise loading (PSD) = -135 dBm/Hz. IC-7100 tuned to 14.100 MHz. AGC-M, NR/NB/preamp/ATT off, Twin PBT neutral (except for non-BPF tests). Figures 3 – 9 are the measured passband curves for various filter configurations. 13 Figure 3: 2.4 kHz SSB filter (Sharp) Figure 4: 2.4 kHz SSB filter (Soft) 14 Figure 5: 500 Hz CW filter (Sharp, BPF) Figure 6: 500 Hz CW filter (Sharp, non-BPF) 15 Figure 7: 500 Hz CW filter (Soft) Figure 8: 250 Hz CW filter (Sharp) 16 Figure 9: 6 kHz AM filter. 5: NR noise reduction, measured as SINAD. This test is intended to measure noise reduction on SSB signals close to the noise level. The test signal is offset 1 kHz from the receive frequency to produce a test tone, and RF input power is adjusted for a 6 dB SINAD reading (-119 dBm). NR is then turned on, and SINAD read at various NR settings. Test Conditions: 14.100 MHz USB, 2.4 kHz Sharp, AGC-M, preamp off, ATT off, NR off, NB off, Twin PBT neutral. Table 8: NR SINAD. NR SINAD dB 0 6 3 7 5 8 6 10 7 12 8 14 9 14 (max) This shows an S/N improvement of 8 dB with NR at maximum for an SSB signal roughly 4 dB above the noise floor. This is an approximate measurement, as the amount of noise reduction is dependent on the original signal-to-noise ratio. Figures 10 & 11 are spectrograms of a single-tone RF signal at -119 dBm with NR off and at maximum, respectively. 17 Figure 10. SSB 2.4 kHz. -119 dBm RF signal, NR off. Figure 11: SSB 2.4 kHz. -119 dBm RF signal, max. NR (9). 6: Manual Notch Filter (MNF) stopband attenuation and bandwidth. In this test, an RF signal is applied at a level ≈ 70 dB above MDS. The test signal is offset 1 kHz from the receive frequency to produce a test tone. The MNF is carefully tuned to null out the tone completely at the receiver audio output. The test signal level is adjusted to raise the baseband level 3 dB above noise floor. The stopband attenuation is equal to the difference between test signal power and MDS. Test Conditions: 14.100 MHz USB at ≈ -50 dBm (S9 + 20 dB), 2.4 kHz Sharp, AGC-M, preamp off, ATT off, NR off, NB off, MNF on, Twin PBT neutral. 18 Test Results: Measured MDS was -123 dBm per Test 1. Stopband attenuation = test signal power- MDS. Table 9: Manual Notch Filter Attenuation. MNF BW Test Signal dBm Stopband Atten. dB WIDE -49 74 MID -54 69 NAR -63 60 The receive frequency is now offset on either side of the null. The frequencies at which the audio output rises by 6 dB are noted. The -6 dB bandwidth is the difference between these two frequencies. Table 10: MNF BW. MNF -6 dB BW Hz Wide 121 Mid 90 Narrow 67 The figures below depict the Manual Notch Filter stopband for Wide, Mid and Narrow settings. Reference level 0 dBc. Amplitude 10 dB/vert. div. Span 100 Hz/hor. div. Figure 12: Manual Notch Filter (WIDE). 19 Figure 13: Manual Notch Filter (MID). Figure 14: Manual Notch Filter (NAR). 7: AGC impulse response. The purpose of this test is to determine the IC-7100's AGC response in the presence of fast-rising impulsive RF events. Pulse trains with short rise times are applied to the receiver input. Test Conditions: 10.100 MHz LSB, 2.4 kHz SSB filter (Sharp), NR off, NB off/on, Preamp off/2, AGC-F, with decay time set to 0.1 sec. Test with pulse trains. Here, the pulse generator is connected to the IC-7100 RF input via a step attenuator. The IC-7100 is tuned to 10.1 MHz, as the RF spectral distribution of the test pulse train has a strong peak in that band. AGC Fast (0.1 sec) and Preamp 2 are selected. 20 The pulse rise time (to 70% of peak amplitude) is 10 ns. Pulse duration is varied from 12.5 to 95 ns. In all cases, pulse period is 600 ms. The step attenuator is set at 36 dB. Pulse amplitude is 16Vpk (e.m.f.) The AGC recovers completely within the 0.1 sec window; there is no evidence of clamping. A “sweet spot” is evident at 95 ms; the AGC does not react to the pulse at all. Table 11: AGC impulse response. Pulse duration ns Tick AGC recovery ms S: Pre off S: Pre 2 12.5 Y ≈ 100 (no clamping) S3 S7 30 Y ≈ 100 (no clamping) S5 S8 50 Y ≈ 100 (no clamping) S6 S9 95 (sweet spot) N No AGC capture S0 S0 8: Noise blanker (NB) impulse response. As the IC-7100's noise blanker is a DSP process "upstream" of the AGC derivation point, the NB should be very effective in suppressing impulsive RF events before they can stimulate the AGC. To verify this, the NB is turned on during Test 7 (above). NB on, Preamp 1 or 2, default Depth & Width: At all pulse durations, the S-meter deflection is completely suppressed (with Preamp off, 1 and 2) showing that the impulsive events never reach the AGC derivation point. Ticks are still heard in the speaker, but at reduced amplitude. The ticks are loudest at 35 ns, but are still quite faint. Tick volume is lowest at 12.5 ns. Adjusting NB Level or Depth has little effect on the ticks at any pulse duration. The loudness of the ticks appears to fluctuate slightly. The “sweet spot” occurs at 95 ns, as per Test 7 above. With Preamp off, there are no ticks at 12.5 ns, but faint ticks are heard at 30 ns. Peak loudness is at 35 ns. The same “sweet spot” occurs at 95 ns. At NB Width ≈ 100, the ticks are almost inaudible with Preamp off; with Preamp 2, a very faint “chuff” sound is heard for each pulse. Signals and/or band noise would mask these artifacts completely. Next, NR is activated. With NR at 9 to 10, Preamp off and NB on, the ticks are completely inaudible. With Preamp 1 or 2 on, faint ticks are heard. As in other Icom IF-DSP radios, the NB mitigates AGC response to fast-rising RF events. 9: S-meter tracking & AGC threshold. This is a quick check of S-meter signal level tracking. Test Conditions: 2.4 kHz USB, Preamp off, ATT off, AGC MID. A 14.100 MHz test signal at MDS is applied to the RF input. The signal power is increased, and the level corresponding to each S-meter reading is noted. (S9 readings are taken with Preamp off, Preamp 1 and Preamp 2 in turn.) S dBm S0 -92 S1 -91 S2 -89 Table 12: S-Meter Tracking. S3 S4 S5 S6 S7 S8 S9 S9+10 S9+20 S9+30 S9+40 -87 -85 -81 -79 -76 -74 -71 -61 -52 -43 -33 Preamp 1 on: S9 = -80 dBm. Preamp 2 on: S9 = -84 dBm. Measured AGC threshold (preamp OFF): -95 dBm (from Test 4) S9+50 -24 S9+60 -15 21 9a: Attenuator tracking. This is a quick verification of attenuator accuracy. Table 13: ATT Value. ATT Value dB OFF 0 ON 21 10. In-Band IMD Test. The purpose of the In-Band IMD Test is to measure the intermodulation (IMD) products present in the audio output of the receiver when two closely-spaced signals (both falling within the IF passband) are applied to the RF input. In this test, two signals f1 and f2 of equal amplitude and separated by 200 Hz offset are injected into the receiver input. f1 = 10100.0 and f2 = 10100.2 kHz. The 3rd-order IMD products are at 10099.8 and 10100.4 kHz respectively. The two test signals are combined in a passive hybrid combiner and applied to the receiver input via a step attenuator. A baseband spectrum analyzer is connected to the ACC Pin 12 (AF out) on the IC-7100. Test Conditions: IC-7100 tuned to 10099.6 kHz, 3.6 kHz USB, NR off, NB off, Preamp off, ATT off, AGC-F. RF input power -57 dBm composite (each test signal -63 dBm). Baseband spectrum analyzer reference level adjusted to place test signals at -10 dB line. Figure 11 illustrates the test signals and 3rd-order IMD products. Figure 15: Inband IMD products. Test Result: Inband IMD = -79 dBc. 11. Two-Tone 3rd-Order Dynamic Range (DR3) & Third-Order Intercept (IP3). The purpose of this test is to determine the range of signals which the receiver can tolerate while essentially generating no spurious responses. 22 In this test, two signals of equal amplitude Pi and separated by a known offset f are injected into the receiver input. If the test signal frequencies are f1 and f2, the offset f = f2 - f1 and the 3rd-order intermodulation products appear at (2 f2 - f1) and (2 f1 - f2). The two test signals are combined in a passive hybrid combiner and applied to the receiver input via a step attenuator. The receiver is tuned to the upper and lower 3rd-order IMD products (2 f2 – f1 and 2 f1 - f2 respectively) which appear as a 600 Hz tone in the speaker. The per-signal input power level Pi is adjusted to raise the noise floor by 3 dB, i.e. IMD products at MDS. The Pi values for the upper and lower products are recorded and averaged. Note: If the audio output drops by less than 3 dB when one of the test signals is removed, the measurement is noise-limited (indicated by NL in the table.) DR3 = Pi - MDS. Calculated IP3 = (1.5 * DR3) + MDS. Test Conditions: 14.1 MHz, 500 Hz CW, AGC off, ATT off, NR off, NB off, CW Pitch = 12 o’clock. DR3 in dB; IP3 in dBm. Table 14: DR3 & IP3 at 14.1 MHz. f in kHz, DR3 in dB, IP3 in dBm. Δf 2 5 10 20 Preamp off Preamp 1 Preamp 2 DR3 IP3 DR3 IP3 DR3 IP3 69 -26 68 -38 66 -43 72 -21 70 -35 70 -37 84 -3 84 -14 82 -19 96 +15 95 +3 94 -1 12. Two-Tone 2nd-Order Dynamic Range (DR2) & Second-Order Intercept (IP2). The purpose of this test is to determine the range of signals far removed from an amateur band which the receiver can tolerate while essentially generating no spurious responses within the amateur band. In this test, two widely-separated signals of equal amplitude Pi are injected into the receiver input. If the signal frequencies are f1 and f2, the 2nd-order intermodulation product appears at (f1 + f2). The test signals are chosen such that (f1 + f2) falls within an amateur band. The two test signals are combined in a passive hybrid combiner and applied to the receiver input via a step attenuator. The receiver is tuned to the IMD product (f1 + f2 ) which appears as a 600 Hz tone in the speaker. The per-signal input power level Pi is adjusted to raise the noise floor by 3 dB, i.e. IMD product at MDS. The Pi value is then recorded. DR2 = Pi - MDS. Calculated IP2 = (2 * DR2) + MDS. Test Conditions: f1 = 6.1 MHz, f2 = 8.1 MHz, CW mode, 500 Hz filter, AGC off, ATT off, NR off, NB off, CW Pitch = 12 o’clock. DR2 in dB; IP2 in dBm. 23 Table 14: DR2. MDS in dBm, DR2 in dB, IP2 in dBm. Preamp MDS, 14.2 MHz DR2 IP2 off -123 86 43 1 -140 92 44 2 -142 92 42 12. Noise Power Ratio (NPR): An NPR test was performed, using the test methodology described in detail in Ref. 1. The noise-loading source used for this test was a noise generator fitted with bandstop (BSF) and band-limiting filters (BLF) for the test frequencies utilized. The noise loading PTOT was increased until the audio level measured at the external speaker jack increased by 3 dB. PTOT was read off the attenuator scale on the noise generator, and NPR was then calculated using the formula NPR = PTOT - BWR - MDS where PTOT = total noise power in dBm for 3 dB increase in audio output BWR = bandwidth ratio = 10 log10 (BRF/BIF) BRF = RF bandwidth or noise bandwidth in kHz (noise source band-limiting filter) BIF = receiver IF filter bandwidth in kHz MDS = minimum discernible signal (specified at B IF), measured at 2.4 kHz SSB prior to NPR testing Test Conditions: Receiver tuned to bandstop filter center freq. f0 ± 1.5 kHz, 2.4 kHz SSB, ATT off, NR off, NB off, Notch off, AGC-S. Test results are presented in Table 15. DUT IC-7100 HF IC-7100 MF Table 15: NPR Test Results. BSF kHz BLF kHz Preamp MDS dBm PTOT dBm BWR dB NPR dB 1940 60…2044 3886 60…4100 5340 60…5600 7600 316…8160 534 60…1296 1248 60…1296 0 1 2 0 1 2 0 1 2 0 1 2 0 1 2 0 1 2 -123 -133 -135 -122.5 -133 -134.5 -123.5 -133 -135 -123 -134 -135 -119 -130 -131 -121 -132 -134 -25.4 -31.5 -34.2 -24.5 -36 -39 -23.5 -35 -38 -18.3 -28.3 -30.7 -27.7 -36 -39.6 -26.7 -36 -40 29.2 32.3 33.6 35.1 27.1 27.1 68 72 71 65 64 63 66 64 63 69 70 69 64 67 64 67 69 67 24 13. 1st-IF image rejection: In this test, the IC-7100 is tuned to a mid-band frequency f0, and a test signal at f0 + twice the 1st IF is applied to the antenna port. The test signal power is increased sufficiently to raise the noise floor by 3 dB. Test Conditions: f0 = 14.100 MHz, 500 Hz CW, 500 Hz, AGC-M, ATT off, NR off, NB off, Preamp off. Set main tuning to 14.100 MHz. Test signal freq. = (2 * 124.487) + 14.1 = 263.074 MHz. Measured MDS = -129 dBm. Test signal power for 3 dB noise floor increase = -24 dBm. Thus, image rejection = -24 - (-129) = 105 dB. 13a. 1st-IF rejection: In this test, the IC-7100 is tuned to a mid-band frequency f0, and a test signal at the 124.487 MHz 1st IF is applied to the antenna port. The test signal power is increased sufficiently to raise the noise floor by 3 dB. Test Conditions: f0 = 14.100 MHz, , 500 Hz CW, AGC-M, ATT off, NR off, NB off, Preamp off. Set main tuning to 14.100 MHz. Test signal freq. = 124.487 MHz. Measured MDS = -135 dBm. Test signal power for 3 dB noise floor increase = -24 dBm. Thus, 1st-IF rejection = -24 - (-129) = 105 dB. 14. Audio THD: In this test, an audio distortion analyzer is connected to the external speaker output. An 8resistive load is connected across the analyzer input. An S7 to S9 RF test signal is applied to the antenna input, and the main tuning is offset by 1 kHz to produce a test tone. The audio voltage corresponding to 10% THD is then measured, and the audio output power calculated. Test Conditions: 14.100 MHz, 3 kHz USB, AGC-F, ATT off, NR off, NB off, Preamp off. Offset tuning by -1 kHz. Test Result: Measured audio output voltage = 4.35V rms. Thus, audio power output = (4.35) 2 /8] = 2.37W in 8 (Spec. is 2W). 25 B. 2m/70cm Receiver Tests 16: MDS (Minimum Discernible Signal) is a measure of ultimate receiver sensitivity. In this test, MDS is defined as the RF input power which yields a 3 dB increase in the receiver noise floor, as measured at the audio output. Note: Always terminate the antenna port in 50when setting the 0 dBr receive audio reference for these tests. Test Conditions: ATT off, NR off, NB off, Notch off. AGC-S. SHARP. Levels in dBm. Table 16: MDS (2m/70cm/23cm) in dBm. Preamp 144.1 MHz 432.1 MHz SSB 2.4 kHz CW 500 Hz SSB 2.4 kHz CW 500 Hz Off -125 -133 -123 -128 On -137 -142 -134 -139 16a. 12 dB SINAD FM sensitivity: In this test, a distortion meter is connected to the external speaker jack, and an FM signal modulated by a 1 kHz tone with 3 kHz peak deviation is applied to the RF input. The input signal power for 12 dB SINAD is recorded (Table 17). Table 17a: FM 12 dB SINAD Sensitivity in dBm. Preamp 145 MHz 440 MHz Off -113 -110 On -122 -121 16b. 12 dB SINAD WFM sensitivity: As for Test 16a, except that peak deviation is 45 kHz. Table 17b: WFM 12 dB SINAD. Preamp 101.1 MHz Off -113 On -122 17. Noise Figure: In this test, a calibrated noise source is connected to the antenna port via a precision DC - 2 GHz step attenuator. First, the antenna port is terminated in 50and a 0 dBr receive audio reference set. Then, the noise source is connected and the noise loading adjusted for a +3 dBr audio level. The attenuator setting is noted. As the noise source is calibrated, its noise power density PSD (in dBm/Hz) is known. Noise figure NF is derived as follows: NF ≈ PSD - ATT +174 where ATT = attenuator setting in dB. Test Conditions: 500 Hz CW, AGC Mid, ATT off, NR off, NB off. 26 Table 18. Noise figure in dB. 144.1 MHz 432.1 MHz Preamp Measured Calc. from MDS off 13.7 14 on 4.7 5 off 16 19 on 5 8 18: Reciprocal Mixing Noise: In this test, a strong "undesired" signal is injected into the receiver's RF input at a fixed offset from the operating frequency. The RF input power is increased until the receiver noise floor increases by 3 dB, as measured at the audio output. Reciprocal mixing noise, expressed as a figure of merit, is the difference between this RF input power and measured MDS. The test is run with preamp off. The higher the value, the better. (Table 19). Test Conditions: 500 Hz CW, preamp off, ATT off, NR off, NB off, negative offset. Reciprocal mixing in dB = input power – MDS (both in dBm). Table 19: Reciprocal Mixing Noise (2m/70cm/23cm) in dB. Offset kHz 144.1 MHz USB 432.1 MHz USB 2 73 71 5 77 79 10 83 85 20 89 90 19. Two-Tone 3rd-Order Dynamic Range (DR3) & Third-Order Intercept (IP3). The purpose of this test is to determine the range of signals which the receiver can tolerate while essentially generating no spurious responses. For a discussion of this test, see Test 11 above. Test Conditions: 144.1 MHz, 500 Hz CW, AGC off, ATT off, NR off, NB off, CW Pitch = 12 o’clock. DR3 in dB; IP3 in dBm. Table 20: DR3 and IP3 at 144.1 MHz. Preamp Off On f kHz DR3 dB IP3 dBm DR3 dB IP3 dBm 2 65* -36 63* -48 5 67 -33 67 -42 10 80* -13 81* -21 20 82* -10 86* -13 *Phase-noise limited. 20. FM Receive Adjacent-Channel Selectivity: In this test, two FM signals are applied to the antenna port at 20 kHz channel spacing. The desired signal is modulated at 1 kHz, and the undesired signal at 400 Hz. Initially, the desired signal level is adjusted for 12 dB SINAD, and then the undesired signal level is increased until SINAD on the desired signal is degraded to 6 dB. The adjacent-channel rejection is the ratio of the undesired to the desired signal level. SINAD is measured on an audio distortion meter connected to the EXT SP jack. 27 Test Conditions: 146 MHz, FM, FIL-1 (15 kHz). f1 = 146.000 MHz modulated at 1 kHz, f2 = 145.980 MHz modulated at 400 Hz. Peak deviation = 3 kHz for f1 and f2. ATT off, NR off, NB off. Set f1 level to -113 dBm (for 12 dB SINAD per Test 16a above.) Increase f2 level until measured SINAD drops to 6 dB. Note this level. Adjacent-channel rejection = f2 level – f1 level (in dB.) Reduce peak deviation to 1.5 kHz and repeat test with FIL-2 (10 kHz) and FIL-3 (7 kHz). Repeat entire test with f2 = 146.020 kHz. The test results should be unchanged. Table 20. FM adjacent-channel rejection at 20 kHz spacing. IF Filter Deviation kHz Rej. (f2 < f1) dB Rej. (f2 > f1) dB 1 (15 kHz) 3 75 75 2 (10 kHz) 1.5 75 74 3 (7 kHz) 1.5 75 75 21. Two-Tone 3rd-Order Dynamic Range (DR3), EIA Method: The purpose of this test is to determine the range of signals which the receiver can tolerate in the FM mode while producing no spurious responses greater than the SINAD level. Two test signals f1 and f2, of equal amplitude and spaced 20 kHz apart, are applied to the antenna port. The signal 40 kHz removed from the IMD product being measured is modulated at 1 kHz, with 3 kHz deviation. The receiver is tuned to the IMD products (2f1-f2) and (2f2-f1). The test signal levels are then increased simultaneously by equal amounts until the IMD product reads 12 dB SINAD. The DR values for the upper and lower IMD products are averaged to yield the final result. Test Conditions: 2m, I: 146 MHz, FM, FIL-1 (15 kHz). f1 = 146.000 MHz modulated at 1 kHz, f2 = 145.980 MHz, modulation off. Peak deviation = 3 kHz. ATT off, NR off, NB off. 2m, II: 146 MHz, FM, FIL-1 (15 kHz). f1 = 146.000 MHz modulation off, f2 = 146.020 MHz, modulated at 1 kHz. Peak deviation = 3 kHz. ATT off, NR off, NB off. 70cm, I: 440 MHz, FM, FIL-1 (15 kHz). f1 = 440.000 MHz modulated at 1 kHz, f2 = 439.980 MHz, modulation off. Peak deviation = 3 kHz. ATT off, NR off, NB off. 70cm, II: 440 MHz, FM, FIL-1 (15 kHz). f1 = 440.000 MHz modulation off, f2 = 440.020 MHz, modulated at 1 kHz. Peak deviation = 3 kHz. ATT off, NR off, NB off. Table 21. FM DR3 at 20 kHz spacing. Frequency MHz DR3 dB 146 76 440 79 28 22a. 1st-IF image rejection: In this test, the IC-7100 is tuned to a convenient frequency f0, and a test signal at f0 + twice the 1st IF is applied to the antenna port. The test signal power is increased sufficiently to raise the noise floor by 3 dB. 2m: Test Conditions: f0 = 144.1 MHz, 500 Hz CW, AGC-M, Preamp off, ATT off, NR off, NB off. Set main tuning to 144.10 MHz. 1st IF = 124.487 MHz. Test signal freq. = (2 * 124.487) + 144.10 = 393.074 MHz. Measured MDS = -133 dBm. Test signal power for 3 dB noise floor increase = -59 dBm. Thus, image rejection = -59 - (-133) = 74 dB. 70cm: Test Conditions: f0 = 432.1 MHz, CW, 1.2 kHz IF filter, AGC-M, ATT off, NR off, NB off. Set main tuning to 432.10 MHz. 1st IF = 124.487 MHz. Test signal freq. = (2 * 124.487) + 432.10 = 681.074 MHz. Measured MDS = -128 dBm. Test signal power for 3 dB noise floor increase = -23 dBm. Thus, image rejection = -23 - (-128) = 105 dB. 22b. 1st-IF rejection: In this test, the IC-7100 is tuned to a convenient frequency f0, and a test signal at the 1st IF is applied to the antenna port. The test signal power is increased sufficiently to raise the noise floor by 3 dB. 2m: Test Conditions: As for Test 22, except that test signal frequency = 1st IF = 124.487 MHz. f0 = 144.1 MHz. Measured MDS = -133 dBm. Test signal power for 3 dB noise floor increase = -86 dBm. Thus, 1st-IF rejection = -86 - (-133) = 47 dB. (This is noted in the IC-7100 brochure.) 70cm: Test Conditions: As for Test 22, except that test signal frequency = 1st IF = 124.487 MHz. f0 = 432.1 MHz. Measured MDS = -133 dBm. Test signal power for 3 dB noise floor increase = -20 dBm. Thus, 1st-IF rejection = -20 - (-133) = 113 dB. 22c. ½ IF breakthrough at 50.1 MHz. In this test, the IC-7100 is tuned to 50.1 MHz, and a test signal one-half the 1st IF is applied to the antenna port. The test signal power is increased sufficiently to raise the noise floor by 3 dB. (Noted in IC-7100 brochure.) Test Conditions: f0 = 50.1 MHz, 500 Hz CW, AGC-M, Preamp off, ATT off, NR off, NB off. Set main tuning to 50.10 MHz. 1st IF = 124.487 MHz. Test signal freq. = (124.487/2) = 62.2435 MHz. Measured MDS = -129 dBm. Test signal power for 3 dB noise floor increase = -34 dBm. ½ 1st IF rejection = -34-(-129) = 95 dB. 29 C. Transmitter Tests 23: CW Power Output. In this test, the RF power output into a 50Ω load is measured at 3.6, 14.1, 50.1, 144.1 and 432.1 MHz in CW or RTTY mode, at a primary DC supply voltage of +13.8V. A thermocouple-type power meter is connected to the IC-7100 RF output via a 50 dB power attenuator. Table 22: CW Power Output. RF Power % Po Meter % Power Output W Freq. MHz 3.6 14.1 50.1 144.1 432.1 70 70 77 76 76 37 26 100 100 116 114 111 53 38 23a: SWR scale accuracy. The SWR scale is read with 50and 100 resistive loads connected in turn to ANT1. To minimize the effect of line lengths on measurement accuracy, this test is run at 1.8 MHz. The RF POWER setting remains unchanged when switching loads. Test Conditions: 1.81 MHz RTTY. Po = 10W into 50load. Table 23: SWR Scale Accuracy. Nominal Load DC Resistance SWR Reading 1.0:1 50 50.1 100 100.9 2.0:1 Note that with the 100 load, the SWR reading is somewhat dependent on Po. 24: SSB Peak Envelope Power (PEP). Here, an oscilloscope is terminated in 50 and connected to the IC-7100 RF output via a 50 dB high-power attenuator. At 100W CW, the scope vertical gain is adjusted for a peak-to-peak vertical deflection of 6 divisions. Test Conditions: USB mode, HM-198 mic connected, RF PWR 91%, Mic Gain 50%, COMP OFF/ON, TBW = MID, COMP at 5 ( ≈ 6 dB compression on voice peaks), SSB TX Bass/Treble set at 0 dB (default), supply voltage +13.8V. Speak loudly into the microphone for full-scale ALC reading. Figures 16 & 17 show the envelope for 100W PEP, without and with compression respectively. ± 3 vertical divisions = 100W. 30 Figure 16: 100W PEP speech envelope, no compression. Figure 17: 100W PEP speech envelope, 6 dB compression. 25: SSB ALC overshoot: A test was conducted in which white noise was applied via the USB port, and the RF envelope observed on an oscilloscope terminated in 50and connected to the IC-7100 RF output via a 50 dB high-power attenuator. Test Conditions: 14100 kHz USB, COMP off, DATA OFF MOD = USB, USB MOD Level = 50% (default). Test signal: white noise. WIDE TBW (default value) selected. Supply voltage +13.8V. Set Po = 50W in RTTY mode. Select USB, then adjust USB Audio Codec device volume on computer for 50% ALC reading. Repeat test with Po = 100W, 31 Test Results: No sign of ALC overshoot was visible at 50W PEP (±2.25 vert. div.). At 100W PEP (±3 vert. div.) a slight overshoot to 113W PEP was observed. See Figures 18a & 18b. Figure 18a: 50W white noise test (±2.25 vert. div. = 50W PEP). Figure 18b: 100W white noise test (±3 vert. div. = 100W PEP). 26. ALC Compression Check. In this test, a 2-tone test signal is applied to the USB port from a tone-generator program running on a laptop computer. An oscilloscope is connected to the IC-7100 RF output via a 50 dB high-power attenuator. RF Power is initially adjusted for 100W output in RTTY mode. Test Conditions: 14100 kHz USB, COMP off, DATA OFF MOD = USB, USB MOD Level = 50% (default). Test tones: 700 and 1700 Hz, at equal amplitudes. WIDE TBW (default value) selected. Supply voltage +13.8V. 32 Test Result: No flat-topping of the 2-tone envelope was observed (see Figure 19.) Figure 19: 2-tone envelope, 100W PEP 26: Transmitter 2-tone IMD Test. In this test, a 2-tone test signal is applied to the USB port from a tone-generator program running on a laptop computer. A spectrum analyzer is connected to the IC-7100 RF output via a 60 dB high-power attenuator. RF Power is initially adjusted for rated CW output on each band in turn. Test Conditions: DC supply 13.8V, measured at DC power socket. 3.6, 14.1, 50.1, 144.1 and 432.1 MHz USB, DATA OFF MOD = USB, USB Level = 50% (default). Test tones: 700 and 1700 Hz, at equal amplitudes. The -10 dBm reference level RL equates to rated CW output (= 0 dBc). On computer, adjust USB Audio Codec device volume for 100W PEP (each tone at -6 dBc). Figures 20 through 24 show the two test tones and the associated IMD products for each test case. Table 24. 2-tone TX IMD. 2-tone TX IMD Products at Rated Po IMD Products Rel. Level dBc (0 dBc = 1 tone) Freq. MHz 3.6 14.1 50.1 144.1 432.1 rd IMD3 (3 -order) -37 -45 -24 -23 -18 IMD5 (5th-order) -36 -36 -35 -45 -36 th IMD7 (7 -order) -43 -46 -39 -50 -54 IMD9 (9th-order) -63 -71 -55 -52 -66 Add -6 dB for IMD referred to 2-tone PEP 26a. Noise IMD Test. This test is similar to Test 26, except that a white-noise baseband is applied to the USB port from the tone-generator program. Spectrograms are captured at 100W and 25W PEP, as shown in Figure 25. Note that the IMD skirts are steeper at the lower power level. 33 Figure 20: Spectral display of 2-tone IMD at 3.6 MHz, 100W PEP. Figure 21: Spectral display of 2-tone IMD at 14.1 MHz, 100W PEP. 34 Figure 22: Spectral display of 2-tone IMD at 50.1 MHz, 100W PEP. Figure 23: Spectral display of 2-tone IMD at 144.1 MHz, 100W PEP. 35 Figure 24: Spectral display of 2-tone IMD at 432.1 MHz, 75W PEP. Figure 25: Noise modulation, showing IMD skirts. 36 27: AM sidebands and THD with single-tone modulation. As in Test 26 above, the spectrum analyzer is connected to the IC-7100 RF output via a 50 dB high-power attenuator. On the IC-7100, RF Power is adjusted for 25W resting carrier. A 1 kHz test tone is applied to the USB port from the tone-generator program running on the laptop computer. The spectrum analyzer records the carrier and sideband parameters. Test Conditions: 14100 kHz AM, 25W carrier output, DATA OFF MOD = USB, USB Level = 50% (default). On computer, adjust USB Codec device volume for -7 dBc test tone level (90% modulation.) Figure 26 shows the carrier and sideband levels. Calculated THD ≈ 1.6%. Figure 26: AM Sidebands for 90% Modulation. 28: Transmitter harmonics & spectral purity. Once again, the spectrum analyzer is connected to the IC-7100 RF output via a 60 dB high-power attenuator. RF Power is adjusted for rated CW output on each band in turn. The 0 dBm reference level equates to 100W. The spectrum analyzer’s harmonic capture utility is started. Test Conditions: 3.6, 14.1, 50.1, 144.1, 432.1 MHz, RTTY, rated output to 50Ω load. Utility start and stop frequencies are configured as shown in Figures 27b, 28b, 29b, 30 and 31. Harmonic data are presented for HF, and spur sweeps for HF/VHF/UHF. It will be seen that harmonics and spurs are well within specifications. 37 Figure 27a. Figure 27b. 38 Figure 28a. Figure 28b. 39 Figure 29. Figure 30. 40 Figure 31. 29: Transmitted composite noise. The spectrum analyzer is connected to the IC-7100 RF output via a 60 dB high-power attenuator. The spectrum analyzer’s phase-noise utility is started. Figures 32a through 32c are the resulting composite-noise plots. Test Conditions: 3.6, 14.1, 50.1. 144.1 and 432.1 MHz RTTY, rated output to 50Ω load. Utility minimum/maximum offset and spot frequencies configured as shown in Figures 32a through 32c. (Note: The limitation of this measurement method is that the measured noise power is close to the spectrum analyzer’s own noise floor.) 41 Figure 32a: Composite noise at 14.1 and 3.6 MHz, 100W. Figure 32b: Composite noise at 50.1 and 14.1MHz, 100W. 42 Figure 32c: Composite noise at 144.1 MHz, 50W and 432.1 MHz, 35W. 30: Spectral display of CW keying sidebands. The spectrum analyzer is connected to the IC-7100 RF output via a 60 dB high-power attenuator. The -10 dBm reference level equates to 100W. A series of dits is transmitted at the highest keying speed. Test Conditions: 14.1 MHz CW, 100W output to 50Ω load. Keying speed 48 wpm (KEY SPEED max.) using internal keyer. CW rise time = 4 ms (default). Spectrum analyzer RBW is 10 Hz, video-averaged; sweep time < 4 sec. Figures 33a and 33b show the transmitter output ±5 kHz from the carrier. Note the “comebacks” at ±4 kHz; these increase in amplitude as keying rate is increased and decrease at longer rise-time values. They are at < -80 dBc, so they should not normally create an on-air issue. 43 Figure 33a: Keying sidebands at 48 wpm, 4 ms rise-time 14.1 MHz, 100W. Figure 33b: Keying sidebands at 48 wpm, 8 ms rise-time 14.1 MHz, 100W. 44 31a. CW keying envelope: The oscilloscope is terminated in 50 and connected to the IC-7100 RF output via a 50 dB high-power attenuator. A series of dits is transmitted from the internal keyer at the highest keying speed (48 wpm) in QSK mode (F-BK). Test Conditions: 14.1MHz CW, 100W output to 50Ω load. CW rise time = 4 ms (default). Figure 34: Keying envelope at 48 wpm, 4 ms rise time, 10 ms/div. 31b. CW QSK recovery test: This test was devised to measure the maximum speed at which the receiver can still be heard between code elements in QSK CW mode. The IC-7100 is terminated in a 50100W load via a directional coupler. A test signal is injected into the signal path via the directional coupler; a 20 dB attenuator at the coupled port protects the signal generator from reverse power. Test signal level is adjusted for S3…S5 at the receiver. As the coupler is rated at 25W max., RF PWR is set at 10W. Test Conditions: 14.010 MHz, 500 Hz CW, preamp off, ATT off, NR off, NB off, F-BK on, rise time = 4 ms, RF PWR at 10W, KEY SPEED at max., CW Pitch at 12 o’clock. Test signal at 14.0101 MHz. Sidetone = 600 Hz, received tone = 700 Hz. Starting at minimum KEY SPEED, transmit a continuous string of dits and increase KEY SPEED until the received tone can just no longer be heard in the spaces between dits. In the current test, the received tone could still be heard distinctly at 26 wpm. 32: ACC Pin 11 (MOD, analog baseband input) level for 100W output.) A 1 kHz test tone is injected into ACC Pin 11, and the input voltage required for 100W RF output is noted. Test Conditions: 14100 kHz USB, DATA OFF MOD = ACC, DATA-1 MOD = ACC, TBW = WIDE/MID/NAR (default values), Bass/Treble = 0 dB (default), test tone 1 kHz. 45 Adjust test tone level for ≈ 100W output in USB and USB-D1 modes. The required input levels were 100 mV rms for 100W output in USB, and 100 mV RMS for 100W output (max. obtainable) in USB-D1. 32a: Carrier and opposite-sideband suppression. A 1 kHz test tone is applied to ACC Pin 1, and then via the USB port. Carrier and opposite-sideband suppression are checked on the spectrum analyzer at 100W RF output for both cases. Test Conditions: 14100 kHz USB, DATA OFF MOD = ACC/USB, DATA-1 MOD = ACC/USB, TBW = WIDE (default), test tone 1 kHz. Adjust test tone level for 100W output. Read carrier amplitude at 14100 kHz, and opposite-sideband amplitude at 14099 kHz. Test Result: For ACC and USB test-tone input, carrier and opposite sideband both < -80 dBc (at or below the spectrum analyzer’s noise floor). See Figure 35. Figure 35: Carrier & opposite-sideband suppression at 14.1 MHz. 46 32b: SSB transmit audio-frequency response via USB port. In this test, a white-noise baseband is applied to the USB port from a tone-generator program running on a laptop computer. The spectrum analyzer is connected to the IC-7100 RF output via a 60 dB high-power attenuator. Test Conditions: 14100 kHz USB, DATA OFF MOD = USB, USB Level = 50% (default). Test signal: white noise. WIDE, MID and NAR TBW are at default values. On computer, adjust USB Audio Codec device volume for 50% ALC reading. Using Marker on spectrum analyzer, measure frequency and relative amplitude at lower passband edge. Move marker “down” 6 dB and record frequency. Move marker “down” a further 14 dB and record frequency again. Repeat procedure for upper passband edge. The test data are shown in Table 25. Table 25: Measured SSB TX lower and upper cutoff frequencies (via USB input). TBW 1 kHz = 0 dB ref. WIDE MID NAR Lower (Hz) -20 dB 47 153 367 Upper (Hz) -6 dB 73 236 449 -6 dB 2960 2733 2540 -20 dB 3053 2827 2635 33: FM and DV parameters: In this group of tests, FM deviation (voice and CTCSS), CTCSS decoder sensitivity and DV occupied bandwidth are checked. 33a: FM deviation: The IC-7100 output is connected to the RF IN/OUT port (75W max. input) of the communications test set. Voice and CTCSS peak deviation are checked. Test Conditions: 146.0 MHz, FM, FIL1, RF PWR set at 2W. Speak loudly into mic and read deviation. Test Result: Peak deviation = 4 kHz. Next, select CTCSS TONE = 100 Hz (1Z). Key IC-7100 and read tone frequency and deviation on test set. Test Result: Tone frequency 100.045 Hz, deviation 600 Hz. 33b: CTCSS decode sensitivity: The test set is configured as an RF generator. TSQL (CTCSS tone squelch) is enabled in the IC-7100 and the minimum RF input power and tone deviation at which the tone squelch opens are measured. Test Conditions: 146.0 MHz, FM, FIL1, ATT off, CTCSS TSQL on, TONE 100 Hz (1Z). At test set, CTCSS tone deviation = 600 and 100 Hz. Table 26: CTCSS Decode Sensitivity f = 146.0 MHz Input power dBm Tone Dev. Hz Preamp off Preamp on 600 100 (open) 100 (close) -119 -63 -65 -127 -70 -73 47 33c. DV Spectrum & Occupied Bandwidth: The spectrum analyzer is configured for OCC BW measurement, and connected to the IC-7100 RF output via a 60 dB high-power attenuator. The -10 dBm reference level equates to 50W. Test Conditions: 146.0 MHz, 50W, DV. Figure 36: DV Spectrum & Occupied Bandwidth. 34. References: 1. “Noise Power Ratio (NPR) Testing of HF Receivers”: http://www.ab4oj.com/test/docs/npr_test.pdf Copyright © 2013 A. Farson VA7OJ/AB4OJ. All rights reserved. August 25, 2013. 48