1
APPENDIX II
MACHINERY INSTITUTE REFERENCE COMBINE CAPACITY RESULTS
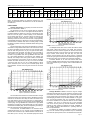
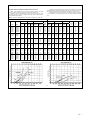
FIGURE 22 shows capacity differences in wheat crops for the three years. In 1987,
the Katepwa wheat crops had below average straw yield, and average grain yield. They
also had average grain moisture and slightly below average straw moisture content.
Results show that the reference combine is important in determining the effect
of crop variables and in comparing capacity results of combines evaluated in different
years.
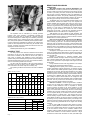
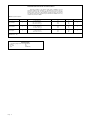
TABLE 7 and FIGURES 21 and 22 present the capacity results for the PAMI
reference combines in barley and wheat crops harvested from 1984 to 1987.
FIGURE 21 shows capacity differences in barley crops for 1984, 1986 and 1987.
The 1987 Argyle barley crop shown in TABLE 7 had average grain and straw yield and
average straw and grain moisture.
TABLE 7. Capacity of the PAMI Reference Combines at a Total Grain Loss of 3% Yield
Crop Conditions
Width of Cut
Variety
ft
m
bu/ac
t/ha
Straw %
Grain %
MOG/G
Ratio
lb/min
t/h
bu/h
t/h
lb/min
t/h
Grain
Cracks
%
Argyle
Harrington
Columbus
Katepwa”A”
Katepwa”B”
Katepwa”C”
24
20
25
40
60
60
7.2
6.4
7.6
12.2
18.3
18.3
69
79
43
31
37
31
3.5
4.3
2.9
2.2
2.6
2.1
12.6
7.7
5.0
6.9
8.3
12.8
13.0
10.8
13.4
12.9
14.5
16.0
0.82
0.81
1.16
0.65
0.64
1.07
395
370
540
520
580
630
10.8
10.1
14.7
14.2
15.8
17.2
600
570
465
800
905
590
13.1
12.4
12.7
21.8
24.6
16.1
876
825
1005
1320
1485
1220
23.8
22.5
27.4
35.9
40.4
33.2
0.5
1.5
1.5
1.5
2.0
1.5
1.5
3.0
3.5
2.5
2.0
1.5
1.2
0.1
0.1
0.2
0.1
0.1
1 Barley
9 Wheat
8 Wheat
6
Harrington
Columbus
Katepwa
56
56
29
17.0
17.0
8.9
62
51
49
3.3
3.4
3.3
10.5
8.8
6.5
10.8
16.7
14.0
0.64
1.14
1.32
424
647
644
11.6
17.7
17.6
828
568
488
18.1
15.5
13.3
1090
1210
1135
29.7
33.0
31.0
0.4
1.5
1.8
0.3
4.6
1.7
0.2
3.5
1.0
1
9
8
4
Bonanza
Bonanza
Neepawa
Neepawa
42
24
44
22
12.8
7.3
13.4
12.8
52
77
36
44
2.8
4.1
2.4
3.0
15.0
11.3
6.3
8.7
11.2
11.6
10.9
10.2
0.70
0.66
1.32
1.18
363
352
539
601
9.9
9.6
14.7
16.4
648
687
408
509
14.1
14.6
11.1
13.9
875
880
950
1110
23.8
24.0
25.9
30.3
0.5
0.5
1.1
4.5
1.0
1.0
5.5
7.0
1 Barley
9 Wheat
8 Wheat
6
Harrington
Columbus1
Katepwa
28
42
29
8.5
12.8
8.9
59
32
50
3.7
2.2
3.4
10.5
11.8
7.5
9.2
14.7
14.1
0.56
1.09
1.33
294
438
420
8.0
12.0
11.5
656
402
316
14.3
11.0
8.6
820
835
735
22.3
22.8
20.1
0.8
1.2
1.3
0.5
4.9
1.5
0.2
3.0
0.7
1
9
8
5
Barley
Barley
Wheat
Wheat
Argyle
Bonanza
Neepawa
Katepwa
60
55
42
41
18.0
16.8
12.8
12.5
75
83
42
82
4.0
4.5
2.8
4.2
25.5
21.0
23.7
24.8
11.4
15.0
18.0
18.5
0.94
0.76
1.43
0.95
293
285
391
435
8.0
7.7
10.7
11.9
390
469
273
458
8.5
10.2
7.5
12.5
600
660
660
890
16.4
18.0
18.0
24.3
2.0
1.0
4.9
2.5
1.0
1.7
2.3
1.3
0.4
1.2
0.2
0.2
Barley
1
Barley
9
Wheat
8
Wheat
4
Wheat
Bonanza
Bonanza
Neepawa
Neepawa
Neepawa
42
24
44
42
42
12.8
7.3
13.4
12.8
12.8
68
85
42
41
23
3.7
4.8
2.8
2.8
1.8
18.5
12.0
6.7
8.5
7.2
12.9
12.1
11.8
10.3
12.5
0.74
0.62
1.47
1.17
0.99
275
213
308
356
345
7.5
5.8
8.4
9.7
9.4
464
429
209
304
348
10.1
9.4
5.7
8.3
9.5
645
550
510
655
695
17.6
15.0
13.9
17.9
19.0
Crop
1
9
8
7
R
E
F
II
R
E
F
I
Capacity Results
Barley
Barley
Wheat
Wheat
Wheat
Wheat
Barley
Barley
Wheat
Wheat
Crop Yield
Moisture Content
FIGURE 21. Total Grain Loss for the PAMI Reference Combines in Barley.
MOG Feedrate
Grain Feedrate
Total Feedrate
Dockage
%
Foreign
Material
%
FIGURE 22. Total Grain Loss for the PAMI Reference Combines in Wheat.
Page
13