1
SML
8
Maintenance
Maintenance
The present chapter describes the measures that are necessary for maintaining, storing and packing
the instrument.
The instrument does not need a periodic maintenance. What is necessary is essentially the cleaning of
the outside of the instrument.
However, it is recommended to check the rated data from time to time.
Cleaning the Outside
The outside of the instrument is suitably cleaned using a soft, line-free dustcloth.
Caution!
Do not use solvents such as thinners, acetone and similar things in any case, because
otherwise the front panel labeling or plastic parts will be damaged.
Storing and Packing
°
°
The instrument can be stored at a temperature of –40 C to +70 C. When stored for an extended period
of time, the instrument should be protected against dust.
The original packing should be used, particularly the protective covers at the front and rear, when the
instrument is to be transported or dispatched. If the original packing is no longer available, use a sturdy
cardboard box of suitable size and carefully wrap the instrument to protect it against mechanical
damage.
Exchanging the Lithium Battery
A lithium battery with a service life of approx. 5 years serves to supply the RAM with power. When the
battery is discharged, the data stored will be lost. Exchanging the battery is described in the Service
Manual.
1090.3123.12
8.1
E-3
SML
9
List of Error Messages
Error Messages
The present chapter contains the error messages (short-term and long-term messages) of the SML.
Short-term message
The short-term message is displayed in the status line. Part of it
overwrites the status indications and disappears after approx. 2 seconds
or in the case of a new entry.
The instrument shows, e.g., short-term messages if the attempt is made
to enter an overrange or if incompatible operating modes deactivate one
another.
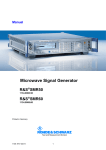
Long-term message
The long-term message is displayed in the status line by means of the
message "Err". Pressing the [ERROR] key calls the ERROR page in
which the messages are entered. Several messages can be entered at
the same time. The long-term message remains existing until there is no
cause any more. The ERROR page is exited using the [BACK] key.
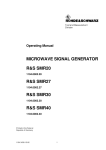
The ERROR page offers access to long-term messages if the [ERROR] key is pressed.
Fig. 9-1
ERROR page
Notes:
- An error message "Err" does not necessarily point to a defect instrument. There are
various operating states which can cause an ERROR message, e.g. if the instrument is
set to external reference but no external reference is connected.
- Error -313 indicates the loss of calibration data and is also applicable in case of a cold
start (key [PRESET] is pressed during switch-on). The calibration values can be
restored with internal calibration routines. These routines are accessible via menu
Utilities - Calib (see section on calibration).
1090.3123.12
9.1
E-3
List of Error Messages
SML
List of Error Messages
The following list contains all SCPI- and device-specific error messages for errors occurring in the
instrument. The meaning of negative error codes is defined in SCPI, positive error codes mark devicedependent errors.
The lefthand column of the table below contains the error code. In the righthand column, the error text
entered into the error/event queue and shown on the display is in bold type. Below the error text there is
an explanation of the error.
SCPI-Specific Error Messages
No error
Error code
0
Error text with queue poll
Explanation of error
No error
This message is output if the error queue contains no entries.
Command Error – errored command; sets bit 5 in the ESR register
Error code
Error text with queue poll
Explanation of error
-100
Command error
The command is errored or invalid.
-101
Invalid character
The command contains an invalid character.
Example: A header contains an ampersand, "SOURCE&".
-102
Syntax error
The command is invalid.
Example: A command contains block data which the instrument does not accept.
-103
Invalid separator
The command contains an illegal character instead of a terminator.
Example: A semicolon after the command is missing.
-104
Data type error
The command contains an invalid value information.
Example: ON is entered instead of a numerical value for frequency setting.
-105
GET not allowed
A Group Execute Trigger (GET) is entered within a command line.
-108
Parameter not allowed
The command contains too many parameters.
Example: The command SOURce:FM:INTernal:FREQuency allows for a frequency entry only.
-109
Missing parameter
The command contains too few parameters.
Example: The command SOURce:FM:INTernal:FREQuency requires a frequency entry.
1090.3123.12
9.2
E-3
SML
List of Error Messages
Command Error, continued
Error code
Error text with queue poll
Explanation of error
-112
Program mnemonic too long
The header contains more than 12 characters.
-113
Undefined header
The header is not defined for the instrument.
Example: *XYZ is undefined for every instrument.
-114
Header suffix out of range
The header contains an illegal numerical suffix.
Example: SOURce3 does not exist in the instrument.
-123
Exponent too large
The absolute value of the exponent is larger than 32000.
-124
Too many digits
The number contains too many digits.
-128
Numeric data not allowed
The command contains a number which is not allowed at this position.
Example: The command SOURce:FREQuency:MODE requires the entry of a text parameter.
-131
Invalid suffix
The suffix is invalid for this instrument.
Example: nHz is not defined.
-134
Suffix too long
The suffix contains more than 12 characters.
-138
Suffix not allowed
A suffix is not allowed for this command or at this position of the command.
Example: The command *RCL does not allow for a suffix to be entered.
-141
Invalid character data
The text parameter either contains an invalid character or it is invalid for this command.
Example: spelling mistake in parameter entry; SOURce:FREQuency:MODE FIKSed.
-144
Character data too long
The text parameter contains more than 12 characters.
-148
Character data not allowed
The text parameter is not allowed for this command or at this position of the command.
Example: The command *RCL requires the entry of a number.
-158
String data not allowed
The command contains a valid character string at a position which is not allowed.
Example: A text parameter is entered in inverted commas, eg SOURce:FREQuency:MODE "FIXed"
-161
Invalid block data
The command contains errored block data.
Example: An END message was received before the expected number of data was received.
-168
Block data not allowed
The command contains valid block data at a position which is not allowed.
Example: The command *RCL requires the entry of a number.
-178
Expression data not allowed
The command contains a mathematical expression at a position which is not allowed.
1090.3123.12
9.3
E-3
List of Error Messages
SML
Execution Error – error in the execution of a command; sets bit 4 in the ESR register
Error code
Error text with queue poll
Explanation of error
-203
Command protected
The desired command could not be executed as it is protected by a password.
Use the command SYSTem:PROTect OFF, <password> to enable the desired command.
Example: The command CALibrate:PULSe:MEASure? is password-protected.
-211
Trigger ignored
The trigger (GET, *TRG or trigger signal) was ignored because of the instrument timing control.
Example: The instrument was not ready to answer.
-221
Settings conflict
The settings of two parameters are conflicting.
Example: FM and PM cannot be switched on at the same time.
-222
Data out of range
The parameter value is out of the permissible range of the instrument.
Example: The command *RCL only permits entries between 0 and 50.
-223
Too much data
The command contains too many data.
Example: The instrument does not have sufficient memory space.
-224
Illegal parameter value
The parameter value is invalid.
Example: An invalid text parameter is entered, eg TRIGger:SWEep:SOURce TASTe
-225
Out of memory
The available instrument memory space is exhausted.
Example: An attempt was made to create more than 10 lists.
-226
Lists not of same length
The parts of a list have different lengths. This error message is also displayed if only part of a list has
been transmitted via the IEC/IEEE bus. All parts of a list have to be transmitted before the list is
executed.
Example: The POWer part of a list is longer than the FREQuency part, or only the POWer part has been
transmitted.
-230
Data corrupt or stale
The data are incomplete or invalid.
Example: The instrument has aborted a measurement.
-240
Hardware error
The command cannot be executed because of a hardware fault of the instrument.
-241
Hardware missing
The command cannot be executed because of hardware missing.
Example: An option is not fitted.
-255
Directory full
The list management cannot accept any more lists since the maximum number of lists has already been
attained.
Example: An attempt was made to create more than the allowed number of UCOR lists.
1090.3123.12
9.4
E-3
SML
List of Error Messages
Device Specific Error - sets bit 3 in the ESR register
Error code
Error text with queue poll
Explanation of error
-310
System error
This error message suggests an error within the instrument. Please inform your R&S service center.
-311
Memory error
Error in instrument memory.
-313
Calibration memory lost
Loss of stored calibration data. The YFOM and ALC AMP calibration data can be restored by means of
internal routines (see chapter 4, section "Calibration").
-314
Save/recall memory lost
Loss of the nonvolatile data stored with the command *SAV?.
-315
Configuration memory lost
Loss of the nonvolatile configuration data stored by the instrument.
-330
Self-test failed
The self-test could not be executed.
-350
Queue overflow
This error code is entered into the error queue instead of the actual error code when the error queue is
full. The code indicates that an error has occurred but has not been accepted. The error queue can
accept 5 entries.
-360
Communication error
An error has occurred during the transmission or reception of data on the IEC/IEEE bus or via the RS232-C interface.
Query Error – error in data request; sets bit 2 in the ESR register
Error code
Error text with queue poll
Explanation of error
-410
Query INTERRUPTED
The query was interrupted.
Example: After a query, the instrument receives new data before the response has been sent completely.
-420
Query UNTERMINATED
The query is incomplete.
Example: The instrument is addressed as a talker and receives incomplete data.
-430
Query DEADLOCKED
The query cannot be processed.
Example: The input and output buffers are full; the instrument cannot continue operating.
1090.3123.12
9.5
E-3
List of Error Messages
SML
SML-Specific Error Messages
Device-dependent Error – device-specific error; sets bit 3 in the ESR register.
Error code
Error text in the case of queue poll
Error explanation
110
Output unleveled
The level control loop is deactivated.
115
Level overrange
The level is above the limit value guaranteed.
116
Level underrange
The level is below the limit value guaranteed.
117
Dynamic level range exceeded
The difference between the maximal and minimal value of a level list is above 20 dBm. An exact level
setting is no longer guaranteed.
135
Pulse input signal missing
No pulse input signal available.
140
This modulation forces other modulations OFF
A modulation has been switched on which cannot be used at the same time as an already active
modulation. The previous modulation has been switched off.
171
Oven cold
The reference oscillator has not yet reached its operating temperature.
180
Calibration failed
Calibration could not be executed.
181
REF OSC calibration data not used because ADJUSTMENT STATE is ON
The reference-oscillator calibration data are not used as long as ADJUSTMENT STATE is activated.
200
Cannot access hardware
The data transmission to a module was unsuccessful.
201
Function not supported by this hardware revision
A later version of certain parts of the instrument is necessary to execute the function selected.
202
Diagnostic A/D converter failure
Diagnostic A/D converter has failed.
241
No list defined
There is no list defined..
243
Dwell time adjusted
A dwell time given on a list cannot be processed by the unit. The setting was automatically adjusted.
251
No User Correction Table; zero assumed
An attempt has been made to switch on user correction, but no UCOR table has been stored in the
instrument yet. The instrument behaves as if a table was called which only contains 0-values.
260
Invalid keyboard input ignored
An invalid input via the keyboard is not considered.
265
This parameter is read only
An attempt has been made to change a fixedly specified value.
1090.3123.12
9.6
E-3
SML
List of Error Messages
Continuation: Device-dependent Error
Error code
Error text in the case of queue poll
Error explanation
270
Data output aborted
Data output was aborted on the IEC/IEEE-bus.
Example: The key [LOCAL] was pressed.
304
String too long
A character string which is too long was received via the IEC bus. The names of lists may have a length
of maximally seven letters.
305
Fill pattern too long; trunctated
More data have been entered with block function FILL in the list editor than the filling range (RANGE) set
permits. The exceeding data are ignored.
306
No fill pattern specified
An attempt was made to execute a filler function without having to indicate a filler pattern.
1090.3123.12
9.7
E-3
Possible Error Sources
SML
Possible Error Sources
The error messages issued by the continuous monitoring of diagnosis points are described in the
following table. Troubleshooting should be performed according to the order given in the table since an
error mentioned further down could be caused by those above.
Table 9-1
Error messages of hardware monitoring
Displayed message
Error
174,“Reference PLL
unlocked“
Possible source
The PLL of the
800 MHz reference
oscillator on the main
board is out of
synchronization:
= > Output frequency
not correct
If unit is set to external reference:
175,“Main PLL
unlocked“
The PLL of the main
oscillator on the main
board is out of
synchronization:
=> Output frequency
not correct
110,“Output
unleveled; OPU1“
The level control for the - Level outside the specified range
output level on the main
- Overload at AM-EXT-DC
board is switched off:
=> Output level not
Calibration is missing or erroneous for example after
correct
an exchange of modules or batteries
-
No external reference signal at the 10 MHz REF
connector (rear of unit)
-
Level or frequency of external reference does not
correspond to data sheet value
-
Calibration is missing or erroneous for example
after an exchange of modules or batteries
Error messages issued as a result of loss of data, for example on exchanging a battery or software
update are listed in the following table.
Table 9-2
Error messages as a result of loss of data
Displayed messages
-313,"Calibration
memory lost ;
XXXXXXXXX",
Error
Internal calibration data
are missing
1
Possible source and troubleshooting
-
Data loss due to low battery voltage
-
Data loss due to software update
-
Data loss due to "Factory Preset"
Possible troubleshooting:
-313,"Calibration
Calibration value is
memory lost;
missing
Reference Oscillator",
-315,“Configuration
memory lost“
One or more EEPROM
data blocks are missing
-
Perform internal calibration (see chapter 4)
-
Loss of non-volatile EEPROM data
Possible troubleshooting:
-
Adjustment of 10 MHz reference frequency
(see SML service manual)
-
Loss of non-volatile EEPROM data
1
where XXXXXXX indicates the name of the missing calibration : IF Filter, Main Loop, Harmonic Filter,
Mult Filter, Level Preset, Lfgen Level, FM Offset
1090.3123.12
9.8
E-3
SML
Preliminary Remark
10
Performance Test
The present Performance Test is valid for model SML01.
Preliminary Remark
• The rated characteristics of the signal generator are checked after a warm-up time of at least 15
minutes. A recalibration of the unit is not required. FM offset calibration is an exception, however.
• A defined default state is set prior to each measurement by pressing the PRESET key.
• The values stated hereafter are not guaranteed values. Only the data sheet specifications shall be
binding.
• The values specified in the data sheet are guaranteed limits. The tolerances of the instruments used
in the performance test must be added to the limits because of their measurement uncertainty.
Measuring Equipment and Accessories
Table 10-1
Measuring equipment and accessories
Item
Instrument type
Recommended
characteristics
Suitable unit
1
Frequency counter
Frequency range up to
1100 MHz. Internal reference
10 MHz
Contained in item
2 or 10
2
RF spectrum analyzer
Frequency range up to
1100 MHz
FSEA30
1065.6000.30 Settling time
level accuracy
Output reflection
coefficient
Harmonics
Spurious
Pulse modulation
3
Signal generator with
high spectral purity
Phase noise at 1 GHz:
typ. <-128 dBc/Hz at 20 kHz
SME03
SMHU
1038.6002.03 output reflection
835.0011.52
coefficient
SSB phase noise
Broadband noise
4
Storage oscilloscope
DC 100 MHz, 0.1V/div
SSB phase noise
Pulse modulation
5
Phase noise test set
Mixer: 10 MHz to 1100 MHz
Lowpass filter: approx. 500 kHz
Preamplifier with gain of
approx. 30 dB, input noise
<2 nV (1 Hz), DC decoupling
after mixer for oscilloscope
SSB phase noise
6
RF power meter
9 kHz to 1100 MHz
1090.3123.12
NRVS with
NRV-Z51
10.1
R&S Order
No.
Use/measurement
Frequency accuracy
1020.1809.02 Level accuracy
857.9004.02
Non-interrupting level
setting
E-3
Test Setups
SML
Item
Instrument type
Recommended
characteristics
Suitable unit
R&S Order
No.
Use/measurement
7
Precision attenuators
Frequency range 9 kHz to 1100 RSP
MHz
Attenuation 0 to 125 dB
I = 50 Ω
8
Controller
IEC-625-1 interface
9
SWR bridge
1 MHz to 1100 MHz
Directivity >40 dB
ZRC
1039.9492.55/
1039.9492.52
Output reflection
coefficient
10
Modulation analyzer
100 kHz to 1100 MHz, AM, FM,
PhiM, stereo coder, stereo
decoder, distortion meter,
weighting filter ITU-R, ITU-T
FMB with option
FMA-B1,
FMA-B2,
FMA-B3,
FMA-B4
856.5005.52
855.2002.52
855.0000.52
856.0003.52
855.6008.52
Residual FM
Residual AM
AM/FM/PhiM modulation
LF generator
Stereo modulation
11
Sinewave generator
10 Hz to 500 kHz,
8 V (Vpeak)
ADS
AFG
1012.4002.02 AM/FM/PhiM modulation
377.2100.02
Overvoltage protection
12
AC/DC voltmeter
DC to 1 MHz
URE3
350.5315.03
13
Low-noise preamplifier
5 kHz to 1100 MHz
Gain >20 dB,
Noise figure <10 dB
0831.3515.02 Level accuracy
Settling time
LF generator
Level accuracy
Test Setups
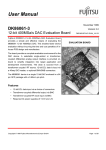
Standard Test Setup
Test setup 1:
Test equipment
-
-
-
Modulation analyzer (Table Measuring equipment and accessories,
item 10)
or
Spectrum analyzer (Table Measuring equipment and accessories,
item 2)
or
Frequency counter (Table Measuring equipment and accessories,
item 1)
Test setup
10 MHz reference
RF
1090.3123.12
10.2
Measuring
instrument
E-3
SML
Test Setups
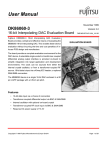
Test Setup for Setting Time
Test setup 2:
Test equipment
-
Spectrum analyzer with video output (Table Measuring equipment
and accessories, item 2)
Storage oscilloscope (Table Measuring equipment and
accessories, item 4)
Controller (Table Measuring equipment and accessories, item 8)
Test setup
IEC/IEEE bus
10 MHz reference
Controller
RF
Analyzer
RF
EOI
Video Oscilloscope
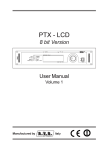
Test Setup for SSB Phase Noise and Broadband Noise
Test setup 3:
Test equipment
-
Second signal generator (Table Measuring equipment and
accessories, item 3)
Phase noise test set, consisting of
Mixer with lowpass and preamplifier (Table Measuring equipment
and accessories, item 5)
Oscilloscope (Table Measuring equipment and accessories, item 4)
Spectrum analyzer (Table Measuring equipment and accessories,
item 2)
Test setup
10 MHz reference
Signal generator
RF
RF
Mixer,
Spectrum
analyzer
Preamplifier
Oscilloscope
1090.3123.12
10.3
E-3
Test Setups
SML
Test Setup for Output Reflection Factor
Test setup 4:
Test equipment
-
SWR bridge (Table Measuring equipment and accessories, item 9)
Second signal generator (Table Measuring equipment and
accessories, item 3)
Spectrum analyzer (Table Measuring equipment and accessories,
item 2)
Test setup
10 MHz reference
Signal generator
Bridge
RF
Note:
Source
Test port
Refl.
Outp.
Spectrum
analyzer
The test port of the bridge is screwed to the EUT. The INPUT
connector of the directional coupler is screwed to the EUT.
The second signal generator is connected to the output and
the analyzer to the decoupling output (-13 dB).
Test setup 5:
Test equipment
-
Storage oscilloscope (Table Measuring equipment and
accessories, item 4)
Test setup
Pulse/Video
Trigger ext.
RF
RF
Note:
1090.3123.12
Oscilloscope
Since the oscilloscope has a high-impedance input, the
BNC line at the oscilloscope has to be terminated with
50 Ω via a T piece.
10.4
E-3
SML
Test Procedure
Test Procedure
Display and Keyboard
Testing Display
½ Switch on unit.
Õ The basic menu is displayed after a few seconds.
½ Change setting in menu item UTILITIES DISPLAY CONTRAST
using the rotary knob
Õ The contrast changes from dark to bright.
Testing Keyboard
½ Press keys and check response on display.
Frequency
Frequency Setting
Test setup
½ Test setup 1 with frequency counter
Settings on SML
-
Measurement
½ The measured values should be indicated at the accuracy allowed
by the resolution of the frequency counter.
1090.3123.12
UTILITIES REF OSC SOURCE EXTERN
LEVEL: 0 dBm
FREQ: Test frequency, frequency accuracy
Test frequencies, frequency accuracy: 60 MHz, 100 MHz, 250
MHz, 600 MHz, 1000 MHz
10.5
E-3
Test Procedure
SML
Setting Time
Test setup
½ Test setup 2
Test method
The spectrum analyzer is operated as a slope detector with a 0 Hz
span. A controller transmits the start and target frequency via the
IEC/IEEE bus. The storage oscilloscope is connected to the video
output of the analyzer and triggered on the EOI line of the IEC/IEEE
bus by the positive edge. If the controller switches from start to end
frequency, the settling process can be observed on the storage
oscilloscope.
Preparation of measurement
½ Synchronize reference frequencies of SML and analyzer.
½ Make IEC/IEEE-bus and RF connections.
½ Connect storage oscilloscope to video output of analyzer.
½ Apply trigger line to EOI line (pin 5) of IEC/IEEE bus.
½ Settings on storage oscilloscope
- Time base > settling time to be measured,
- Sensitivity according to video output of analyzer,
- Triggering of calibration is free-running.
½ Settings on spectrum analyzer
- Reference level -5 dBm,
- Amplitude scale 1 dB/div,
- Resolution bandwidth 10 kHz,
- Video bandwidth 100 kHz,
- Span 30 kHz.
½ Reduce center frequency of analyzer starting from the end
frequency so that the filter edge is displayed at the center of the
screen.
½ Reduce span to 0 Hz and calibrate frequency scale on (freerunning) oscilloscope by 100 Hz steps on SML.
Settings on SML
-
Measurement
½ Setting on storage oscilloscope see above
- Now external triggering on positive edge at 1.5 V.
LEVEL 0 dBm
UTILITIES REF OSC SOURCE EXTERN
½ First send start and then end frequency from controller.
Õ The settling characteristic is shown on the display of the
externally triggered oscilloscope.
½ Repeat measurement by interchanging the start and end
frequencies.
1090.3123.12
10.6
E-3
SML
Test Procedure
The following settings are to be measured in both directions:
Start frequencies
Target frequencies
303 MHz
75 MHz
1075 MHz
810 MHz
Quick Basic program for controller:
CLS
iecadresse% = 28
IEC/IEEE-bus address of SML (28)
CALL IBFIND("DEV1", generator%)
Open DEV1 and get access number
CALL IBPAD(generator%, iecadresse%)
Set IEC/IEEE-bus address of DEV1 to 28
iecterm% = &HA ’
Set EOS to LINE FEED
CALL IBEOS(generator%, iecterm% + &H800)
CALL IBWRT(generator%, "POW 0dBm")
DO
INPUT "Start frequency in MHz";F1$
INPUT "Stop frequency in MHz";F2$
DO
CALL IBWRT(generator%, "FREQ" + F1$ + "MHz")
PRINT "Frequency:";F1$; "MHz"
DO ’
Wait for key
kbd$ = INKEY$
LOOP UNTIL LEN(kbd$)
SWAP F1$, F2$
LOOP UNTIL kbd$ = CHR$(27) ’
Quit with ESCAPE
INPUT "Repetition (y/n)"; w$
LOOP UNTIL NOT UCASE$(w$) = "J"
END
Reference Frequency
Note
Warm up SML for at least 2 hours prior to measurement.
Test equipment
Frequency counter (Section "Measuring Equipment and Accessories",
item 1)
Test setup
½ Connect frequency counter to output REF EXT at rear of SML.
Measurement
½ Measure frequency.
Evaluation
The frequency error should not exceed the sum of errors made up of
the frequency error in the nominal temperature range and ageing.
1090.3123.12
10.7
E-3
Test Procedure
SML
Spectral Purity
Harmonic Suppression
Test setup
½ Test setup 1 with spectrum analyzer
Settings on SML
-
LEVEL 10 dBm (or max. level according to data sheet)
FREQ test frequency of harmonics
Test frequency of harmonics: 9 kHz, 5 MHz, 76 MHz, 100 MHz,
151 MHz, 200 MHz, 255 MHz, 400 MHz, 605 MHz, 700 MHz,
900 MHz, 1100 MHz
Setting on spectrum analyzer
-
Reference level= test level+10 dB, 10 dB/div
Span 300 kHz, resolution 30 kHz
Measurement
½ First measure the fundamental level as reference, then search
signals at twice or three times the carrier frequency. Make sure
that spectrum analyzer is not overdriven.
Evaluation
The harmonic suppression is the level difference between the
measured harmonic and the SML output signal (in dBc, with reference
to the carrier).
Nonharmonic Suppression
Test setup
½ Test setup 1 with spectrum analyzer
Settings on SML
-
UTILITIES REF OSC SOURCE EXTERN
LEVEL 10 dBm
FREQ test frequency of nonharmonics
Test frequencies of nonharmonics: 899.052 MHz, 1080.003 MHz,
1086.2 MHz, 1086.9535 MHz, 1098.956 MHz, 1095.002 MHz,
979.713 MHz, 927.2776 MHz, 1022.438 MHz, 987.315 MHz,
980.729 MHz
Setting on spectrum analyzer
-
Reference level= test level + 3 dB, 10 dB/div
Start frequency = test frequency – 5 kHz, span 100 kHz
Resolution 1 kHz
Switch on average: 5 samples
Measurement
½ First measure level of fundamental as reference. Then measure
level of nonharmonics, if any.
Evaluation
The nonharmonic suppression is the level difference between the
measured nonharmonic and the SML output signal (in dBc with
reference to the carrier).
Note:
The values for setting the spectrum analyzer are reference values and depend on the
analyzer used. The required settings have to be verified prior to each measurement.
1090.3123.12
10.8
E-3
SML
Test Procedure
SSB Phase Noise
Test setup
½ Test setup 3
Settings on SML
-
Test method
The two signal generators are set to the test frequency and
synchronized with a phase shift of 90° (phase quadrature). The RF
carrier is suppressed by mixing to 0 Hz. Due to the phase quadrature
the mixer supplies a voltage that corresponds to the phase difference
between the input signals. The phase difference is measured by the
spectrum analyzer and can be converted into SSB phase noise.
Measurement
½ Set levels of two signal generators according to the specifications of
the used mixer.
UTILITIES. REF OSC SOURCE EXTERN
LEVEL 0 dBm (or level to mixer specification)
FREQUENCY 1 GHz (or any test frequency)
½ For calibration purposes reduce level of EUT by 40 dB and detune a
signal generator by 20 kHz. Test signal for harmonics, the 2nd and
3rd harmonic should be more than 30 dB below the fundamental.
Measure and note reference value at 20 kHz on analyzer.
½ Revoke detuning and establish phase quadrature. To do this, set
level of EUT again and detune phase offset on auxiliary generator.
Observe mixer output voltage on oscilloscope until the voltage
becomes 0.
½ Read noise voltage on analyzer that is normalized to a bandwidth of
1 Hz (noise level).
Evaluation
½ Form the difference to the reference level and add 6 dB for the
measured (correlated) second sideband and 40 dB to level switching.
If the noise level of the second signal generator is not at least 10 dB
better than that of the EUT, the noise component of the reference
transmitter too has to be determined and calculated.
Õ The value found gives the correct noise level.
Example: The reference level is to be measured at 12 dBm. At 20
kHz a noise level of -78 dBm (1 Hz) is determined. The
difference is 90 dB. In addition to the correction for the
second sideband (6 dB) and the level switching (40 dB) a
noise level of -136 dB or of -136 dBc (dB with reference to
the carrier power) is obtained. If two identical signal
generators are used, the result has to be reduced by 3 dB
for the (uncorrelated) noise power of the reference
transmitter.
The final result is then -139 dBc.
1090.3123.12
10.9
E-3
Test Procedure
SML
Broadband Noise
Test setup
½ Test assembly 3
Settings on SML
-
Test method
Calibration is in the same way as with SSB phase noise. To perform
the measurement, the signal generators are detuned so that the
difference frequency falls in the stopband range of the lowpass filter
for sufficient suppression of the measurement. Then measure a
section of the sum of broadband noise contributions imaged at the
zero line on the spectrum analyzer. The noise spaced at the difference
frequency now is at 0 Hz on the spectrum analyzer. The measurement
is performed at the calibration frequency (20 kHz). This frequency
should be negligibly small compared to the difference frequency. The
measured power must be divided by half due to the imaging at the
zero line.
Measurement
½ Calibration is in the same way as with SSB phase noise.
UTILITIES REF OSC SOURCE EXTERN
LEVEL 0 dBm (or level according to mixer specification)
FREQUENCY 1 GHz (or any test frequency)
½ Detune to offset frequency (2 MHz).
½ Set level of the EUT again and read noise power per Hz on analyzer
at a center frequency of 20 kHz.
Evaluation
½ Form the difference to the reference level and add 43 dB for the
level switching and the image-frequency band.
½ The measured value is the sum of the noise power of the two signal
generators. If the noise level of the second signal generator is not
at least 10 dB better than that of the EUT, the noise component of
the reference transmitter too has to be determined. Since the
reference transmitter is at the LO input, only the phase noise
component has to be considered. It is 3 dB lower than the whole
broadband noise (AM component is suppressed). With two
identical transmitters the correction is thus another 1.8 dB. Note
that the reference transmitter has a higher level which further
improves the noise level.
Õ The value found gives the correct noise level.
1090.3123.12
10.10
E-3
SML
Test Procedure
Residual FM
Test setup
½ Test setup 1 with modulation analyzer
Settings on SML
-
LEVEL 0 dBm
FREQ 1 GHz
Setting on modulation analyzer
-
Demodulation: FM
Detector: RMS
Filter: ITU-T (CCIT) or 20 Hz to 23 kHz
Measurement
½ Read frequency deviation on modulation analyzer on both filters.
Residual AM
Test setup
½ Connect modulation analyzer to RF output of SML.
Settings on SML
-
LEVEL 0 dBm
FREQ 1 GHz
Setting on modulation analyzer
-
Demodulation: AM
Detector: RMS
Filter: 20 Hz to 23 kHz
Measurement
½ Read residual AM on modulation analyzer.
1090.3123.12
10.11
E-3
Test Procedure
SML
Level
Level Frequency Response and Linearity
Test equipment
-
Power meter (Table Measuring equipment and accessories, item 6)
Precision attenuator (Table Measuring equipment and accessories,
item 7)
Spectrum analyzer (Table Measuring equipment and accessories,
item 2)
Low-noise preamplifier (Table Measuring equipment and
accessories, item 13)
Test method for level in measurement range of power meter (up to approx. - 20 dBm)
Test setup
½ Connect power meter to RF output connector.
Settings on SML
-
-
FREQ Test frequency level accuracy
Test frequencies: 9 kHz, 5 MHz, 5.1 MHz, 76 MHz, 77 MHz, 151
MHz, 255 MHz, 302 MHz, 605 MHz, 606 MHz, 725 MHz, 970 MHz,
1100 MHz
LEVEL Test level 1 level accuracy
Test level 1: 13 dBm, 10 dBm, 5.1 dBm, 5 dBm, 0 dBm, -5 dBm,
-10 dBm, -15 dBm, -19.9 dBm, -20.0 dBm
Settings on power meter
-
Carry out a ZEROING prior to level measurements.
The level on SML is switched off with RF OFF.
Measurement
½ Measure level at test frequencies.
Õ The frequency response is the difference between the highest
and lowest measured value.
Õ The level error is the deviation from the set value.
Measurement procedure for low levels (>-115 dBm)
Caution: The precondition for correct measurement is that the used components are wholly RF-shielded.
Test method
Levels below the measurement range of the power meter can be
measured by a comparison measurement using a precision attenuator
and a sensitive test receiver or spectrum analyzer. The reference is
formed by a level measurement for example at 10 dBm by means of
the power meter.
Test setup
½ Connect a precision attenuator to the RF connector of SML.
Connect the attenuator output to a spectrum analyzer via
RF-leakage-proof test cables.
½ Connect 10 MHz references with each other.
Settings on SML
-
-
1090.3123.12
FREQ Test frequency Level accuracy
Test frequencies: 9 kHz, 5 MHz, 5.1 MHz, 76 MHz, 77 MHz, 151
MHz, 255 MHz, 302 MHz, 605 MHz, 606 MHz, 725 MHz, 970 MHz,
1100 MHz
LEVEL 10 dBm
UTILITIES REF OSC SOURCE EXT
10.12
E-3
SML
Test Procedure
Settings on test receiver or
analyzer
-
Center frequency = test frequency
Span = 0 Hz
Settings on precision attenuator -
Attenuation = 125 dB
½ Read level on test receiver or analyzer and note down as reference
value. It should be at 10 dBm -125 dB. Select measurement
bandwidth to small value to obtain an accurate reading.
Measurement
½ Now repeat measurement at the settings given in Table 10-1 "Test
level 2 Level accuracy".
SML01: reference level = 10 dBm
Õ The deviation from the reference value shown on analyzer
display is the level error.
Measurement at levels <-115 dBm
Caution:
The precondition for correct measurement is that the used components are wholly
RF-shielded.
½ Switch a low-noise preamplifier between SML and precision
attenuator.
½ Perform a calibration at a measured level.
Õ It is thus possible to measure levels down to the lower limit of
SML.
Test setup
Measurement
Table 10-1
Test level2 Level accuracy
Level on SML
Attenuation of attenuator
Reference level
125 dB
Reference level -5 dB
120 dB
Reference level -10 dB
115 dB
Reference level -20 dB
105 dB
Reference level -40 dB
85 dB
Reference level -60 dB
65 dB
Reference level -80 dB
45 dB
Reference level -100 dB
25 dB
Reference level -120 dB
5 dB
Reference level -125 dB
0 dB
1090.3123.12
10.13
E-3
Test Procedure
SML
Output Reflection Coefficient
Test setup
Test setup 4 (output reflection coefficient).
Measurement procedure
Since the SWR of a source is to be measured, a purely passive
measurement using the SWR bridge is only possible at levels for
which the SWR is determined by the output impedance of the
electronic attenuator.
For higher levels, the effect of level control has to be considered. This is
done by means of an auxiliary generator which sends a wave with a
slightly offset carrier frequency (difference frequency within the level
bandwidth of level control) to the EUT. The carrier frequency is
superimposed by the outgoing wave. Given an ideal internal impedance,
the outgoing wave of the EUT alone flows back to the SWR bridge. At
any other internal impedance, there is a superposition of the two
components which, due to the frequency offset, results in a beat. The
SWR can be concluded from the amplitude ratio of this beat.
Settings on SML
-
LEVEL 5.1 dBm, 0.1 dBm
FREQ test frequency SWR
Test frequency: 100 MHz, 500 MHz, 800 MHz, 1 GHz, 1.1 GHz
Settings on spectrum analyzer
-
Center frequency = test frequency
Span = 0 Hz
Reference level= test level
Resolution and video bandwidth = 10 kHz
Linear level scale
Sweep time = 30 ms
Settings on 2nd signal
generator
-
Frequency = test frequency – 100 Hz
first RF OFF
Measurement
½ Now bring displayed line to center of screen by changing the
reference level and note down level as reference level.
½ Unscrew SWR bridge from SML and increase level on second signal
generator so that the reference level is again measured on the
analyzer.
½ Screw SWR bridge or directional coupler again to SML.
Õ A more or less undulating line can now be seen on the spectrum
analyzer. This line represents the SWR of SML.
Calculate SWR from the maximum and minimum voltage
according to the following equation:
SWR = umax/umin.
1090.3123.12
10.14
E-3
SML
Test Procedure
Passive measurement of SWR at output levels of SML below -25 dBm
Settings on SML
-
LEVEL –25 dBm, -40 dBm
FREQ far from test frequency (>10 MHz)
Settings on 2nd signal generator
-
Frequency = test frequency
Level = 10 dBm
Measurement
½ Unscrew SWR bridge from EUT and note down level measured on
analyzer as reference value.
½ Screw on SWR bridge or directional coupler again and determine
new level on analyzer.
Õ The test level/reference level voltage ratio is the output
reflection coefficient r of the EUT.
½ Determine the standing wave ratio (SWR) according to the
following formula
SWR = (1+r)/(1-r).
Setting Time
Test setup
Test setup 2 (setting time)
Test method
The spectrum analyzer is operated as a fast level meter at a span of 0
Hz. A controller transmits the start and end frequency via IEC/IEEE
bus. The storage oscilloscope is connected to the video output of the
analyzer and triggered on the EOI line of the IEC/IEEE bus by the
positive edge. If the controller switches from start to end frequency,
the settling process can be seen on the storage oscilloscope.
Preparing measurement
½ Synchronize reference frequencies of SML and analyzer.
½ Make IEC/IEEE-bus and RF connections.
½ Connect storage oscilloscope to video output of analyzer.
½ Apply trigger line to EOI line (pin 5) of IEC/IEEE bus.
½ Settings on storage oscilloscope
- Timebase 5 ms/div,
- Sensitivity according to video output of analyzer.
½ Settings on spectrum analyzer
- Reference level 10 dBm,
- Amplitude scale 10 dB/div,
- Resolution bandwidth 300 kHz,
- Video bandwidth 300 kHz,
- Span 0 Hz.
Settings on SML
1090.3123.12
- FREQ 1 GHz
10.15
E-3
Test Procedure
SML
Measurement
½ Setting on storage oscilloscope
- External triggering on positive edge at 1.5 V.
½ First send start and then end level from controller.
Õ The level characteristic from the moment of triggering is
displayed on the externally triggered oscilloscope.
½ Repeat measurement by interchanging the start and end levels.
½ Measure the following settings in both directions.
Setting
Start level
End level
Remark
CW
–140 dBm
13 dBm
With electric attenuator, only to target level
CW
-24.9 dBm
13 dBm
With electric attenuator
AM 30%
2.1 dBm
10 dBm
Without electric attenuator
Quick Basic program for controller
CLS
iecadresse% = 28
IEC/IEEE-bus address of SML (28)
CALL IBFIND("DEV1", generator%)
Open DEV1 and get access number
CALL IBPAD(generator%, iecadresse%)
Set IEC/IEEE-bus address of DEV1 to 28
iecterm% = &HA ’
Set EOS to LINE FEED
CALL IBEOS(generator%, iecterm% + &H800)
CALL IBWRT(generator%, "FREQ 1GHz")
DO
INPUT "Start level in dBm";P1$
INPUT "Stop level in dBm";P2$
DO
CALL IBWRT(generator%, "POW" + P1$ + "dBm")
PRINT "Level: ";P1$; "dBm"
DO ’
Wait for key
kbd$ = INKEY$
LOOP UNTIL LEN(kbd$)
SWAP P1$, P2$
LOOP UNTIL kbd$ = CHR$(27) ’
Quit with ESCAPE
INPUT "Repetition (y/n)"; w$
LOOP UNTIL NOT UCASE$(w$) = "J"
END
1090.3123.12
10.16
E-3
SML
Test Procedure
Non-interrupting Level Setting (ATTENUATOR FIXED)
Test setup
Test setup1 with spectrum analyzer
Settings on SML
FREQ test frequencies ATT-FIX
Test frequencies: 9 kHz, 5.1 MHz, 1100 MHz
- LEVEL 5.1 dBm
- LEVEL LEVEL ATTENUATOR MODE FIXED
½ Note down level read on analyzer as reference level or set delta
marker for relative measurement to 0 dB.
Measurement
-
½ Now reduce level in steps of 5 dB on SML.
Õ Do not exceed the following values.
Reduction in dB ATT FIXED
Tolerance in dB
5
0.4
10
0.6
15
1.2
20
3.0
Overvoltage Protection
Test equipment
Sinewave generator (Table Measuring equipment and accessories, item 11)
Test setup
½ Connect sinewave generator to RF output of SML.
Settings on SML
- LEVEL -140 dBm
- FREQ 100 MHz
Settings on sinewave generator
Measurement
-
Frequency = 20 kHz
-
Output impedance = 50 Ω
Level = 1 V
-
Level offset = ±5 V
½ Increase output level of sinewave generator up to 10 V max. (EMF)
Õ At a voltage (offset+EMF/2) >4 V and < 7.5 V the overvoltage
protection should respond at both polarities.
1090.3123.12
10.17
E-3
Test Procedure
SML
Internal Modulation Generator
Note:
The setting time is a pure computing time and does not have to be measured.
Level Accuracy
Test equipment
AC voltmeter (Table Measuring equipment and accessories, item 12)
Test setup
½ Connect AC voltmeter to LF connector of SML.
Settings on SML
-
Measurement
½ Measure output level
LF OUTPUT STATE ON
LF OUTPUT LFGen 1 kHz
LF OUTPUT VOLTAGE test level LFGen
Test level: 3 mV, 10 mV, 100 mV, 1 V, 4 V
Frequency Response
Test equipment
AC voltmeter (Table Measuring equipment and accessories, item 12)
Test setup
½ Connect AC voltmeter to LF connector of SML.
Settings on SML
-
Measurement
½ Measure frequency response.
LF OUTPUT STATE ON
LF OUTPUT VOLTAGE 1 V and 4 V
LF OUTPUT LFGen test frequencies LFGen
Test frequency: 10 Hz, 100 Hz, 1 kHz, 10 kHz, 100 kHz, 200 kHz
to 500 kHz
Õ The frequency response is the difference between the highest
and lowest level.
1090.3123.12
10.18
E-3
SML
Test Procedure
Frequency Accuracy and Distortion
Test equipment
Modulation analyzer (synchronized with SML)
Test setup
½ Connect LF voltmeter input of modulation analyzer to LF connector
of SML.
½ Connect spectrum analyzer at frequencies >100 kHz.
Settings on SML
-
Measurement
½ Read actual frequency on audio or spectrum analyzer.
½ Read distortion on audio analyzer.
LF OUTPUT STATE ON
LF OUTPUT VOLTAGE 1 V and 4 V
LF OUTPUT LFGen test frequencies LFGen
For frequency accuracy: 100 Hz, 33.33 kHz, 1 MHz
For distortion: 10 Hz, 100 Hz, 1 kHz, 10 kHz, 100 kHz
Amplitude Modulation
AM Deviation Setting
Test assembly
Test setup1 with modulation analyzer
Settings on SML
-
-
Measurement
LEVEL 0 dBm
FREQ test frequencies of AM deviation
Test frequencies: 100 kHz, 1 MHz, 5 MHz, 5.1 MHz, 76 MHz, 100
MHz, 200 MHz, 500 MHz, 800 MHz, 1100 MHz
MODULATION AM AM DEPTH test deviation of AM deviation
Test deviation of AM deviation: 1%, 30%, 80%
AM SOURCE LFGen
LFGenFreq 1 kHz
½ Read modulation depth on modulation analyzer.
AM Frequency Response
Test assembly
Test setup1 with modulation analyzer
Settings on SML
-
Measurement
1090.3123.12
LEVEL 0 dBm
FREQ test frequencies of AM frequency response
Test frequencies: 350 kHz, 5,1 MHz, 1100 MHz
MODULATION AM AM DEPTH 60%
AM SOURCE: LFGen
LFGenFreq 10 Hz to 50 kHz
½ Determine modulation frequency response by varying the LF
generator frequency.
½ Repeat measurement with external sinewave generator with setting
MODULATION AM AMSOURCE EXT. (Setting on sinewave
generator: 1 Vpeak)
Õ The modulation frequency response is the difference between the
highest and lowest modulation depth.
10.19
E-3
Test Procedure
SML
AM Distortion
Test assembly
Test setup1 with modulation analyzer
Settings on SML
-
-
Measurement
LEVEL 2.1 dBm and 8 dBm
FREQ test frequencies of AM distortion
Test frequencies: 100 kHz, 5 MHz, 5.1 MHz, 76 MHz, 100 MHz,
200 MHz, 500 MHz, 800 MHz, 1100 MHz
MODULATION AM AM DEPTH 30%, 80%
AM SOURCE LFGen
LFGenFreq 1 kHz
½ Read distortion on modulation analyzer.
Residual PhiM at AM
Test assembly
½ Test setup 1 with modulation analyzer
Settings on SML
-
-
Measurement
LEVEL 8 dBm
FREQ test frequencies of residual PhiM
Test frequencies: 100 kHz, 5 MHz, 5.1 MHz, 76 MHz, 100 MHz,
200 MHz, 500 MHz, 800 MHz, 1100 MHz
MODULATION AM AM DEPTH 30%,
AM SOURCE LFGen
LFGenFreq 1 kHz
½ Measure the phase modulation obtained with 23-kHz lowpass filter
and peak weighting on modulation analyzer.
Frequency Modulation
FM Deviation Setting
Test setup
½ Test setup 1 with modulation analyzer
Settings on SML
-
Setting on modulation analyzer
Demodulation: FM
Detector: peak detector
Filter: 20 Hz to 23 kHz
Measurement
½ Read frequency deviation on modulation analyzer
Note:
LEVEL 0 dBm
FREQ 1 GHz
MODULATION FM FM DEVIATION 100 kHz
FM SOURCE LFGen
LFGenFreq 1 kHz
SML has a purely digital deviation control so that it is sufficient to check its functionality at
one deviation setting and one frequency only.
1090.3123.12
10.20
E-3
SML
Test Procedure
FM Frequency Response
Test setup
½ Test setup 1 with modulation analyzer
Settings on SML
-
Setting on modulation analyzer
Demodulation: FM
Detector: peak detector
Measurement
½ The modulation frequency response is determined by varying the
generator frequency of the internal LF generator in the FM menu from
10 Hz to 100 kHz. It is obtained from the difference between the lowest
and highest measured deviation.
Note:
LEVEL 0 dBm
FREQ 1 GHz
MODULATION FM FM DEVIATION 100 kHz
FM SOURCE LFGen
Since there is no difference between the FM and PHiM frequency response, the
measurement of the wide FM loop can be omitted. The measurement of the wide PhiM
loop can be performed on the spectrum analyzer and is thus much more easier. The
modulation analyzer only has a bandwidth of approx. 200 kHz.
FM Distortion
Test setup
Test setup 1 with modulation analyzer
Settings on SML
-
-
LEVEL 0 dBm
FREQ test frequency of FM distortion
Test frequencies: 605.5 MHz, 650 MHz, 700 MHz, 750 MHz, 807
MHz
MODULATION:FM:FM DEVIATION 500 kHz
FM SOURCE: LFGen
LFGenFreq 1 kHz
Setting on modulation analyzer
Demodulation: FM
Detector: peak detector
Audio: distortion
Measurement
½ Read distortion on modulation analyzer.
1090.3123.12
10.21
E-3
Test Procedure
SML
Residual AM at FM
Test setup
½ Test setup 1 with modulation analyzer
Settings on SML
-
-
LEVEL 0 dBm
MODULATION FM FM DEVIATION 40 kHz
FM SOURCE LFGen
LFGenFreq 1 kHz
FREQUENCY: test frequency of residual AM
Test frequencies: 10 MHz, 75 MHz, 100 MHz, 300 MHz, 500 MHz,
800 MHz, 1100 MHz
Setting on modulation analyzer
Demodulation: AM
Detector: RMS
Lowpass filter: 23 kHz
Measurement
½ Set test frequencies on SML and read residual AM on modulation
analyzer.
Carrier Frequency Error at FMDC
Test setup
½ Test setup 1 with frequency counter
Settings on SML
-
-
Measurement
Note:
UTILITIES CALIB FM OFFSET
UTILITIES REF OSC SOURCE EXTERN
LEVEL 0 dBm
MODULATION FM FM DEVIATION 100 kHz
FM SOURCE EXT
EXT COUPLING DC
FREQ test frequency FMDC
Test frequencies: 630 MHz, 680.5 MHz, 667.6 MHz, 674.7 MHz,
669 MHz, 672 MHz, 617.6 MHz, 641.2 MHz, 640.2 MHz, 641.1 MHz
½ Read frequency on frequency counter. The difference to the set RF
frequency on SML is the center frequency error.
This value is not specified but is normally less than 0.1% of the set deviation and thus less
than 100 Hz at a set deviation of 100 kHz.
1090.3123.12
10.22
E-3
SML
Test Procedure
Crosstalk Attenuation at FM Stereo
Test setup
½ Test setup 1 with modulation analyzer
½ Connect connector AF1 of stereocoder to input MOD on SML
Settings on SML
-
-
LEVEL 0 dBm
MODULATION FM FM DEVIATION 46.5 kHz
FM SOURCE EXT
EXT COUPLING DC
FREQ test frequency stereo
Test frequencies: 87 MHz, 98 MHz, 108 MHz
Setting on modulation analyzer
Switch on stereo signal 1 kHz on stereocoder, set level of useful signal
to peak deviation of 40 kHz and level of pilot tone to 6.5 kHz peak
deviation.
Demodulation: FM STEREO
CHANNEL: L or R
DETECTOR RMS
FILTER: 10 Hz to 100 kHz
Deviation measurement is relative
Measurement
½ On stereocoder switch on left channel and perform relative
measurement. Then switch to right channel on demodulator and
read crosstalk attenuation.
Then perform the same measurement with the right channel.
Distortion FM Stereo
Test setup
½ See Crosstalk Attenuation at FM Stereo
Settings on SML
-
See Crosstalk Attenuation at FM Stereo
Setting on modulation analyzer
-
Stereo signal like for crosstalk attenuation measurement
Demodulation: FM STEREO
CHANNEL: L or R
DETECTOR RMS
FILTER: 10 Hz to 100 kHz
AUDIO: switch on distortion
Measurement
½ Read distortion on modulation analyzer
½ Perform measurement for left and right channel.
1090.3123.12
10.23
E-3
Test Procedure
SML
S/N Ratio of FM Stereo
Test setup
½ See Crosstalk Attenuation at FM Stereo
Settings on SML
-
See Crosstalk Attenuation at FM Stereo
Setting on modulation analyzer
-
Stereo signal like for crosstalk attenuation measurement
Demodulation: FM STEREO
CHANNEL: L or R
FILTER: CCIR WT or UNWT
DETECTOR RMS
Deviation measurement relative
-
DEEMPHASIS 50 µs
Measurement
½ On stereocoder switch on left or right channel and perform relative
measurement. Then switch off useful signal on stereocoder and
read S/N ratio. Carry out measurement for both filters (weighted
and unweighted). Then switch on right channel and repeat the
same measurement.
Phase Modulation
PhiM Deviation Setting
Test setup
½ Test setup 1 with modulation analyzer
Settings on SML
-
LEVEL 0 dBm
FREQ 1 GHz
MODULATION PhiM PHiM DEVIATION 5 rad
PhiM SOURCE LFGen
LFGenFreq 1 kHz
Setting on modulation analyzer
-
Demodulation: PhiM
Detector: peak detector
Filter: 20 Hz to 23 kHz
Measurement
½ Read phase deviation on modulation analyzer
Note:
SML has a purely digital deviation control so that it is sufficient to check its functionality at
one deviation setting and one frequency only.
1090.3123.12
10.24
E-3
SML
Test Procedure
PhiM Frequency Response
Test setup
½ Test setup 1 with spectrum analyzer
Settings on SML
-
UTILITIES REF OSC SOURCE EXT
LEVEL 0 dBm
FREQ 1 GHz
MODULATION PhiM PHiM DEVIATION 0.5 rad
PHiM SOURCE INT
PHiM BANDWIDTH STANDARD/WIDE
Setting on spectrum analyzer
-
Start frequency 1 GHz
Span 500 kHz at wide loop/100 kHz at standard loop
LEVEL RANGE 20 dB
RES BW 10 kHz/3 kHz
Switch on MAX HOLD function
Measurement
½ By varying the generator frequency of the LF generator from 1 kHz to
100 kHz or with wide loop of up to 500 kHz, the PHiM frequency
response appears on the spectrum analyzer. The difference
measurement between the maximum and minimum point of the
characteristic is the modulation frequency response. The carrier
frequency at the left margin of the spectrum analyzer is not considered.
Note:
Since there is no difference between the FM and PHiM frequency response, the standard
PhiM loop can be measured analog to the FM frequency response.
PhiM Distortion
Test setup
½ Test setup 1 with modulation analyzer
Settings on SML
-
LEVEL 0 dBm
FREQ 1 GHz
MODULATION PhiM PHiM DEVIATION 5 rad
FM SOURCE LFGen
LFGenFreq 1 kHz
Setting on modulation analyzer
-
Demodulation: PHiM
Detector: peak detector
Audio: distortion
Measurement
½ Read distortion on modulation analyzer
1090.3123.12
10.25
E-3
Test Procedure
SML
Pulse Modulation (Option SML-B3)
On/Off Ratio
Test setup
½ Test setup 1 with spectrum analyzer
Settings on SML
-
LEVEL 10 dBm
FREQ 1 GHz
MODULATION PULSE PULSE SOURCE OFF
Setting on spectrum analyzer
-
Center 1 GHz
Span 20 kHz
Reference level 10 dBm
Marker peak
Measurement
½ Note down ON level on spectrum analyzer.
Setting on SML
-
MODULATION PULSE PULSE SOURCE EXT
Make sure that pulse input is not connected.
Setting on spectrum analyzer
-
Reference level -50 dBm
-
Switch on average: 5 samples
-
Peak marker
Measurement
½ Note down OFF level on spectrum analyzer.
The on/off ratio is calculated from ON and OFF levels.
Dynamic Characteristics
Rise/Fall Time
Test setup
½ Test setup 5
Settings on SML
-
-
LEVEL 10 dBm
FREQ 53 MHz
MODULATION PULSE PULSE SOURCE PULSE GEN
PULSE PERIOD 0.100 us
PULSE WIDTH 0.060 us
PULSE OUTPUT PULSE SOURCE VIDEO
Setting on oscilloscope
-
Trigger EXT
Probe 1x
X: 5 ns/div
Y: 5 V/div
Switch-off delay approx. 1 sec. (if possible)
Measurement
-
Measure rise/fall time of 10% to 90% of pulse bursts
1090.3123.12
10.26
E-3
SML
Test Procedure
Video Crosstalk
Test setup
½ Test setup 5
Settings on SM
-
Setting on oscilloscope
-
Measurement
½ Measure Vpp of video
1090.3123.12
FREQ 1 GHz
LEVEL 10 dBm
ATT FIXED
LEVEL -100 dBm
MODULATION PULSE PULSE SOURCE PULSE GEN
PULSE PERIOD 0.100 us
PULSE WIDTH 0.060 us
PULSE OUTPUT PULSE SOURCE VIDEO
Trigger EXT
Probe 1x
X: 10 ns/div
Y: 10 mV/div
Switch-off delay approx. 1 sec. (if possible)
10.27
E-3
Performance Test Report
SML
Performance Test Report
Table 10-2
Performance test report
ROHDE & SCHWARZ
Performance test report
Signal Generator SML
Stock No.: 1090.3000.__
Model (SML01):
Serial number:
Tested by:
Date:
Signature:
Parameter tested
Display and keyboard
Contained
in
Min. value
Page 10.5
Tested
Frequency setting
Page 10.5
Tested
Setting time
Page 10.6
Reference frequency,
deviation
Page 10.7
Actual value
Max. value
Unit
10
ms
Tolerance limit
Frequency
Spectral purity
Harmonics at level
≤10 dBm
Page 10.8
-30
dBc
Nonharmonics CW, df
>10 kHz
Page 10.8
-70
dBc
SSB phase noise
1 GHz at 20 kHz
carrier spacing
Page 10.9
-122
dBc/Hz
Broadband noise
1 GHz at 2 MHz
carrier spacing
Page 10.10
-140
dBc/Hz
Residual FM rms at
1 GHz
0.3 to 3 kHz (ITU-T)
0.02 to 23 kHz
Page 10.11
4
10
Hz
Hz
Residual AM rms
Page 10.11
0.02
%
1090.3123.12
10.28
E-3
SML
Parameter tested
Performance Test Report
Contained
in
Min. value
Actual value
Max. value
Unit
Tolerance limit
Level
Frequency response
at 0 dBm
Page 10.12
0.5
dB
Total level error
>-127 dBm
(temperature range
20 to 30°C)
Page 10.12
± 0.8
dB
Output impedance
SWR
Page 10.14
1.5
Setting time
for f>100 kHz
Page 10.15
10
ms
Non-interrupting level
setting
Page 10.17
Tested
Overvoltage protection
Page 10.17
Tested
4
11
102
1.011
4.041
mV
mV
mV
V
V
Internal modulation
generator
Level accuracy
at f = 1 kHz
3 mV
10 mV
100 mV
1V
4V
Page 10.18
Frequency response
up to 500 kHz, level
>100 mV
Page 10.18
0.5
dB
Frequency accuracy
Page 10.19
0.24
%
Distortion f <100 kHz,
level 1 V, 4 V, load
600 Ω
Page 10.19
0.1
%
2
32.2
84.2
%
%
%
3
dB
1
2
%
%
0.2
rad
2
9
98
0.989
3.959
Amplitude modulation
Deviation setting
at 1 kHz
Modulation depth 1 %
30%
80%
Page 10.19
Frequency response
Page 10.19
Distortion at 1 kHz
Modulation depth 30%
Modulation depth 80%
Page 10.20
Synchronous residual
PhiM at AM 30%,
AF = 1 kHz
Page 10.20
1090.3123.12
0
27.8
75.8
10.29
E-3
Performance Test Report
Parameter tested
Contained
in
SML
Min. value
Actual value
Max. value
Unit
Tolerance limit
Frequency modulation
Deviation error RF 1
GHz, AF 1 kHz,
deviation 100 kHz
Page 10.20
Distortion RF 1 GHz,
AF 1 kHz,
deviation 500 kHz
Page 10.21
FM frequency
response
Standard bandwidth
10 Hz to 100 kHz
Page 10.21
Residual AM at FM,
AF=1 kHz, deviation
40 kHz
Page 10.22
96
104
kHz
0.2
%
dB
3
dB
0.1
%
50
dB
70
70
dB
dB
0.2
%
Stereo modulation
Crosstalk attenuation
AF 1 kHz
Page 10.23
S/N ratio
AF 1 kHz
unweighted, rms
weighted, rms
Page 10.24
Distortion
AF 1kHz
Page 10.23
Phase modulation
Deviation error RF 1
GHz, AF 1 kHz,
deviation 5 rad
Page 10.24
Distortion RF 1 GHz,
AF 1 kHz,
deviation 5 rad
Page 10.25
PhiM frequency
response
Standard bandwidth
10 Hz to 100 kHz
Bandwidth
10 Hz to 500 kHz
Page 10.25
4.78
5.22
rad
0.2
%
2
%
3
dB
3
dB
Pulse modulation
(option SML-B3)
On/off ratio
Page 10.26
80
dB
Rise time
Fall time
Page 10.26
20
ns
Video crosstalk
Page 10.27
30
mV
1090.3123.12
10.30
E-3