1
PRECIPITATION ET BILAN DE MASSE
from May to the end of August. A few snowfall events occur, but in general this is a
period of low ablation.
4.2. Distribution of precipitation in the day and the wind regime
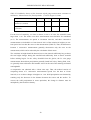
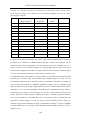
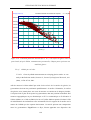
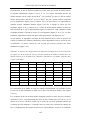
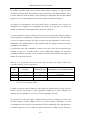
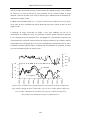
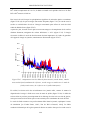
The accumulation of snowfall at a time step of 3 hours during the wet seasons of 1998–
1999 and 1999–2000, was 3.5 and 3.3 m of snow, respectively. A sensitivity study
showed that the choice of the time step between 2 hours and 5 hours only changes the
amount of snowfall during the wet season of 1999–2000 by less than 10 %. The
maximum amount of snow is 3.4 m of snow, obtained with the time step equal to 4 h.
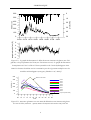
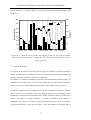
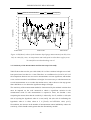
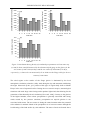
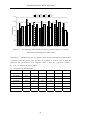
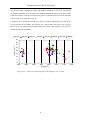
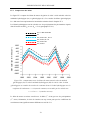
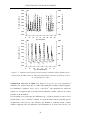
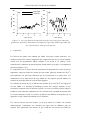
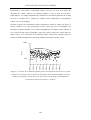
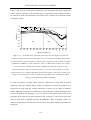
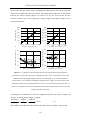
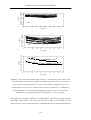
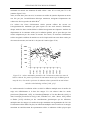
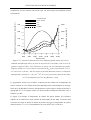
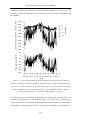
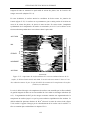
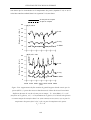
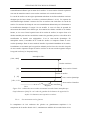
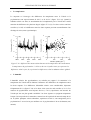
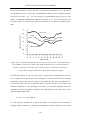
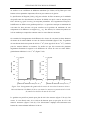
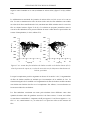
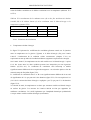
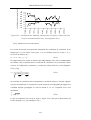
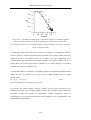
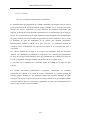
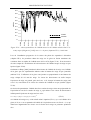
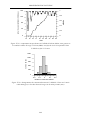
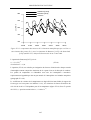
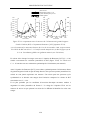
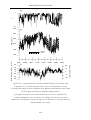
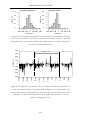
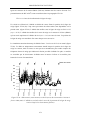
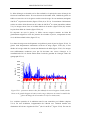
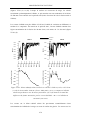
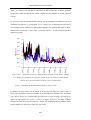
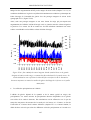
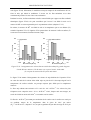
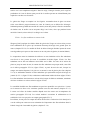
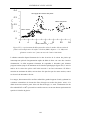
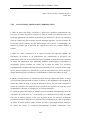
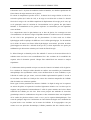
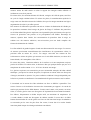
The distribution in the day of snowfalls on the glacier was bimodal (Figures 5a and 5b).
The maximum values were observed in the middle of the night, and at the beginning or in
the middle of the afternoon. Figure 5c shows that the Pv rain gauge in the valley also
recorded two maximum values of precipitation over the 24-hour period: one in the middle
of the night and the other at midday.
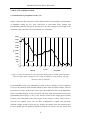
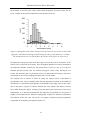
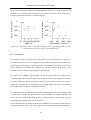
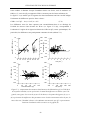
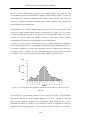
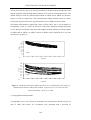
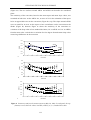
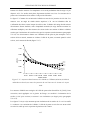
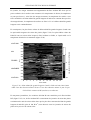
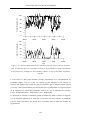
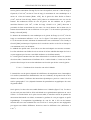
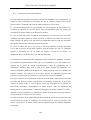
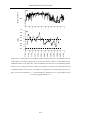
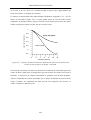
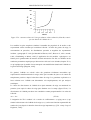
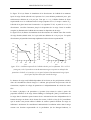
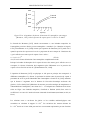
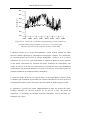
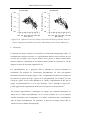
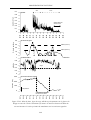
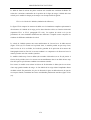
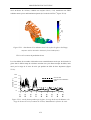
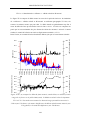
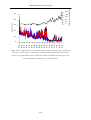
It is important to assess the wind speed during precipitation, because it affects the density
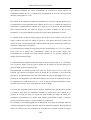
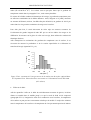
of the fresh snow and the catch deficiency of the rain gauges. In wet season, the wind
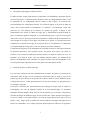
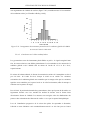
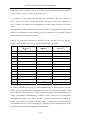
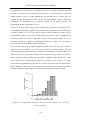
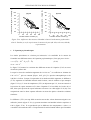
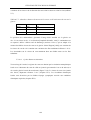
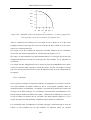
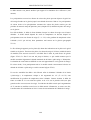
speed at the surface of the Zongo glacier was not very high, generally less than 5 m.s-1
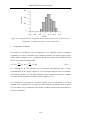
(Figure 6). The distribution of wind speeds during precipitation did not stand out from the
overall values of the season (Figure 6). In particular, precipitation was not associated with
the highest wind speeds. In 90 % of the cases, precipitation was associated with wind
speeds lower than 4 m.s-1, and in 60 % of the cases, it was associated with wind speeds
between 1 and 3 m.s-1.
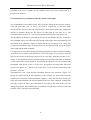
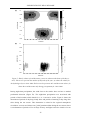
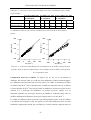
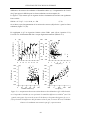
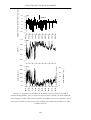
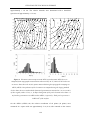
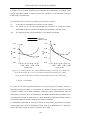
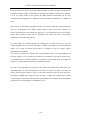
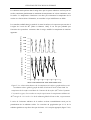
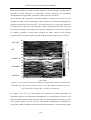
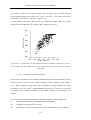
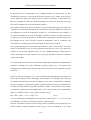
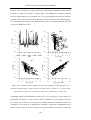
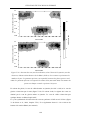
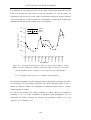
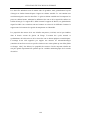
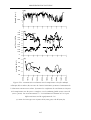
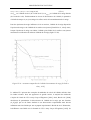
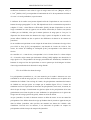
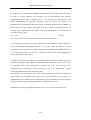
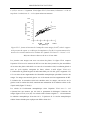
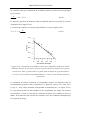
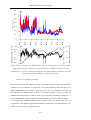
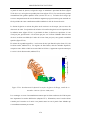
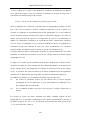
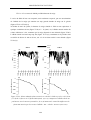
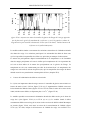
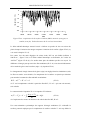
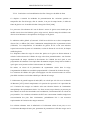
Throughout the year, wind direction alternated between two directions (Figure 7a).
During the night and up to the beginning of the morning, the wind came from the
northwest; the mountain wind was dominant (Figure 1). From the end of the morning up
to the end of the afternoon, the wind originated in the east or the southeast, coming from
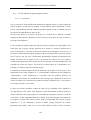
the valley. Figure 7b shows the wind direction according to the hour of the day only
during precipitation, demonstrating that precipitation was generally associated with wind
from the valley, especially in the afternoon.
52