1
SI-CHAID® 4.0 USER'S GUIDE
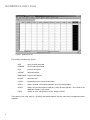
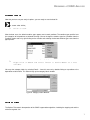
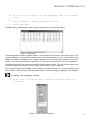
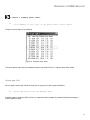
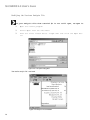
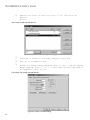
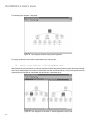
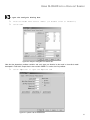
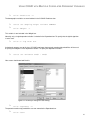
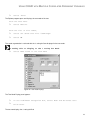
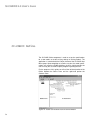
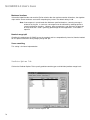
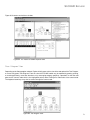
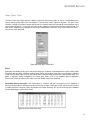
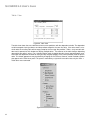
Figure 14. Source File
Tables
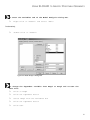
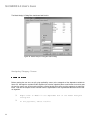
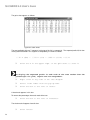
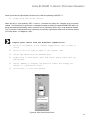
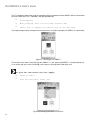
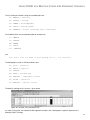
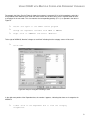
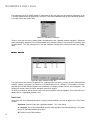
The New Table Window option displays a table of the dependent variable (columns) by the current predictor variable (rows). You can control whether the table displays row percentages, column percentages, total percentages,
or cell frequencies, and whether the table shows merged or unmerged categories of the predictor.
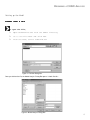
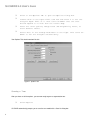
To view a table showing row percentages for merged categories of HHSIZE
at the top of the tree:
w
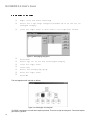
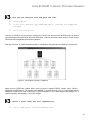
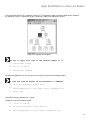
Click the top (root) node of the tree diagram
w
Select Window
w
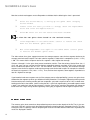
Click on New Table
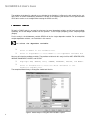
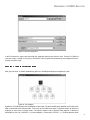
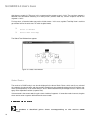
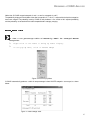
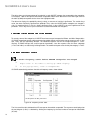
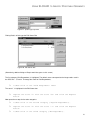
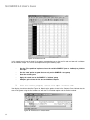
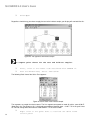
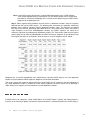
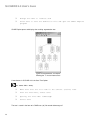
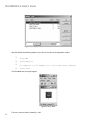
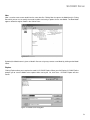
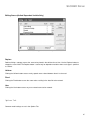
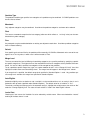
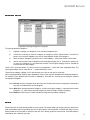
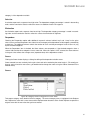
Values in the Respondent column match the values displayed in each of the four HHSIZE nodes:
14
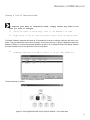
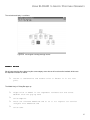
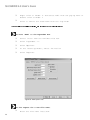
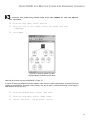
Figure 15. After Merge Table