1
SI-CHAID® 4.0 USER'S GUIDE
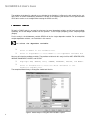
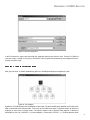
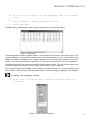
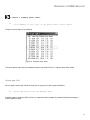
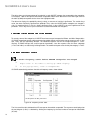
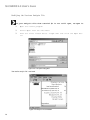
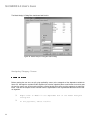
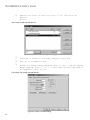
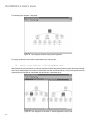
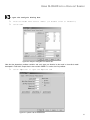
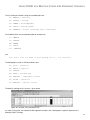
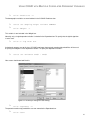
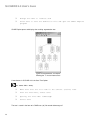
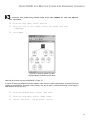
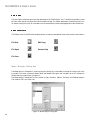
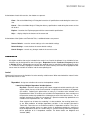
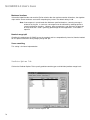
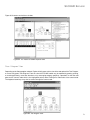
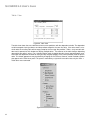
Figure 68. Tree Node Display
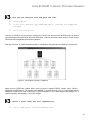
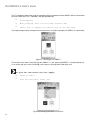
The contents of the tree nodes in the new tree change from the average scores to the category percentages.
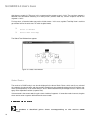
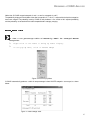
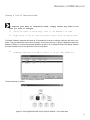
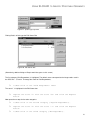
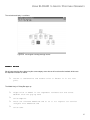
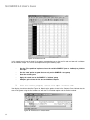
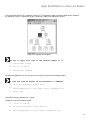
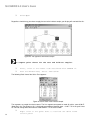
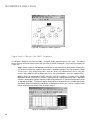
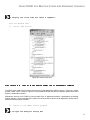
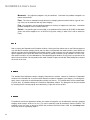
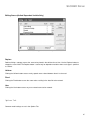
Figure 69. The two Trees side-by-side
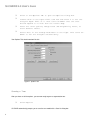
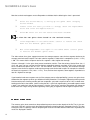
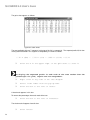
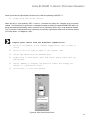
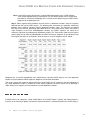
Thus, for example, we see that the average MORALG score for segment #1 may be obtained from the percentages in the new tree as follows:
9.22%(1) + 24.31%(2) + 51.90%(3) + 14.57%(4) = 2.72.
54