1
4.
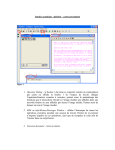
Select the graphic objects (outlined in blue), and move them or click the Cut button.
The ROIs (outlined in green) will be visible in the image.
After you have converted the graphic objects to ROIs, you can remove or disable one or more
of the objects from the region of interest.
ObjectSets
An ObjectSet overlay represents one spatial attribute from an ObjectSet, such as a set of lines
or regions. The ObjectSet is computed by one of the segmentation operators. Typically, these
operators automatically create the ObjectSet overlay.
Custom ObjectSet overlays can be drawn using the AphObjDraw and AphObjDrawMapped
operators. These operators allow control over the overlay color, line width, and fill properties.
In addition, the AphObjDrawMapped operator can use a scalar attribute to draw the objects
with a range of gray scales.
A number of operations can be performed on ObjectSet overlays. This includes changing
drawing attributes, selecting objects, converting ObjectSets to ROIs, and removing object
overlays.
The Image Pop-up Menu
Each ObjectSet overlay creates an entry on the pop-up menu associated with the image in
which the overlay is drawn. You can use these entries to select an ObjectSet, and change the
line properties or convert the ObjectSet to an ROI.
Deleing ObjectSet Overlays
The entire ObjectSet overlay can be deleted in two ways:
•
Choose Delete all from the Image pop-up menu.
•
Run the AphObjRemoveOverlay operator.
To remove individual objects, first select the objects. Then click the Cut button.
Charts
In Aphelion, histograms, profiles, surface maps, and scatter plots are referred to as charts.
They are displayed in chart windows that provide a great deal of flexibility for displaying
information.
You can modify the display properties of a chart, create models to use when you create new
charts, and establish defaults for the size and position of chart windows in Aphelion.
Aphelion supplies models for the following types of charts:
•
Histogram
•
Profile
•
Surface Map
•
Scatter Plot
Image Histograms
Chart windows can be created to show intensity histograms of selected areas of an image or of
the whole image.
96 • Aphelion User Guide
04/05/99