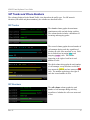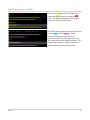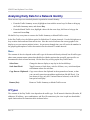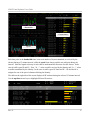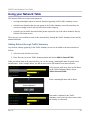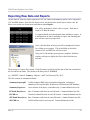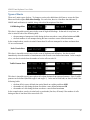
1
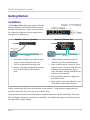
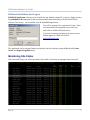
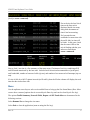
PRILINK
http://www.prilink.com
Tel: 905-882-4488
1-866-261-0649
Fax: 905-597-1139
[email protected]
[email protected]
IP/SIP Trunk Software User Guide
IP/SIP Trunk Software User Guide
Table of Contents
Overview....................................................................................................................................................3
Getting Started...........................................................................................................................................4
Installation.............................................................................................................................................4
Monitoring Site Status...........................................................................................................................5
Exploring Network Traffic.........................................................................................................................7
Traffic Summary....................................................................................................................................7
Analyzing Monthly Data for a Network Identity.....................................................................................10
IP Types...............................................................................................................................................11
SIP Trunks and Phone Numbers..........................................................................................................12
Analyzing Daily Data for a Network Identity..........................................................................................14
IP Types...............................................................................................................................................14
SIP Trunks and Phone Numbers..........................................................................................................17
Using your Network Table.......................................................................................................................20
Troubleshooting with Packet Capture......................................................................................................22
Exporting Raw Data and Reports.............................................................................................................23
Configuring SIP Trunk Alerts..................................................................................................................25
Rev. 61
2
IP/SIP Trunk Software User Guide
Overview
This guide documents Prilink IP/SIP Trunk Software Tool version 1.20.0. With this tool, network
engineers and IT software developers can use a single PC to analyze Telco network traffic over 400
days and perform real-time troubleshooting using packet capture. The goal of this guide is to enable
users to perform the following core functions:
•
Automatically scan all IP/SIP network identities and assign meaningful names to key items.
•
Analyze monthly and daily traffic and quality of service (QoS) for selected network identities.
•
Troubleshoot applications with hardware-timestamped packet capture.
•
Generate reports and export data for further processing with 3rd party tools.
•
Configure traffic alerts for proactive monitoring.
To get further assistance or to answer any questions regarding the Prilink IP/SIP Trunk Software Tool,
please contact Prilink support at 1-866-261-0649 or [email protected].
Important Terms
The following terms are used repeatedly throughout this guide:
A Site is a location within your network where a Base Unit has been installed (see Installation). Each
base unit has a unique number (Site Number) and name. All base units communicate with a central
Traffic Hub that temporarily stores data before it is transferred to the users' PC or server.
The PrilinkNM application is a Windows-based software application installed on the users' PC or
server that gathers data from the Traffic Hub for visualization and analysis.
Units of Digital Information
Bandwidth measurements are reported in bytes (B) and speed measurements are reported in bits per
second (bps). Where prefixes are used to indicate multiples of bits or bytes (e.g. K, M, G), they are
consistently used in the decimal sense (i.e. 1 KB = 1000 Bytes).
Rev. 61
3
IP/SIP Trunk Software User Guide
Getting Started
Installation
A Prilink Base Unit collects and analyzes IP traffic
data by monitoring 10/100/1000 Ethernet circuits
through its monitor ports. There are two methods
for connecting to Ethernet circuits: using mirror /
span ports or an Ethernet tap.
Method 1: Mirror / Span Port
1. If available, configure your router to send
a copy of network packets from your
Telco to designated mirror/span ports.
2. Route a cable from designated mirror/span
ports to the Prilink base unit monitor
ports.
Method 2: Ethernet Tap
1. Connect Ethernet cable from Telco to
“Network” port B on the Ethernet tap.
2. Route a cable between “Network” port A
and your router. Check the Link/Activity
indicators on your equipment ports to
verify that data is flowing through the tap
with power disconnected.
3. Plug the Ethernet tap power supply into
an available outlet.
4. Route cables between the “Monitor” ports
of the Ethernet tap and the base unit.
Finally, connect the LAN port on the base unit to your network. Using the power supply and cord
included, connect the DC power port to an available outlet.
Once powered on, the base unit will attempt to establish connection with the Traffic Hub. The status
LED will begin to flash once connection is established. It normally takes approx 30s after boot up for
the status LED to begin flashing.
Rev. 61
4
IP/SIP Trunk Software User Guide
Software Installation and Log-on
PrilinkNM application software can be installed on any Windows based PC or server. Simply execute
the prilinknm-1.20.0.exe installer that you downloaded when subscribing to Prilink IP/SIP Trunk
Software Tool service. Once installed, start the PrilinkNM application:
You will be prompted for a password to begin. Enter
the password that was supplied to you when you
subscribed to Prilink SIP trunk service.
If you have forgotten your password, please contact
Prilink support at 1-866-261-0649 or
[email protected].
The application can be navigated almost exclusively with the keyboard, using the Esc (back), Enter,
Arrow, and PageUp/PageDown keys.
Monitoring Site Status
After successful login, you will be presented with a table of sites that are equipped with a base unit:
Rev. 61
5
IP/SIP Trunk Software User Guide
Check the status line at the top of the screen to verify that you are communicating with the traffic hub
(look for server: connected).
For each site, the local clock
time on the base unit is
displayed beside site name,
along with the amount of
time it has been running.
If a base unit has not
established a connection with
the traffic hub, its time will
be blank. In this case, check
that the status LED on the
unit is flashing and that your
software client shows
server: connected.
Next to local / run time is a live summary of the most recent 15 minutes of activity, combining all IP
and SIP trunks monitored by the base unit. Included are bi-directional measurements of peak speed,
total bandwidth, number of answered calls (sip ans), and number of not answered call attempts (sip not
ans).
If a site is idle for a full 15 minute interval (no IP traffic), then the IP alert column will display the total
time that the site has been idle.
Menu
Use the up/down arrow keys to select a site and hit Enter to bring up the Site Status Menu (Note: Most
screens have a menu of options that is accessed by the Enter key and can be closed by the Esc key).
The options Traffic Summary, Network Table, Report and SIP Trunk Alert are documented in the
following sections.
Select Rename Site to change the site name.
Select Exit to close the application (same as using the Esc key).
Rev. 61
6
IP/SIP Trunk Software User Guide
Exploring Network Traffic
Prilink automatically scans several types of network identifiers at the Link, Internet, and Transport
layers, and compiles statistics on each unique identity. The term traffic type or data type is used
throughout this guide to refer to a specific type of network identifier. There are 6 traffic types:
IP Trunk:
Unique pair of MAC Addresses that have exchanged network traffic.
IP:
Unique IP address.
IP – Port:
Unique combination of IP address and transport layer port number.
IP – IP:
Unique pair of IP addresses that have exchanged network traffic.
SIP Trunk:
Unique SIP trunk identified by IP address and transport layer port number.
SIP Number: Unique SIP address (phone number).
Whenever a new network identity is detected that falls into one of the above types, the base unit begins
recording various traffic metrics every 15 minutes. Users can browse the most active identities, assign
meaningful names, view monthly or daily traffic and initiate packet capture on any individual identity.
Traffic Summary
Selecting option Traffic Summary from the Site Status menu provides access to the last 400 days of
network traffic for the current site. Use the Esc key at any time to return to the Site Status screen.
Rev. 61
7
IP/SIP Trunk Software User Guide
The display is organized to show the most active network identities for all traffic types (use the
PageUp/PageDn keys to cycle through all 6 types). Each column covers a 24 hour period as indicated
in the column header. The first column covers the last 24 hours, while the remaining columns each
cover a calendar day beginning at 12:00 AM.
The columns are sorted by bandwidth (for IP traffic types) or call volume (for SIP traffic types). Each
column can contain up to 100 items, which are displayed 25 items per page. Use the up/down arrow
keys to navigate off the current page to access the full list. Use the left/right arrow keys to navigate
forwards or backwards through time.
A line found at the top of the screen displays the current traffic type and the identity selected:
Current site
Traffic type
Selected item description and statistics
The example on the left shows a typical column
for traffic type IP. The most active IP addresses
over the last 24 hours are shown. The vertical bar
graph shows the percentage of total daily traffic
represented by each IP address.
The initial L preceding an address indicates that
the address is considered Local or internal. The
initial N stands for Network, indicating an external
address. You can toggle Local/Network for a
particular address as described in the Menu
section.
The example on the left shows a typical column
for traffic type SIP Number. The most active SIP
phone numbers for Wednesday March 25th, 2015
are shown. The vertical bar graph shows the
percentage of total daily call volume represented
by each number, broken down into answered
(yellow) and not answered (red) calls.
The int# / ext# labels preceding each number
distinguish internal and external phone numbers.
Rev. 61
8
IP/SIP Trunk Software User Guide
Menu
Hit the Enter key to bring up the Traffic Summary menu.
Month:
Analyze monthly data for the currently highlighted identity, as documented
in Analyzing Monthly Data for a Network Identity.
Day:
Analyze daily data for the currently highlighted identity and date column,
as documented in Analyzing Daily Data for a Network Identity.
Select Date:
Quickly navigate to any date in the last 400 days, a convenient alternative
to using the left/right arrow keys to move one day at a time.
Add to Network Table: Add the currently highlighted item to a user-customized list called the
Network Table (more on this in section Using your Network Table).
Capture Packet:
Initiate packet capture using the currently highlighted item as a filter, as
documented in Troubleshooting with Packet Capture.
Switch Local/External: (Applies to IP traffic type only). Designate the currently highlighted IP
address as a Local or Network (external) address. Properly identifying
addresses as local or external makes it easier to interpret bidirectional
statistics when aggregating data from multiple IP addresses together.
Select Display:
Display both IP and SIP traffic types (IP + SIP Summary) or IP traffic types
only (IP Summary). The latter is useful to simplify the user interface if no
SIP trunks are being monitored by the base unit.
Return (Esc):
Return to Site Status screen.
Rev. 61
9
IP/SIP Trunk Software User Guide
Analyzing Monthly Data for a Network Identity
There are two ways to access monthly data for a particular network identity:
•
From the Traffic Summary screen, highlight an item with the arrow keys, hit Enter to bring up
the Traffic Summary menu, and choose Month.
•
From the Network Table, highlight an item with the arrow keys, hit Enter to bring up the
Network Table menu, and choose Traffic.
Hit the Esc key at any time to return to the Traffic Summary or Site Status screen.
Days of the
Month
The Month Traffic view is organized into 3 columns of information, with each row representing a day
in the month. If viewing the current month, the top row represents the last 24 hours; all other rows
cover a calendar day starting at 12:00 AM. Use the up/down arrow keys to navigate through the
month, with the most recent day appearing at the top. The legend above each column will update to
indicate the numeric values for each bar.
A line found at the top of the screen displays the current site and the item selected:
Current site
Rev. 61
Item description
10
IP/SIP Trunk Software User Guide
Menu
The information in each column depends on the traffic type of the network identity selected, but all
traffic types share a common menu. Hit the Enter key to bring up the Month Traffic menu.
Day:
Analyze daily data for the currently highlighted date, as documented in Analyzing
Daily Data for a Network Identity.
Select Month: Change the month on display to any month in the last 400 days.
Return (Esc): Return to Traffic Summary or Site Status screen.
IP Types
The columns displayed in the Month Traffic view depend on the traffic type. For IP network identities
(IP trunks, IP addresses, IP address + port combinations, and IP to IP connections), the columns are
described below:
The bandwidth column graphs the total number
of bytes sent or received by the selected identity
during each day.
The speed column graphs the peak bit rate
achieved by the selected identity during each day.
The active 15-min column gives the total number
of 15 minute intervals during which some
network traffic was sent or received by the
selected identity.
Note the legend at the top of the speed and bandwidth columns to understand the direction of traffic
represented by each bar. In the case of traffic types IP and IP – Port, in refers to traffic received by the
identity and out refers to traffic transmitted by the identity. In the case of traffic types IP Trunk and IP
– IP, the identities are defined by a pair of elements (MAC addresses for IP trunk and IP addresses for
IP – IP). Labels A and B are assigned to each element of the pair, and an arrow is used to indicate the
direction of traffic flowing between the elements (A ← B and A → B).
Rev. 61
11
IP/SIP Trunk Software User Guide
SIP Trunks and Phone Numbers
The columns displayed in the Month Traffic view depend on the traffic type. For SIP network
identities (SIP trunks and phone numbers), the columns are described below:
SIP Trunks
The circuit column graphs the maximum
simultaneous calls reached during each day.
The column header includes a breakdown of
incoming and outgoing peaks.
The second column graphs the total number of
call attempts during each day, regardless of
whether the calls were answered or not. Each
bar is divided into incoming (blue) and
outgoing (purple) calls. The number
appearing to the right of each bar is total
number of calls.
The third column also graphs the total number
of call attempts, except that bars are divided
into answered (yellow) and not answered (red)
calls. The number appearing to the right of
each bar is total number of calls.
SIP Numbers
The call volume column graphs the total
number of call attempts during each day,
regardless of whether the calls were answered
or not.
Rev. 61
12
IP/SIP Trunk Software User Guide
The second column splits call volume into
answered (yellow) and not answered (red)
calls. The number appearing to the right of
each bar is the total call volume.
The third column splits not answered calls into
cancel (blue) and fail (purple). Cancel
represents abandoned calls, while fail
represents calls with a SIP response code in
the range 4xx/5xx/6xx indicating failure. The
number appearing to the right of each bar is
the total number of not answered calls.
Rev. 61
13
IP/SIP Trunk Software User Guide
Analyzing Daily Data for a Network Identity
There are two ways to access daily data for a particular network identity:
•
From the Traffic Summary screen, highlight an item with the arrow keys, hit Enter to bring up
the Traffic Summary menu, and choose Day.
•
From the Month Traffic view, highlight a date with the arrow keys, hit Enter to bring up the
menu and choose Day.
Hit the Esc key at any time to return to the Traffic Summary or Month Traffic screen.
In the Day Traffic view, the 24 hour period is divided into 15 minute intervals. Use the left/right arrow
keys to move backwards and forwards in time. Note the vertical indicator line on any graphs in the
display to see your current position in time. As you move through time, you will notice the numbers in
the graph legends update to reflect the statistics for the selected 15 minute interval.
Menu
The contents of the view depend on the traffic type of the network identity selected, but all traffic types
share some common menu options described below (further options that are traffic type-specific are
documented in their relevant sections). Hit the Enter key to bring up the Day Traffic menu.
Select Date:
Change the date on display to any day in the last 400 days.
Scale Auto/Fixed:
Toggle between a fixed chart y-axis for all dates, or a y-axis that adjusts
to maximum values for each date.
Copy Data to Clipboard: Copy screen data to the clipboard in tab-separated text format, so that
you can easily paste into spreadsheet applications like MS Excel. You
can choose to copy only the 15 minute interval selected, or the full 24
hour period on display.
Return (Esc):
Return to Traffic Summary or Month Traffic screen.
IP Types
The contents of the Day Traffic view depend on the traffic type. For IP network identities (IP trunks, IP
addresses, IP address + port combinations, and IP to IP connections), the view is split into bandwidth /
speed charts and an IP connection table as shown below:
Rev. 61
14
IP/SIP Trunk Software User Guide
Bandwidth
Connections
Speed
Each data point in the bandwidth chart is the total number of bytes transmitted or received by the
identity during a 15 minute interval, while the speed chart shows peak bit rate achieved during the
interval. Note the legend at the top of each chart to understand the direction of traffic shown. In the
case of traffic types IP and IP – Port, “A ←” refers to traffic received by the identity and “A →” refers
to traffic transmitted by the identity. In the case of traffic types IP Trunk and IP – IP, the label A is
assigned to one of the pair of elements defining the identity.
The table on the right side of the screen displays all IP sessions during the selected 15 minute interval.
Use the up/down arrow keys to highlight different IP sessions
Rev. 61
15
IP/SIP Trunk Software User Guide
An IP session is an exchange of network traffic between two IP addresses uniquely defined by IP
Protocol and port numbers (if applicable). In the figure above, the highlighted IP session represents
UDP traffic between 192.0.2.242 (port 39785) and 203.0.113.222 (port 53). The bi-directional
bandwidth used by each session is displayed alongside peak bit rate (speed).
Port Scan
When analyzing daily data for an IP address, it is possible to display a breakdown of traffic by port
number for the 24 hour period being analyzed. Hit Enter to access the Day Traffic menu and choose
option Port QoS 24 Hours (this option is only available for traffic type IP). Use the Esc key at any
time to return to the Day Traffic view.
Port Numbers
The bandwidth, speed, and active 15 min columns are exactly as documented for the Month Traffic
view for IP types (see Monthly Traffic for IP Types). Use the up/down arrow keys to select different
port numbers detected (up to 32 ports per page). Hit the Enter key to access a menu of options:
Sort by Port Number:
Sort the display by port number (smallest to largest).
Sort by Bandwidth:
Sort the display by bandwidth (largest to smallest).
Add to Network Table: Based on the currently highlighted port number and the IP address being
analyzed, add an IP – Port identity to your Network Table.
Rev. 61
16
IP/SIP Trunk Software User Guide
SIP Trunks and Phone Numbers
The contents of the Day Traffic view depend on the traffic type. For SIP network identities (SIP trunks
and SIP numbers), the view is split into call volume / max circuit charts and a CDR table.
SIP Trunks
Call Volume
Max Circuit
Call Detail Records
Each bar in the call
volume graph represents
the total number of call
attempts in the 15 minute
interval, subdivided into
■ Answered
■ Cancel
(abandoned call)
■ Fail
(SIP response code
4xx/5xx/6xx
indicating failure)
Rev. 61
17
IP/SIP Trunk Software User Guide
Each bar in the circuit
graph represents the
maximum number of
simultaneous calls reached
in the 15 minute interval.
The table at the bottom of the screen contains CDR for all calls in the 15 minute interval selected. Use
the up/down arrow keys to scroll through the full list of records.
The fields included in each record are as follows:
Setup time:
The time that the call was initiated.
Trunk:
The SIP trunk id.
Dir:
The direction of the call (incoming or outgoing).
Int / Ext number: The phone numbers involved in the call (internal/private and external/public),
including name display if available.
Call state:
Rev. 61
■ ans release: The call was answered. In this case the duration of the call is
added at the end of the record.
■ nAns cancel: The call was not answered, but not as as result of error. The
client cancelled the request before a response was received (i.e. abandoned call).
■ nAns fail: The call was not answered as a result of a SIP failure response. In
this case the SIP failure response code is added at the end of the record, along
with the closest Q.931 equivalent.
18
IP/SIP Trunk Software User Guide
The Day Traffic view menu for SIP trunks (accessed by hitting Enter key) features an option called
Call Records / Summary. This option toggles between displaying individual CDR in the bottom table
or an overall summary of the 24 hour period. In summary mode, the bottom table appears as follows:
The left half of the table gives a
breakdown of traffic based on call state,
as well as the maximum simultaneous
calls reached (maxTrk).
The right half of the table gives a
breakdown of failed calls based on SIP
response code.
SIP Numbers
Call Volume
The Day Traffic view
for SIP Numbers is
similar to SIP Trunks,
except that it only
provides a call volume
chart and there is no
Call Summary menu
option.
Call Detail Records
Rev. 61
19
IP/SIP Trunk Software User Guide
Using your Network Table
The Network Table serves three main purposes:
•
to assign meaningful names to network identities appearing in the Traffic Summary screen.
•
to define new identities that may not appear in the Traffic Summary screen (because they are
not active enough to fall in the top 100 in their traffic category).
•
to quickly access traffic data and initiate packet capture for any of the above identities directly
from the Site Status screen.
There are two ways to add new items to the network table; through the Traffic Summary screen and by
manual definition.
Adding Entries through Traffic Summary
Any network identity appearing in the Traffic Summary screen can be added to the network table as
follows:
1. Select the item with the arrow keys
2. Press Enter key to access Traffic Summary menu and choose Add to Network Table.
When you add an item to the network table, you can also assign a meaningful name for quick visual
identification. In the example below, we add our most active SIP number to our network table:
Select an item with arrow keys and hit Enter.
In the Traffic Summary Menu, choose
Add to Network Table.
Enter a meaningful name and hit Enter.
Item name is updated in the Traffic
Summary screen, and any other screen where
the identity is referenced.
Rev. 61
20
IP/SIP Trunk Software User Guide
Manually Defining new Entries
The second method of adding entries to the Network Table is performed from the Site Status screen by
hitting Enter to bring up the Site Status menu and selecting Network Table.
This sample network table has one item, created in the previous section via the Traffic Summary
Use the up/down arrow keys to highlight a blank row, hit Enter to bring up the Network Table menu,
and choose option Add. Select traffic type and enter criteria to define the new item.
Menu
In addition to adding new items, the Network Table menu includes several other options.
Traffic:
Analyze monthly data for the currently highlighted identity, as documented in
Analyzing Monthly Data for a Network Identity.
Edit:
Edit name and definition for the currently highlighted identity.
Add:
Manually add a new identity to the Network Table (must have a blank row
highlighted). Select traffic type (IP, IP – port, IP – IP, or SIP number). Enter
criteria to define the new item, along with a meaningful name.
Delete:
Delete the currently identity from the Network Table.
Capture packet: Initiate packet capture using the currently highlighted item as a filter, as
documented in Troubleshooting with Packet Capture.
Building up a detailed Network Table, either manually or through the Traffic Summary screen, can
dramatically increase the effectiveness of several displays as meaningful names are used in place of
addresses and numbers. The Traffic and Capture packet menu options fulfil the third purpose of the
Network Table; to provide quick access to important network items without searching through the
Traffic Summary screen.
Rev. 61
21
IP/SIP Trunk Software User Guide
Troubleshooting with Packet Capture
Analyzing raw network packets is sometimes necessary to troubleshoot problems and gain insight into
application operation. All of the network identities that are automatically scanned by Prilink can be
used as filters for packet capture, alleviating the need to use complex filter syntax. Capture files are
saved to the user's PC in Wireshark-compatible format for further investigation.
There are two ways to initiate packet capture for a particular network identity:
•
From the Traffic Summary screen, highlight an item with the arrow keys, hit Enter to bring up
the Traffic Summary menu, and choose Capture packet.
•
From the Network table, highlight an item with the arrow keys, hit Enter to bring up the menu
and choose Capture packet.
A Packet Capture window will open
displaying capture meta data and
status. The filter field indicates the
network identity used to filter packets.
The duration and file size fields are
incremented as the capture progresses
and more packets are added to the
capture file. Capture will continue
until a maximum file size is reached
or until the user clicks the
stop capture button.
Once complete, the status field will reach “end” and the file name field will update to indicate the full
path where the capture file is stored. Two files are created in the process:
{site number}_{YYMMDD}_{HHMMSS}.pcap Raw capture file.
{site number}_{YYMMDD}_{HHMMSS}.txt
Text file containing all meta data from the Packet
Capture window (filter, start time, duration, etc).
It is possible to initiate packet capture on multiple sites simultaneously; a separate Packet Capture
window will open for each site.
Rev. 61
22
IP/SIP Trunk Software User Guide
Exporting Raw Data and Reports
All raw data for each site can be exported in CSV text format, and summary reports can be exported in
CSV and PDF format. From the Site Status screen, use the up/down arrow keys to select a site, hit
Enter to access the site Status menu, and choose option Report.
You will be prompted to select a date to export. Each date is
listed in YY Mon dd format.
A 1 appears beside each date that has data available to export. A
0 indicates that no data is available to export, and choosing that
date will not create any export files.
Once a date has been selected, you will be prompted to browse
for a folder to save reports. This is the folder in which the
exported CSV and PDF files will be created.
Once you hit OK and the report process completes, Windows
explorer will open to display the files in the folder that you
selected.
There are up to 6 export files created. Each file name is prefixed with the date of the data contained in
the file and the site name. The format of the date prefix is YYMMDD.
e.g. “150225 SiteA Summary Report.pdf” for February 25th, 2015.
The files created are summarized below:
Summary Report.pdf
A fully formatted PDF report with tables and graphs, containing a
summary of the top IP trunks, IP addresses, SIP trunks and SIP numbers,.
Summary Report.csv
A text version of the above, with tables only. Comma delimited text file.
IP Trunk Records.csv
Raw 15-minute traffic data for each IP trunk. Comma delimited text file.
IP CDR.csv
Connection Detail Records for each IP session. Comma delimited text file.
SIP Trunk Records.csv Raw 15-minute traffic data for each SIP trunk. Comma delimited text file.
SIP CDR.csv
Rev. 61
Call Detail Records for each sip call. Comma delimited text file.
23
IP/SIP Trunk Software User Guide
Copy Data to Clipboard
Most data displays in the PrilinkNM application include the menu option Copy Data to Clipboard.
This option copies screen data to the clipboard in tab-separated text format, so that you can easily paste
into spreadsheet applications like MS Excel for further reporting and analysis.
Rev. 61
24
IP/SIP Trunk Software User Guide
Configuring SIP Trunk Alerts
Users can be alerted by E-mail and SMS when potential SIP trunk issues arise. From the Site Status
screen, use the up/down arrow keys to select a site, hit Enter to access the site Status menu, and choose
option SIP Trunk Alert. Hit Esc at any time to return to the Site Status screen.
Alert definitions are outlined in the Settings section, while current alert status is indicated in the
Status Panel section. For each alert type, a red light in the status panel indicates that alert conditions
are currently being met. The Last Alarm column indicates the most recent date and time that alert
conditions were detected, and Last Notification indicates the most recent date and time that an
SMS/E-mail notification was sent.
Menu
Hit the Enter key to bring up the Alert menu.
Edit Alert Settings: Change or review alert definitions, see section Types of Alerts below for more
details.
Return (Esc):
Rev. 61
Return to the Site Status screen.
25
IP/SIP Trunk Software User Guide
Types of Alerts
There are 3 major types of alerts. To change or review alert definitions, hit Enter to access the Alert
Menu and choose option Edit Alert Settings. For each alert, there is a checkbox that indicates if
SMS/E-mail notification is enabled, along with a brief description of the alert.
Call Blockage Alert
This alert is intended to notify users in the event of high call blockage. At the end of every hour, an
alert is raised if both of the following hold:
• the percentage of unanswered calls during the hour was above a user defined minimum AND
• the total number of call attempts during the hour was above a user defined minimum
In the example above, an alert is raised if more than 10 calls are attempted in an hour and more than
1% are not answered.
Peak Circuit Alert
This alert is intended to notify users in the event of high network utilization. An alert is raised
immediately when the number of simultaneous calls exceeds a user defined maximum. In the example
above, an alert is raised when the number of active calls exceeds 10.
Traffic Pattern Alert
This alert is intended to notify users when call volume deviates from expected patterns. Up to 2 traffic
patterns can be defined (labelled traffic 0 and traffic 1). At the end of each hour, an alert is raised if the
following holds:
• the hour falls in a user defined time period based on weekday and hour AND
• the number of calls during the hour was below a user defined minimum OR
• the number of calls during the hour was above a user defined maximum
In the example above, an alert is raised only on weekends (Sat-Sun, all hours) if the number of calls
during an hour is less than 100 or more than 150.
Rev. 61
26