1
-I
I-
User’s Guide
HP 85719A
Noise Figure
Measurements Personality
-I
I-
HP part number: 85719-90007
Printed in USA
October 1992
Notice. The information contained in this document is subject to change
without notice.
Hewlett-Packard makes no warranty of any kind with regard to this material,
including, but not limited to, the implied warranties of merchantability and
fitness for a particular purpose. Hewlett- Packard shall not be liable for errors
contained herein or for incidental or consequential damages in connection
with the furnishing, performance, or use of this material.
@Copyright Hewlett-Packard Company 1992
All Rights Reserved. Reproduction, adaptation, or translation without prior
written permission is prohibited, except as allowed under the copyright laws.
Lotus@l-2-3@ is a U.S. registered trademark of Lotus Development
Corporation.
MS-DOS@ is a U.S. registered trademark of Microsoft Corporation.
Microsoft@ is a U.S. registered trademark of Microsoft Corporation.
-I
Hewlett-Packard Software Product License
Agreement and Limited Warranty
Important
Please carefully read this License Agreement before opening the media envelope or operating the
equipment. Rights in the software are offered only on the condition that the Customer agrees to
all terms and conditions of the License Agreement. Opening the media envelope or operating the
equipment indicates your acceptance of these terms and conditions. If you do not agree to the License
Agreement, you may return the unopened package for a full refund.
111
I-
-I
License Agreement
In return for payment of the applicable fee, Hewlett-Packard grants the
Customer a license in the software, until terminated, subject to the following:
Use.
l
Customer may use the software on one spectrum-analyzer instrument.
l
Customer may not reverse assemble or decompile the software.
Copies and Adaptations.
l
Customer may make copies or adaptations of the software:
q
For archival purposes, or
q
When copying or adaptation is an essential step in the use of the
software with a computer so long as the copies and adaptations are used
in no other manner.
l
Customer has no other rights to copy unless they acquire an appropriate
license to reproduce which is available from Hewlett-Packard for some
software.
l
Customer agrees that no warranty, free installation, or free training is
provided by Hewlett-Packard for any copies or adaptations made by
Customer.
l
All copies and adaptations of the software must bear the copyright
notices(s) contained in or on the original.
Ownership.
l
Customer agrees that they do not have any title or ownership of the
software, other than ownership of the physical media.
l
Customer acknowledges and agrees that the software is copyrighted and
protected under the copyright laws.
l
Customer acknowledges and agrees that the software may have been
developed by a third party software supplier named in the copyright
notice(s) included with the software, who shall be authorized to hold the
Customer responsible for any copyright infringement or violation of this
License Agreement.
iv
I-
-I
I-
Transfer of Rights in Software.
l
Customer may transfer rights in the software to a third party only as part
of the transfer of all their rights and only if Customer obtains the prior
agreement of the third party to be bound by the terms of this License
Agreement.
l
Upon such a transfer, Customer agrees that their rights in the software are
terminated and that they will either destroy their copies and adaptations or
deliver them to the third party.
l
Transfer to a U.S. government department or agency or to a prune or
lower tier contractor in connection with a U.S. government contract shah
be made only upon their prior written agreement to terms required by
Hewlett-Packard.
Sublicensing and Distribution.
l
Customer may not sublicense the software or distribute copies or
adaptations of the software to the public in physical media or by
telecommunication without the prior written consent of Hewlett-Packard.
Termination.
l
Hewlett-Packard may terminate this software license for failure to comply
with any of these terms provided Hewlett-Packard has requested Customer
to cure the failure and Customer has failed to do so within thirty (30) days
of such notice.
Updates and Upgrades.
l
Customer agrees that the software does not include future updates
and upgrades which may be available for HP under a separate support
agreement.
Export.
l
Customer agrees not to export or re-export the software or any copy or
adaptation in violation of the U.S. Export Administration regulations or
other applicable regulations.
V
-I
I-
Limited Warranty
Software.
Hewlett-Packard warrants for a period of 1 year from the date of purchase
that the software product will execute its programming instructions when
properly installed on the spectrum-analyzer instrument indicated on this
package. Hewlett-Packard does not warrant that the operation of the software
will be uninterrupted or error free. In the event that this software product
fails to execute its programming instructions during the warranty period,
customer’s remedy shall be to return the measurement card (“media”) to
Hewlett-Packard for replacement. Should Hewlett-Packard be unable to
replace the media within a reasonable amount of time, Customer’s alternate
remedy shall be a refund of the purchase price upon return of the product
and all copies.
Media.
Hewlett-Packard warrants the media upon which this product is recorded
to be free from defects in materials and workmanship under normal use
for a period of 1 year from the date of purchase. In the event any media
prove to be defective during the warranty period, Customer’s remedy
shall be to return the media to Hewlett-Packard for replacement. Should
Hewlett-Packard be unable to replace the media within a reasonable amount
of time, Customer’s alternate remedy shall be a refund of the purchase price
upon return of the product and all copies.
Notice of Warranty Claims.
Customer must notify Hewlett-Packard in writing of any warranty claim not
later than thirty (30) days after the expiration of the warranty period.
Limitation of Warranty.
Hewlett-Packard makes no other express warranty, whether written or oral,
with respect to this product. Any implied warranty of merchantability or
fitness is limited to the 1 year duration of this written warranty.
This warranty gives specific legal rights, and Customer may also have other
rights which vary from state to state, or province to province.
vi
-I
I-
Exclusive Remedies.
The remedies provided above are Customer’s sole and exclusive remedies.
In no event shall Hewlett-Packard be liable for any direct, indirect, special,
incidental, or consequential damages (including lost profit) whether based on
warranty, contract, tort, or any other legal theory.
Warranty Service.
Warranty service may be obtained from the nearest Hewlett-Packard sales
office or other location indicated in the owner’s manual or service booklet
Vii
-I
I-
Safety Symbols
The following safety symbols are used throughout this manual. Familiarize
yourself with each of the symbols and its meaning before operating this
instrument.
CAUTION
WARNING
The caution sign denotes a hazard. It calls attention to a procedure which,
if not correctly performed or adhered to, could result in damage to or
destruction of the instrument. Do not proceed beyond a caution sign until
the indicated conditions are fully understood and met.
The warning sign denotes a hazard. It calls attention to a procedure
which, if not correctly performed or adhered to, could result in injury or
loss of life. Do not proceed beyond a warning sign until the indicated
conditions are fully understood and met.
Vlll
I-
-I
General Safety Considerations
WARNING
Before the spectrum analyzer is switched on, make sure it has been
properly grounded through the protective conductor of the ac power
cable to a socket outlet provided with protective earth contact.
Any interruption of the protective (grounding) conductor, inside or
outside the instrument, or disconnection of the protective earth terminal
can result in personal injury.
CAUTION
Before the spectrum anaLyzer is switched on, make sure its primary power
circuitry has been adapted to the voltage of the ac power source.
Failure to set the ac power input to the correct voltage could cause damage to
the instrument when the ac power cable is plugged in.
ix
-I
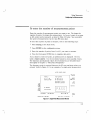
An overview of this measurement solution
This quick overview provides basic information about noise figure and gain
measurement using the HP 85719A measurement solution.
Some main features of the noise figure and gain measurement personality are
listed below:
l
l
l
l
l
l
l
l
l
n
User-friendly interface (includes configuration and measurement results
displays).
Storage and edit capability of multiple noise-source ENR data tables.
Measurement marker functions.
Single-point test-limit capability.
Simultaneous display of swept noise figure and gain measurements.
Variable measurement bandwidth control.
Calculator for measurement repeatability.
Mixer test compatibility (such as for frequency converters and receivers).
Loss-compensation data entry to correct for cables and other losses.
-I
In This Guide . . .
Read the following information to get an idea of what the different chapters of
this guide contain.
l
Chapter 1, “Getting Started” guides you through setting up the
measurement personality (DLP) for use. Instructions for using the self
test to verify hardware operation are provided. Also, the differences
between spectrum analyzer front-panel key operations and the noise figure
measurements personality key operations are explained in this chapter.
l
Chapter 2, “Making Measurements” guides you through measurement
examples. The recommended test equipment table, methods for optimizing
measurements results, and measurement configuration information is
located in this chapter. The default-configuration settings are listed here as
well.
l
Chapter 3, “Menu Key Descriptions” provides the menu map of the DLP
and a description of each menu key in alphabetical order.
l
Chapter 4, “Specifications, Characteristics, and System Verification”
provides the measurement setup specifications and characteristics along
with the verification tests. The performance test record is provided at the
end of this chapter.
l
Chapter 5, “If you Have a Problem )) includes descriptions of
measurement error messages. Return-to-factory information is also included
in this chapter.
l
Chapter 6, “Programming” is the remote command reference. Commands
and their descriptions are alphabetically listed in this chapter. A
cross-reference table of the personality’s menu keys and their related
commands is located in this chapter.
xi
I
1. Getting Started
Users’ Guide Key Conventions ............
Installing the Measurement Personality .........
To dispose previously installed DLPs .........
To load the noise figure and gain measurement DLP . .
Using the Self-Test Feature ..............
Using the self-test function .............
If the self-test finds trouble .............
If the trouble persists ..............
Sales and service offices listing
..........
1-3
l-4
1-4
l-5
l-6
l-6
1-7
l-8
l-8
2. Making Measurements
Improving Noise Figure Measurement Accuracy .....
Configuring for Measurements .............
To enter measurement frequencies ..........
To measure above 2.9 GHz ............
To measure below 10 MHz ............
To measure non-frequency converting devices ....
To measure frequency converting devices ......
To enter the number of measurements points .....
To enter time-BW parameters ............
Determine the time-bandwidth product
......
To enter external losses ..............
To enter external losses .............
To enter preamplifier gain .............
To enter noise-source case temperature ........
To edit noise source ENR data ...........
To edit ENR data tables .............
To save ENR data tables .............
To recall ENR data tables ............
Assigning and Using Registers and Prefixes ......
Calibrating for Measurements .............
Making Hard-Copies .................
Measuring an Amplifier ...............
Configuring for the measurement ..........
Calibrate the measurement setup .........
2-4
2-5
2-7
2-7
2-7
2-7
2-8
2-9
2-11
2-11
2-13
2-13
2-22
2-23
2-24
2-24
2-26
2-27
2-29
2-30
2-33
2-34
2-34
2-35
Contents- 1
-I
ICommand Reference
To measure the amplifier .............
Measuring a Frequency Converter ............
Configuring for the measurement
..........
Calibrate the measurement setup .........
To measure a frequency converting device
.....
2-36
2-38
2-38
2-39
2-39
3. Menu Key Descriptions
Menu Map .....................
Menu Key Descriptions
...............
3-3
3-5
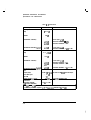
4. Specifications, Characteristics, and Verification
Specifications and Characteristics ...........
System Performance Verification
...........
Service Test Function Keys Descriptions .......
Verification Test Description ............
Related Spectrum Analyzer Adjustments ......
Equipment required for the measurement ......
Calibrate the System
...............
Load the Service DLP
Measure the Noise Level-at 1’ MHz RBw : : : : : : :
Measure the Noise Level at 3 kHz RBW .......
Purge the service DLP from memory ........
If Verification Fails .................
4-3
4-5
4-5
4-6
4-7
4-7
4-7
4-9
4-9
4-15
4-17
4-19
5.
If You Have a Problem ...
Measurement Personality Messages ..........
Returning the Instrument for Service
.........
5-3
5-7
6. Programming
Reference Tables ..................
Functional Index Table ...............
Alphabetical Reference Table ............
Command Syntax Description ............
Command Reference .................
-AVGTIME
...................
-BW
......................
-CAL ......................
-CONN .....................
-ENR ......................
-FCONV .....................
-FSTART ....................
6-3
6-3
6-6
6-8
6-9
6-10
6-12
6-14
6-15
6-16
6-20
6-23
Contents-2
-I
ICommand Reference
-FSTOP .....................
-GLVL ................
-GSCALE ........... .::: ..........
-IFSTART ....................
-1FSTOP
....................
-1NLOSS .....................
-LABEL .....................
-MEASURE ...................
-NFLVL .....................
-NFMODE ....................
-NFSCALE
...................
-OUTLOSS
...................
-PGAIN .....................
-PTS
-RFSTiR’i : : : : : : : : : : : : : : : : : : : :
-RFSTOP ....................
-SLOSS .....................
-TBW ......................
-TBWAUTO ...................
-TEMPC
....................
6-25
6-27
6-29
6-31
6-33
6-35
6-39
6-40
6-43
6-45
6-47
6-49
6-53
6-55
6-58
6-61
6-64
6-68
6-70
6-72
Index
Contents-3
-I
IFigures
l- 1. Self-Test Equipment Connections . . . . . . . .
2- 1. Single-Point Measurement Results . . . . . . . .
2-2. The Help Screen Time-BW Repeatability Calculator
2-3. System Loss Location During Calibration . . . . .
2-4. System Loss Location During Device Measurement
2-5. SOURCE LOSS Location During Calibration . . .
.
.
.
.
.
.
.
.
.
.
.
.
.
.
.
.
.
.
l-7
2-9
2-12
2-14
2-15
2-16
2-6. SOURCE LOSS Location During Device Measurement . .
2-17
2-7. INPUT LOSS Location During Calibration . . . . . . . . .
2-18
2-8. INPUT LOSS Location During Device Measurement . . . . .
2-19
2-9. OUTPUT LOSS Location During Calibration .
2-20
2-10. OUTPUT LOSS Location During Device Measurement . . . .
2-l 1. The ENR Data Table Editor Screen . . . . . . . . . . . .
2-12. Basic Calibration Setup . . . . . . . . . . . . . . . . .
2- 13. Calibration Completion Display . . . . . . . . . . . . . .
2-14. Measuring Amplifier Noise Figure and Gain . . . . . . . .
2- 15. Amplifier Measurement Results Example . . . . . . . . . .
2-16. Measuring a 750 Frequency Converting Device . . . . . . .
2-17. TV-Tuner Measurement Results Example . . . . . . . . .
3-1. The Measurement Personality Main Menu . . . . . . . . .
3-2. The NF & Gain Personality Menu Map . . . . . . . . . . .
4-l. CAL FREQ and CAL AMPTD Setup . . . . . . . . . . . .
4-2. Noise Figure and Gain Accuracy Test Setup
4-3. Noise Level Worksheet, RBW 1 MHz
. . . : : : : : : : :
4-4. Noise Level Worksheet, RBW 3 kHz . . . . . . . . . . . .
6- 1. Syntax Structure Description . . . . . . . . . . . . . . .
6-2. -AVGTIME Syntax . . . . . . . . . . . . . . . . . . . .
6-3. -AVGTIME Query Response Syntax . . . . . . . . . . . .
6-4. -BW Syntax . . . . . . . . . . . . . . . . . . . . . .
6-5. -BW Query Response Syntax . . . . . . . . . . . . . . .
6-6. -CAL Syntax . . . . . . . . . . . . . . . . . . . . . .
6-7. -CONN Syntax . . . . . . . . . . . . . . . . . . . . .
6-8. -ENR Syntax, Recalling Existing Tdble from Internal Memory
6-9. -ENR Syntax, Recalling Existing Table from Memory Card
6-10. -ENR Syntax, Creating a New -ENR Table . . . . . . . . .
6-l 1. -FCONV Syntax . . . . . . . . . . . . . . . . . . . . .
2-21
2-25
2-31
2-32
2-36
2-37
2-40
2-42
3-2
3-4
4-8
4-10
4-14
4-18
6-8
6-10
6-11
6-12
6-13
6-14
6-15
6-16
6-17
6-18
6-20
Contents-4
-I
IContents
6- 12. -FCONV Query Response Syntax . . . . . . . . . . . . .
6-13. -FSTART Syntax . . . . . . . . . . . . . . . . . . . .
6- 14. -FSTART Query Response Syntax . . . . . . . . . . . . .
6-15. -FSTOP Syntax . . . . . . . . . . . . . . . . . . . . .
6-16. -FSTOP Query Response Syntax . . . . . . . . . . . . .
6- 17. -GLVL Syntax . . . . . . . . . . . . . . . . . . . . . .
6- 18. -GLVL Query Response Syntax . . . . . . . . . . . . . .
6-19. -GSCALE Syntax . . . . . . . . . . . . . . . . . . . .
6-20. -GSCALE Query Response Syntax . . . . . . . . . . . .
6-2 1. -IFSTART Syntax . . . . . . . . . . . . . . . . . . . .
6-22. JFSTART Query Response Syntax . . . . . . . . . . . .
6-23. -IFSTOP Syntax . . . . . . . . . . . . . . . . . . . . .
6-24. -IFSTOP Query Response Syntax . . . . . . . . . . . . .
6-25. -INLOSS Syntax . . . . . . . . . . . . . . . . . . . . .
6-26. Location of Input Loss Characteristic . . . . . . . . . . .
6-27. -INLOSS Query Response Syntax . . . . . . . . . . . . .
6-28. -LABEL Syntax . . . . . . . . . . . . . . . . . . . . .
6-29. -MEASURE Syntax . . . . . . . . . . . . . . . . . . .
6-30. -NFLVL Syntax . . . . . . . . . . . . . . . . . . . . .
6-31. -NFLVL Query Response Syntax . . . . . . . . . . . . .
6-32. -NFMODE Syntax . . . . . . . . . . . . . . . . . . . .
6-33. -NFSCALE Syntax . . . . . . . . . . . . . . . . . . .
6-34. -NFSCALE Query Response Syntax . . . . . . . . . . . .
6-35. -OUTLOSS Syntax . . . . . . . . . . . . . . . . . . . .
6-36. Location of Output Loss Characteristic . . . . . . . . . . .
6-37. -0UTLOSS Query Response Syntax . . . . . . . . . . . .
6-38. -PGAIN Syntax . . . . . . . . . . . . . . . . . . . . .
6-39. -PGAIN Query Response Syntax . . . . . . . . . . . . .
6-40. -PTS Syntax . . . . . . . . . . . . . . . . . . . . . .
6-41. -PTS Query Response Syntax . . . . . . . . . . . . . . .
6-42. -RFSTART Syntax . . . . . . . . . . . . . . . . . . . .
6-43. -RFSTART Query Response Syntax . . . . . . . . . . . .
6-44. -RFSTOP Syntax . . . . . . . . . . . . . . . . . . . .
6-45. -RFSTOP Query Response Syntax . . . . . . . . . . . . .
6-46. -SLOSS Syntax . . . . . . . . . . . . . . . . . . . . .
6-47. Location of Noise Source Loss Characteristic . . . . . . . .
6-48. -SLOSS Query Response Syntax . . . . . . . . . . . . .
6-49. -TBW Syntax . . . . . . . . . . . . . . . . . . . . . .
6-50. -TBW Query Response Syntax . . . . . . . . . . . . . .
6-51. -TBWAUTO Syntax . . . . . . . . . . . . . . . . . . .
6-52. -TBWAUTO Query Response Syntax . . . . . . . . . . . .
6-22
6-23
6-24
6-25
6-26
6-27
6-28
6-29
6-30
6-31
6-32
6-33
6-34
6-35
6-36
6-38
6-39
6-40
6-43
6-44
6-45
6-47
6-48
6-49
6-50
6-52
6-53
6-54
6-55
6-57
6-58
6-60
6-61
6-63
6-64
6-65
6-67
6-68
6-69
6-70
6-71
Contents-5
IContents
6-53. -TEMPC Syntax . . . . . . . . . . . . . . . . . . . . .
6-54. -TEMPC Query Response Syntax . . . . . . . . . . . . .
Contents-6
6-72
6-73
-I
ITables
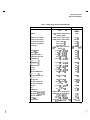
l-l. Hewlett-Packard Sales and Service Offices . . . . .
2- 1. Equipment Requirements . . . . . . . . . . . .
2-2. Configuration Selections . . . . . . . . . . . . .
2-3. Points Entered vs Points Measured . . . . . . . .
2-4. Prefix Descriptions of Memory Registers . . . . . .
3-l. Noise Figure and Gain Default Parameters . . . . .
4- 1. Specifications . . . . . . . . . . . . . . . . . .
5-l. Measurement Personality Information Messages . . .
6-l. Functional Index . . . . . . . . . . . . . . . .
6-2. Commands in Alphabetical Order . . . . . . . . .
.
.
.
.
.
.
.
.
.
.
.
.
.
.
.
.
.
.
.
.
.
.
.
.
.
.
.
.
.
.
.
.
.
.
.
.
.
.
.
.
l-9
2-3
2-6
2-10
2-29
3-9
4-4
5-3
6-4
6-6
Contents-7
-I
I-
1
Getting Started
-I
I-
Getting Started
The noise figure and gain measurements require an HP 859XE Series
spectrum analyzer. The information about measurements in this guide
assume you are using an HP 87405A probe-powered preamplifier and an HP
346B noise source.
The sections in this chapter provide the following:
l
Instructions for installing the HP 85719A Noise Figure Measurements
Personality into an Option 119 HP 859XE Series spectrum analyzer
Instructions for verifying hardware operation using the SELF TEST menu
key
After the measurement personality is copied into spectrum analyzer memory,
some spectrum analyzer functions change. The notable differences with the
measurement personality installed are listed below:
l
The following front-panel keys are disabled:
l
@iziKEq
(piETEq
CMEAS/USERJ
All MARKER and CONTROL keys
l
The front-panel [CAL) key function calibrates the instrument for making
noise figure and gain measurements, rather than spectrum analysis
measurements.
l
The front-panel RPG-title mode, bandwidth, and marker key functions are
disabled and relocated as menu keys in the measurement personality’s
menu.
l
The front-panel [SAVE) and [RECALL) keys display measurement
personality-speciEc menu operations.
l
Several spectrum analyzer remote commands are invalid while you are in
noise Egure and gain measurement mode. Use the noise Egure and gain
remote commands provided in Chapter 6 of this manual.
l-2
-I
I-
Users’ Guide Key Conventions
The following key conventions are used throughout this guide:
[FRONT
PANEL KEY]
Softkey and
SOFTKEY
Screen Text
Boxed text indicates a key physically located on the
front-panel of the spectrum analyzer or a controller
keyboard.
Shaded text indicates a key label that appears on the
display of the spectrum analyzer. The keys that are
associated with the labels are physically located on the
right-hand side of the spectrum analyzer display. These
are frequently referred to in text as the measurement
personality’s menu keys.
Bold text in this typeface indicates information that you
may see displayed on the spectrum analyzer screen.
This is often representative of prompts, warnings, and
results information.
When pressing hardkeys or softkeys, be sure to allow sufficient time for the spectrum analyzer to
respond to the command. Fast, consecutive key presses may cause an error in the spectrum analyzer.
1-3
I-
-I
Installing the Measurement Personality
To install the noise figure and gain measurement personality, all of the
spectrum analyzer user memory needs to be available. Dispose previously
installed DLPs, then install the HP 85719A DLP.
You can conErm that the measurement personality and associated hardware
are working properly with the self-test function available in the personality’s
main menu.
To dispose previously installed DLPs
The measurement program requires most of the user memory in the spectrum
analyzer. Refer to the steps below to dispose previously installed user
programs :
1. Press @F?F] on the spectrum analyzer.
2. Erase the current user program (DLP) from user memory.
l
l
l-4
Most DLPs include a DLP-dispose menu key. Locate and press the
dispose key (often labeled DISPOSE and the DLP name) if a personality
is currently installed.
If a DLP-dispose key is unavailable, press the front-panel @FiQ key.
Press More 2 of 3 , then press DISPOSE USER MEM two times.
I-
-I
Getting Started
Installing the Measurement Personality
To load the noise figure and gain measurement DLP
After the memory is cleared, insert the HP 85719A measurement personality
card into the spectrum analyzer’s card reader slot.
Insert the memory card correctly. The measurement card illustrates correct
orientation with an arrow and label.
To load the noise figure and gain DLP, refer to the following steps:
1. Press the spectrum analyzer front-panel CRECALL) key,
2. Underline CARD in the INTERNAL CARD menu key.
3. Press CATALOG CARD , then the CATALOG ALL menu key.
4. If needed, use the @) and @J keys to highlight the measurement
personality file. The label of the file will resemble the following, with
different numbers and dates:
dNF
DLP 310 167 20:26:38 12 AUG, 1992
5. Press LOAD FILE and wait about 40 seconds while the highlighted file is
installed.
6. Press (m) to display the NF%GAIN measurement personality softkey.
7. Press the NFtGAIN key to enter the measurement personality. After a
moment, the main menu is displayed.
To re-enter spectrum analyzer mode press (jj), then press
Spectrum Analyzer
NOTE
Traces A, B, and C are used by the Noise Figure Measurements Personality Any data in these traces
will be overwritten when in noise figure mode.
Traces can be saved. Saved traces will not be affected by mode changes.
l-5
I-
-I
Using the Self-Test Feature
This section contains procedures to help you verify whether the noise-source
drive option card is properly installed and working on the Option 119
spectrum analyzer.
NOTE
If you are verifying a retrofitted HP 859XE spectrum analyzer, refer to the instructions included with
the retrofit kit.
Using the self-test function
The self-test function checks that the noise-source drive option card is
properly installed and working.
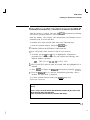
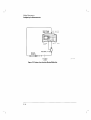
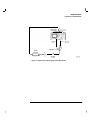
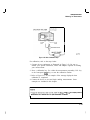
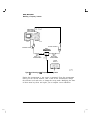
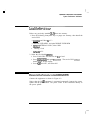
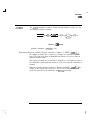
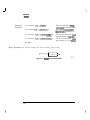
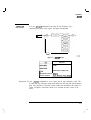
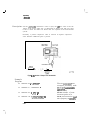
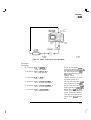
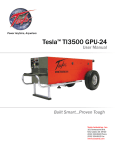
To verify proper hardware function, connect the equipment as illustrated in
Figure l-l, then refer to the steps below:
NOTE
Generic 8590E Series spectrum analyzer front and rear panel illustrations are used throughout this
guide. Depending on the model number and options, your spectrum analyzer front and rear panels may
be different.
l-6
-I
Getting Started
Using the Self-Test Feature
SPECTRUM ANALYZER
PROBE
PWR
28 VOLTS
SW I TCHED
I
N P U T 5OR
PREAMPL I FIER
IEcJ
DO720
Figure l-l. Self-Test Equipment Connections
1. From the measurement personality’s main menu, press SELF TEST
2. Set up the test equipment as described on the display, then press
3. Wait approximately 2 minutes for the system to complete the procedure
4. With PASS status, you can continue with measurement configuration.
If the self-test finds trouble
problem continues, refer to the return-for-service information that follows.
l
Make sure the noise-source drive signal from the spectrum analyzer’s rear
panel “28 VOLTS SWITCHED” is connected to the noise source.
l
Make sure the HP 87405A preamplifier probe-power connector is inserted
into the spectrum analyzer PROBE PWR connection.
l
Check that the noise source and preamplifier are properly connected.
l-7
-I
Getting Started
Using the Self-Test Feature
l
Check that the Option 119 card is getting recognized by the spectrum
analyzer.
Press the front-panel [MODE) key.
Press the Spectrum Analyzer softkey
Press @%i?$ then More 1 of 3
Press SHOW OPTIONS 119: NOISE should be displayed.
Re-run the self-test.
l
For any error messages generated by the measurement personality, refer to
Chapter 5, “If You Have a Problem 1, in this guide.
If the trouble persists
Sales and service offices
listing
If the self-test continues to find a problem, and all of the items above are
correct, the instrument may need service. Refer to the recommendations
below:
l
Copy any error messages onto a sheet of paper.
l
Contact one of the HP sales and service offices listed in the ‘lhble l-l.
Describe the trouble to the service office personnel.
l
If returning the instrument to the manufacturing factory is
required, shipping instructions are located in Chapter 5,
“If You Have a Problem . . . ’ in this guide.
The HP Sales and Service Office personnel can answer questions for you.
Have a copy of the error messages available when you talk to one of the
engineers.
l-8
I-
-I
Getting Started
Using the Self-Test Feature
Table l-l. Hewlett-Packard Sales and Service Offices
US FIELD OPERATIONS
Headquarters
California, Northern
California, Southern
Colorado
Hewlett-Packard Company
19320 Pruneridge Avenue
Cupertino, CA 95014, USA
18001 752-0900
Hewlett-Packard Co.
301 E. Evelyn
Mountain View, CA 94041
14151 694-2000
Hewlett-Packard Co.
1421 South Manhattan Ave.
Fullerton, CA 92631
17141 9994700
Hewlett-Packard Co.
24 Inverness Place, East
Englewood, CO 80112
13031 649-5000
Georgia
Illinois
New Jersey
Texas
Hewlett-Packard Co.
2000 South Park Place
Atlanta, GA 30339
14041 955-1500
Hewlett-Packard Co.
5201 Tollview Drive
Rolling Meadows, IL 60008
17081 255-9800
Hewlett-Packard Co.
120 W. Century Road
Paramus, NJ 07653
12011 599-5000
Hewlett-Packard Co.
930 E. Campbell Rd.
Richardson, TX 75081
12141 231-6101
EUROPEAN FIELD OPERATIONS
Headquarters
France
Germany
Great Britain
Hewlett-Packard S.A.
1 5 0 , R o u t e d u Nant-d’Avril
1217 Meyrin 21Geneva
Switzerland
141 221 780.8111
Hewlett-Packard France
1 Avenue Du Canada
Zone D’Activite De Courtaboeuf
F-91947 Las Ulis Cedex
France
133 11 6 9 8 2 6 0
Hewlett-Packard GmbH
Berner Strasse 117
6000 Frankfurt 56
West Germany
149 691 500006-O
Hewlett-Packard Ltd.
Eskdale Road, Winnersh Triangle
Wokingham, Berkshire RF11 502
England
I44 7341 696622
INTERCON FIELD OPERATIONS
Headquarters
Australia
Canada
China
Hewlett-Packard Company
3495 Deer Creek Rd.
Palo Alto, California 943041316
14151 857-5027
Hewlett-Packard Australia Ltd.
31-41 Joseph Street
Blackburn, Victoria 3130
161 31 895-2895
Hewlett-Packard [Canada] Ltd.
17500 South Service Road
Trans. Canada Highway
Kirkland, Quebec H9J 2X8
Canada
15141 697-4232
China Hewlett-Packard Company
3 8 Bei S a n H u a n X l R o a d
Shuang Yu Shu
Hai Dian District
Beijing, China
186 I I 2 5 6 - 6 8 8 8
Japan
Singapore
Taiwan
Yokogawa-Hewlett-Packard Ltd. Hewlett-Packard Singapore IPte.1 Ltd Hewlett-Packard Taiwan
8th Floor, H-P Building
1-27-15 Yabe, Sagamihara
1150 Depot Road
(enagawa 229, Japan
Singapore 0410
337 Fu Hsing North Road
~81 4271 5 9 - 1 3 1 1
I651 273-7388
Taipei, Taiwan
1 8 8 6 2 1 712-0404
l-9
-I
2
Making Measurements
-I
Making Measurements
This chapter contains instructions for using the measurement personality.
The descriptions of the menu keys are located in Chapter 3, “Menu Key
Descriptions. ”
“Making Measurements” is organized into the following sections:
l
Improving Noise Figure Measurement Accuracy
l
Configuring for Measurements
Entering measurement frequencies
Entering points to be measured
Entering tune and BW parameters
Entering preamplifier gain
Entering noise source case temperature
Editing noise source ENR data
l
Calibrating for Measurements
l
Making Measurements on an Amplifier
l
Making Measurements on a Frequency Converter
l
Making Measurements on a Mixer
The measurement examples provided here use the equipment listed in
Table 2-l on the following page. Other equipment can be substituted if the
critical specifications are accommodated.
2-2
I-
-I
Making Measurements
Using the Self-Test Feature
Table 2-1. Equipment Requirements
I
Instrument
Model Number
Seecifications
H P 8591E, H P 8593E, H P 8594E, H P 8595E,
o r H P 8596E
859XE-series firmware and hardware
Noise Source
H P 3468 Noise Source [Option 0011
Frequency range: 10 MHz to 2.9 GHz
E N R : 1 4 t o 1 6 dB
IO MHz to 30 MHz, SWR: 1.3
3 0 M H z t o 2 . 9 GHz, S W R : 1 . 1 5
Power raouiramant: 28 Vdc If1 Vdcl
System Preamplifier
HP 87405A Probe-Powered Preamplifier
Frequency Range: 10 MHz to 2.9 GHz
Noise Figure: 7.5 dB
I n p u t S W R : 2:l lmaximuml
Probe-power bias connector
1 HP 859XE Series Spectrum Analyzer
I
2-3
I-
-I
Improving Noise Figure Measurement Accuracy
You can improve the accuracy of a noise figure measurement by following the
suggestions listed below:
l
Use RF precautions with the equipment setup. Some of these are listed
below:
Tighten measurement connections and avoid using non-threaded
connectors such as the BNC-style connectors.
Use only cables that are in good condition.
Make measurements away from potentially interfering signals.
l
“Increase” device gain, if possible.
Higher device gain minimizes many errors related to the measurement
system.
l
Reduce the measurement system noise.
Reduce the effects of measurement system noise by using a low-noise,
system preamplifier whenever possible.
l
Reduce known error sources such as SWR and ENR uncertainty.
l
Use a narrower measurement bandwidth than the bandwidth of the device
under test.
Refer also to product note 85719A-1 for additional information.
2-4
-I
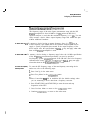
Configuring for Measurements
The Conf kg menu provides the parameters whose values and states need
to be determined, if they are to be changed from default values, before you
begin making measurements.
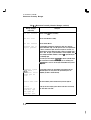
Table 2-2 lists the configuration menu keys and some brief descriptions of the
parameters. Refer to Chapter 3, “Menu Key Descriptions” for more thorough
information.
2-5
-I
IMaking Measurements
Configuring for Measurements
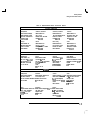
Table 2-2. Configuration Selections
Menu Key
Selections
Use
Parameter Range
Freq Menu
Start and stop
frequencies
or with frequency
conversion,
RF and IF start and
stop frequencies
Sat measurement fraquancr Frequency range of the spectrum
analyzer in non-conversion mode;
range
In conversion mode, the RF-start
and RF-stop frequency ranges arc
0.00 Hz to 999.9 GHz
POINTS
Points to measure
Set the number of equally
spaced frequency points
over the measurement
frequency range
1 point to 401 points
Test Limits
Measurement limit
settings for minimum
and maximum noise
figure and gain
Sat minimum- and
maximum-power limits for
noise figure and gain
pass/fail testing
N F : 0 . 0 0 dB t o 9 9 . 9 0 dB
G a i n : - 9 9 . 9 0 t o +99.90 dB
Measurement
reference levels and
scales
Set the measurement
reference levels and scales
Noise figure reference level
r a n g e i s -99.9to +99.90 dB
Noise figure scale range is 0.10
dB t o 9 9 . 9 0 dB
Gain reference level range is
- 9 9 . 9 dB t o +99.90 dB
Gain scale range is 0.10 dB to
9 9 . 9 0 dB
Enter additional
neasuramant
sarameters t o
:ustomiza
naasuramant
.aquiramants
Ranges listed in Chapter 3,
Specific uses provided
slphabatically in Chapter 3, “Menu Kay Descriptions’
‘Menu Kay Descriptions”
[appears if number of
p o i n t s = 11
Ref Lvl t Scale
More 1 of 2 key
yields these menu keys:
Time-BW Menu
External Losses
PREAMP GAIN
SOURCE TEMP
Edit ENR Data
2-6
-I
Making Measurements
Configuring for Measurements
To enter measurement frequencies
The frequency range of the noise figure measurement setup with the HP
87405A preamplifier is from 10 MHz to 2.9 GHz, unless the HP 85913
spectrum analyzer is used, then the maximum frequency is 1.8 GHz. You can
easily measure a device whose output frequency range falls within this span
without additional hardware.
To measure above 2.9 GHz
To measure a device having an output frequency above 2.9 GHz, but an
overall frequency span within that of the spectrum analyzer, you need to
supply a system preamplifier that extends to the output frequency of the
device tested. Also, the specifications in Table 4-l may not apply when other
than an HP 87405A preamplifier is used.
To measure below IO MHz
To measure a device having a frequency range below the 10 MHz specification
of the HP 85719A measurement personality, you need to provide a
low-frequency system preampliEer (such as the HP 8447) and a low frequency
calibrated noise source. Also, the speciEcations in Table 4-l may not apply
when other than an HP 87405A preampliEer is used.
To measure non-frequency
converting devices
To enter the RF frequency range of the non-frequency converting device
under test, refer to the following steps:
1. Press Conf ig in the main menu.
2. Press Freq Menu in the conEguration menu.
3. Press Conversion PES NO to underline NO (the default setting) when
you are measuring a device other than a frequency converter.
4. Press START FREQ and STOP FREQ to enter the start and stop
frequencies of the DUT.
5. Press Previous Menu to return to the conEguration menu.
6. Continue conEguration, or return to the main menu.
2-7
-
-I
IMaking Measurements
Configuring for Measurements
To measure frequency
converting devices
The measurement personality frequency menu supports two modes. The Erst
mode described below is for frequency converting devices. The second mode
is for non-frequency converting devices.
When the DUT (device-under-test) is a frequency converter, the RF and IF
frequency values need to be entered. The RF frequency values are used in
the personality to select the appropriate ENR data. The IF frequencies are
those of the DUT output.
To set the measurement frequency range for frequency converters, refer to
the following steps:
1. Press Conf ig in the main menu.
2. Press Freq Menu in the conEguration menu.
3. Press Conversion YES NO to underline YES when you are measuring a
frequency conversion device.
4. Enter the IF and RF start and stop frequencies of the DUT.
NOTE
Be sure to enter an RF frequency span equal to the IF frequency span.
The RF start frequency must correspond with the IF start frequency even if it results in a “backwards”
sweep condition.
2-8
l
Press RF START FREQ and RF STOP FREQ to enter the RF frequency
values of the DUT.
l
Press IF START FREQ and IF STOP FREQ to enter the IF frequency
values of the DUT.
-I
Making Measurements
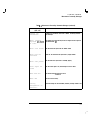
Configuring for Measurements
Table 2.3. Points Entered vs Points Measured
lumber Entered \ctual Number of Points Measured
1
2
3
4 to 5
6 to 7
Z-10
1 point
2 points
3 points
5 points
6 points
6 to 9
9 paints
10 to 1 3
11 points
1 4 to 1 6
17 points
1 9 to 2 3
21 points
24 to 34
26 points
34 to 45
41 points
46 to 65
51 points
66 to 90
81 points
91 to 150
101 points
1 5 1 to 300
201 points
301 to 401
401 points
I-
-I
Making Measurements
Configuring for Measurements
To enter time-BW parameters
Enter time-bandwidth measurement parameters via the Time-BW Menu key,
following the steps below:
1. Press Conf ig in the main menu.
2. Press More 1 of 2 , then Time-BW Menu
3. Press BANDWDTH and use the front-panel data keys, enter a measurement
bandwidth.
l
Use 1 MHz measurement bandwidth, except when measuring narrow
band devices.
l
For narrow band devices, use a bandwidth narrower than the device
bandwidth.
4. Terminate data entry by pressing a frequency units key.
Determine the
time-bandwidth product
To set the time-bandwidth product in kHz-seconds, multiply the desired
averaging time in seconds by the measurement bandwidth in kHz. Increasing
the time-bandwidth value can reduce the measurement’s repeatability
error. Use the Help Time-BW key to understand more about controlling
measurement error. Refer also to the product note 85719A-1. The following
steps guide you through data entry.
1. Press TIME-BW PRODUCT key.
l
Enter a larger value to reduce repeatability error (jitter), but increase
measurement time.
l
Enter a smaller value to reduce measurement time, at the cost of
increased measurement repeatability error (jitter).
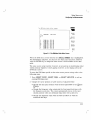
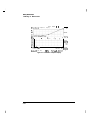
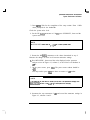
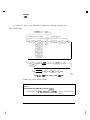
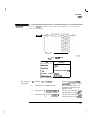
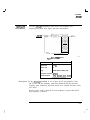
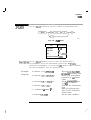
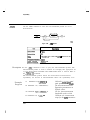
2. Press Help Time-BW to review the values in the measurement
repeatability calculator. Refer to Figure 2-2 for an example of the
repeatability calculator. Notice the “Ssigma” value change as you adjust
the values of the following parameters:
2-11
-1
-I
IMaking Measurements
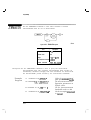
Configuring for Measurements
ESTIMRTO
DUT NF
REPEATABILITY
ERROR
Enter parameters
NF repeatability
IME-BU
00
+
PROOUCT,
0.05
dB
CALCULATOR:
tb find the approximate
due to jitter.
ESTIMATD
DUT GAIN
kHz-set
3sigma REPEATABILITY,
may be reduced by Increasing
the Time-BW product.
OUT NF 5.00 dB
OUT GAIN 18.00 dB
TEST SYS NF lB.OO dB
ENR 15.00 dB
TIMEIBW
5E0 (kHz-see)
SLdB 0.00 dB
ILdB 0.00 dB
OLdB 0.00 dB
BW 1000 kHz
Avg Time
0.5 set
EST TEST
SY9 NF
ESTIMATO
ENR
Previous
Meflu
L
Figure 2.2. The Help Screen Time-BW Repeatability Calculator
l
Press ESTIMATD DUT NF and enter the estimated noise figure value of
the device you are measuring. Press ENTER. Low noise-figure devices
may need more gain for more accurate noise measurements.
l
Press ESTIMATD DUT GAIN and enter the estimated gain value of the
device you are measuring. Press ENTER. Higher device gain tends to
reduce measurement error.
l
Press EST TEST SYS NF (displayed at the completion of a calibration)
and enter the estimated noise figure of the system. Press ENTER.
l
Press ESTIMATED EMR and enter the approximated noise source ENR
value for the frequencies to be measured. Press ENTER.
l
Press TIME-BW PRODUCT and enter a value. There is an inverse,
square-root proportionality between repeatability and the time-BW
factor.
To reduce the repeatability error to approximately half its current
amount, quadruple the value of the time-BW product.
2-12
-
-I
IMaking Measurements
Configuring for Measurements
To enter external losses
If you plan to use hardware or cables that have known losses, you can enter
these values into the measurement configuration settings. When you are
correcting for external losses, accurate loss values should be used to prevent
introducing errors into the device measurements.
The loss corrections are also included in the repeatability error calculations.
There are four points that can contribute loss into the measurement. One of
the four points is the measurement setup loss.
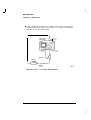
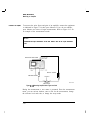
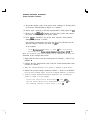
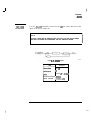
Do not enter corrections for the loss encountered at the point illustrated in
Figure 2-3 and Figure 2-4. Measurement setup loss is automatically factored
into the final measurement result.
To enter external losses
To enter corrections for the remaining three loss locations, refer to the
information below:
1. Press Ex+zrnal Losses . Enter known loss values designated as:
System Loss (this value is not entered into the measurement manually)
SOURCE LOSS
INPUT LOSS
OUTPUT LOSS
2-13
I-
-I
Making Measurements
Configuring for Measurements
SPECTRUM
ANALYZER
PROBE
PWR
28 VOLTS
SWITCHED
I N P U T 500
PREAMPL IF I ER
NOISE
SOURCE
i
SYSTEM
LOSS
pa770
Figure 2-4. System loss location During Device Measurement
2-15
-I
Making Measurements
Configuring for Measurements
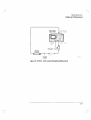
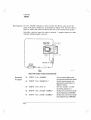
0
Press SOURCE LOSS and enter the known loss value present at the
location indicated in Figure 2-6 or Figure 2-5. The loss is subtracted
from the excess noise ratio (ENR).
SPECTRUM
ANALYZER
28 VOLTS
1 SW I T C H E D
PROBE
PWR
N P U T 50fl
PREAMPL IF
NOISE
1
SOURCE
LOSS
Figure 2-5. SOURCE LOSS location During Calibration
2-16
DO7140
-I
IMaking Measurements
Configuring for Measurements
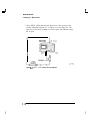
l
Press INPUT LOSS and enter the known loss value present at the
location indicated in Figure 2-7 or Figure 2-8 as the input loss. The
input loss of the DUT is added to its noise figure, but subtracted from
the its gain.
I N P U T 5Ofl
PROBE
PWR
I
I
NOISE
pa7150
Figure 2-7. INPUT LOSS location During Calibration
2-18
-I
Making Measurements
Configuring for Measurements
SPECTRUM
ANALYZER
28 VOLTS
SWITCHED
PREAMPLIFI
INPUT
LOSS
po79a
Figure 2-8. INPUT LOSS location During Device Measurement
2-19
I-
-I
Making Measurements
Configuring for Measurements
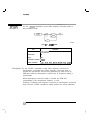
. Press OUTPUT LOSS and enter the known loss value present at the
location indicated in Figure 2-9 or Figure 2-10 as the output loss. The
output loss is subtracted from the gain or the device under test, but
proportionally calculated into its noise figure.
PREAMPLIFIER
NOISE
SOURCE
Figure 2-9. OUTPUT LOSS location During Calibration
2-20
pa7160
I-
-I
Making Measurements
Configuring for Measurements
SPECTRUM
ANALYZER
1
28 VOLTS
SWITCHED
I NPUT
PROBE
PWR
I
I
OUTPUT
LOSS
pa7100
Figure 2-10. OUTPUT LOSS location During Device Measurement
2-21
IMaking Measurements
Configuring for Measurements
To enter preamplifier gain
The gain of the measurement system preamplifier should be entered via the
PREAMP GAIN key. The gain value is used during system calibration and
measurement calculations. Refer to the following steps:
1. Press the Conf kg key in the main menu.
2. Press More 1 of 2 in the configuration menu
3. Press PREAMP GAIN and enter the known, minimum preamplifier gain
l
Use the @J and @) keys to change the gain value in 1.0 dB increments.
l
Use the RPG to change the gain value in 0.01 dB increments.
l
Use the front-panel data keys to enter exact values. Terminate data-key
entry with the ENTER key.
4. Complete data entry by pressing a dB-units key.
2-22
Making Measurements
Configuring for Measurements
To enter noise-source case temperature
The noise-source case temperature, or ambient temperature, contributes to
measurement accuracy results. If the noise source is used to measure devices
within a temperature chamber, the temperature of the chamber needs to be
entered into the configuration settings. Refer to the following steps:
I. Press Canf ig in the main menu
2. Press More 1 of 2 in the configuration menu.
3. Press SOURCE TEMP and enter the ambient temperature of the testing
environment. Retain the default setting of 21°C for measurements made in
typical room-temperature environments.
l
Use the Q) and @J keys to change the temperature value in l.O’C
increments. Do not press ENTER. The value is automatically accepted.
l
Either do not use the RPG or use it very carefully. The RPG will change
the temperature value very fast. Small rotations cause large changes.
Do not press ENTER; the value is automatically accepted.
l
Use the front-panel data keys to enter exact values, then press ENTER.
2-23
I-
-I
Making Measurements
Configuring for Measurements
To edit noise source ENR data
The noise source’s ENR (excess noise ratio) data is used by the personality to
calculate measurement results. The data listed on the noise source is typically
unique to each noise source. ENR data tables can be saved to, or recalled
from memory cards and spectrum analyzer memory registers.
NOTE
The measurement personality arrives with a default ENR-data table installed in memory Either the
default table, or the table that was last edited, saved, or recalled, is the table that is used. The ENR
data is used by the personality for measurement calculations.
Be sure that the ENR-data table your measurement is using is the one you want. If you entered the
noise source’s serial number, look for it in the upper right-hand corner of the display
To edit ENR data tables
Press Conf ig , More 1 of 2 , then Edit ENR Data. The currently
active ENR table data table is displayed. Refer to Figure 2- 11 for an
example of an ENR table.
2-24
I-
-I
Making Measurements
Configuring for Measurements
NOTE
Enter the complete dB value listed on the noise source for each frequency point. The personality does
not display the 10tlthdB value, however it is accepted and used within the calculated measurement
results.
l
Press the DELETE POINT key to delete all the values of a point from
the table, regardless of the highlighting position in a data point.
l
Press Edit Done to return to the previous menu. The edited ENR data
is used for the next measurements.
3. To store the ENR data table to a memory register, use the front-panel
ISAVE) key as explained in the following section.
To save ENR data tables
To save the ENR data to memory, press Edit Done , then follow the steps
below:
1. Press the front-panel m key.
2. Press INTERNAL CARD to underline the save destination you want to use.
3. Press either ENR + INTERNL when you have chosen spectrum analyzer
memory, or ENR -+ CARD when you have chosen memory card memory.
4. Enter the memory register number you wish to use, then press ENTER on
the front panel. The message ENR DATA SAVED appears on the display.
2-26
-I
IMaking Measurements
Configuring for Measurements
NOTE
Memory card memory registers 0 to 999 are available.
Be aware that ENR data is stored to trace registers lTR0 to TR52) and registers ST1 through ST8 are
reserved for spectrum analyzer operations only,
Trace registers lTR0 to TR521 can be used to store both ENR data and states. When using interal
memory, a different register must be used for each ENR data and state saved.
WARNING
Avoid using spectrum analyzer state register 8 (ST@. The measurement
personality uses ST8 for temporary storage of state and trace data.
To recall ENR data tables
ENR data tables may be stored in spectrum analyzer memory, or in a memory
card memory register. To recall existing ENR data tables, refer to the steps
below:
NOTE
ENR data tables are prefixed “TR” in spectrum analyzer memory, or “tNFENR” in memory card memory
Refer to Table 2-4 for an explanation of the prefixes in the memory locations.
1. Press the front-panel [RECALL] key, while you are in NF&gain mode.
2. Press INTRNL CARD until the memory location you want is underlined.
l
When INTRNL is underlined, press INTRNL --+ ENR to display the
ENR data tables in spectrum analyzer memory.
l
When CARD is underlined, press CARD - ENR to display the ENR
data tables in memory card memory.
3. Use the RPG or step keys to highlight the ENR data table of interest.
2-27
IMaking Measurements
Configuring for Measurements
4. Press LOAD FILE to begin using the ENR data for the noise source you
are using for measurements.
NOTE
Register prefixes NFTST, NFTRA, and NFTRB are reserved prefixes used by the noise figure and
gain personality Do not use these prefixes with your memory operations.
2-28
-I
IMaking Measurements
Configuring for Measurements
Assigning and Using Registers and Prefixes
The following table defines the prefixes that appear in the catalog listing of
either the memory card or spectrum analyzer memory registers.
Table 2-4. Prefix Descriptions of Memory Registers
Destination
_-_... - _._.. -Selection
-.--..-..
Save to
1 Resister Name in Cataloo 1
Prefix llarerintinn
----..
r
-.-..
INTERNAL
STATE --* INTRNL
TRregister number
A trace register containing the event’s instrument state.
TRregister number
A trace register containing the event’s instrument state.
tNFS-regkter number
The t indicates the file type, followed with NFS indicating a
personality state.
t NFENR-register number
The t indicates the file type, followed with NFENR indicating
a table of noise source excess-noise-ratio data.
tNFTST-register number
The t indicates the file type, followed with NFTST indicating
an instrument state and the traces. The personality creates two
hidden files (not visible in NF mode, but displayed in spectrum
analyzer mode] labeled tNFTRA and tNFTRB followed with
the register number.
i NF I -reghter number
The t indicates the file type, followed with NFI indicating a
display image.
Save to INTERNAL
ENR - INTRNL
Save to CARD
State --+ Card
Save to CARD
ENR -+ Card
;ave to CARD
l’R&ST + Card
;ave to CARD
D i s p l a y ---t C a r d
2-29
-I
I-
Calibrating for Measurements
The calibration procedure minimizes the effects of losses, noise, and gain
factors due strictly to the measurement setup.
After entering the measurement configuration information, calibrate the
measurement setup. The calibration data is stored and available for the
current measurement configuration.
If you cycle power, the configuration information is not changed, however, a
new calibration is recommended before you resume measuring, especially if
the instrument temperature has changed.
Calibration requires the following:
l
l
l
l
The device to be tested is not connected.
The measurement configurations are determined.
The noise source is connected.
The preamplifier is connected.
NOTE
You can make noise figure measurements without completing calibration. However, the gain
measurement will not be made (no gain trace displayed). An additional error occurs in the
measurement results when calibration is bypassed. The error is especially noticeable when low gain
devices-under-test are measured.
2-30
I-
-I
Making Measurements
Calibrating for Measurements
PROBE
PWR
I N P U T 50i7
I
I
PREAMPLIFIER
po72a
Figure 2-12. Basic Calibration Setup
For calibration, refer to the steps below:
1. Connect the test equipment as illustrated in Figure 2-12. Be sure to
include your specific connectors, cables and adapters required for making
your measurement.
2. Press a calibration key. Use either the measurement personality CAL key
or the front-panel a key, to start the calibration routine.
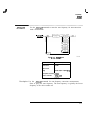
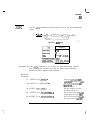
3. Refer to Figure 2-13 for an example of the message displayed when
calibration is completed.
4. Connect the device to test and begin making measurements. Some
examples are included in this chapter.
RFstart, and RFstop (for frequency converter
measurements) after calibration does not require measurement recalibration.
-I
Making Measurements
Calibrating for Measurements
@Calibration
completion
NOISE
display.
SOURCE
I
0
CAL
!L
dB/
MEASURE
Gain
10.0
dB/
SLdB
j
j I.. 1.u
.j j
Config
.:
DEFAULT
CONFIG
WI+
START
10.000
BandwIdth
:
NF
RL
0.0
da
Gain
RL
0.0
MHz
1.000 MHz
3 Pts
L
da
Avg Time
STOP
1800.000 MHz
a.5 sec/pt
Figure 2.13. Calibration Completion Display
2-32
SELF
TEST
DISPOSE
NFtGAIN
R
I-
-I
Making Hard-Copies
Connect the spectrum analyzer to an HP-IB printer and use the front-panel
IcoPv] key to generate prints.
A printer is the suggested output device.
A plotter may be used to obtain measurement output, however in some
instances the plot may not yield exactly what appears on screen.
2-33
IMeasuring an Amplifier
To measure an ampliher, connect the equipment, but bypass the device to
be tested as stated in “Calibrating for Measurements” and illustrated in
Figure 2-12. Be sure to include all needed adapters, cables, and hardware
required for your test.
Configuring for the measurement
Refer to the steps below to enter measurement parameters for the amplifier.
The specific values are not included. Use the values unique to the device you
are testing.
1. Press Conf ig in the main menu.
2. Press Freq Menu, then underline NO in the Conversion YES NO key.
3. Enter the start and stop frequencies of the device you are testing.
4. Press Previous Menu and select POIPJTS
l
Enter a number with the front-panel data keys, remembering that
the number you enter may be translated into a number that can be
used. Refer to the POINTS key description in Chapter 3, “Menu Key
Descriptions. ”
l
Terminate the value with the ENTER key.
l
If you entered POINTS = 1, you can also enter test-limit values.
l
Return to the configuration menu by pressing Previous Menu
5. Press More 1 of 2 to enter additional measurement parameters as
explained in above in “To enter time-BW parameters”.
2-34
-I
IMaking Measurements
Measuring an Amplifier
Calibrate the measurement
setup
If you calibrate the measurement setup, include all the hardware and cabling
required for your measurement, unless you have entered DUT input and/or
output losses. At the end of the measurement, a message appears to indicate
calibration completion.
1. Connect the noise source to the input of the preamplifier, with all the
connectors, cables, and necessary hardware included.
2. From the main menu, press CAL
When calibration is completed, connect the device and begin measuring.
2-35
I-
-I
Making Measurements
Measuring an Amplifier
To measure the amplifier
To measure the noise figure and gain of an amplifier, connect the equipment
as indicated in Figure 2-14, then press Measure If you do not calibrate,
press Measure two times to begin measurements. Refer to Figure 2-15 for
an example of the measurement results.
NOTE
Uncalibrated noise figure measurements can be made, however, there will be no gain measurement
trace.
SPECTRUM ANALYZER
28 VOLTS
SWITCHED
NOISE SOURCE
PREAMPLIFIER
VOLTAGE
00740
AMPLIFIER
Figure 2.14. Measuring Amplifier Noise Figure and Gain
During the measurement, a new menu is presented. From the measurement
menu, you can activate markers, enter a title for the measurement, change
the reference level and scale, or change the sweep mode.
2-36
Making Measurements
Measuring an Amplifier
NOISE SOURCE 12493
Gain 9.25 dB
____
Gain
5.0
d6/
SLdB
0.0
ILdB
Ohi
0-B
De9C
21.0
I-P
START
60.000
MHz
Bandwidth
1.800
:
NF RL 0.0 dB
STOP
800.000
MHz
41 Pts
Rug
Time
0.5
MHz
sec/pt
RL
Figure 2.15. Amplifier Measurement Results Example
2-37
-I
Measuring a Frequency Converter
To measure the noise figure and gain of a frequency converting device such as
a television tuner, connect the equipment (bypassing the device to be tested)
as stated in “Calibrating for Measurements” and illustrated in Figure 2-12. Be
sure to include all needed adapters, cables, and hardware required for your
test.
To measure the noise figure and gain of a microwave converter, refer
to product note 85719A-1, for information about configuring for the
measurement.
Configuring for the measurement
Refer to the steps below to enter measurement parameters for the frequency
converter. The speciEc values are not included. Use the values unique to the
device you are testing.
1. Press Conf ig in the main menu.
2. Press Freq Menu, then underline YES in the Conversion YES NO key
l
l
Enter the RF and IF frequencies of the device you are testing. The RF
and IF spans equal must be equal.
The RF start frequency must correspond with the IF start frequency,
even if the resulting values cause a “backwards sweep” condition (start
frequency is greater than the stop frequency).
3. Press Previous Menu and select POINTS
l
Enter a number with the front-panel data keys. Terminate the value
with the ENTER key.
l
If you entered POINTS = 1, you can also enter test limit values.
l
Return to the conEguration menu by pressing Main Menu
2-38
I-
-I
Making Measurements
Measuring a Frequency Converter
4. Press More 1 of 2 to enter additional measurement parameters.
Calibrate the measurement
setup
If you calibrate the measurement setup, connect the equipment as illustrated
in Figure 2-12. Enter DUT input and/or output losses as previously explained
in “To enter external losses”. At the end of the measurement, a message
appears to indicate calibration completion.
1. Connect the noise source to the input of the preampliEer, with all the
connectors, cables, and necessary hardware included.
2. From the main menu, press CAL
When calibration is complete, connect the device to begin measurements.
To measure a frequency
converting device
To measure the noise figure and gain of a frequency converter, such as a TV
tuner, connect the device as illustrated in Figure 2-16, then press Measure .
Refer to Figure 2-17 for an example of the measurement results screen.
If you do not calibrate, press Measure two times to begin the measurement.
NOTE
Uncalibrated noise figure measurements can be made, however, there will be no gain measurement
trace.
2-39
-I
IMaking Measurements
Measuring a Frequency Converter
PROBE
PWR
I N P U T 50fl
NOISE SOURCE I
PREAMPLIFIER
75R
CONVERTERUNDER-TEST
MATCH I NG
TRANSFORMER
MATCHING
TRANSFORMER
POWER
SUPPLY
pa73a
Figure 2-l 6. Measuring a 75fl Frequency Converting Device
During the measurement, a new menu is presented. From the measurement
menu, you can activate markers, enter a title for the measurement, change
the reference level and scale, or change the sweep mode. Modifying the states
of these menu keys does not require you to complete a new calibration.
2-40
I-
-I
Making Measurements
Measuring a Frequency Converter
Double sideband converter corrections
To correct for the effect of double sideband mixing, enter an additional -3 dR with the
INPUT LOSS correction value. The actual resulting value is a sum of the loss correction of the
converter input with the -3 dH algebraically added, as shown below:
F o r i n p u t l o s s = 0 , + a d d i t i o n a l - 3 dB, e q u a l s : - 3 dB
F o r i n p u t l o s s = 5 , + a d d i t i o n a l - 3 dB, e q u a l s : 2 dB
Refer to product note number 85719A-1 for more information about double sideband converter
measurement and for the error sources in converter measurements.
Testing a multiband-TV tuner
This measurement personality allows you to test a device such as a multiband-TV tuner at several RF
input frequencies. If you keep the IF output frequency fixed, you can adjust the RF input frequency,
and continue measurements wlihout having to recalibrate the measurement configuration.
For frequency-conversion measurements, the RF frequency values entered in the configuration menu are
used only to determine which ENR data to use. The ENR of quality noise sources is very constant
over frequenn/, therefore, the exact RF value need not be entered, in most cases.
I
I
2-41
I-
Making Measurements
Measuring a Frequency Converter
&TU
!'8
dB/
TUNER
Marker
i
182.550 MHz
.:
:
:
NOISE SOURCE X2493
Gain 5.58 d3
NF ii.00 dB
I . ..I.. ,!
,,.......
i
i
..,,,,,..:
MARKER
FREQ
,,
MhRKER
DELTA
RF
180.000 MHz
IF
68.909 MHz
Bandwidth I.390 MHz
21 Pts
/iv3
RF
186.000 MHz
IF
66.888 M H z
Time
8 . 5 sec/pt
Figure 2.17. TV-Tuner Measurement Results Example
2-42
RL
-I
I-
3
Menu Key Descriptions
I-
-I
Menu Key Descriptions
This chapter is a reference that contains the measurement personality
menu map and the menu key descriptions. Refer to Chapter 2, “Making
Measurements” for specific measurement procedures that use these keys.
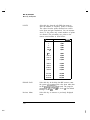
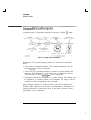
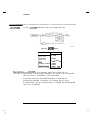
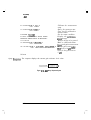
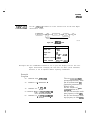
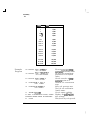
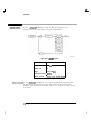
The main menu of the personality is illustrated in Figure 3-l below.
Noise figure
t r a c e scale/div\
&The
measurement
personality
NOISE
SOURCE
main menu.
X
B
CflL
\K
Gain trace
dk'
scale/div\
Source
Loss \i;;n
Entry
Input
MEASURE
10.0
dBC
ConfIB
L o s s \ LdB
Entry~I~~~
0.8
o u t p u t Loss/O;d;
Entry
oegc
21.0
/
N o i s e / I-C
I”
DEFAULT
CONFIG
:
:
,,,...,;
:
..,......
j
‘...
Gain
Measurement
Reference
Level
Figure 3-1. The Measurement Personality Main Menu
3-2
-
TEST
c
Averaging
Time
Measurement
Bandwidth
Noise
Figure
Measurement
Reference
Level
SELF
.....
:
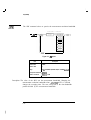
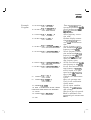
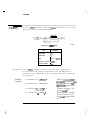
IMenu Map
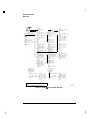
The menu map of the HP 85719A Noise Figure Measurements Personality
illustrates menu flow with both solid and dotted lines.
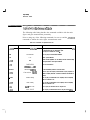
l
l
The dotted lines represent paths to menus or keys that appear when
parameter conditions require them. As an example, the Test Limit
key is available only when the number of points equals 1. If frequency
conversion is set to YES, additional keys are displayed to accommodate the
frequencies needed for making converter measurements.
The solid lines represent the default configuration menu paths.
3-3
-I
Menu Key Descriptions
Menu Map
NF de GAIN
(mm” menu)
CAL
MeoS”re
-
Figure 3-2. The NF & Gain Personality Menu Map
3-4
-I
Menu Key Descriptions
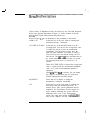
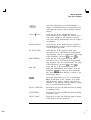
In this section, in alphabetical order, the menu keys are listed and described.
Refer to the previous illustration in Figure 3-2 for the location of the HP
85719A Noise Figure Measurements Personality keys.
Refer to Figure 3-l for an illustration of the personality’s main menu.
ABORT CAL
Select this key in the CAL menu to interrupt the
measurement-setup calibration.
AVG TIME AUTO MAN
Select this key in the time-BW menu to set the
averaging time. You can use the average-time value
to reduce the effects of jitter on measurement
repeatability. The longer the average time, the
better the jitter reduction. The range of values is
from 100 ms to 999 s; the default setting is AUTO
and 100 ms. The 0) and c9> keys increment time in
0.1 second when the value is less than 1.0 second.
The step increments above 1.0 second are 1 .O
second.
When AVG TIME AUTO is selected, the average time
value is coupled with the measurement bandwidth
value. As a result,a time-bandwidth product is
calculated.
When AVG TIME MAI4 is selected, you can change
the length of measurement time for each point
without changing the time-BW product.
BANDWDTH
Select this key to display or change the
measurement resolution bandwidth.
CAL
Select this key in the main menu to calibrate the
noise-figure and gain measurement setup. To
measure device gain, system calibration must be
completed. You can measure the noise figure of a
device without calibrating the system, however,
additional errors occur in the measurement
results. The setup must include the preampliEer,
noise source, adapters, and any other hardware
3-5
-I
IMenu Key Descriptions
Menu Key Descriptions
that remains in the test setup during device
measurements. Corrections entered with the
INPUT LOSS and DUTPUT LOSS keys should not
be included.
For calibrated measurements, changing a
measurement parameter (re-configuring) requires a
new calibration, except for those listed in the note
at the bottom of page 2-30. Remove the DUT from
the setup before recalibration.
NOTE
The front-panel (CAL) key is available anytime during the noise figure and gain measurements to
calibrate the system for accurate noise figure measurements. The gain trace does not appear until the
measurement system is calibrated.
The calibration data is used to calculate the
corrected noise figure and gain results. When a
calibration is performed, the noise is measured for
each selected calibration point. The calibration
points are equally spaced between the start- and
stop-frequency settings. The number of points and
the frequency values are set in the Calibration
menu. If these values are changed, recalibration is
required for measurement accuracy.
You can change the reference level and scale values
during measurements to improve trace readability
without re-calibrating the setup.
CARD - DISPLAY
Select this key from the front-panel [ml key
menu when CARD is underlined in INTRNL CAAD
Pressing the CARD - DISPLAY key catalogs the
arrow keys or the RPG to highlight the instrument
3-6
-I
IMenu Key Descriptions
Menu Key Oescriptions
display of interest. Use the LOAD FILE key to
recall the register contents.
CARD - ENR
Select this key from the front-panel [RECALL_) key
menu when CARD is underlined in INTRNL CARD
Pressing the CARD - ENR key catalogs the
registers. Use the arrow keys or the RPG to
highlight the ENR data of interest. Use the
CARD ---+ STATE
Select this key from the front-panel (ml key
menu when CARD is underlined in INTRNL CARD
Pressing the CARD - STATE key catalogs the
arrow keys or the RPG to highlight the instrument
state of interest. Use the LOAD FILE key to recall
Config
front-panel ($%@
configuration menu. Use the configuration menu
to set the measurement parameters. With the
scale, RF START and RF STOP frequency, changing
configuration settings after calibration is completed
made before resuming measurements. Default
configuration settings are listed in Table 3-l of this
Conversn YES/NO
Select this key in the frequency menu to choose the
is off, or NO Set frequency conversion to YES
for testing receivers, mixers, or other frequency
includes IF start- and stop-frequency parameters.
The frequency span of the RF and IF values must
Table 3this section.
3-7
-
I-
-I
Menu Key Descriptions
Menu Key Descriptions
DEFAULT CONFIG
3-8
Select this key in the main menu to restore default
configuration parameters. These parameters are
listed in ‘Ihble 3-l on the following page:
-I
IMenu Key Descriptions
Menu Key Descriptions
Table 3-1. Noise Figure and Gain Default Parameters
Parameter
Average Time
Bandwidth
Range
Default Setting
100.0 msec to 999.0 set
0 . 5 seclpt, a n d
Auto mode
1.0 kHz to maximum spectrum analyzer
resolution bandwidth
1.0 MHz
Conversion IF Start Frequency
Frequency range of spectrum analyzer
1 . 4 5 GHz
Conversion IF Stop Frequency
Frequency range of spectrum analyzer
950.0 MHz
Conversion RF Start Frequency
0.0 Hz to 999.0 GHz
3 . 7 0 GHz
Conversion RF Stop Frequency
0.0 Hz to 999.0 GHz
4 . 2 0 GHz
1 to 79 data points
[the Both data point is reserved for
program use)
1 5 . 0 dB
[all frequency points]
Estimated DUT Gain
- 9 9 . 9 0 dB t o +99.90 dB
1 0 . 0 dB
Estimated OUT NF
0 . 0 0 dB t o +99.90 dB
5 . 0 dB
Estimated Test System NF
0 . 0 0 dB t o +99.90 dB
1 0 . 0 dB
Estimated Noise Source ENR
- 1 1 9 . 0 dB t o 1 0 0 . 0 dB
1 5 . 0 dB
Gain Minimum Limit
{Far points set to 1)
- 9 9 . 9 0 dB t o +99.90 dB
- 9 9 . 9 0 dB
Gain Maximum Limit
For points set to Ii
- 9 9 . 9 0 dB t o +99.90 dB
9 9 . 9 0 dB
Gain Reference level
ENR Table Data
- 9 9 . 9 0 dB t o +99.90 dB
0 . 0 dB
Gain Scale
0 . 1 0 dB t o 9 9 . 9 0 dB
1 0 . 0 dB
Input Loss
- 9 9 . 9 0 dB t o +99.90 dB
0 . 0 dB
Noise Figure Minimum Limit
For points set to Ii
0 . 0 0 dB t o 9 9 . 9 0 dB
0 . 0 dB
Noise Figure Maximum Limit
fh3r points set to ii
0 . 0 0 dB t o 9 9 . 9 0 dB
9 9 . 9 0 dB
0 . 1 0 dB t o 9 9 . 9 0 dB
2 . 0 dB/div
Noise Figure Reference Level
- 9 9 . 9 0 dB t o 9 9 . 9 0 dB
0 . 0 0 dB
Noise Source Serial Number
0 to 9999
0
- 9 9 . 9 0 dB t o +99.90 dB
0 . 0 0 dB
Noise Figure Scale
output toss
1 to 401
11
0 . 0 dB t o 9 9 . 9 0 dB
2 2 . 0 dB
Start Frequency lnon conversion1
Frequency range of spectrum analyzer
10.0 MHz
Stop Frequency [non conversion1
Frequency range of spectrum analyzer
1 . 8 GHz
-273.O”C t o 999.O’C
21.0°C
Points
Preamplifier Gain
Source Case Temperature
Source loss
Time-BW Product
- 9 9 . 9 0 dB t o +99.90 dB
0 . 0 0 dB
1 t o 1 6 , 0 0 0 kHz-s, o r 1 t o 9 9 9 x B W fin
kHzl, whichever is less
5 0 0 kHz-set
3-9
I-
I-
-I
Menu Key Descriptions
Menu Key Descriptions
DELETE POINT
Select this key in the edit ENR data menu to delete
the highlighted ENR data from the table displayed.
The segment highlighted is deleted and the list of
points is automatically renumbered.
DISPLAY - CARD
Select this key from the front-panel (SAVE) key
menu when CARD is underlined in INTRNL CARD
Pressing the DISPLAY ---+ CARD key saves the
display to the memory card.
DISPOSE NF&GAIN
Select this key in the main menu to erase the
noise figure and gain DLP from spectrum analyzer
memory.
Edit Done
Select this key in the edit ENR data menu when
you have finished editing ENR data and have saved
the edited data in a table. The Edkt Done key
returns you to the previous noise figure and gain
measurement menu. The edited ENR data is then
used until it is replaced by the next edit or recall
ENR data.
Presetting the instrument or cycling its power does
not cause new ENR data to be used. If desired, use
the front panel ISAVE) key to store the table in either
a memory card or spectrum analyzer register.
Edit ENR Data
Select this key in the configuration (more 1 of 2)
menu to display the ENR (excess noise ratio) data
tables for review or editing. Up to 79 data points
can be saved in memory (the 80th register is used by
the measurement personality for the noise source
serial number).
You can edit any ENR data table saved in internal
or card memory. The ENR calibration factors for a
noise source are used in measurement calculations to
improve the accuracy of the noise figure and gain
measurements.
ENR - CARD
3-10
Select this key from the front-panel IsAvE_] key
menu when CARD is underlined in INTRNL CARD .
I-
-I
Menu Key Descriptions
Menu Key Descriptions
Pressing the ENR + CARD key saves the ENR data
to a register you choose.
ENR - INTRNL
Select this key from the front-panel (SAVE) key menu
when INTRNL is underlined in INTRNL CARD .
Pressing the ENR ---+ INTRNL key saves the ENR
data to a specified spectrum analyzer memory
register.
ESTIMATD DUT GAIN
Select this key in the help Time-BW menu to display
or change the device-under-test estimated gain
value. If loss corrections are entered, do not include
them again in estimated DUT gain values. The
loss value is automatically included as part of the
repeatability calculations. The resulting repeatability
value is displayed on the spectrum analyzer screen.
ESTIMATD DUT NF
Select this key in the help Time-BW menu to
access the device-under-test estimated noise figure
value. The value of the DUT noise figure is used in
the Help Time-BW menu repeatability calculator.
Input loss and output loss effects are included
automatically.
ESTIMATD ENR
Select this key in the Help Time-BW menu to access
the estimated ENR value. The averaged ENR value
is acceptable. The amount of (if any) noise source
input loss is subtracted automatically from the
estimated ENR factor.
EST TEST SYS NF
Select this key in the Help Time-BW menu to display
or change the estimated test system noise-figure
value. The loss present (if any) at the system input
during calibration needs to be included.
External Losses
Select this key in the configuration (more 1 of 2)
menu to enter loss compensation values associated
with the test setup. Determine these losses before
setting up for measurements. Losses are due to
components such as isolators and cables that
are required for making a measurement. The
measurement personality applies the loss corrections
to the measurement results.
3-11
-1
IMenu Key Descriptions
Menu Key Descriptions
Freq Menu
Select this key in the configuration menu to display
the frequency settings menu. The menu keys
that appear are different for conversion versus
non-conversion parameters.
GAIN MAX LIMIT
Select this key, which appears only if the number
of points = 1, in the test limits menu. Select this
key to display or change the maximum-gain limit
settings. The range of settings is from -99.90 dB to
+99.90 dB.
GAIN MIN LIMIT
Select this key, which appears only if the number
of points = 1, in the test limits menu. Select this
key to display or change the minimum-gain limit
settings.
Test limit measurement results are displayed during
single-point measurements.
GAIN REF LEVEL
Select this key in the reference level and scale menu
to display or change the gain reference level setting
for a measurement. The scale range is from 0.10
dB/div to 99.90 dB/div.
GAIN SCALE
Select this key reference level and scale menu
to display or change the gain scale setting for a
measurement. The scale range is from 0.10 dB/div
to 99.90 dB/div.
Help Time-BW
Select this key in the frequency menu to display the
repeatability calculator. The calculator can help
you determine values to control the measurement
repeatability factor.
IF START FREQ
Select this key in the frequency menu when
conversion is set to YES. Enter the IF start
frequency for frequency conversion measurements.
The frequency range corresponds with the upper
frequency limit of the spectrum analyzer in use.
IF STOP FREQ
Select this key in the frequency menu when
conversion is set to YES. Enter the IF stop frequency
for frequency conversion measurements. The
frequency range corresponds with the upper
frequency limit of the spectrum analyzer in use.
3-12
I-
-I
Menu Key Descriptions
Menu Key Descriptions
INPUT LOSS
Select this key in the external losses menu to
enter the dB loss value located at the input of the
device under test. The loss is entered and due to
components required in the test setup for making
measurements, but the components were not
included in test-setup calibration.
INTRNL CARD
Select this key from the front-panel (SAVE) or
[@?X@ key menus. Pressing the INTRNL CARD
key underlines and designates either internal or card
as the memory location.
INTRNL - ENR
Select this key from the front-panel f,mJ
key menu when INTRNL is underlined in
INTRNL CARD. Pressing the INTRNL + ENR key
catalogs the internal memory ENR data registers.
Use the arrow keys or the RPG to highlight the ENR
data of interest. Use the LOAD FILE key to recall
the register contents. This ENR data is used for all
measurements, until new ENR data is recalled,
edited, or saved.
INTRNL - STATE
Select this key from the front-panel [RECALL)
key menu when INTRNL is underlined in
INTRNL CARD. Pressing the INTRNL - STATE
key catalogs the internal memory state registers.
Use the arrow keys or the RPG to highlight the
instrument state of interest. Use the LOAD FILE
key to recall the register contents.
Markers
Select this key in the measurements menu to
select the marker menu. A new key labeled
MARKERS OFF appears after the Markers key is
selected. Markers are not activated by pressing
Markers , but by pressing any marker-function key
in the marker menu.
MARKER DELTA
Select this key in the marker menu to get a delta
readout between points along both the noise figure
and gain traces. The separate readouts appear in the
upper left-hand corner of the display.
3-13
-I
IMenu Key Descriptions
Menu Key Descriptions
MARKER FREQ
Select this key in the marker menu to position the
marker at a specific frequency. Use the front-panel
data keys to enter specific frequency values. Avoid
using the RPG as its response time is very slow in
this mode. Press the MARKER NORMAL key to use
the RPG and get a frequency readout.
MARKER NORMAL
Select this key in the marker menu use normal
marker operation. The marker readout appears in
the upper left-hand corner of the display. Use the
RPG to locate the markers on the trace.
MARKERS OFF
Select this key to turn off the markers on the noise
figure and gain traces. This key only appears after
markers are activated with the Markers key.
Main Menu
Select this key from the configuration or
measurements menu to display the top-level
menu of the noise figure and gain measurements
personality. The main menu keys are listed below:
l
l
l
CAL
Measure
Config
. DEFAULT CONFIG
. SELF TEST
’ DISPOSE NF&GAIN
Measure
3-14
-1
Select this key from the main menu, after
completing measurement configuration, to measure
the noise figure and gain characteristics of a device.
Menus that follow allow you to use the marker
function to evaluate measurement results. You
can also enter a label and store the measurement
results in either spectrum analyzer or memory card
registers. If measurements are not preceded with a
complete calibration, the warning, Calibration
needed is displayed. You can either press Measure
again to make un-calibrated measurements, or press
CAL again and complete the calibration.
-I
IMenu Key Descriptions
Menu Key Descriptions
NOTE
Gain results are not available during un-calibrated measurements.
More 1 of 2
Select this key in the configuration menu to display
more configuration choices. The More 1 of 2 key
displays the following menu:
l
Time-W Menu
’ External Losses
. PREAMP GAIN
’ SOURCE TEMP
l
Edit ENR Data
l
More 2 of 2
More 2 of 2
Select this key in the more 1 of 2 configuration
menu to return to the previous configuration menu
level.
NFREFLEVEL
Select this key in the reference level and scale menu
to display or change the noise Egure reference level
setting for a measurement. The scale range is from
0.10 dB/div to 99.90 dB/div.
NF SCALE
Select this key reference level and scale menu to
display or change the noise Egure scale setting for a
measurement. The scale range is from 0.10 dB/div
to 99.90 dB/div.
OUTPUT LOSS
Select this key in the external losses menu to enter
loss compensation factors that exist due to devices
connected between the output connector of the
device under test and the system preamplifier and
present during the measurement. These devices
include cables and isolators that are attached during
the measurement, but not during calibration.
3-15
-1
-I
IMenu Key Descriptions
Menu Key Descriptions
POINTS
Select this key from the edit ENR data menu to
enter the number of frequency points to measure.
The values from the points measured are used in
noise Egure and gain calculations. You can measure
from 1 to 401 points, only certain numbers of points
are allowed. The personality sets points to the
nearest actual number as listed below:
IIlumber Entered Actual Number Points Measurec
1
1 point
2
2 points
3
3 points
4 to 5
5 points
6 points
6 to 7
6 to 9
9 points
IO to 1 3
1 1 points
14 to 1 8
1 7 points
19 to 23
2 1 points
24 to 34
26 points
34 to 45
41 points
46 to 65
5 1 points
81 points
66 to 90
91 to 150
1 0 1 points
1 5 1 t o 300
201 points
301 to 401
401 points
PREAMP GAIN
Select this key in the help time-BW menu to enter
the system preampliEer gain value when other than
an HP 87405A preampliEer is used. The range for
preamplifier gain is 0.0 dB to 99.90 dB. The default
setting is 22.00 dB.
Previous Menu
Select this key to return to a previously displayed
menu.
3-16
-I
IMenu Key Descriptions
Menu Key Descriptions
Select this front-panel key to recall ENR data, a
display, an instrument state, or measurement trace
from either the memory card or spectrum analyzer
memory.
Ref Lvl & Scale
Select this key in the configuration menu or
measurements menu to display the reference level
scale menu. Changes to the reference level and
scale values during measurements does not require a
re-calibration.
Resume Measure
Select this key in the markers menu to continue a
measurement after you have used the marker keys
or used the RPG title mode.
RF START FREQ
Select this key in the frequency menu when
conversion is set to YES. Display or change the RF
start frequency value for a measurement. The range
of RF frequencies is from 0.0 kHz to 999 GHz.
RFSTOPFREQ
Select this key in the frequency menu when
conversion is set to YES. Display or change the RF
stop frequency value for a measurement. The range
of RF frequencies is from 0.0 kHz to 999 GHz.
RPG Title
Select this key in the measurements menu to
display the alpha-numeric title window. Press the
front-panel INEXT) key after you have entered the
title, then press Resume Measure to return to the
measurement menu.
(SAVE_)
Select this front-panel key to save a measurement
a measurement result, a display, or an ENR
table in memory. Either a memory card (if one is
installed) or the spectrum analyzer memory registers
may be used for ENR and state data.
state,
SELECT AMPLITUD
Select this key in the edit ENR data menu to modify
an amplitude value.
SELECTFREQ
Select this key in the edit ENR data menu to modify
a frequency value.
SELECT POINT
Select this key in the edit ENR data menu to choose
a data point in the table displayed.
3-17
-I
IMenu Key Descriptions
Menu Key Descriptions
SELF TEST
Select this key to start the DLP self test procedure.
The function checks that the noise card hardware is
working properly.
SERIAL NUMBER
Select this key in the edit ENR data menu to enter
the four digits of the noise source’s serial number if
desired. The serial number is not used as the label
in the memory registers, however it appears on the
spectrum analyzer display during measurements
when the ENR data is active.
SWEEP SNGL CONT
Select this key in the measurements menu to
set the spectrum analyzer to single-sweep or
continuous-sweep mode. The single sweep function
begins after the existing measurement sweep is
completed.
SOURCE LOSS
Select this key in the losses menu to enter the loss
compensation factors that exist due to the noise
source.
SOURCE TEMP
Select this key in the configuration (more 1 of 2)
menu to enter the noise-source case temperature.
The range of this parameter is -273.O”C to 999.9”C.
The preset temperature value is 21°C.
Environmental Temperature Testing
If you are testing devices in extreme temperatures conditions, the value you enter serves as a
correction to measurement results.
START FREQ
3-18
Select this key in the frequency menu to enter
the start frequency setting of a non-frequency
conversion measurement. The range of frequencies
is from 100 kHz to the upper frequency limit of the
spectrum analyzer.
I-
-I
Menu Key Descriptions
Menu Key Descriptions
STATE - CARD
Select this key from the front-panel (SAVE_) key
menu when CARD is underlined in INTRNL CARD
Pressing the STATE --+ CARD key saves the
instrument state on the memory card.
STATE - INTRNL
Select this key from the front-panel ISAVE_I key menu
when INTRNL is underlined in INTRNL CARD
Pressing the STATE - INTRNL key saves the
instrument state in the internal memory register
that you select.
STOP FREQ
Select this key to enter the stop frequency setting
of a non-frequency conversion measurement. The
range of frequencies is from 100 kHz to the upper
frequency limit of the spectrum analyzer.
Test Limit
Select this key (which only appears when the
number of points = 1) in the configuration
menu to set minimum and maximum limits for a
measurement. The test limit keys are described in
this section. The key are listed below:
l
GAIN MAX LIMIT
. GAIN MIN LIMIT
. NF MAX LIMIT
’ NF MIN LIMIT
Measurements that are made while limits are set,
provide results specific to the single frequency point
selected. The display indicates whether both the
noise figure and gain results pass or fail.
Time-BW Menu
Select this key in the frequency menu to enter
time and bandwidth values. Select a measurement
bandwidth with the BANDWDTR key that is
appropriate for the measurement. The product
of the time value multiplied by the measurement
bandwidth, can be controlled to effect jitter
(measurement repeatability).
3-19
-I
IMenu Key Descriptions
Menu Key Descriptions
If measurement to measurement repeatability is
important, use a longer average time (with the
AVG TIME key) for measurements. You can also
accelerate measurement time by increasing the
measurement bandwidth when AVG TIME AUTO is
selected.
TIME-BW PRODUCT
Select this key in the conEguration or the help
time-BW menus to adjust the time-bandwidth
product. This product is the average time multiplied
by the measurement bandwidth in kilohertz-seconds.
Changing the time-BW product while averaging time
is set to AUTO mode causes the measurement time
to change, but not the measurement bandwidth.
TR & ST-CARD
Select this key from the front-panel (SAVE_) key
menu when CARD is underlined in INTRNL CARD
Pressing the TR & ST-CARD key saves the
instrument trace and state on the memory card.
3-20
-I
4
Specifications,
Characteristics, and
Verification
-
I-
-I
Specifications, Characteristics, and Verification
This chapter contains %ble 4-l measurement specifications and
characteristics as well as procedures to verify the specifications.
The chapter is organized as follows:
l
The table of specifications and characteristics
l
The performance verification test
4-2
-I
I-
Specifications and Characteristics
All specifications apply over 0-55°C. The Noise Figure and Gain measurement
personality specifications are valid after 2 hours of storage at a constant
temperature, within the operating temperature range, 30 minutes after the
spectrum analyzer is turned on, and after CAL FREQ and CAL AMPTD have
been run.
These specifications apply when an HP 87405A Preamplifier and a noise source ENR of 14 d0 to 16
dB is used with the measurement setup. If other hardware is used, the specifications are not valid.
4-3
I-
-I
Specifications, Characteristics, and Verification
Specifications and Characteristics
Table 4-l. Specifications
Specification
Performance limits
Conditions
Noise Figure Measurement
0 to 25 dB
Range
Resolution
“Instrumentation
0 . 0 1 dB
Uncertainty
HI.55 dB
HI.5 dB
*Instrumentation Uncertainty /typical/
1ttl.3 dB
For noise figure <I5 dB
Measurement Bandwidth = 3 kHz
Measurement Bandwidth = 1 MHz
For noise figure 120 dB
Measurement Bandwidth = 3 kHz to 1 MHz
Gain Measurement
0 t o +40 dB
Range
0 . 0 1 dB
Resolution
“Instrumentation
f0.65 dB
f0.5 dB
For noise figure 515 dB
Measurement Bandwidth = 3 kHz
Measurement Bandwidth = 1 MHz
ho.3 dB
Measurement Bandwidth = 3 kHz to 1 MHz
1 0 M H z to 2 . 9 GHz
When used with HP 8594E Spectrum Analyzer
Uncertainty
“Instrumentation Uncertainty /typical/
Input
Frequency Range
System Noise Figure
Input SWR
Maximum Svstam lnout P o w e r
< 1 2 dB
< 2:l
- 4 5 dBm
At HP 87405A Preamplifier input
Measurement
Measurement Bandwidth
13 dB Resolution Bandwidths]
1 . 0 kHz t o 3 M H z
F o r INF + g a i n ] 135 dB
Spectrum analyzer residual responses 510 x Log fmaasuramant bandwidth in Hz1 -160 dBm
l
4-4
-I
System Performance Verification
The procedure in this section verifies the log scale fidelity of the spectrum
analyzer using a noise signal as the source. The specifications are derived
from the known performance of the spectrum analyzer hardware.
The HP 85719A measurements personality is not installed during the service
DLP, verification procedure. The service DLP lile available on the HP 85719A
noise figure measurements personality card must be installed before the
following verification procedure can be performed.
Service Test Function Keys Descriptions
There are five softkeys associated with the service DLP. After completing
the service DLP and installing the HP 85719A measurements personality,
an additional service-related key labeled SELF TEST is available. The
SELF TEST key is in the main menu of the HP 85719A noise figure
measurements personality.
The five service DLP keys, and the SELF TEST key descriptions follow:
28V ON OFF
Press this key to turn the spectrum analyzer’s
rear-panel +28 Vdc supply on or off. When ON
is underlined, the +28 Vdc is activated to supply
current to the noise source.
SETUP
Press this key and the program presets the spectrum
analyzer, then sets the parameters required for
performing the verification test. You enter the
resolution bandwidth, the program applies noise
corrections to the normal log fidelity corrections, and
the + 28 Vdc is activated. Pressing [PRESET] disables
the noise corrections.
SYSNOISE
Press this key during the verification procedure to
record the spectrum analyzer noise floor before
4-5
I-
-I
Specifications, Characteristics, and Verification
System Performance Verification
making measurements. This data is used in
subsequent calculations.
DEVIATN
Press this key to calculate the noise figure and
gain accuracy. The verification test determines
the largest deviation in adjacent 3 dB steps. The
deviation data is entered into the spectrum analyzer,
and the resultant calculation is displayed.
SELF TEST
Select this key if the HP 85719A noise figure
measurements personality is installed, to initiate an
additional self-test procedure. The function checks
the current from the rear-panel +28 Vdc supply
and checks that the noise card hardware is working
properly.
MEASURE
Press this key during the verification test and the
spectrum analyzer sweeps, then displays the results
of the measurement in dB RL.
Verification Test Description
Performance verification of the spectrum analyzer hardware is achieved by
measuring the accuracy of changes in noise power over an input range of
-7 dB RL to -60 dB RL in 3 dB steps.
Ultimately, the test Ends the largest deviation between adjacent 3 dB steps.
This data is used to calculate the noise accuracy and gain.
The test begins with a large noise signal applied to the spectrum analyzer
input. The noise level is reduced 3 dB and the difference in the trace level is
measured.
This measurement is achieved with the service DLP included on the HP
85719A noise measurements personality ROM card. System noise errors are
measured and incorporated into the final calculations.
4-6
-I
ISpecifications, Characteristics, and Verification
System Performance Verification
Related Spectrum Analyzer
Adjustments
Equipment required for the
measurement
Log Scale Fidelity
Cal Attenuator
The performance verification test equipment is listed below:
HP 859XE Series Spectrum Analyzer HP 8591E/93E/94E/95E/96E
HP 85719A noise card . . . . . . . . . . . . . . . . . . . . . . . . . . . . . . Option 119
Power Meter (must have averaging) . . . . . . . . HP 437A or HP 438B
Preamplifier (two required) . . . . . . . . . . . . . . . HP 8447A, Option 011
Low Power Sensor . . . . . . . . . . . . . . . . . . . . . . . . . . . . . . . . . . HP 8481D
321.4 MHz Bandpass Filter . . . . . . . . . . . . . . . . . . . . . . . . . . 9135-0252
Power Splitter . . . . . . . . . . . . . . . . . . . . . . . . . . . . . . . . . . . . . HP 11967A
Coaxial, 1 dB Step Attenuator . . . . . . . . . . . . HP 8494A, Option 001
Coaxial, 10 dB Step Attenuator . . . . . . . . . . . HP 8595A, Option 001
Fixed, 20 dB Attenuator . . . . . . . . . . . . . . . . . . HP 8591A, Option 020
Type-N Interconnect Kit . . . . . . . . . . . . . . . . . . . . . . . . . . . . HP 11716A
Cables
5061
BNC Cable . . . . . . . . 8120-2682
Type N Cable, 61 cm (24 inches) (five required) . . HP 11500B
Adapters
SMA (m) to Type N (f) . . . . . . . . . . . . . . . . . . . . . . . . . . . . . .
Type N (m) to SMA (m) . . . . . . . . . . . . . . . . . . . . . . . . . . . . .
Type N (m) to Type N (m) . . . . . . . . . . . . . . . . . . . . . . . . . . .
Type N (m) to BNC (f) . . . . . . . . . . . . . . . . . . . . . . . . . . . . . .
1250-1562
1250-1250
1250-0778
1250-0780
Calibrate the System
Connect the equipment as shown in Figure 4-l. Allow each piece of
equipment to warm up according to its manufacturer’s documentation.
4-7
I-
-I
Specifications, Characteristics, and Verification
System Performance Verification
SPECTRUM
ANALYZER
pa7120
Figure 4-l. CAL FREQ and CAL AMPTD Setup
1. Calibrate the spectrum analyzer.
l
l
l
l
Press the front-panel [PRESET_) key, wait for the preset to complete.
Press ICAL), then CAL FREQ t AMPTD
Wait for the completion of the spectrum analyzer’s self-calibration
routine (approximately 5 to 10 minutes).
Press [CAL] to save the calibration data.
2. Calibrate the measurement system power meter and power sensor.
l
l
CAUTION
Connect the power sensor to the sensor input connector on the power
meter.
Zero and calibrate the HP 437A power meter and the HP 8481D power
sensor as described in the HP 437A operation manual.
Do not calibrate the HP 8481D without the reference attenuator. The
reference attenuator prevents damage to the HP 8481D low power sensor.
4-8
-I
Specifications, Characteristics, and Verification
System Performance Verification
Load the Service DLP
Delete any previously installed DLPs from user memory.
1. Press the following front-panel keys to purge user memory, then install the
service DLP:
l
(CONFIG) and More 1 of 3
l
DISPOSE USER MEM , and again DISPOSE USER MEM
l
cm), INTERNAL CARD , select CARD.
l
Catalog Card.
. CATALDG A L L
2. Select the file labeled dNFSRVC.
l
l
l
Press LOAD FILE and wait for the lile to load.
Press fjMEAS/USER), and again MEAS~USER . The service DLP softkeys
should appear on the display.
Press +28V ON OFF , and select ON.
Measure the Noise Level at 1 MHz RBW
Connect the equipment as shown in Figure 4-2.
Notice that the 20 dB attenuator is connected temporarily between the power
splitter and the power sensor. The power sensor is later connected directly to
the power splitter.
4-9
I-
-I
ISpecifications, Characteristics, and Verification
System Performance Verification
PREAMPLIFIER
PREAMPLIFIER
NOISE SOURCE
28 VOLTS
SWITCHED 1
hi
ATTENUATOR 1
SPECTRUM
ANALYZER
‘OR
pa7110
Figure 4.2. Noise Figure and Gain Accuracy Test Setup
Check the power level output of the noise source in the test setup.
1. Set both attenuators to 0 dB attenuation. Check that the power level
reading on the power meter is -26 dBm -+lO dB. This power level
ensures that the power output from the last amplifier is 0 dBm f10 dB.
2. Adjust the step attenuators for a -25 dBm kl dB reading on the power
meter. Record the attenuator settings in Columns 1 and 2 of Figure 4-3.
4-10
-I
ISpecifications, Characteristics, and Verification
System Performance Verification
3. Press SETUP Wait for the completion of the setup routine. Enter 1 MHz
when prompted for the bandwidth.
Check the system noise level.
4. Set the HP 8495A attenuator to 120 dB, press SYSNOISE , then read the
system noise level.
NOTE
The
SYSNOISE readout should be c-57 dB RL to achieve optimum results.
5. Return the HP 8495A attenuator to the values determined in step 2.
Measure the change in noise level between attenuator settings.
6. Press MEASURE , then record the value displayed on the spectrum
analyzer screen in Figure 4-3, column 3, as the Noise Level Readout in
dB RL.
7. On the power meter, press IREL). The power meter readout should be
0 dB.
You may need to press (REL) two times to ensure a 0 dB readout.
NOTE
If the reading on the power meter is unstable, you may need to use power-meter averaging. Press
(MNL), and enter a value [such as 51 to enable power-meter averaging.
8. Increment the step attenuators 3 dB and record the attenuator settings in
Figure 4-3, columns 1 and 2.
4-11
I-
-I
Specifications, Characteristics, and Verification
System Performance Verification
9. Record the absolute value of the power meter reading to 2 decimal places
as the Power Meter Readout in Figure 4-3, Column 5.
10. Repeat steps 6 through 9 until the total attenuator setting equals 30 dB.
11. Remove the 20 dB fixed attenuator from the power sensor and connect
the power sensor directly to the power splitter.
12. Press (REL) to establish a new power meter reference, then continue
making measurements as before.
Stop making measurements just before the Noise Level Readout on the
spectrum analyzer measures less than -60 dB RL.
As an example:
I f t h e NoiseLevel R e a d o u t i s - 5 8 . 2 dB R L , s t o p t e s t i n g
b e c a u s e t h e n e x t NoiseLevelReadoutwouldbe <-60dB R L .
Enter the measured results into the Figure 4-3 as explained in the steps and
illustrated in the example table below:
1. Begin with the value of the first measurement in Column 3, “Noise Level
Readout. ”
2. Subtract the first measurement value from the second measurement value
recorded in Column 3.
3. Enter the resulting difference into column 4, “Change in Noise Level.”
4. Subtract the second reading recorded in Column 3, “Noise Level Readout”
from the third reading. Again, record the resulting difference in Column 4.
5. Continue finding adjacent-measurement differences and recording the
results in column 4. As an example:
I f t h e f i r s t “ N o i s e L e v e l ” m e a s u r e m e n t = - 7 . 2 0 dB RL,
and the second “Noise Level” measurement = -10.28 dB RL
the resulting “Change in Noise Level” = 3.08 dB
4-12
I-
I-
-I
Specifications, Characteristics, and Verification
System Performance Verification
Example of the Noise Level Worksheet for RBW 1 MHz
Column 2
Column 3
Column 4
Column 5
Column 6
1 dB
Noise
power
Attenuator
Settings
level
Readout
Change
in Noise
level
Meter
Readout
Deviation
between
Adjacent
Steps
(dB1
(dB RL)
(dB)
MB)
(dB)
- REF _
_
- N/A -
Find the deviation between adjacent steps.
1. Subtract the absolute value recorded in “Power Meter Readout,” Column
5, from the absolute value recorded in “Change in Noise Level,” Column 4.
2. Record the absolute value of the.results in Column 6 as the “Deviation
Between Adjacent Steps. ))
3. Find the value of the largest change in Column 6 of “Deviation Between
Adjacent Steps” and record as the LARGEST DEVIATION below:
LARGEST DEVIATION
dB
4. Press DEVIBTN . Use the front-panel DATA keys and enter the LARGEST
DEVIATION value, then press ENTER.
The display readout should be within the following limits:
>-0.5
NF ERROR
GAIN ERROR >-0.5
< 0.5 dB, f0.08 dB uncertainty
~0.5 dB, ho.08 dB uncertainty
4-13
I-
-I
ISpecifications, Characteristics, and Verification
System Performance Verification
able 5-1. Noise Level Worksheet. RBW 1 MHz
Column 1 1 Column 2 1 Column 3
10 dB Atten 1 1 dB Atten 1 Noise Level
I
I
I
I
-I
I
I
Figure 4-3. Noise level Worksheet, RBW 1 MHz
4-14
I
I-
-I
Specifications, Characteristics, and Verification
System Performance Verification
Measure the Noise Level at 3 kHz RBW
Connect the equipment as previously shown in Figure 4-2.
Notice that the 20 dB attenuator is connected temporarily between the power
splitter and the power sensor. The power sensor is later connected directly to
the power splitter.
1. Adjust the step attenuators for a -25 dBm &l dB reading on the power
meter. Record the attenuator settings in Columns 1 and 2 of Figure 4-4.
2. Press SETUP’ Wait for the completion of the setup routine.
3. Enter 3 kHz when prompted for the bandwidth.
Check the system noise level.
4. Set the HP 8495A attenuator to 120 dB, press SYSNOISE , then read the
system noise level.
NOTE
The
SYSNOISE readout should be c-57 dB RL to achieve optimum results
5. Return the HP 8495A attenuator to the values determined in step 2.
Measure the change in noise level between attenuator settings.
6. Press ME&SURE , then record the value displayed on the spectrum
analyzer screen in Figure 4-3, column 3, as the Noise Level Readout in
dB RL.
7. On the power meter, press IREL). The power meter readout should be
0 dB.
You may need to press IREL) two times to ensure a 0 dB readout.
4-15
I-
-I
Specifications, Characteristics, and Verification
System Performance Verification
NOTE
If the reading on the power meter is unstable, you may need to use power-meter averaging. Press
(j7KKiK], and enter a value (such as 51 to enable power-meter averaging.
8. Increment the step attenuators 3 dB and record the attenuator settings in
Figure 4-3, columns 1 and 2.
9. Record the absolute value of the power meter reading to 2 decimal places
as the Power Meter Readout in Figure 4-3, Column 5.
10. Repeat steps 6 through 9 until the total attenuator setting equals 30 dB.
11. Remove the 20 dB fixed attenuator from the power sensor and connect
the power sensor directly to the power splitter.
12. Press (REL) to establish a new power meter reference, then continue
making measurements as before.
Stop making measurements just before the Noise Level Readout on the
spectrum analyzer measures less than -60 dB RL.
Enter the measured results into the Figure 4-4. Refer to the following steps:
1. Begin with the value of the first measurement in Column 3, “Noise Level
Readout. ”
2. Subtract the first measurement value from the second measurement value
recorded in Column 3.
3. Enter the resulting difference into column 4, “Change in Noise Level.”
4. Subtract the second reading recorded in Column 3, “Noise Level Readout”
from the third reading. Again, record the resulting difference in Column 4.
5. Continue finding adjacent-measurement differences and recording the
results in column 4.
Find the deviation between adjacent steps.
1. Subtract the absolute value recorded in “Power Meter Readout, )) Column
5, from the absolute value recorded in “Change in Noise Level,” Column 4.
4-16
I-
-I
Specifications, Characteristics, and Verification
System Performance Verification
2. Record the absolute value of the results in Column 6 as the “Deviation
Between Adjacent Steps. ”
3. Find the value of the largest change in Column 6 as the “Deviation
between Adjacent Steps” and record the LARGEST DEVIATION below:
LARGEST DEVIATION
dB
4. Press DEVIATN Use the front-panel DATA keys and enter the value
recorded above, then press ENTER.
The display readout should be within the following limits:
NF ERROR
>-0.55
GAIN ERROR >-0.65
Purge the service OLP
from memory
~0.55 dB, ho.08 dB uncertainty
co.65 dB, *0.08 dB uncertainty
At the completion of the verification procedure, remove the DLP from user
memory.
1. Press [PRESET- to purge the noise-correction values from memory.
2. Press @%K], then More 1 of 3 .
3. Press DISPOSE USER ME!! , and again DISPOSE USER MEM to remove the
service DLP from user memory.
4-17
I-
-I
Specifications, Characteristics, and Verification
System Performance Verification
‘lhble 5-2. Noise Level Worksheet, RBW 3 MHz
Column 1
10 dB Atten
Settings
WB)
Column 2
1 dB Atten
Settings
(W
Column 3
Noise Level
Readout
ww
Column 4
Change in
Noise Level
PI
Column 5
Power Meter
Beadout
W9
Column 6
Deviation in
Adj Steps
WI
-REF-
-N/A-
Figure 4-4. Noise level Worksheet, RBW 3 kHz
4-18
-I
If Verification Fails
If the verification test does not pass, refer to the following tips:
l
Be sure that the spectrum analyzer self-calibration routines were completed
just prior to running the verification test.
l
Leave the amplifiers on overnight and just before beginning service testing,
if possible. A small change in temperature can cause a large change in
noise amplitude.
l
Be sure the spectrum analyzer has been powered on for 2 hours at a stable,
ambient temperature before beginning service testing.
l
Try to complete the verification test in one sitting.
l
Make precise measurements the Erst time since the test is tedious and
difficult.
l
Use cables that have threaded connectors. BNC cables and connectors lack
noise immunity and can introduce random noise unrelated to the device
under test.
4-19
-1
-I
I-
5
If You Have a Problem . . .
I-
-I
If You Have a Problem . . .
This chapter contains a table of several messages that you may encounter
as you use the measurement personality. Depending on your measurement
complexity, additional messages may occur that are not listed here. If
necessary, contact any sales and service representative listed in Chapter 1,
Table l-l, HP Sales and Service Offices.
Information about packaging and general problem with suggested solutions
are also included.
5-2
I-
-I
Measurement Personality Messages
The messages in Table 5-l provide information to you and typically appear
during measurement personality operation.
Table 5-l. Measurement Personality Information Messages
Message Displayed
(alpha order)
Description
Calibrating
The calibration routine is beginning. The massage identifies the beginning.
Calibration done.
Ready to measure
DUT.
This massage appears when system calibration is finished. Connect the device
to be tasted and begin making measurements.
This massage warns you that if certain measurement parameters are modified,
Calibration not
the correction data no longer applies. You can continua measuring noise figure
valid. System NF
correction will not however no gain measurement is made.
be applied.
Following a new spectrum analyzer calibration, the measurement personality
Computing new LOG
corrections. Please calculates new correction values. This massage identifies that there is a time
lapse.
wait
Connect noise
source. Press
key again to
the
begin
Connect the noise source output to the INPUT 5OQ connector on the system
preamplifier and calibrate the system.
calibration.
Pressing the DISPOSE key in a down-loadabla program erases the DLP
3LP will be
disposed! Press the from memory.
key again if you
are sure.
5-3
-I
IIf You Have a Problem
Measurement Personality Messages
Table 5-l. Measurement Personality Information Messages (continued)
Description
Message Displayed
(alpha order)
ENR data recalled
You have recalled ENA data from memory.
ENR data saved
You have saved ENR data in memory.
ENR data selected
You have chosen ENR data.
Excessive gain or
signal present
The measurement personality has encountered a signal that is above the
expected measurement range. If the DUT gain is in excess of the specifications
in Table 4-1, attenuate its output and enter the output loss correction. If a
spurious signal is present, eliminate the signal or change the frequency range o
points to “miss” the signal. If your measurement is at low frequencies, chose r
narrow enough measurement bandwidth to avoid the 0 Hz spectrum analyzer
LO feedthrough signal.
You can also press the front-panel Cm) key, switch to spectrum analyzer
mode, and evaluate the information in the signal you are measuring. Press
Cm] again to return to the noise figure measurement menu you were
using.
Inadequate system
zain. Check
connections and/or
preamp gain for
error.
The probe power connector on the preamplifier needs connected into the
PROBE PWR input on the front panel on the spectrum analyzer or the
preamplifier gain value is entered incorrectly.
INVALID CARD: TYPE
Make sure the memory card is installed correctly and is the right one.
Invalid
frequencies! RF
start-stop span
nust equal IF
Start-stop span.
The RF stop and start frequency span is different from the IF start and stop
span. These must be the same.
5-4
I-
-I
If You Have a Problem
Measurement Personality Messages
Table 5-l. Measurement Personality Information Messages (continued)
Description
Message Displayed
(alpha order)
Loading LOG
corrections.
Loading the log corrections routine takes a moment. This message identifies
that time lapse.
Newer firmware
required: REV26.08.92
or later.
The firmware in the spectrum analyzer does not support the noise figure end
gain measurements DLP
Noise card failed
The noise-source drive option card has exhibited trouble.
Noise card not
installed
Make sure the noise-source drive option card is properly installed.
Noise card passed
The noise-source drive option card is functioning properly.
Noise signal not
found
The noise source signal is not present during the self-test routine.
SAVE LOCK ON!!
The internal memory [SAVE LOCK] is locked.
SAVE: REG
You have saved to memory.
Setting
configuration
default
The default settings for the measurement personality are being recalled for use
to
-I
IIf You Have a Problem
Measurement Personality Messages
Table 5-l. Measurement Personality Information Messages (continued)
Message Displayed
(aloha order)
Description
Single frequency
mode. Test limits
may be entered.
tihen points=l, you can enter test limits for the measurement. Refer to the
nenu key descriptions for more information.
State
you have recalled a state from memory.
recalled
State saved
you have saved the instrument state.
Testing noise card
The noise-source drive option card operation is getting tested.
Traces % state
recalled
you have recalled a state end traces from memory.
Traces % state
saved
t’ou have saved traces and the associated state
Warning!
Recalibration
needed if
measurement
parameters are
changed.
Nhen you went to measure calibrated noise figure end gain, any configuration
xxameters changes made prior to or during a measurement, requires that you
xpeat the noise figure end gain calibration routine. However, you can measurt
loise figure without recalibrating, but not gain.
5-6
-I
I-
Returning the Instrument for Service
In the event that you need to return your spectrum analyzer to the factory
for service on the noise figure and gain measurement personality, refer to the
steps below:
l
Record any error messages that were displayed and enclose a copy of this
information with the instrument being returned.
l
Fill in a blue service-repair card located at the end of this chapter. Enclose
the card with the instrument being returned.
l
Repackage the HP 85719A measurements personality memory card and
spectrum analyzer in the original packaging materials, or with commercially
available materials described in the following steps:
1. Wrap the instrument in anti-static plastic to reduce the potential of
electrostatic discharge damage.
2. Use the original materials or a strong shipping container that is
double-walled, corrugated cardboard carton with 159 kg (350 lb)
bursting strength. The carton must be both large enough and strong
enough to accommodate the instrument and allows at least three to four
inches on all sides for packaging materials.
3. Surround the instrument with at least three to four inches of packaging
material, or enough to prevent the instrument from shifting within the
carton.
If packaging foam is unavailable, the best alternative is SD-240 Air
CapTM from Sealed Air Corporation in Commerce, CA 90001. The
pink-colored Air Cap does not contribute to static charge.
Wrap the instrument several times in this material to both protect the
instrument and prevent shifting within the carton.
l
Seal the shipping container with strong nylon adhesive tape.
l
Mark the shipping container “FRAGILE, HANDLE WITH CARE” to
encourage careful handling.
l
Retain copies of all shipping papers.
l
Ship the instrument to one of the HP sales and service offices listed at the
end of Chapter 1, “Getting Started. ))
5-7
6
Programming
I-
-I
Programming
This chapter is a reference for the HP 85719A Noise Figure and
Measurements Personality. It is a command dictionary; commands are
organized alphabetically.
The chapter contains the following information:
l
Reference ‘lkbles
0 Syntax Conventions
l
Command Reference
6-2
-I
I-
Reference Tables
The first reference table is organized according to function. The second table
lists all measurement personality commands alphabetically.
Functional Index %ble
The functional table groups the commands according to measurement
personality function.
To find a programming command that performs a particular function, first
refer to the following table where commands are categorized by function.
Once the desired command is found in the functional index, refer to the
command in the chapter.
6-3
I-
-I
Programming
Reference Tables
Table 6.1. Functional Index
Function Group
Calibration
Zonfiguration
Other than frequency end
ime-bandwidth control]
Command
Ranges or Description
-CAL
Initiate the noise figure and gain measurement setup calibration routine
-DEFAULTS
Sets all measurement parameters to default values. Refer to Chapter 3
Table 3-1, Noise Figure and Gain Default Parameters, in this guide.
-ENR
:requency [non-conversion]
Irequery Conversion
6-4
Enter or recall ENR data.
.XONN
Allows the control of external equipment via the auxiliary interface
connector during the noise figure mode or noise figure calibration.
-FCONV
1 (conversion on]; 0 [conversion off1
Select or query the frequency conversion mode.
-ms
1 to 401 Points.
Enter or query the number of frequency points measured.
-TEMPC
o.o”c t o looo”c
Enter or query the noise source case temperature in ‘C.
JSTART
Frequency range of spectrum analyzer
Enter or query the measurement start frequency value. All frequency
values are converted to Hz.
-FSTGP [non-conversion)
Frequency range of spectrum analyzer
Enter or query the measurement start frequency value. All frequency
values are converted to Hz.
-IFSTART
0 t o 2 6 . 5 GHz
Enter or query the measurement IF start frequency.
-IFSTGP
Frequency range of spectrum analyzer
Enter or query the measurement IF stop frequency.
-RFSTART
0.0 Hz to 999 GHz
Enter or query the measurement RF start frequency.
-RFSTOP
0 . 0 kHz t o 9 9 9 . 0 GHz
Enter or query the measurement RF stop frequency.
-I
IProgramming
Reference Tables
Table 6.1. Functional Index (continued)
Function Group
mses
Command
-INLOSS
Enter or query the value of loss that is affixed to the input of the
device under test.
-OUTLOSS
Enter or query the value of loss affixed to the output of the device
under test.
-sLoss
tieasuring
IF Mode Control
deference Level and Scale
Enter or query the value of loss value affixed to the output of the nois
source used in the measurement.
-MEASURE
Initiate the noise figure and gain measurement.
-NFMODE
Activates noise figure mode. Initially required before sending or queryin
noise figure and gain measurement commands.
-NFMODE
Activates noise figure mode. Initially required before sending or queryin!
noise figure and gain measurement commands.
-GLVL
-GSCALE
-NFLVL
‘ime-Bandwidth
Ranges or Description
0.00 to 99.90 dB
Enter or query the reference level for the gain trace.
0 . 1 0 t o 9 9 . 9 0 dB
Enter or query the measurement scale for the gain trace.
0.00 to 99.90 dB
Enter or query the reference level for the noise figure trace.
-NFSCALE
0 . 1 0 dB t o 9 9 . 9 0 dB
Enter or query the measurement scale for the noise figure trace in
dB/div.
-AVGTIME
100.0 ms to 999.0 s
Enter or query the measurement averaging time value. The value affect
the measurement time per measurement point.
-BW
1 . 0 kHz t o 5 M H z
Enter or query the measurement bandwidth.
-TBW
100 to 100000
Enter or query the time-bandwidth product in kHz-seconds.
-TBWAUTO
1 lauto-mode selected]; 0 [manual-mode selected]
Select or query the time-bandwidth mode.
6-5
I-
-I
Programming
Reference Tables
Alphabetical Reference Table
The following table listing describe the commands available with the noise
figure and gain measurements personality.
Prior to using any of the following commands, be sure to send the -NFMODE
command to initiate the noise figure measurements mode.
Table 6-2. Commands in Alphabetical Order
Corresponding Key
Description
AVG TIME AUTO/MAM
Enter or query the measurement averaging time value. The value affec
the measurement time per measurement point.
The range is from 100.0 ms to 999.0 s.
Command
-AVGTIME
-BW
BANDWIDTH
-CAL
CAL
Initiate system calibration.
-CONN
none
Controls external equipment via the auxiliary interface connector during
noise figure mode or noise figure calibration.
CARD-ENR
-ENR
Enter or query the measurement bandwidth.
Enter or recall ENR data.
INTERNAL-EIiR
-DEFAULTS
DEFAULT CONFIG
Set all measurement parameters to default values.
Select or query the frequency conversion mode. A query response of 1
indicates frequency conversion is selected; 0 indicates non-conversion is
selected.
-FCONV
Conversion YES/FIO
- FSTART
START FREQ
Enter or query the measurement start frequency value. All frequency
values are converted to Hz.
-FSTOP
STOP FREQ
Enter or query the measurement start frequency value. All frequency
values are converted to Hz.
-GLVL
GAIN REF LVL
GAIN
-GSCALE
6-6
SCALE
Enter or query the reference level for the gain trace.
Enter or query the measurement scale for the gain trace in dB/div.
-I
IProgramming
Reference Tables
Table 6-2. Commands in Alphabetical Order (continued)
Corresponding Key
Description
-IFSTART
IF START FREQ
In frequency conversion mode, enter or query the measurement IF star
frequency.
-IFSTOP
IF STOP FREQ
In frequency conversion mode, enter or query the measurement IF star
frequency.
-INLOSS
INPUT LOSS
-LABEL
none
Command
-MEASURE
-NFLVL
Measure
NF REF LEVEL
Enter or query the value of loss that is affixed to the input of the
device under test.
Redraw /refresh] the display annotation, especially following transitions
between frequency conversion and non-frequency conversion modes.
Initiate the noise figure and gain measurement.
Enter or query the reference level for the noise figure trace.
-NFMODE
IF&GAIN
-NFSCALE
NF SCALE
Enter or query the measurement scale for the noise figure trace in
d B/div.
-0UTLOSS
OUTPUT LOSS
Enter or query the value of loss affixed to the output of the device
under test.
Activates noise figure mode. Initially required before sending or queryin
noise figure and gain measurement commands.
POINTS
Enter or query the number of frequency points measured. If the numb
of points is set to 1, measurement limits can be entered.
-RFSTART
RF START FREQ
In frequency conversion mode, enter or query the measurement RF stai
frequency.
-RFSTOP
RF STOP FREQ
In frequency conversion mode, enter or query the measurement RF stop
frequency.
SLOSS
SOURCE LOSS
Enter or query the value of loss value affixed to the output of the noi!
source used in the measurement.
-TBW
TIME-BW PRODUCT
-ITS
-TBWAUTO
-TEMPC
AVG TIME AUTO/MAN
SOURCE TEMP
Enter or query the time-bandwidth product in kHz-seconds.
Select or query the time-bandwidth mode.
1 indicates auto mode; 0 indicates manual mode.
Enter or query the noise source case temperature in “C.
6-7
-I
IProgramming
Reference Tables
Command Syntax Description
Command syntax is represented pictorially as shown in Figure 6-l below:
COMMAND
(Enter OS shown)
SOLlD@LlNE P A T H
(Dreferred)
SEPARATOR
( E n t e r OS s h o w n )
pa750
ARGUMENT
( E n t e r CIS s h o w n )
TERMINATOR
(Enter OS shown)
RECTANGULAR
ELEMENT
(See Table 2-2)
DOTTED-LINE PATH
( n o t recomanded)
Figure 6-1. Syntax Structure Description
Descriptions of the syntax diagram symbols (or elements) are described
below:
l
Ovals enclose command mnemonics. The command mnemonic must be
entered exuctly as shown in diagrams.
l
Circles and ovals surround secondary keywords or special numbers and
characters. The characters in circles and ovals are considered reserved
words and must be entered exxtly as shown in diagrams.
l
Rectangles surround the description of a syntax element. The element may
be parameters, or variables, related to the command. The range of choices
is listed in a table accompanying each command.
Syntax diagram elements are connected either with solid or dotted lines
Solid-line paths represent recommended command paths. Combinations of
elements generated by following the lines in the proper direction, creates
syntactically correct commands.
6-8
-I
ICommand Reference
This section contains the alphabetical reference of the commands listed in
Table 6-2. Each command description includes a syntax diagram, parameters
as appropriate, and sample programs using the HP BASIC command language.
6-9
I-
-I
Programming
-AVGTIME
Use the -AVGTIME command to enter an averaging time value.
averaging-time
Figure 6-2. -AVGTIME Syntax
I
Item
Description
0.5 seconds
s [seconds]
0 . 1 set t o 9 9 9 . 0 set
Prerequisite Command -NFMOOE
-TBWAUTO, -TBW
Description When -AVGTIME is set to automatic mode, the averaging time for
measurements is automatically determined. The speed of the measurement
affects the jitter, or repeatability, of the measurement.
In automatic mode, the time-bandwidth product is divided by the
measurement bandwidth to determine the averaging time per point.
In manual mode, just the measurement time is changed, the time-bandwidth
value is not recalculated.
6-10
-I
IProgramming
-AVGTIME
Example
Program
10 OUTPUT 718;"mNFMODE;"
15 OUTPUT 718;"mDEFAULTS;"
2 0 O U T P U T 718;"mTBW 3 0 0 ; -BW 1MHZ;"
30 OUTPUT 718;"mAVGTIME 1;"
40 OUTPUT 718;"wCAL;"
50 OUTPUT 718;"DONE?;"
60 ENTER 718;DONE
70 DISP "CALIBRATION DONE, PRESS
CONTINUE WHEN READY TO MEASURE."
75 PAUSE
80 OUTPUT 718;"-MEASURE;"
Select the noise figure and
gain measurements mode.
Set all measurement configuration parameters to
default values.
Set the time-measurement
bandwidth value to 300,
and change the measurement bandwidth to 1 MH%.
Set the averaging time to
1 second per measurement
point.
Calibrate the measurement
setup for the new parameters.
Query the spectrum arulyzer for the calibration
routine status.
Get the status condition.
Display the calibrationdone message.
Wait for the key to be pressed.
Make a calibrated noise
figure and gain measurement.
90 END
Query Response The response is displayed in seconds.
t e r m i n a t o r
+
Figure 6-3. -AVGTIME Query Response Syntax
6-11
I-
-I
Programming
-BW
The -BW command selects or queries the measurement resolution bandwidth.
measurement
bandwidth
-Bw
Figure 6-4. -BW Syntax
Item
Description
Default Value
1.0 MHz
Default Units
Hz
Range
1.0 kHz to Maximum spectrum analyzer resolution bandwidth
Prerequisite Command -NFMODE
Related Commands
-TBWAUTO, - T B W
Description The value of the -BW sets the measurement bandwidth. Changing the
measurement resolution bandwidth when -AVGTIME AUTO is selected
changes the averaging time. The new sweep time is the time-bandwidth
product divided by the measurement bandwidth.
6-12
-I
IProgramming
-BW
Example
Program
10 OUTPUT 718;"-NFMODE;"
15 OUTPUT 718;"-DEFAULTS;"
2 0 O U T P U T 718;"mTBW 3 0 0 ;
-BW 1MHZ;"
30 OUTPUT 718;"-AVGTIME 1;"
40 OUTPUT 718;"-CAL;"
50 OUTPUT 718;"DONE?;"
60 ENTER 718;DONE
70 DISP "CALIBRATION DONE, PRESS
CONTINUE WHEN READY TO MEASURE."
75 PAUSE
80 OUTPUT 718;"-MEASURE;"
Select the misejigure and
gain measurements mode.
Set all measurement conftguration parameters to
default values.
Set the time-measurement
bandwidth value to 300,
and change the measurement bandwidth to 1 MHz
Set the averaging time to
1 second per measurement
point.
Calibrate the measurement
setup for the new parameters.
Query the spectrum analyzer for the calibration
routine status.
Get the status condition.
L&play the calibrationdone message.
Wait for the key to be pressed.
Make a calibrated noise
jtgure and gain measurement.
90 END
Query Response The response is displayed in Hz.
t e r m i n a t o r
+
Figure 6-5. -BW Query Response Syntax
6-13
-1
I-
-I
Programming
-CAL
The -CAL command initiates the system calibration routine.
-CAL
Figure 6-6. -CAL Syntax
Prerequisite Command: -NFMODE
Description Entering the -CAL command initiates the system calibration routine. The
device under test is not connected. In addition, all measurement parameters
(conversion, RF and IF frequencies, points, and so forth) are entered prior to
executing calibration.
Example
Program
Turn on noisef!gure mRasurements personality mode.
30 OUTPUT 718 ; “-DEFAULTS ; ”
Set all of the measurement
parameters to the default
values.
40 OUTPUT 718;“-PTS 3;”
Set the number of nwasuremkmt points to 3.
50 OUTPUT 718; “-CAL; ”
Calibrate the measurement
setup.
60 OUTPUT 718 , * “DONE?. . 9 ”
Query the spectrum analyzer for the calibration
routine status.
70 ENTER 718;DONE
Get the status condition.
80 DISP “CALIBRATION DONE, PRESS LIispla y the calibrationCONTINUE WHEN READY TO MEASURE.”
dme message.
85 PAUSE
Wait for the key to be pressed.
90 OUTPUT 718; “-MEASURE; ”
Make a calibrated noise
jigure and gain measurement.
100 END
20 OUTPUT 718;“-NFMODE; ”
6-14
-I
Programming
XONN
-CONN
The -CONN command is used to control external hardware (relays, etc.) via
the auxiliary interface connector.
VARDEF
-CONN
Figure 6-7. -CONN Syntax
Related Commands: -NFMODE, -CAL
Description When the auxiliary interface connector is enabled ( VARDEF -CONN, 1;)
the voltage on control line C (CNTLC) is changed to a transistor-transistor
logic (TTL) high level when in NFMODE and returns to a low level when in
spectrum analyzer mode.
The voltage on control line D (CNTLD) is changed to a TTL high level when a
NF calibration is performed and returns to a low level when the calibration is
finished.
When the auxiliary interface connector is disabled (VARDEF -CONN, 0;) the
voltage on the control lines will go to a TTL low level after an instrument
preset (IP), and will not be affected by the 85719A personality.
6-15
I-
-I
Programming
-ENR
-ENR is a DLP defined trace containing the noise source ENR (excess noise
ratio) table.
Description An ENR table can be entered from an existing table stored in the internal
memory or from a table stored on a memory card. A new ENR table can also
be entered.
NOTE
If an ENR data table is not entered remotely, either the default table or the table that was last edited,
saved, or recalled will be used.
The following procedures should be used to load the the ENR table whenever
it is desired to change the ENR data used by the Noise Figure Measurements
Personality.
To Recall an To recall an existing ENR table stored in the internal memory, complete the
Existing ENR following command line:
Table
RCLT
-ENR
register
number
Figure 6.8. -ENR Syntax, Recalling Existing Table from Internal Memory
Register number range: 0 to 52
6-16
-
I-
-I
Programming
-ENR
Example
Program
10 OUTPUT 718."IP*"
2 0 O U T P U T 718;"RC;T -ENR, 1 ; "
30 OUTPUT 718;"-NFMODE;"
Presets spectrum analyzer:
Loads ENR table from internal, memory.
Enters NF mode.
To recall an existing ENR table stored on a memory card, complete the
following command line:
LOAD
del imi ier
delimiter
-ENR
xenr2
Figure 6-9. -ENR Syntax, Recalling Existing Table from Memory Card
Register number range: 0 to 99
Delimiter: Matching characters of the following: - 1 \ @I = / ^ $ % ! ’ : )) &
Example
Program
10 OUTPUT 718;"IP;"
2 0 O U T P U T 718;"LOAD XtNFENR-5x, -ENR;"
30 OUTPUT 718;"sNFMODE;"
Presets spectrum analyzer:
Loads ENR tablefrom memory card register 5.
Enters NF mode.
6-17
-I
IProgramming
-ENR
To Create a To enter a new ENR table, complete the following command line:
New ENR Table
-ampI 1
tude
-ENR
AMPCOR
Figure 6-10. -ENR Syntax, Creating a New -ENR Table
Number: any real or integer number.
NOTE
The noise source serial number can be stored in -ENR[401].
60 OUTPUT 718 ; “MOV -ENR [401] ,2493 ; ”
6-18
Stores serial number
2493.
I-
-I
Programming
-ENR
Example
Program
10 OUTPUT 718;"IP;"
20 OUTPUT 718;"XCH AMPCOR, -ENR;"
30 OUTPUT 718;"AMPCOR lOOMHz,
15.5dB, lGHz, 16.6dB, 2GHz, 15.8dB;"
40 OUTPUT 718;"XCH -ENR, AMPCOR;"
50 OUTPUT 718;"AMPCOR OFF;"
60 OUTPUT 718;"MOV -ENR[401], 2493;"
70 OUTPUT 718;"-NFMODE;"
Presets spectrum analyzex
Stores previous contents
of AMPCOR in -ENR.
Storesfrequency-amplitude
pairs in spectrum analyzer: Notice that frequencies are in ascending order:
Moves ENR table into -ENR
and replaces the previous
AMPCOR contents
Turns ofl the amplitude
correction.
Stores serial number2493.
Enters NF mode.
6-19
-
-I
IProgramming
-FCONV
Use the -FCONV command to select either frequency conversion mode or
non-conversion mode.
BEI-
XFCON”
Figure 6-l 1. -FCONV Syntax
Item
Description
Default Value
0 [non-conversion1
Default Units
none
Range
0 or 1
Prerequisite Command -NFMOOE
Related Commands
LABEL, JSTART, JSTOY JCSTARTJ -RFSTOlf -IFSTART, -IFSTOP
Description Use the -FCONV command to select either frequency conversion or
non-frequency conversion mode. When frequency conversion mode is
selected, the specified RF start and stop frequencies are used to look up
ENR data, while the measurement is tuned to the IF frequencies during a
measurement.
When non-frequency conversion mode is selected, the ENR data
corresponding to the measurement frequency is used.
Following a transition from frequency conversion to non-frequency conversion
mode, send the -LABEL command to update (redraw) the screen annotation.
6-20
-I
IProgramming
-FCONV
Example
Program
Recall ENR datafromthe memory card.
20 OUTPUT 718;"WNFMODE;"
30 OUTPUT 718;"-DEFAULTS;"
40 OUTPUT 718;"MSI CARD;"
50 OUTPUT 718;"LOAD tNFENRs33,TRC;"
60 OUTPUT 718;"MOV -ENR,TRC;"
70 OUTPUT 718;"-FCONV 1;"
80 OUTPUT 718;"sLABEL;"
90 OUTPUT 718;"mIFSTART 400MHZ;"
100 OUTPUT 718;"-IFSTOP GOOMHZ;"
110 OUTPUT 718;"sRFSTART 650MHZ;"
120 OUTPUT 718;"-RFSTOP 850MHZ;"
Turn on noise figure nzeasurementspersonality mode.
Set all measurement conf&ration parameters to
default values.
Establish the memory card
i/o path to recall ENR data
from a card.
Recall from a memory card,
the ENR data stored as tNFENR, register 33.
Move the ENR data to TRC.
Turn the frequency conversion mode ON.
Redraw display annotation for frequency conversion mode measurement
state.
Set the frequency conversion measurement IFstart
frequency to 400 h4H.z.
Set the frequency conversion measurement IFstop
frequency to 6OOMHz The
span is 200 MI& and must
equal the RF start and
stop frequent y span.
Set the conversion mode
start frequency to 65OMHz.
Set the non-conversion mode
stop frequency to 850 MHZ,
which results in a span
equal to the IF frequency
span of 200 MHz
130 END
6-21
I-
-I
IProgramming
JCONV
Query Response The response displays the frequency conversion mode.
Figure 6-12. -FCONV Query Response Syntax
6-22
-I
IProgramming
-FSTART
-FSTART
Use the -FSTART command to enter the start frequency for non-conversion
mode measurements.
-FSTART
GHZ
Il&$
..a...‘
+3-] ..,,
\
I
J
Figure 6.13. -FSTART Syntax
Description
Item
Default Value
10.0 MHz
Default Units
HZ
Range
Spectrum analyzer frequency rangE
Prerequisite Command -NFMODE
Related Commands
-FCONV, -FSTOP
Description Use the -FSTART command for non-frequency conversion measurements.
Enter or query the start frequency. The start frequency is typically the lowest
frequency of the device under test.
6-23
-I
Programming
-FSTART
20 OUTPUT 718;“mNFMODE;”
Example
Program
30 OUTPUT 718;“-DEFAULTS;”
40 OUTPUT 718;“mFSTART 300MHZ;”
50 OUTPUT 718;“-FSTOP 1200MHZ;”
60 END
Query Response
Turn on noisejigure masurernents personality mode.
Set all wteasurement conJ&ration parameters to
default values.
Set the non-conversion mode
start frequency to 3OOMH.z.
Set the non-conversion mode
stop frequency to 1200 hElIz.
The response displays the start frequency value in Hz.
t e r m i n a t o r
-
Figure 6-14. -FSTART Query Response Syntax
6-24
IProgramming
-FSTOP
-FSTOP
Use the -FSTOP command to enter the stop frequency for non-conversion
mode measurements.
-FSTOP
6-15. -FSTOP Syntax
Description
1.8 GHz
Hz
Spectrum analyzer frequency rang1?
Prerequisite Command -NFMOOE
JSTART, JCONV
E x a m p l e 20
Program
OUTPUT 718;“SNFMODE;”
30
OUTPUT 718; “-DEFAULTS; ”
40
OUTPUT 718; “-FSTART 300MHZ; ”
50
OUTPUT 718; ‘I- FSTOP 1200MHZ; ”
Turn on noisejigure wwasuremmts person&it y mode.
Set all measurement configuration parameters to
default values.
Set the non-conversion mode
start frequency to 300 h4H.z
Set the non-conversion mode
stop frequency to 1200 MHz
6-25
I-
-I
Programming
-FSTOP
60 END
Description Use the -FSTOP command for non-frequency conversion measurements.
Enter or query the stop frequency. The stop frequency is typically the
highest frequency of the device under test.
Query Response The response displays the stop frequency value in Hz.
t e r m i n a t o r
+
Figure 6-16. -FSTOP Query Response Syntax
6-26
-I
IProgramming
-GM
-GLVL
Use the -GLVL command to set the reference level for the gain measurement
results.
-GLVL
Figure 6-17. -GLVL Syntax
L
Item
Description
Default Value
0 . 0 0 dB
Default Units
dB
Range
- 9 9 . 9 0 dB t o +99.90 dB
Prerequisite Command -NFMOOE
Related Commands
-GSCALE, -NFLVL, -NFSCALE
Description Use the -GLVL command to set or query the gain measurement reference
level. Changing the reference level does not affect system calibration,
therefore, it can be adjusted after calibration.
Example
Program
10
OUTPUT 718; “SNFMODE; ”
20 OUTPUT 718; “-DEFAULTS; ”
30 OUTPUT 718;“-PTS 3;”
40
OUTPUT 718 ; “-FSTART 300MHZ ; ”
50 OUTPUT 718; “-FSTOP 1200MHZ; ”
Turn on noisejigure masurements personality mode.
Set all measurement con$&ration parameters to
default values.
Set the number of measurement points to 3.
Set the non-conversion mode
start frequency to 300 h4Hz
Set the non-conversion mode
stop frequency to 12oOMHIz.
6-27
-I
IProgramming
-GLVL
60 OUTPUT 718;"eCAL;"
70 OUTPUT 718;"DONE?;"
80 ENTER 718;DONE
90 DISP "CALIBRATION DONE, PRESS
CONTINUE WHEN READY TO MEASURE."
100 PAUSE
110 OUTPUT 718;"mMEASURE;"
120 OUTPUT 718;"mGLVL 10DB; -GSCALE 5DB;"
130 END
Calibrate the measurement
setup.
Query the spectrum analyzer for the calibration
routine status.
Get the status condition.
Display the calibrationdone message.
Wait for the key to be pressed.
Make a calibrated noise
Jigure and gain measurement.
Set the gain trace refwence level to 10 dB Set the
scale for the gain trace to
5 dB
Query Response The response displays the current gain reference level value.
t e r m i n a t o r
+
Figure 6.18. -GLVL Query Response Syntax
6-28
-I
IProgramming
-GSCALE
-GSCALE
Use the -GSCALE command to set the reference level for the gain
measurement results.
-GSCALE
Figure 6-19.-GSCALE Syntax
Description
1 0 . 0 dB
dB
0 . 1 0 dB t o +99.90 dB
Prerequisite Command -NFMOOE
Related Commands
-GLVL, -NFLVL, -NFSCALE
Description Use the -GSCALE command to set or query the display scale for the gain
measurement. Changing the scale does not effect system calibration;
therefore, it can be adjusted during the measurement.
Example
Program
20 OUTPUT 718; “-NFMODE;”
30
OUTPUT 718 ; “-DEFAULTS; ”
40 OUTPUT 718;“-PTS 3;”
50 OUTPUT 718; “-FSTART 300MHZ; ”
60 OUTPUT 718;“-FSTOP 1200MHZ;”
Turn on noisejigure measurements personality mode.
Set all rneasurenwnt con-
jiguration parameters to
default values.
Set the number of nzeasure-t points to 3.
Set the non-conversion mode
start frequency to 300 hLU.2.
Set the non-conversion mode
stop frequency to 12OOMHk
6-29
-I
IProgramming
-GSCALE
70 OUTPUT 718;"-CAL;"
80 OUTPUT 718;"DONE?;"
90 ENTER 718;DONE
100 DISP "CALIBRATION DONE, PRESS
CONTINUE WHEN READY TO MEASURE."
105 PAUSE
110 OUTPUT 718;"-MEASURE;"
120 OUTPUT 718;"mGLVL -1ODB; -GSCALE 5DB;"
Calibrate the measurement
setup.
Query the spectrum analyzer for the calibration
routine status.
Get the status condition.
Display the calibrationdone message.
Wait for the key to be pressed.
Make a calibrated noise
j&ure and gain measurement.
Set the gain trace referme level to -10 dB Set
the scale for the gain trace
to5dB
130 END
Query Response The response displays the current scale value.
Figure 6.20. -GSCALE Query Response Syntax
6-30
I-
-I
Programming
-IFSTART
-1FSTART
Use the -IFSTART command to enter the IF start frequency for a
frequency-conversion noise figure and gain measurement.
-IFSTART
6-21.
-IFSTART Syntax
Item
Description
Default Value
1 . 4 5 GHz
Default Units
Hz
Range
Spectrum analyzer frequency range
Prerequisite Command -NFMOOE
Related Commands
-FCONV, -RFSTART, -RFSTOF! JFSTOF
Description Use the -IFSTART command to set or query the IF start frequency value.
The IF start and stop frequency spans must match the RF stop and start
frequency span. Frequency conversion needs to be selected for these values
to be active.
Reverse sweep, such as when the IF start frequency is greater than the IF
stop frequency, is allowed.
6-31
-I
Programming
-I FSTART
20 OUTPUT 718;"-NFMODE;"
Example
Program
25 OUTPUT 718;"mDEFAULTS;"
30 OUTPUT 718;"-FCONV 1;"
35 OUTPUT 718;"sLABEL;"
40 OUTPUT 718;"mIFSTART 400MHZ;"
50 OUTPUT 718;"sIFSTOP GOOMHZ;"
60 OUTPUT 718;"mRFSTART 650MHZ;"
70 OUTPUT 718;"-RFSTOP 850MHZ;"
Turn on noisefigure measurements personality mode.
Set all measurement configuration parameters to
default values.
Turn the frequency conversion mode ON.
Redraw display anrwtation for frequency conversion mode measurement
state.
Set the frequency conversion measurement IFstart
frequency to 400 MHz
Set the frequency conver
sion measurement IFstop
frequent y to 600 hDI... The
span is 200 hB!I,z and must
equal the RF start and
stop frequency span.
Set the non-conversion mode
start frequency to 65OMHz.
Set the non-conversion mode
stop frequency to 850 MI&,
which results in a span
equal to the IFfrequency
span of 200 MHz
80 END
Query Response The response displays the current IF start frequency value.
Figure 6.22. -IFSTART Query Response Syntax
6-32
-I
IProgramming
-IFSTOP
-IFSTOP
Use the -IFSTOP command to enter the IF stop frequency for a
frequency-conversion noise figure and gain measurement.
_ I FSTOP
Figure 6-23. -IFSTOP Syntax
Description
950 MHz
Hz
Spectrum analyzer frequency range
Prerequisite Command -NFMOOE
Related Commands
JCONV, -RFSTART, -IFSTAAT, -RFSTOP
Description Use the -IFSTOP command to set or query the IF stop frequency value. The
IF start and stop frequency span must match the RF stop and start frequency
span. The frequency conversion device under test determines the ranges of
values. Frequency conversion needs to be selected for these values to be
active.
6-33
I-
-I
Programming
-IFSTOP
20 OUTPUT 718;"-NFMODE;"
Example
Program
25 OUTPUT 718;"-DEFAULTS;"
30 OUTPUT 718;"-FCONV 1;"
35 OUTPUT 718;"-LABEL;"
40 OUTPUT 718;"mIFSTART 400MHZ;"
50 OUTPUT 718;"-IFSTOP GOOMHZ;"
60 OUTPUT 718;"JlFSTART 650MHZ;"
70 OUTPUT 718;"-RFSTOP 850MHZ;"
Turn on noisefigure measurementspersonality m&e.
Set all measurement configuration parameters to
default values.
Turn the frequency conversion mode ON.
Redraw display annatation for frequency conversion mode measurement
state.
Set the frequency conversion measurement IFstart
frequency to 400 MHz
Set the frequency conversion measurement IFstop
frequent y to 600 h4H.z. The
span is 200 MH.. and must
equal the RF start and
stop frequency span.
Set the non-conversion mode
start frequent y to 650 ikfH.2.
Set the non-conversion mode
stop frequency to 850 MI&,
which results in a span
equal to the IFfrequency
span of 200 h4Hz.
80 END
Query Response The response displays the current IF stop frequency value.
Figure 6-24. -IFSTOP Query Response Syntax
6-34
-I
Programming
-INLOSS
ANLOSS
Use the -INLOSS command to correct for the dB loss values that exist at the
input of the device under test.
NOTE
If the loss is present when the calibration is made, do not enter a loss value with this command.
These losses are introduced into the measurement setup after calibration is completed.
Figure 6-25. -INLOSS Syntax
Description
0 . 0 dB
dB
- 9 9 . 9 0 dB t o +99.90 dB
Prerequisite Command -NFMOOE
Related Commands
-0UTLOSS. -SLOSS
6-35
I-
-I
Programming
-INLOSS
60 OUTPUT 718;"-INLOSS
2DB;"
70 OUTPUT 718;"-0UTLOSS 3.2DB;"
80 OUTPUT 718;"-SLOSS O.lDB;"
90 OUTPUT 718;"sCAL;"
100 OUTPUT 718;"DONE?;"
110 ENTER 718;DONE
120 DISP "CALIBRATION DONE, PRESS
CONTINUE WHEN READY TO MEASURE."
125 PAUSE
130 OUTPUT 718;"-MEASURE;"
140 OUTPUT 718;"mGLVL -1ODB;"
150 OUTPUT 718;"mGSCALE 1ODB;"
160 OUTPUT 718;"-NFLVL ODB;"
170 OUTPUT 718;"-NFSCALE 10DB;"
Enter the 2 dB loss that
exists in the measurement
setup, following calibration, and is present at the
input of the device under
test.
Enter the 3.2 dB loss that
exists in the measurement
setup, following calibration, and is present at the
output of the dewice under
test.
Enter the 0.1 dB loss that
exists in the setup, during calibration, at the output of the noise source.
Calibrate the measurement
setup.
Query the spectrum analyzer for the calibration
routine status.
Get the status condition.
Display the calibrationdone message.
Wait for the key to be pressed.
Make a calibrated noise
Jgure and gain measurement.
Set the gain trace reference level to -10 dB
Set the scale for the gain
trace to 10 dB per division.
Set the noise$gure trace
reference level to 0.0 dB
Set the scale for the noise
figure trace to 10 dB per
division.
180 END
6-37
_I
-I
IProgramming
-INLOSS
Query Response The response displays the current input loss value being used for
measurement calculations.
Figure 6-27. ANLOSS Query Response Syntax
6-38
-I
IProgramming
-LABEL
-LABEL
Use the -LABEL command to refresh the screen annotation following the
selection of conversion or non-conversion with the -FCONV command.
-LABEL
Figure 6-28. -LABEL Syntax
Description
Example
Program
Use the -LABEL command, especially after transitioning between frequency
conversion and non-conversion measurements to update the display
annotation with accurate settings.
20 OUTPUT 718; “-NFMODE;”
25 OUTPUT 718; “-DEFAULTS; ”
30 OUTPUT 718; “-FCONV 1; ”
35 OUTPUT 718;“-LABEL;”
40 OUTPUT 718;“-IFSTART
400MHZ;”
50 OUTPUT 718;“-IFSTOP GOOMHZ;”
60
OUTPUT 718; “-RFSTART 650MHZ; ”
70
OUTPUT 718; “-RFSTOP 850MHZ; ”
Turn on noisefigure mode.
Set measurement conJiguration parameters to default.
Turn the frequency conversion mode ON.
Redraw display annotation forfrequency conversion mode measurement
state.
Set the frequency conversion measurement IFstart
frequency to 400 hlMz.
Set the frequency conversion measurement IFstop
frequency to 6OOMH.z. The
span is 200 hB& and must
equal the RF start and
stop frequency span.
Set the non-conversion mode
start frequency to 650 h!Hz
Set the non-conversion m&e
stop frequency to 850 MY..,
which results in a span
equal to the IFfrequency
span of 200 MHz
80 END
6-39
I-
-I
IProgramming
-MEASURE
Use the -MEASURE command to initiate the noise figure and gain
measurement sequence.
Figure 6-29. -MEASURE Syntax
Prerequisite Command: -NFMODE
Description Use the -MEASURE command to initiate a measurement. Before
measurements can begin, the measurement configuration and system
calibration (if an accurate noise figure measurement or a gain trace is desired)
must have been completed. Either accept the default configuration values, or
refer to ‘lhble 6-2 for the list of commands available for setting measurement
configuration.
The measurement results are located in the traces -NF and -GAIN. The
element 1 corresponds with the start frequency, and the element 401
corresponds with the stop frequency.
Description of Variables
Description
Units
-NF
The 401-point trace -NF holds the noise figure measurement date.
hundredths of a dB
-GAIN
The 401.point trace -GAIN holds the gain measurement data.
Array or Variable Name
6-40
Divide the results by 100 to convert date to dB.
-I
IProgramming
-MEASURE
Example
Program
20 OUTPUT 718;"-NFMODE;"
30 OUTPUT 718;"mDEFAULTS;"
40 OUTPUT 718;"-FCONV 1;"
45 OUTPUT 718;"sLABEL;"
50 OUTPUT 718;"mIFSTART 400MHZ;"
60 OUTPUT 718;"-IFSTOP GOOMHZ;"
70 OUTPUT 718;"mRFSTART 650MHZ;"
80 OUTPUT 718;"-RFSTOP 850MHZ;"
90 OUTPUT 718;"-CAL;"
100 OUTPUT 718*"DONE?-"
,
.,
110 ENTER 718;DONE
120 DISP "CALIBRATION DONE, PRESS
CONTINUE WHEN READY TO MEASURE."
125 PAUSE
Turn on noise figure measurementspersonality mode.
Set all measurement configuration parameters to
default values.
Turn the frequency conversion mode ON.
Redraw display annatation for frequency conversion made measurement
state.
Set the frequency conversion measurement IFstart
frequency to 400 hJH,z.
Set the frequency conversion measurement IFstop
frequent y to 600 MHz. The
span is 200 MHz and must
equal the RF start and
stop frequency span.
Set the non-conversion mode
start frequency to 650 h@I...
Set the non-conversion mode
stop frequency to 850 MH..,
which results in a span
equal to the IF frequency
span of 200 MHz.
Calibrate the measurement
system.
Query the spectrum analyzer for the calibration
routine status.
Get the status condition.
Display the calibrationo!mw message.
Wait for the key to be pressed.
6-41
-I
Programming
-MEASURE
130 OUTPUT 718;"-MEASURE;"
140 INTEGER I
1 5 0 R E A L G_data(l:401)
160
170
180
190
FOR I=1 TO 401
OUTPUT 718;"_GAIN[";I;"]?;"
ENTER 718;G_data(I)
G-data(I)=G-data(I)/100
200
NEXT I
2 1 0 R E A L N_figure(l:401)
220
230
240
250
FOR I=1 TO 401
OUTPUT 718;"_NF[";I;"]?;"
ENTER 718;N_figure(I)
N-figure(I)=N-figure(I)/100
Make a calibrated noise
&pm-e and gain measurement.
The array to hold gain
measurement trace data.
Query the gain trace for
data.
Enter the data.
Convert the data to dB
units.
The array to hold noise
jigure measurement trace
data.
Query the noisejigure trace
for data.
Enter the data.
Convert the data to dB
units.
260
NEXT I
270 END
6-42
I-
-I
Programming
-NW/L
-NFLVL
Use the -NFLVL command to set the reference level for the noise figure
measurement results.
Figure 6-30. -NW1 Syntax
Description
Item
Default Value
0 . 0 0 dB
Default Units
dB
Range
- 9 9 . 9 0 dB t o +99.90 dB
Prerequisite Command -NFMODE
Related Commands
Description
-NFSCALE, - G L V L , -GSCALE
Use the -NFLVL command to set or query the noise figure measurement
reference level. Changing the reference level does not affect system
calibration, therefore, it can be adjusted during the measurement.
Example
Program
20
OUTPUT 718; “-NFMODE; ”
25
OUTPUT 718 ; “-DEFAULTS; ”
30 OUTPUT 718;“-PTS 3;”
40
OUTPUT 7 18 ; “-FSTART 300MHZ ; ”
50 OUTPUT 718; “-FSTOP 1200MHZ; ”
Turn on noisejigure measuremkmts personality mode.
Set all measurement conj&uration parameters to
default values.
Set the number of measurement points to 3.
Set the non-conversion mode
start frequency to 300 MHz.
Set the ruxa-conversion mode
stop frequency to 12OOhAY..
6-43
-I
IProgramming
-NW/L
60 OUTPUT 718;"-CAL;"
70 OUTPUT 718;"DONE?;"
80 ENTER 718;DONE
90 DISP "CALIBRATION DONE, PRESS
CONTINUE WHEN READY TO MEASURE."
95 PAUSE
100 OUTPUT 718;"-MEASURE;"
110 OUTPUT 718;"wNFLVL 5DB; -NFSCALE 1DB;"
Calibrate the measurement
system.
Query the spectrum analyzer for the calibration
routine status.
Get the status condition.
Display the calibrationdone message.
Wait for the key to be pressed.
Start the calibrated noise
Jigure and gain measurement.
Set the noise jigure trace
reference level to 5 dB Set
the noise-$gure scale for 1
dB
120 END
Query Response The response displays the current noise figure reference level value.
terminator
Figure 6-31. -NFLVL Query Response Syntax
6-44
-I
IProgramming
-NFMODE
-NFMODE
Use the -NFMODE command to control instrument mode state.
Figure 6-32. -NFMODE Syntax
Description Use the -NFMODE command to initiate remote, noise figure and gain mode
measurements.
Example
Program
10 OUTPUT 718*"IP-"
20 OUTPUT 718;"-NFMODE;"
25 OUTPUT 718;"sDEFAULTS;"
3 0 O U T P U T 718;"-PTS 3 ; "
40 OUTPUT 718;"sFSTART 300MHZ;"
50 OUTPUT 718;"-FSTOP 1200MHZ;"
60 OUTPUT 718;"mCAL;"
70 OUTPUT 718*"DONE7-"
,
.,
80 ENTER 718;DONE
90 DISP "CALIBRATION DONE, PRESS
CONTINUE WHEN READY TO MEASURE."
95 PAUSE
100 OUTPUT 718;"-MEASURE;"
Preset the spectrum analyzer
Turn on noise figure measurements personality mode.
Set all measurement configuration parameters to
default values.
Set the number of measurement points to 3.
Set the non-conversion mode
start frequency to 3OOMHz.
Set the non-conversion mode
stop frequency to 12OOhJHz.
Calibrate the measurement
system.
Query the spectrum ana-
lyzer for the calibration
routine status.
Get the status condition.
Display the calibrationdone message.
Wait for the key to be pressed.
Start the calibrated noise
figure and gain measurement.
6-45
-I
Programming
-NFMODE
110 OUTPUT 718;"mGLVL 10DB; -GSCALE 5DB;"
120 END
6-46
Set the gain trace reference level to 10 dB (available only if the measurement system is calibrated.
Set the scale for the gain
trace to 5 dB
-I
IProgramming
-NFSCALE
-NFSCALE
Use the -NFSCALE command to set the reference level for the noise Egure
measurement results.
Figure 6-33. -NFSCALE Syntax
Description
Item
Default Value
2 dB/div
Default Units
dB
Range
0 . 1 0 dB t o +99.90 dB
Prerequisite Command -NFMOOE
Related Commands
-NFLVL, - G L V L , -GSCALE
Description Use the -NFSCALE command to set or query the display scale for the noise
Egure measurement. Changing the scale does not effect system calibration;
therefore, it can be adjusted without requiring recalibration.
Example
Program
20
OUTPUT 718; “-NFMODE; ”
30
OUTPUT 7 18 ; “-DEFAULTS ; ”
40
OUTPUT 718; “-PTS 3; ”
50 OUTPUT 718;“mFSTART 300MHZ; ”
60
OUTPUT 718 ; “-FSTOP 1200MHZ ; ”
Turn on noisejigure mRasurementspersonality mode.
Set all measurement conjiguration parameters to
default values.
Set the number of mRasurement points to 3.
Set the non-conversion mode
start frequency to 300 IMHz.
Set the non-conversion mode
stop frequency to 1200 IMHz.
6-47
-I
Programming
-NFSCALE
70 OUTPUT 718;"mCAL;"
80 OUTPUT 718;"DONE?;"
90 ENTER 718;DONE
100 DISP "CALIBRATION DONE, PRESS
CONTINUE WHEN READY TO MEASURE."
105 PAUSE
110 OUTPUT 718;"-MEASURE;"
120 OUTPUT 718;" -GLVL
10DB; SGSCALE
10DB;"
130 OUTPUT 718;"-NFLVL ODB; -NFSCALE 5DB;"
Calibrate the measurement
system.
Query the spectrum analyzer for the calibration
routine status.
Get the status condition.
LXsplay the calibrationo!me message.
Wait for the key to be pressed.
Start the calibrated noise
f&we and gain measurement.
Set the gain trace reference level to 10 dB. Set the
scale for the gain trace to
10 dB per division.
Set the noise figure trace
reference level to 0.0 dB
Set the scale for the noise
figure trace to 5.0 dB per
division.
140 END
Query
Response
The response displays the current scale value.
Figure 6-34. -NFSCALE Query Response Syntax
6-48
I-
-I
Programming
-0UTLOSS
-0UTLOSS
Use the -0UTLOSS command to correct for the dB loss value that exists
at the output of the device under test, before the input to the system
preamplifier.
I
NOTE
I
If the loss is present when the calibration is made, do not enter a loss value with this command.
These losses are introduced into the measurement setup after calibration is completed.
Figure 6-35. -0UTLOSS Syntax
Description
Item
Default Value
0 . 0 0 dB
Default Units
dB
Range
- 9 9 . 9 0 t o +99.90 dB
Prerequisite Command -NFMOOE
Related Commands
ANLOSS, -StOSS
6-49
-I
Programming
-0UTLOSS
Description
Use the -0UTLOSS command to enter or query the dB loss value set for the
output of the device under test, as illustrated in Figure 6-36. The loss value
is due to cables and other loss factors that are required in the measurement
system.
Generally, a positive output-loss value is entered. A negative output-loss
value indicates additional gain is present.
SPECTRUM
ANALYZER
28 VOLTS
SWITCHED
PREAMPLIFIER
NOISE
SOURCE
i =
Da710o
Figure 6.36. location of Output Loss Characteristic
Example
Program
20
OUTPUT 718 ; “SNFMODE; ”
30
OUTPUT 718 ; “-DEFAULTS ; ”
40
OUTPUT 718 ; ” -PTS 3 ; ”
50
OUTPUT 718; “-FSTART 300MHZ; ”
6-50
Turn on noi.sejQure measurements personality mode.
Set all mkxxurement conjiguration parameters to
default values.
Set the number of measurement points to 3.
Set the non-conversion mode
start frequency to 3OOhdH.z
-I
IProgramming
-0UTLOSS
60 OUTPUT 718;"-FSTOP 1200MHZ;"
70 OUTPUT 718;"-INLOSS 2DB;"
80 OUTPUT 718;"-0UTLOSS 3.2EDB;"
90 OUTPUT 718;"-SLOSS O.lDB;"
100 OUTPUT 718;"sCAL;"
110 OUTPUT 718;"DONE?;"
120 ENTER 718;DONE
130 DISP "CALIBRATION DONE, PRESS
CONTINUE WHEN READY TO MEASURE."
140 OUTPUT 718;"-MEASURE;"
150 OUTPUT 718;"-GLVL -1ODB; -GSCALE 10DB;"
160 OUTPUT 718;"-NFLVL ODB; -NFSCALE 5DB;"
Set the non-conversion mode
stop frequency to 12OOh4Hz
Enter the 2 dB loss that
exists in the measurement
setup, following calibration, and is present at the
input of the device under
test.
Enter the 3.2 dB loss that
exists in the measurement
setup, following calibration, and is present at the
output of the okvice under
test.
Enter the 0.1 dB loss that
exists in the measurement
setup, following calibration, and is present at the
output of the noise source
used in the measurement.
Calibrate the measurement
setup.
Query the spectrum analyzer for the calibration
routine status.
Get the status condition.
Display the calibrationo!one message.
Set the gain trace reference level to -10 dB Set
the scale for the gain trace
to 10 dB per division.
Set the noise jgure trace
reference level to 0.0 dB
Set the scale for the noise
figure trace to 5.0 dB per
division.
170 END
6-51
-
I-
-I
Programming
-0UTLOSS
Query Response
The response displays the current output loss value being used for
measurement calculations.
Figure 6.37. -0UTLOSS Query Response Syntax
6-52
I-
-I
Programming
-PGAIN
-PGAIN
Use the -PGAIN command to select the number of measurement points.
Figure 6-38. -PGAIN Syntax
I
Item
I Description 1
Default Value
2 2 . 0 dB
Default Units
dB
Range
0t o
+99.90 dB
Prerequisite Command -NFMODE
Description
Example
Program
Use the -PGAIN command to enter or query the minimum gain of
the preamplifier used in the measurement system. If the HP 87405A
probe-powered preamplifier is used, the 22.0 dB default setting is automatic.
For other preamplifiers, enter the appropriate gain.
20 OUTPUT 718; “-NFMODE; ”
30 OUTPUT 718;“-DEFAULTS;”
4 0 O U T P U T 718;“-PGAIN 1 2 ; ”
50 OUTPUT 718;“-CAL;”
60
OUTPUT 718 ; “DONE? ; ”
70 ENTER 718;DONE
Turn on noisef@ure measuremfmts personality mode.
Set all of the measurement
parameters to the default
values.
Set the preamplifir gain
to 12 dB
Calibrate the measurement
setup.
Query the spectrum analyzer for the calibration
routine status.
Get the status condition.
6-53
IProgramming
-PGAIN
80 DISP vlCALIBRATION DONE, PRESS
CONTINUE WHEN READY TO MEASURE."
85 PAUSE
90 OUTPUT 718;"wMEASURE;"
Display the calibrationdone message.
Wait for the key to be pressed.
Make a calibrated noise
$&u-e and gain measurement.
100 END
Query Response The response displays the current preamplifier gain value.
Figure 6.39. -PGAIN Query Response Syntax
6-54
I-
-I
Programming
-PTS
-PTS
Use the -PTS command to select the number of measurement points.
Figure 6.40. -PTS Syntax
Description
11
none
1 to 401
Prerequisite Command -NFMODE
Related Commands
-MEASURE
Description Use the -PTS command to set or query the measurement point.
The number of measurement points determines number of equally spaced
frequency points evaluated for noise figure and gain.
6-55
-I
Programming
-PTS
Yumber Entered
Example
Program
htual Number Points Measured
1
1 point
2
2 points
3
3 points
4 to 5
5 points
6 to 7
6 points
8 to 9
9 points
1 0 to 1 3
1 1 points
14 to 1 8
1 7 points
19 to 23
2 1 points
24 to 34
26 points
34 to 45
41 points
46 to 65
5 1 points
66 to 90
8 1 points
91 to 150
1 0 1 points
1 5 1 to 300
201 points
301 to 401
401 points
20 OUTPUT 718;"mNFMODE;"
30 OUTPUT 718;"sDEFAULTS;"
40 OUTPUT 718;"ePTS 3;"
50
OUTPUT 718;"mCAL;"
60
OUTPUT 718;"DONE?;"
70 ENTER 718;DONE
80 DISP "CALIBRATION DONE, PRESS
CONTINUE WHEN READY TO MEASURE."
85 PAUSE
6-56
Turn on noisefigure mRasurements personality mode.
Set all of the measurement
parameters to the default
values.
Set the number of masurement points to 3.
Calibrate the measurement
setup.
Query the spectrum analyzer for the calibration
routine status.
Get the status condition.
Display the calibrationdone message.
Wait for the key to be pressed.
I-
-I
Programming
-PTS
90 OUTPUT 718;"-MEASURE;"
Make a calibrated noise
$gure and gain measurement.
100 END
Query Response The response displays the current number of points selected.
Figure 6-41. -PTS Query Response Syntax
6-57
I-
-I
Programming
-RFSTART
Use the -RFSTART command to enter the RF start frequency for a
frequency-conversion noise figure and gain measurement.
Figure 6-42. -RFSTART Syntax
Description
Item
Default Value
3 . 7 0 GHz
Default Units
HZ
Range
0.0 Hz to 999 GHz
Prerequisite Command -NFMODE
Related Commands
Description
JCONV, -IFSTART, -IFSTOf -RFSTOP
Use the -RFSTART command to set or query the RF start frequency value.
The RF start and stop frequency span must match the IF stop and start
frequency span. Frequency conversion needs to be selected for these values
to be active.
6-58
-I
1Programming
-RFSTART
Example
Program
20 OUTPUT 718;"mNFMODE;"
25 OUTPUT 718;"mDEFAULTS;"
30 OUTPUT 718;"wFCONV 1;"
35 OUTPUT 718;"mLABEL;"
40 OUTPUT 718;"-IFSTART
400MHZ;"
50 OUTPUT 718;"-IFSTOP GOOMHZ;"
60 OUTPUT 718;"JFSTART 650MHZ;"
70 OUTPUT 718;"-RFSTOP 850MHZ;"
80
OUTPUT 718;"eCAL;"
90
OUTPUT 718;"DONE?;"
100 ENTER 718;DONE
110 DISP "CALIBRATION DONE, PRESS
CONTINUE WHEN READY TO MEASURE."
115 PAUSE
120 OUTPUT 718;"-MEASURE;"
Turn on noisefigure measurements personality mode.
Set all measurement conf&ration parameters to
default values.
Select frequency conversion mode.
Redraw display annotation forfrequency conversion mode measurement
state.
Set the frequency conversion measurement IFstart
frequency to 400 MHz.
Set the frequency conversion measurement IFstop
frequency to 600 MHz The
span is 200 hDI,z and must
equal the RF start and
stop frequency span.
Set the non-conversion mode
start frequency to 650 MHz.
Set the non-conversion mode
stop frequency to 85OMH..,
which results in a span
equal to the IFfrequency
span of 200 MHZ.
Calibrate the measurement
system.
Query the spectrum analyzer for the calibration
routine status.
Get the status condition.
Display the calibrationdone message.
Wait for the key to be pressed.
Make a calibrated noise
jlgure and gain measurement.
130 END
6-59
-I
IProgramming
JIFSTART
Query
Response
The response displays the current RF start frequency value.
Figure 6-43. -RFSTART Query Response Syntax
6-60
IProgramming
-RFSTOP
SRFSTOP
Use the -RFSTOP command to enter the RF stop frequency for a
frequency-conversion noise figure and gain measurement.
-RFSTOP
Figure 6-44. -RFSTOP Syntax
item
Description
Default Value
4 . 2 0 GHz
Default Units
HZ
Range
0 . 0 H z to 9 9 9 GHz
Prerequisite Command -NFMOOE
Related Commands
JCONV, -IFSTART, -IFSTOe -RFSTART
Description Use the -RFSTOP command to set or query the RF stop frequency value. The
RF start and stop frequency span must match the IF stop and start frequency
span. Frequency conversion needs to be selected for these values to be
active.
6-61
-I
Programming
-RFSTOP
20 OUTPUT 718;"-NFMODE;"
Example
Program
25 OUTPUT 718;"-DEFAULTS;"
30 OUTPUT 718;"-FCONV 1;"
Turn on noisefigure measurements personality mode.
Set all measurement configuration parameters to
default values.
Turn the frequency con-
version mode ON.
35 OUTPUT 718;"-LABEL;"
40 OUTPUT 718;"mIFSTART 400MHZ;"
50 OUTPUT 718;"JFSTOP GOOMHZ;"
60 OUTPUT 718;"sRFSTART 650MHZ;"
70 OUTPUT 718 ;"-RFSTOP 850MHZ ,. (I
80 OUTPUT 718;"eCAL;"
90 OUTPUT 718;"DONE?;"
100 ENTER 718;DONE
110 DISP "CALIBRATION DONE, PRESS
CONTINUE WHEN READY TO MEASURE."
115 PAUSE
120 OUTPUT 718;"-MEASURE;"
130 END
6-62
Redraw display annotation for frequency conver
sion mode measurement
state.
Set the frequency conversion measurement IFstart
frequency to 400 MHz
Set the frequency conversion measurement IFstop
frequent y to 600 MHz The
span is 200 MI& and must
equal the RF start and
stop frequent y span.
Set the non-conversion mode
start frequency to 650 MHz
Set the non-conversion mode
stop frequency to 850 MHz,
which results in a span
equal to the IFfrequency
span of 200 MHz.
Calibrate the measurement
system.
Query the spectrum analyzer for the calibration
routine status.
Get the status condition.
Display the calibrationo!one message.
Wait for the key to be pressed.
Make a calibrated noise
figure and gain measurement.
-I
IProgramming
-RFSTOP
Query
Response
The response displays the current RF stop frequency value.
Figure 6-45. -RFSTOP Query Response Syntax
6-63
-I
Programming
Use the -SLOSS command to correct for the dB loss values that exist between
the input of the device under test and the noise source.
This loss exists during the calibration procedure and during the measurement.
Figure 6-46. XLOSS Syntax
Description
Item
Default Value
0 . 0 0 dB
Default Units
dB
Range
- 9 9 . 9 0 t o +99.90 dB
Prerequisite Command -NFMOOE
Related Commands
Description
-INlOSS, -0UTLOSS
Use the SLOSS command to enter or query the dB loss value located at the
noise source used in the measurement system, as illustrated in Figure 6-47.
The loss value is based on cables and other loss factors that are required in
the measurement system.
6-64
-I
IProgramming
-SLOSS
LTS
HED
I N P U T 50fl
NOISE
pa780
SOURCE
LOSS
Figure 6-47. location of Noise Source loss Characteristic
Example
Program
20 OUTPUT 718;"-NFMODE;"
30 OUTPUT 718;"-DEFAULTS;"
4 0 O U T P U T 718;"mPTS 3 ; "
50 OUTPUT 718;"mFSTART 300MHZ;"
60 OUTPUT 718;"-FSTOP 1200MHZ;"
70 OUTPUT 718;"-INLOSS 2DB;"
Turn on noisejigure measurementspersonality mode.
Set all measurement conftguration parameters to
default values.
Set the number of measurement points to 3.
Set the non-conversion mode
start frequency to 300 hhYz.
Set the non-conversion mode
stop frequency to 12OOMHz
Enter the 2 dB loss that
exists in the measurement
setup, following calibration, and is present at the
input of the device under
test.
6-65
-I
IProgramming
-SLOSS
80 OUTPUT 718;"-0UTLOSS 3.2EDB;"
90 OUTPUT 718;"-SLOSS O.lDB;"
100 OUTPUT 718;"-CAL;"
110 OUTPUT 718;"DONE?;"
120 ENTER 718;DONE
130 DISP "CALIBRATION DONE, PRESS
CONTINUE WHEN READY TO MEASURE."
135 PAUSE
140 OUTPUT 718;"-MEASURE;"
150 OUTPUT 718;"sGLVL -1ODB; -GSCALE 10DB;"
160 OUTPUT 718 #*"-NFLVL O D B ; -NFSCALE 5DB 9.
II
Enter the 3.2 dB loss that
exists in the measurement
setup, following calibration, and is present at the
output of the device under
test.
Enter the 0.1 dB loss that
exists in the measurement
setup, following calibration, and is present at the
output of the noise source
used in the measurement.
Calibrate the measurement
setup.
Query the spectrum ana
lyzer for the calibration
routine status.
Get the status condition.
Display the calibrationdone message.
Wait for the key to be pressed.
Set the gain trace reference level to -10 dB Set
the scale for the gain trace
to 10 dB per division.
Set the noise figure trace
reference level to 0.0 dB
Set the scale for the noise
figure trace to 5.0 dB per
division.
170 END
Query Response The response displays the current output loss value being used for
measurement calculations.
6-66
I-
-I
Programming
-SLOSS
Figure 6-48. -SLOSS Query Response Syntax
6-67
-I
IProgramming
-TBW
Use the -TBW command to enter the time bandwidth product for use in
measurements.
kHz-seconds
/
\
Figure 6-48. -TBW Syntax
L
Descriution
Item
Default Value
500 kHz-s
Default Units
kHz-s
Range
1 t o 16,ClOtl kHz-s, o r 1 t o 9 9 9 x B W [in kHzl - w h i c h e v e r i s l e s s
Prerequisite Command -NFMOOE
Related Commands
Description
-TBWAUTO. - B W
Use the -TBW command to enter or query the time-bandwidth product. The
time-bandwidth product is used to calculate an averaging time appropriate for
a given measurement bandwidth when TBW AUTO mode is selected. Refer to
the -TBWAUTO command.
The time-bandwidth product affects the measurement-to-measurement
repeatability. An increase in time-bandwidth reduces the repeatability error.
Example
Program
10
OUTPUT 718; “-NFMODE; ”
20 OUTPUT 718; “-DEFAULTS;”
30 OUTPUT 718;“mTBW 300;”
40 OUTPUT 718; “-CAL; ”
6-68
Select the noisefZgure and
gain measurements m ok
Set all measurement configuration parameters to
default values.
Set the time-measurement
bandwidth value to 300.
Calibrate the measurement
setup for the new parameters.
-I
Programming
-TBW
Query the spectrum analyzer for the calibration
routine status.
60 ENTER 718;DONE
Get the status condition.
70 DISP "CALIBRATION DONE, PRESS Display the calibrationCONTINUE WHEN READY TO MEASURE."
done message.
Wait for the key to be pressed.
7 5 PAUSE
80 OUTPUT 718;"-MEASURE;"
Make a calibrated noise
jigwe and gain measurement.
50
OUTPUT 718;"DONE?;"
90
END
Query Response The response displays the time-bandwidth product used when auto mode is
selected.
Figure 6-60. -TBW Query Response Syntax
6-69
-I
IProgramming
-TBWAUTO
Use the -TBWAUTO command to select either automatic or manual
time-bandwidth mode for use in measurements.
Figure 6-51. -TBWAUTO Syntax
I
Item
Description
I
Default Value
1 IONI
Default Units
none
Range
1 ION1 o r 0 IOFF
Prerequisite Command -NFMODE
Related Commands
-TBW, -SW, -AVGTIME
Description Use the -TBWAUTO command to enter or query the measurement
time-bandwidth mode. The automatic tune-bandwidth mode provides an
automatically calculated averaging time. The calculations are derived from
the time-bandwidth product divided by the measurement bandwidth.
Example
Program
10
OUTPUT 718; “SNFMODE; ”
20 OUTPUT 718;“-DEFAULTS;”
30 OUTPUT 718; “-TBW 300; ”
40
6-70
OUTPUT 718 ; “-TBWAUTO 0 ; ”
Select the misejigure and
gain measurements mode.
Set all measurement configuration parameters to
default values.
Set the time-measurement
bandwidth value to 300.
Set the averaging time mode
to manual.
-I
IProgramming
-TBWAUTO
45 OUTPUT 718;"-AVGTIME 1;"
50 OUTPUT 718;"-CAL;"
60 OUTPUT 718;"DONE?;"
70 ENTER 718;DONE
80 DISP "CALIBRATION DONE, PRESS
CONTINUE WHEN READY TO MEASURE."
85 PAUSE
90 OUTPUT 718;"-MEASURE;"
Set averaging time to 1
second per measurement
point.
Calibrate the measurement
setup for the new parameters.
Query the spectrum analyzer for the calibration
routine status.
Get the status condition.
Display the calibrationdone message.
Wait for the key to be pressed.
Make a calibrated noise
$gure and gain measurement.
100 END
Query Response The response displays the current time-bandwidth measurement mode. If a
1 is returned, the mode is automatic. If a 0 is returned, the mode is manual
and the measurement time and bandwidth settings are determined by you.
Figure 6.52. -TBWAUTO Query Response Syntax
6-71
-I
Programming
-TEMPC
Use the -TEMPC command to enter the Celsius case-temperature value of the
noise source used for making measurements.
Celsius
temperature
/
\
Figure 6-53. -TEMPC Syntax
Item
Description
Default Value
21°C
Default Units
>c
Range
- 2 7 3 . 0 ’ t o 999.O’C
Prerequisite Command -NFMODE
Related Commands
ione
Description Use the -TEMPC command to enter or query the case temperature of
the noise source being used for measurements. The case temperature is
determined by the temperature of the environment where the measurements
are being made.
Example
Program
20 OUTPUT 718; “-NFMODE; ”
25 OUTPUT 718; “-DEFAULTS;”
4 0 O U T P U T 718;“-FCONV 1 ; ”
45
6-72
OUTPUT 718 ; “-LABEL ; ”
Turn on noisejigure masurernents personality mode.
Set all measurement con&uration parameters to
default values.
Turn the frequency conversion mode ON.
Redraw display annotation for frequency conversion mode measurement
state.
-I
Programming
-TEMPC
50 OUTPUT 718;"sIFSTART 400MHZ;"
60 OUTPUT 718;"-IFSTOP GOOMHZ;"
70 OUTPUT 718;"sRFSTART 650MHZ;"
80 OUTPUT 718;"-RFSTOP 850MHZ;"
9 0 O U T P U T 718;"sTEMPC 1 9 ; "
100 OUTPUT 718;"-CAL;"
110 OUTPUT 718;"DONE?;"
120 ENTER 718;DONE
130 DISP "CALIBRATION DONE, PRESS
CONTINUE WHEN READY TO MEASURE."
140 OUTPUT 718;"-MEASURE;"
150 END
Set the frequency conversion measurement IFstart
frequency to -400 MHz
Set the frequency conversion measurement IFstop
frequency to 600 MHz The
span is 200 MIX. and must
equal the RF start and
stop frequency span.
Set the non-conversion mode
start frequency to 650 MHz.
Set the non-conversion mode
stop frequency to 850 MHz,
which results in a span
equal to the IFfrequency
span of 200 MHz.
Enter the case temperature of the wise source as
19°C.
Calibrate the system for
measurements.
Query the spectrum analyzer for the calibration
routine status.
Get the status condition.
Display the calibrationdone message.
Make a calibrated noise
figure and gain measurement.
Query Response The response displays the current temperature selected
Figure 6-54. -TEMPC Query Response Syntax
6-73
-I
I-
Index
-I
I-
Index
A amplitude editing in ENR table, 3-17
average time control, 3-5
B bandwidth setting, 3-5
C
calibrating, 3-5
calibration escape, 3-5
card memory, saving states, 3- 19
caution
the caution symbol, viii
completing ENR data editing, 3-10
configuration default setting, 3-8
conliguring for measurements, 3-7
D deleting ENR data, 3-10
delta markers, 3- 13
displays in card memory , 3-6
E editing ENR data, 3-10
editing point in ENR data table, 3-17
ENR data to card, 3-7
entering DUT gain, 3- 11
entering DUT noise figure, 3-11
entering ENR estimation, 3- 11
entering external losses, 3-11
entering gain reference level, 3-12
entering gain scale, 3-12
entering IF start frequency, 3-12
entering IF stop frequency, 3-12
entering input losses, 3-13
entering noise tigure reference level, 3-15
entering noise figure scale, 3- 15
entering noise source serial number, 3-18
entering non-conversion start and stop frequencies, 3-18
entering preamplifier gain, 3-16
entering RF start and stop frequencies, 3-17
entering test limits, 3-19
entering test system noise figure, 3- 11
entering time and measurement resolution bandwidth values, 3-19
erasing the personality, 3- 10
Index-2
I-
-I
error messages, 5-3
external loss data entry, 3-11
F features, x
frequency conversion control, 3-7
frequency editing in ENR table, 3-17
frequency marker, 3- 14
G gain, DUT, 3-11
gain reference level, 3- 12
gain reference level and scale, 3-17
gain scale, 3-12
general safety considerations, ix
H HP 8590 series operation vs 859XE series operation, I-2
I IF start and stop frequency, 3-12
input losses, 3-13
instrument display to card, 3-6
instrument function differences, I-2
instrument state to card, 3-7
internal memory, recalling ENR data, 3.13
internal memory, recalling states, 3-13
internal memory, saving ENR data, 3.11
internal memory, saving states, 3-19
L losses at the noise source, 3-18
M main menu keys, 3-14
marker delta, 3-13
marker frequency, 3- 14
marker functions, 3-13
marker normal, 3-14
markers off, 3-14
maximum gain limits, 3-12
measurement bandwidth, 3-5
measurement configuration, 3-7
measurement features, x
measurement personality messages, 5-3
measuring menu, 3- 14
memory card ENR data, 3-7
memory card, saving display states, 3.10
memory cards, saving ENR data, 3-10
menu map, 3-3
minimum gain limits, 3-12
Index-3
-I
I-
N noise ligure, DUT, 3- 11
noise figure reference level, 3- 15
noise figure reference level and scale, 3-17
noise figure scale, 3-15
noise figure, test system, 3-11
noise source model number, 1-2
noise source serial number, 3- 18
noise source temperature data, 3-18
non-conversion start and stop frequencies, 3-18
normal marker function, 3-14
0 operating messages, 5-3
output loss data entry, 3-15
p personality menu map, 3-3
points, deleting ENR data points, 3.10
preamplifier gain data, 3-16
preamplifier model number, l-2
purging the personality, 3-10
R recalling display states, 3-6
recalling ENR data, 3-7
recalling ENR data from internal memory, 3-13
recalling states, 3-7
recalling states from internal memory, 3-13
recommended noise source, l-2
recommended preamplifier, 1-2
repeatability calculator, DUT gain, 2- 11, 3- 11
repeatability calculator, DUT noise iigure, 2- 11, 3-11
repeatability calculator, ENR, 2-l 1, 3-11
repeatability calculator measurement points, 2- 11, 3- 16
repeatability calculator, test system noise figure, 2-l 1, 3-11
RF start and stop frequency, 3- 17
RPG title mode, 3-17
S safety, ix
safety symbols, viii
saving display states on the card, 3.10
saving ENR data to internal memory, 3.11
saving ENR data to memory cards, 3- 10
saving instrument states to internal memory, 3.19
saving instrument states to memory card, 3-19
self test, 3-18
setting configuration defaults, 3-8
setting reference level and scale, 3-17
software product license agreement, iii-7
Index-4
-I
I-
source loss, 3- 18
states in instrument memory , 3-7
sweeping, single or continuous, 3- 18
system calibration, 3-5
T temperature, noise source, 3-18
terminating ENR data editing, 3-10
test limits, minimum and maximum, 3-19
time-BW product, 3-20
time-BW values, 3- 19
titling measurements and traces, 3- 17
U using the frequency menu, 3-12
using the help time-bandwidth menu, 3-12
V verifying specifications, 4-5
JJT warning
the warning symbol, viii
warranty, vi
Index-5