1
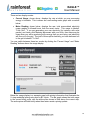
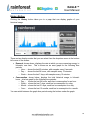
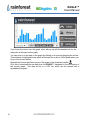
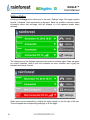
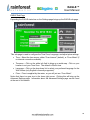
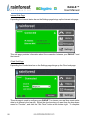
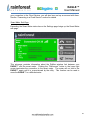
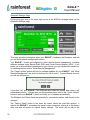
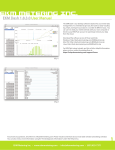
EAGLE™ User Manual History Button Clicking the History button takes you to a page that can display graphs of your historical usage. There are two display modes that you can select from the dropdown menu in the bottom left corner of the screen: Demand, shown above, displays the rate at which you are consuming energy, in kilowatts, over time. This is shown as an area graph for the following time periods: o Hour – shows the last 60 minutes, with samples every 8 seconds. o Day – shows the last 24 hours, with samples every 15 minutes. o Week – shows the last 7 days, with samples every 15 minutes. Consumption, shown below, displays the total historical usage, in kilowatthours, as a bar graph for the following time periods: o Day – shows the last 24 hours; each bar is consumption for an hour. o Week – shows the last 7 days; each bar is consumption for a day. o Month -- shows the last 31 days; each bar is consumption for a day. o Year – shows the last 12 months; each bar is consumption for a month. You can switch between the graph time periods using the buttons under the graph. 15