1
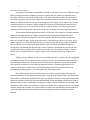
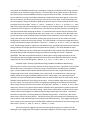
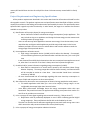
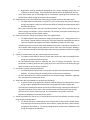
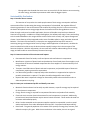
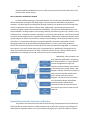
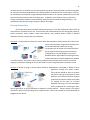
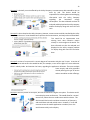
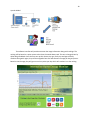
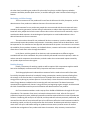
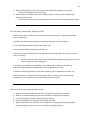
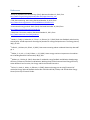
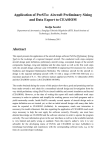
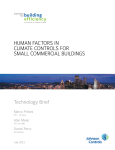
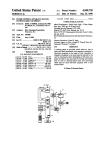
1 Interactive Home Energy Monitor MECHENG 589 Fall 2013 Prof. Steven Skerlos TEAM 881-9 Alexandre Kobuti Cody Berman Deepankar Thakur 2 Executive Summary According to EIA, average US household consumed 11,320 kWh of electricity in 2009 with about 66% of it being consumed by appliances, electronics, lighting and such.i(Electricity explained: Use of electricity, 2012) Our surveys confirmed the theory that most residential consumers are not aware of how much energy they use and where it goes. We extended our study to include consumers in Brazil in addition to USA and had similar findings. Not knowing where the energy is used, makes it hard to focus conservation efforts. For example, people replace their lamps with CFL bulbs because they are told it conserves energy, but are not clear where to look for savings elsewhere. Currently energy monitors available in the market only offer a partial solution and are not widely in use over long period of time. The Interactive Home Energy Monitor works to fill this gap in the market by providing customers additional knowledge about their energy consumption and encouraging sustainable behavioral adjustments to curb electric energy use. This device measures the amount of power coming into a home, and records this data. Energy usage information is transmitted to a server in real-time. Using either a website or a mobile application, the user can see their up to date energy usage and historical data. In addition to just displaying the data, the device will rely heavily on software intelligence. Ethnographic data showed that potential users are not confident in which devices consume the most energy in their house, and what device replacement would result in the greatest savings. In order to address this, the software will have a mode to help the user characterize the energy usage of each device. Adding rankings in addition to the social networking aspect of it, will allow users to stay engaged over longer period of time compared to other solutions currently in the market place. We see a shift in the market place based on the increased number of offering by utility and security system companies offering online connectivity to home lighting, appliances and such. TED, the energy detective is a product in the market currently that has quite a few features similar to ours but lacks the social networking and ranking aspects. ii (TED: Start measuring. start saving, 2013) Our product was the result of brainstorming various ideas on home energy monitoring and potential methods of collecting and transmitting data. Using the Pugh selection matrix, we selected the optimal solution and based on feedback from instructor and others that we surveyed, we developed the options and software interface to meet the need identified. Sustainable design principles were used to design the device to keep it ecofriendly. The design is modular and minimal options are provided in the hardware to keep it simple. The enclosure is snap on style design with no displays or buttons to keep the assembly simple and recyclable. The system intends to change consumer behavior towards residential electricity usage and help reduce the emissions from power generation plants based on reduced demand. 3 Table of Contents Executive Summary................................................................................................................................... 2 Table of Contents ...................................................................................................................................... 3 Introduction .............................................................................................................................................. 4 Baseline Product Being Improved ............................................................................................................. 4 Design Ethnography .................................................................................................................................. 6 Description of Persona .............................................................................................................................. 6 Project Requirements and Engineering Specifications ............................................................................. 7 Sustainability Evaluation ........................................................................................................................... 9 Quantified Sustainable Evaluation of Baseline ....................................................................................... 10 Concept Generation ................................................................................................................................ 11 Concept Selection ................................................................................................................................... 13 Alpha Design ........................................................................................................................................... 15 Feedback on Alpha Design .................................................................................................................. 16 Final Concept Description ................................................................................................................... 17 Business Plan........................................................................................................................................... 19 Company Description .......................................................................................................................... 19 Market Analysis ................................................................................................................................... 20 Product Description ............................................................................................................................ 21 Marketing and Sales Strategy ............................................................................................................. 22 Funding Strategy ................................................................................................................................. 22 Additional Reflections on Project Outcome ........................................................................................... 23 Project Eco-efficient or Sustainable Design? ...................................................................................... 23 Design Critique .................................................................................................................................... 23 Recommendations .............................................................................................................................. 24 Project Reflections and Future Project Recommendations ................................................................ 24 Acknowledgements................................................................................................................................. 24 Appendix ................................................................................................................................................. 25 References .............................................................................................................................................. 30 4 Introduction Based on questions asked in the ethnography, people believe that their home energy use negatively impacts the environment. Even in countries like Brazil, where a large amount of energy comes from hydroelectric power, some of the respondents acknowledge the environment impacts of deforestation to build hydroelectric dams. Additionally, while respondents were able to guess at what were the most energy intensive aspects of their home lives, they were often not very confident in these guesses. According to the US Energy Information Administration, energy consumption has been increasing steadily in both OECD (Organization for Economic Cooperation and Development) and nonOECD countries. Projections show that from now until 2040, OECD countries will continue to consume additional energy, and non-OECD energy consumption will increase at a far greater rate. It is projected that by 2040, energy consumption worldwide will increase by 56 percent.iii(International energy outlook 2013, 2013) In order to encourage conservation and empower customers with data on their energy consumption, a device, the Interactive Home Energy Monitor, will measure the electric power going into a house. Using a mobile and web-based interface, users will be alerted when there are sudden spikes in usage, will be given an efficiency score based on a number of factors, and will be able to compete with their peers. This Interactive Home Energy Monitor will gather data by measuring current sensor clipped onto mains AC voltage lines within the customer’s existing breaker box. The home energy monitor would then connect to the internet and transfer this usage data to a cloud server. The cloud server would provide data to a web portal and mobile application, showing plots of data to the customer. Interactive features, such as energy conservation tips, comparisons with other users, and an energy efficiency score program, will work to keep users conserving energy in the long term. Baseline Product Being Improved There are several competing devices on the market, such as TED and WattVision, but they do not effectively solve many of the gaps identified. Devices like TED use a screen as their primary method of displaying data to the user. TED devices are internet connected however the web-based tools are very limited. II (TED: Start measuring. start saving, 2013) The Wattvision device attempts to add some social aspects to their device, by having user rankings. However, these rankings are quite rudimentary and do not take in to account the temperature, size, or other important factors. iv (Wattvision: Consumer products, 2013) Based on ethnographic research, the majority of people do not have a clear understanding of where their energy is going. With that lack of basic knowledge, it is clear that a display showing kilowatts of energy consumed is not going to mean much to the average consumer. As such, it is essential that the Interactive Home Energy Monitor display relevant, easy to understand data that encourages long term use. The device will need to be simple to install and most of the benefit will come from the software interface which will allow users to understand their usage and work towards conserving energy in their daily actions. The ability to visualize usage and get alarms directly on the mobile computing devices will bring the biggest benefit to the user. We have also designed the ranking system to be weighted to assign ranking based on individual consumer usage versus aggregate usage which can be biased by family size and location. The most concerning consideration for this device is whether or not it actually affects energy usage among its users. Fortunately, there have been several studies regarding the topic. The journal 5 article, Real-time feedback and electricity consumption, looked at a study where 1065 energy monitors were given out to residential energy customers. Of those 1065, 752 were given access to the monitor data, and 313 were control candidates and were not given access to the data. The data showed a 5.7 percent reduction in energy consumption between the experimental and control groups. In this study, after three months, the control group was given access to the monitor data. It was interesting to see the control group’s energy consumption significantly decrease after the three month point where they were given access to the data.v (Houde, S., Todd, A., Sudarshan, A., Flora, J. A., & Armel, K. C., 2013) With time, both groups end up settling out to a consistent level of energy usage. This is interesting as it indicates that as time goes on, the effectiveness of the device may decrease, and this is something that must be considered when designing the device. It is essential that the device keep the interest of the user and continue to drive energy conservation for its time in use. An Austrian study, discussed in the journal article, Does smart metering reduce residential electricity demand?, shows similar data. In this study, there were over 1500 households, and they were given the choice to have access to the data through either a web portal or physical mailings. This study showed a 4.51 percent average decrease in energy consumption among its participants.vi (Schleich, J., Klobasa, M., & Golz, S., 2012) An additional study, Home energy monitors: impact over the medium-term, specifically discusses the use of home energy monitors of a longer period of time (more than 4 months). This study showed an initial decrease of 7.8 percent, but this saving was not sustained for the entirety of the fifteen moth study. This study did note that residential energy use has been increasing at a rate of 3.4 percent worldwide. Even with more efficient devices in recent years, energy usage continues to arrive. They also note that more highly motivated consumers have more significant decreases in energy usage than the rest of the pilot group.vii (Bakker, C. A., Hal, v., J.D.M., & Dam, v., S.S., 2010) A broader report, Overview of Residential Energy Feedback and Behavior‐based Energy Efficiency, does a review of the current research on home energy monitors. They found a zero to fifteen percent decrease in consumption of electrical energy. They also discuss the differences in feedback types. Indirect feedback is described as detailed utility bills that are sent out periodically after the energy usage has occurred. Direct feedback, on the other hand, is considered to be a home energy display, where the user gets immediate feedback on their energy usage. This report explains that research has shown that while indirect feedback does see some positive results in some studies, direct feedback shows significantly more energy conservation. Privacy and data usage concerns are brought up in this report. Currently there are little to no regulations regarding the use of data collected from home energy monitors and smart utility meters by companies.viii (Mahone, A., & Haley, B., 2011) Data and privacy concerns in any home monitor device should be clearly presented to customer and should allow for the user to opt-out of any data sharing. Finally, Parker, Hoak, Meier, and Brown discuss some common devices and strategies for residential home energy monitoring in their report. They discuss two devices in particular, The Energy Detective (TED) and Energy Viewer. In both cases, they found power errors to be less than 10 percent. They discuss that as the user becomes more motivated, they may be able to trend towards having a zero energy home (ZEH) when away. They suggest watching the home energy monitor and turning on and off breakers and devices to determine how much energy each device uses.ix (Parker, D., Hoak, D., Meier, A., & Brown, L., 2006) The current research suggests that there are some significant gaps in the market to fill. By keeping the user engaged with social aspects and mobile integration, a home energy monitor may be 6 able to successfully avoid the energy conservation drop off that most studies have found after several months. Additionally, by adding a competitive aspect to the device, the interest of users may by maintained for a longer period of time. With these studies, the users were generally randomly selected, and were not all motivated. By marketing to motivated and environmentally conscious customers, energy use decreases may be more significant than what was found in these studies. Design Ethnography From the interviews, it was possible to draw some conclusions. First, there´s a common interest on acquiring a system that would help them reduce energy consumption. Additionally, there were some technical challenges, especially in the Brazil interviews. The married couple that spends much more energy when compared to the other family interviewed, doesn´t own state-of-the-art gadgets such as smart phones, and also is not well familiarized with social networks. That may indicate some roadblocks to reach potential users/clients that don´t deal very well with mobile access, or technological devices. There were also some wide ranges on the financial questions. Although people were not sure, they did suspect lighting, appliance and HVAC to be the key contributors to their electric bills monthly. Our surveys conducted in US involved families of varying size living in homes and apartments in various US cities. It was obvious to us that most users did not know how much electricity they were using and where it went exactly. The bill at the end of the month may or may not reflect the actual usage as people on budget plans get a flat amount due each month which spreads the cost of varying use over the whole year. Being able to see the actual usage and compare it with neighbors would provide a beneficial service to the users who are interested in reducing their usage and leading a more “greener” lifestyle. Most of the participants were willing to spend about $100-150 on the gadget and are also willing to pay a small monthly fee (approximately $10) for this service. Additional interviews found that most households have some idea on what they might do to improve energy consumption in the future, but are not sure on what methods would be the most effective. Those that were questioned did believe that their electric energy usage negatively impacts the environment. Some of the respondents from Brazil did point out that a large percentage of their energy comes from hydroelectric energy sources, but one of the people questioned pointed out the deforestation that occurred to facilitate the construction of these dams. Generally, those that were questioned were willing to spend more for a device with internet and social media capabilities. For the most part, people were not willing to have to plug the device into a computer and upload the data manually. Installation was also brought up in the questions. For the most part, people are aware of where their breaker boxes are, but may not be comfortable with the installation process on their own. There was some indication that detailed instructions would help to make the user more comfortable. Description of Persona The persona for the Interactive Home Energy Monitor is Bill, a middle class American professional. He is married and owns a single family home in suburban Michigan. He is energy conscious, and wants to make sure that the environment that they enjoy spending time in is available for their children to enjoy. He is technologically savvy, but isn’t quite sure where to begin with the daunting task of decreasing their energy consumption. Bill has a smartphone, and uses social media websites to keep in touch with family, friends, and co-workers. In addition to the environmental 7 reasons, Bill would like to minimize his utility bills to have a little extra money around while his family grows. Project Requirements and Engineering Specifications All the product requirements described in this section were based on information collected from the ethnographic research. The product requirements and specifications were identified as follows, with the respective correlation to the findings of the observations performed by the team. The specifications were quantified with regards to product functionality. In other words, the target is to maximize the features available on our product: A) Identification of the major players for energy consumption: a. Device shall have a mode to characterize energy consumption of major appliances. This may include turning on an appliance and having the home energy monitor measure the resulting increase in energy usage. - Users are not aware of which appliances consume more energy. From the interviews, it was noted that they could guess which appliances would be major load centers in the house. Software procedure for user to turn on and off devices and have the software record the energy usage of that particular device B) Home appliances utilization control: a. High energy consumption devices (>1kWh) shall be able to be detected. For example, current monitoring device on a pool heater breaker could alert the user if it is on all of the time - It was observed from AEIOU Style observations that users sometimes leave appliances turned on, when there’s no need for it. So there is always some level of power being drawn. C) Periodical and/or instant information regarding energy consumption (in kWh): a. Data shall be transmitted to a central server owned by the Interactive Home Energy Monitor Company. The energy usage data shall be shown instantly, and historical data will be recorded to review at a later date. Data recorded should have a minimum resolution of 100 Wh. - All users demonstrated lack of knowledge regarding their own electricity consumption in terms of kWh and comparison to others around them. D) Alarm feature for abnormal or overconsumption of electrical energy outside the usual pattern: a. The mobile application shall allow for a user to be notified if energy usage is a user configurable percentage higher than historical values. - Users didn’t demonstrate knowledge about the energy consumption within their own households. They would not know if an appliance was drawing more power than usual or if it was left on by accident over some time. E) Links or pop-ups of news digest regarding environmental issues (e.g. “Did you know?”) a. Notifications shall be periodically displayed on user’s device indicating general helpful energy usage tips. These notifications shall be able to be disabled by the user. - The idea is to raise the level of awareness regarding environmental issues among users. Users didn’t seem to be really concerned about those issues (Social Impact). F) Links or pop-ups of energy consumption reduction initiatives: 8 G) H) I) J) K) L) a. Notifications shall be periodically displayed on user’s device indicating specific tips and initiatives to reduce energy. These notifications shall be able to be disabled by the user. - Users demonstrate lack of knowledge and are inconsistent regarding what initiatives they would take to reduce energy consumption (Social Impact). Database where users could share their own energy reduction initiatives with other users: a. The IHEM software shall feature a section for user’s to submit tip and tricks for reducing energy consumption. Other users will have the ability to comment and indicate how useful the particular tips are. - Most users hesitated when they were questioned about what actions could be taken to reduce energy consumption in their households. This feature would help disseminating the information among the users (Social Impact). Feature to rank your energy consumption within the neighborhood: a. The IHEM software shall generate an energy consumption score. Using factors such as size of house, regional climate, and country, the scores should be normalized such that all users can compete and compare with others regardless of location or house type. - Considering the access rate to social media websites from users, consumption comparison to other people could stimulate energy reduction actions from users (Social Impact). Making it in to a competition would introduce gaming mindset and may make the activity fun to engage in. Feature to estimate electricity bill, maintaining historical records: a. The software shall allow for the user to enter their utility rates, and an estimated electric energy cost shall be displayed to the user - All users demonstrated concerns regarding the costs of energy consumption. They are perceptive to knowing what their bill is going to be at the end of the month before they get there. (Preventive versus reactive behavior) Interaction to utility companies databases: a. The IHEM software shall provide or use an API to be able to interface with utility company websites. This should allow for viewing of bills and smart meter monitoring. - All users admitted that the utility companies do not provide enough information regarding their own electricity consumption levels. Association with home builders for product merchandising: a. A special version of the application software shall be designed to characterize a home’s energy usage to prepare data showing how energy efficient a home is before sale. - The interviews showed some people are concerned about energy consumption efficiency at the time of purchase of their house. Also the home constructor mentioned home energy efficiency to be a future marketing trend. As a consequence, this product could help improve marketability of new construction homes. Software procedure for user to turn on and off devices and have the software record the energy usage of that particular device a. The device shall have a mode where users walk around the home with a mobile device. They shall type in the name of a device, select a button, unplug the device, select a button, and plug the device back in. The energy change shall be recorded into a database as the energy consumption of said device. 9 - Ethnographic data showed that users were not sure which of their devices were consuming the most energy, and what improvements could make the biggest impact. Sustainability Evaluation Step 1: Describe the use context The intention of our product is to make people aware of their energy consumption and foster conservation efforts. By decreasing the energy consumption of a household, the negative effects of electricity generation on the environment will be reduced. By utilizing the user’s internet connectivity, the device will upload current energy usage data to the Interactive Home Energy Monitor servers. Either through a web portal or mobile application, the user will be able to see both up to date and historical energy usage. In addition to simply showing data, the software will assign a score and ranking to the household based on their usage relative to other factors such as family size, square footage and climate. Smart features will be integrated to alert users of sudden spikes in usage, and other abnormal behavior. The intent of these feature is to keep the user engaged and to keep their interest in conserving energy over long period of time. By using a mobile application or web portal, it enables the entire household to be able to use the device without actually having to be in the same part of the house as the device. With this information, the users will have a better understanding of their energy usage, and will be able to more effectively decrease their usage. Step 2: Create an overview of the environmental impacts Raw materials: Plastic for bezels, small steel pieces and small electronic components. Manufacture: Injection of plastic bezels and production of small steel pieces from suppliers, and the purchase of electronic standard components also from suppliers. In house assembly line of energy monitor. Transport: Local fabrication of plastic and steel components, and possible import of electronic components, requiring overseas transportation. Use: No ancillary product is required, and product installation is supposed to be simple. No periodic maintenance is required. The device should be designed for ease of repair. Disposal: No reuse is expected. A design for disassembly needs to be considered in order to allow components recycling. Step 3: Create your environmental profile and identify root cause Materials: Plastic and steel can be easily recycled. However, a specific strategy may be required for the electronic components. Energy: Electric energy is required for components fabrication and product final assembly. Chemicals: Anti-corrosion chemical treatment for steel components is required. Additionally, printed circuit board manufacture require several caustic chemicals. These need to be used at a minimum and handled properly. Other: Product assembler and component suppliers need to be responsible in order to avoid worker exploitation from under developed countries (CSR – Corporate Social Responsibility). Root Cause: The general population is not aware of the quantity of energy they consume, and where the majority of it goes. With the current devices in the market, there is not a good 10 method of effective feedback to the user, and they tend to lose interest and revert back to old behavior after several months. Step 4: Sketch the stakeholder-network In order to effectively design a sustainable product, it is essential that stakeholders be identified and consulted often throughout the design stages. The most obvious stakeholders are potential customers. By observing and consulting with potential customers, the product can be fine-tuned to be meet the expectations of the future customer base. Additionally, manufacturing companies and component suppliers need to be considered as stakeholders. Even the most sustainable device is not that sustainable if its design requires a very energy intensive manufacturing process or is made in a very inefficient plant. Component suppliers, especially on an electronic device like this, need to be consulted to make sure that components are manufactured sustainably. Additionally, component suppliers can be a good resource for failure rates and failure modes, so that the design can be properly vetted to prevent early failure. Transportation and logistics companies should be consulted as stakeholders so that packaging dimensions can be optimized for shipping efficiency. Further, repair and maintenance technicians should be consulted, so that the device can easily be repaired and upgraded. It is essential that a device is not simply thrown away after a component failure. Additionally, selling parts to the repair and maintenance community can offer a secondary revenue stream. Recyclers should also be stakeholders for the design so that end of life concerns can be properly addressed. Additionally, utility companies are very important stakeholders. By working with utility companies, it may be possible to work out agreements to get user referrals, possible subsidies, and a partner in the existing home energy market. App designers will also need to be consulted, in order to ensure that the hardware and server infrastructure are properly designed. This device relies very heavily on its application design and software. Internet providers should also be consulted to make sure that this device will not have any technical issues on their networks. Quantified Sustainable Evaluation of Baseline The product’s environmental impact will be assessed using a quantitative life cycle assessment technique. We can utilize SimaPro to model the device and its path from creating to use to disposal to understand the complete impact. Due to time limitation during this term, we were unable to create a 11 model on SimaPro to visualize this cycle and quantify the impact. We may be able to utilize existing data for consumer household usage devices like internet-modems to determine the overall impact. In theory the manufacture of the device, usage and disposal will be similar to an internet-modem which has a PCB enclosed in plastic enclosure with some steel parts. In addition to the SimaPro analysis, beta user’s energy consumption could be monitored before having the device and while having the device. This would help to quantify the energy savings the device encourages. Concept Generation All concepts were generated from Brainstorming sessions. They were defined in order to offer as many features as possible to the user. These features were defined based on the ethnography research, where conclusions about peoples´ needs and behaviors were drafted. Below, follows a detailed explanation of each concept that was considered: Concept A is a system which consists of a sensor and a data acquisition-communication box. The current sensor monitors power usage thru the breaker box. All the collected information from energy consumption will be stored at the data acquisition box and transmitted using internet connectivity (Cable/Wifi) to a central database. The central database will be responsible for analyzing the data, and the generation of reports displayed via website or mobile interface. This system can be also be configured using multiple current sensors to monitor usage by each breaker allowing the user to drill deep in to their usage and better analyze the trends. Concept B consists of plug-in devices which would be independently connected to different home appliances through the power outlets. These devices would be able to measure the electrical energy consumption for each appliance and communicate with the data acquisition box which would be responsible for sending out the data to a Central Database Processing. The central database will be responsible for analyzing the data, and the generation of reports displayed via website or mobile interface. Unlike Concept A, this device would be a device that would plug into a standard outlet. Devices that would be monitored would be plugged into the device. 12 Concept C is basically a service offered by the Utility Company. A measurement device would be sent to users by mail. This device would be responsible for collecting data and exchanging information with the Utility Company regarding the household energy consumption. The data collected can then be analyzed and displayed at the utility company website for display along with user’s bill and such. Concept D is also related to the Utility Company. However, a smart meter would be installed by the Utility Company to the users´ house breaker box to perform the measurements, and analyze the collected data. This would be an improvement over existing basic data collection meters already in use throughout the world. The data collected can then be analyzed and displayed at the utility company website for display along with user’s bill and other data. Concept E consists of a system with a certain degree of interaction with the user´s home. It consists of several cameras and sensors that would be able, for example, to turn-off the lights of a room whenever there´s nobody inside. And monitor the house, regarding the appliances utilization. There are multiple home security and utility providers already offering this type of service and we can add on to their offerings. Concept F was fairly similar to Concept A, but was envisioned as a higher cost option. The device would have a display screen and buttons. This would allow for a central control unit, where the user could interact with the device. This device would also have the wireless connectivity of Concept A, and would have web and mobile access. However, if a user did not want to use the mobile application or website, he or she could interact with just the display. 13 Concept G was a device for commercial users that would be marketed homebuilders and consumer product manufacters. The device would provide an easy way to characterize the energy consumption of a single device or home. The homebuilder or product manufacturer could use our software to generate an energy consumption score and use it on their marketing material. Concept H was to simply offer software services to energy utilities. By developing algorithms to identify energy usage patterns, our software could help differentiate a utility company and decrease both base and peak loads. Concept I was primarily a smart thermostat that also had energy monitoring capabilities. In addition to thermostat control, this concept was able to actuate smart HVAC registers. This device took temperature and motion sensors to predict and adjust energy usage. Concept J was a training program offered to construction professionals. The concept was to offer regional training to construction professionals to show them repairs and suggestions they can make to homeowners to reduce their energy usage. This concept would be marketed to consumers as well, and our company would refer interested customers to contractors in their area that had gone through the training. Concept Selection The five best concepts from the above section, A-E, were selected to be compared during the concept selection phase. These five concepts met a wide array of specifications, and seemed most likely to succeed. In addition, some of the concepts not selected because they did not seem to be technically feasible, able to be sold at a reasonable cost, or did not have a large enough market. We used a Pugh chart with a scoring matrix to select a concept to proceed with. The selection criteria were defined based on the ethnography research that has already been performed. Selection Criteria Description: A) Overall cost: It´s the total cost of ownership (device purchase, service fee, maintenance and operating cost, etc.) B) Setup time required: It´s the amount of time required to install and configure the system. C) LCA impact: It´s the environmental impact of the product, from material extraction, through fabrication, use and disposal phase. Most of the devices have similar traditional life cycle impacts as far as production and end of use is concerned. They are all smaller electronic devices. However, from our research, the LCA impact of the device can be seen primarily in the likelihood for the user to conserve energy and keep those savings long term. D) Use-ability: It’s the capacity to satisfy users´ needs. Also, it´s the product capability of engaging users to reduce energy consumption. E) Internet Connectivity: It´s the capability of the product to connect to the internet. 14 F) Measurement precision: It´s related to the equipment accuracy to measure the electricity consumed, without variation or error/noise. G) Long Term savings: It´s the effectiveness of the product in collecting and analyzing data to allow users to be aware of their consumption and take actions to reduce it over the long term. H) Feature Availability: It´s the quantity of features and functions delivered by the product. A number of things were taken account into this criteria, however, the primary deciding factor was the software interface available. For concepts D and E, the user would be forced to use the utility company or alarm company interface at some point, so their available features would be limited by those companies’ software implementations. Concepts that use the IHEM software interface, would be focused on providing energy related features and were ranked higher. After having defined the Selection Criteria, they were ranked in terms of importance, and a comparison to the baseline was performed. For each one of the Selection Criteria, a “Weighted Normalised Importance” was assigned according to its weight on the rank (e.g. Importance factor = 9 for the most important criteria, and Importance factor = 1 to the least important criteria). The next step was to compare the concepts to the Baseline according to the table below: 15 For each score assigned during the comparison to the Baseline, the score was multiplied by the weighted normalized importance factor, resulting in the final score for the respective Selection Criteria, for each one of the concepts. For example, on Concept A, a (5) was assigned to “Overall cost”. In this case, the final score was 5, which is equal to 9 (Importance factor for Overall Cost) times 5. As a result of the concept selection process described above, Concept A was chosen. From the perspective of the Overall Cost, LCA impact, Use-ability, and Internet Connectivity, all the concepts were equivalent. On the other hand, Concept A presented advantages regarding the Measurement precision, Long Term Savings and Features Availability. In a nutshell, Concept A was demonstrated to be more capable to precisely collect data, inform and engage the users on the reduction on energy consumption, and consequently generate more long term savings than the other concepts. The user would know exactly which appliance plays the major role in his/her household energy consumption. Also he/she would be aware of his/her consumption related to similar households, and also have knowledge about which efficient initiatives for the reduction of energy consumption could be taken. The only disadvantage for Concept A is regarding the amount of time required to setup the system, which is bigger when compared to the other concepts´ setup time. This concept would require the user to be comfortable with home repair or would need to hire a professional to install. Alpha Design IHEM hardware will comprise of a Data Acquisition and Communication (DAC) module that will be located near the breaker box of the residential unit. There is a current sensor that clamps on the main line coming to the breaker to collect that data and it is tied in to the DAC module using cables. There will be an AC-DC transformer to supply power to the DAC module. Using consumer’s Wi-Fi connection, the DAC module will transmit data to the central server. The central server will house the data for some predefined or user selected limit of time. This server will also host the webpages for PC and mobile platforms. Using a central server will allow us to display comparison of usage data based on address, zip code or house size depending on user preference. 16 On the software interface, we intend to have a display similar to the one shown here. It shows the user their usage profile based on their selection of scale (i.e. by minute, hour, day or month). The type of graph shown is also an option that the user can select (i.e. line, bar or pie chart). The display will also show usage of others in the area. The preferences selected will determine which houses and locations will be used to compare the usage and determine the ranking. We will also give the user the option to feed their stats to social media websites which will allow them to stay engaged. We will offer energy saving tips as well as give the user option to chat with an energy expert about specific ways to save energy. Notification will be pushed to the web portal and mobile application when abnormal energy usage is detected. Additional modes will help walk the customer through characterizing the energy usage of the major devices in their home. A ranking and scoring system will add a competitive aspect to the device by generating a score normalized against external factors such as housing square footage and regional climate. The display interface will be customized to show the same information in different formats based on desktop versus mobile platforms being used. Finally, we will also make IHEM app download available via iTunes and Google Play stores. Feedback on Alpha Design We received direct feedback from the instructor on the design during design expo. His comments regarding rating scheme being biased towards two person family with both partners travelling during the week for work, were noted and taken in to account in determining the rating scheme of the final design. Instead of using cumulative usage as being the rating factor, we will take family size and typical versus unusual usage patterns in to account in determining the point based scoring and ranking system. We also created a survey that was performed by each of the team members in their neighborhood to gather more feedback. After showing the alpha design, the following survey questions were asked: 1. 2. 3. 4. 5. What do you like from what you saw What do you dislike Is this something you would consider purchasing? How much would you be willing to pay? What sort of factors would you like to be included in the ranking setup? 17 a. Are there scenarios where you think you would be discouraged of using the device if you weren’t doing well in the rankings? 6. Are there other features you would like to see integrated into the design? 7. Would you be willing to install this yourself or would you hire a professional to install? 8. What would your motivation be in purchasing this device? The surveys are attached in the appendix section for reference. Most people liked the design and the ability to visualize their consumption along with alarming feature if usual consumption is detected. Most people surveyed did not like the ranking system and wanted ability to drill down to appliance level for usage. Everyone was willing to purchase the device but the willingness to pay varied from $50 to $500. Preference for ranking factors was based on size of house as well as number of users in the house. Most people were not discouraged by ranking system. A common request on a feature to add was the ability to monitor and control appliances remotely. Most people were willing to install the device themselves and the motivation was primarily saving money while doing something good for the environment. Final Concept Description Our final design is similar to the Alpha design. The hardware comprises of a current sensor, data acquisition and transmission module and power supply. Based on feedback on Alpha design, we do intend to provide an upscale model with multiple current sensors to monitor various circuits within the breaker box to allow consumers to drill in to the usage based on circuits. This will still not allow the user to drill down to the appliance level but will help narrow down the usage hot spots. Smart appliances in conjunction with smart grid can provide the level of detail that consumers are asking for. It is not feasible for us to be able to monitor each appliance in the house at this time using this system. Base Model: 18 Upscale Model: The software interface will provide consumer the usage information along with rankings. The ranking will be based on a point system rather than the actual Watts used. This was a change driven by alpha design feedback. Once the user sets up their house size, age, family size and ages of family members along with region, they will be assigned a base line watt amount of usage per day per person. Based on actual usage, they will get more or less points per day which will translate in to the ranking. 19 The mobile phone interface will have the alarming feature in addition to the IHEM interface shown above. It will alert users of unusual usage pattern. The mobile interface ranking display is shown to the right. Even though, there was quite a bit of negative feedback regarding the ranking system, we intend to keep it as we believe that it will keep the consumer motivated and engaged over longer period of time. That is one of the key deficiencies of existing solutions in the market place and will provide us the ability to keep our product competitive over the other offerings. Finally, on upscale model, we will provide additional functionality to name the circuits and ability to compare them individually to see where most of the energy consumption is taking place (e.g. kids room outlets indicating TV or gaming system always on…etc.). One of the biggest challenges to a successful implementation of a scoring system lies with the ability to normalize the scores. It is important that regardless of age, location, home size, etc., all of the users will end up the same even playing field. Although we have some ideas on what factors will play into this normalization, a true algorithm cannot be determined without getting data from a wide variety of households. Business Plan Company Description The vision defined for our business is the designing and marketing of an Interactive Home Energy Monitor (IHEM) to enable the elimination of all electrical energy waste originated from domestic utilization worldwide. Based on the Ethnography Research performed by our team, we were able to draft important conclusions about peoples’ needs and behaviors regarding electricity consumption. In the nutshell, people are concerned with the environmental impacts caused by the energy consumption and generation, but don’t take effective actions to reduce it due the lack of motivation or engagement. People also lack information regarding which steps should be taken first, or what would be the hot spots for energy consumption in their households. 20 For that reason, our product intends to address all these issues besides being just a measurement device like the products offered by the competition. Our product will offer exclusive features to allow users having all necessary information to avoid wasting the electricity consumed by their households. Market Analysis A preliminary SWOT analysis (figure available later in this section) was performed to try identifying what the impacts of internal and external factors for the business would be. The analysis confirmed as very important to our business the strengths and opportunities identified by our team: Exclusive features, ability to engage users, people´s increasing environmental concern and Alliances to relevant stakeholders. The current competitors for our product are home energy monitors are not interactive. Those monitors only measure the amount of electricity consumed by the household. Below, there are examples of existing competitors: A. TED (http://www.theenergydetective.com/) B. Home Energy Monitoring.com (http://www.home-energy-metering.com/home-energy-monitor.html) C. Blueline PowerCost Monitor (http://www.energymonitors.com/product.php?p=blueline-innovations_bli28000&product=175204&category=2353) The SWOT analysis also showed that the weaknesses we have identified play a minor role within the business: Assistance required for system installation and System dependency on internet connectivity. An in addition to that there are important external threats to our business, such as the environmental impacts caused by our system own fabrication process, and the lack of energy savings after long periods of use. 21 Based on benchmarking information, we have defined a target retail price of US$100-US$150. Our team decided to keep the retail price at this level due the evidence found on both Ethnography Research and Alpha Design Validation Interviews. Respondents were directly questioned about the price they would be willing to pay for a system like ours, and most of the answers from respondents gave a price they were willing to pay in the same ballpark as our target. In order to get that price point, we looked at the most costly components in the design. In this case, the major components were considered to be the current sensor, AC to AC wall adapter, microcontroller, and wireless chipset. These components on their own are approximately US$22.50. We estimated that the less costly components, printed circuit board cost, and casing would cost around another US$22.50. We then multiplied that total (US$45) by a factor of three, which should account for labor costs, marketing, development, and transportation. That leaves us with a total retail price of about US$135. Component 200 A Current Transformer AC/AC Adapter Microcontroller Wireless Chipset Manufacturer Part Number CUI Inc Freescale TI Approximate Price in Quantity $4.00 EPA060050-S/T-SZ $3.25 MK20DX128VLH7 $3.50 CC3000MODR $11.78 Total $22.53 Product Description The system´s functionality is expected to create awareness regarding abnormal energy consumption patterns from users, and to reduce their responsibility on managing their home appliances energy consumption. Our system is expected to have a social capability to change people’s behaviors regarding energy consumption. As part of the product validation plan, we presented the Alpha Design to some potential users, and the feedback was positive regarding the features that are going to be offered and whether the customers would buy a system like ours or not. There are some suggestions regarding other additional features, like availability of online payment for electricity bills, and the addition of some reward system for the energy saving raking, based on alliances with potential sponsors. On the other hand, there were some dislikes regarding the privacy of personal information being shared with other people through the users ranking feature, and also some lack of interest regarding the online database for the sharing of energy saving ideas. At least one year will be required before our product becomes available. The outsourcing of an assembly supplier, the development of suppliers for the sub-components and the implementation of a retail sales network and an e-commerce strategy are the main tasks that drive the timing schedule, and need to be carefully planned and executed. And an uncertainty regarding the future for our product is its usage in the long term. Although we have included features in our product to try engaging customers to keep reducing their energy consumption level continuously, there´s a certain uncertainty whether that would work for long periods of time, or whenever the minimum electricity consumption required for a household is reached. At that point, users’ motivation from the continuous energy savings, month after month, will no longer exist. On 22 the other hand, considering our product life cycle end-of-use phase, we didn’t figure out whether customers would buy another equal monitor, or would be willing for other kind new of technology or feature. Marketing and Sales Strategy The first customers for our product will come from the alliance with Utility Companies, and the advertisement of our product on websites that caters for environmental issues. Ideal customers for our product are people who are concerned with the environmental issues caused by electricity generation, and are willing to take actions to reduce those impacts but just don’t know how. Also, people who have the same concerns but are short of some kind of motivation, may be considered as ideal customers. A certain degree of participation on social media websites is also a desired characteristic for our customers. The main market channel for our product will be the e-commerce, in order to reduce cost and environmental impacts due product transportation. A secondary channel will be the Retail Stores. It will be important for our customers to have physical interaction with the system. Our intention is to increase the credibility for our product. However, on the Retails Stores, customers will receive e-tickets which will allow them to make their orders through the website. In the future, with the growth of our business, sales representatives on different regions worldwide will have to be considered. Also, other assembly sites would have to be required, in order to reduce costs with components internalization, and also reduce the environmental impacts caused by our product shipment across the regions. Funding Strategy Initially, investments for working capital are will be required. Sub-components suppliers would have to be developed, as alliances with Utility Companies and Home Constructors. The Ethnography Research indicated that customers feel the need to have useful information from Utility Companies about their households’ energy consumption. Another important finding from the research is the fact that there’s a specific fraction of people which were influenced by the house energy efficiency during its purchase process. For that reason, a Home Constructor that started offering Home Energy Monitors included on the houses they sell was interviewed. The Home Constructor mentioned that regulations for houses´ energy efficiency are beginning to gain strength. An alliance with this kind of stakeholder would improve the valuation and advertisement of our product. Our first estimative considers a sales ramp up from 10.000 to 50.000 units through the first year of production. The intention of our team is to keep the demand at this level, after the first year of production. Beyond this point, additional investments would be required due the increase of production volumes. Considering the retail price of US$ 100, and the production volumes previously mentioned, the revenue from the sales of our product will have to be sufficient to offset the initial investments made for the working capital, and also to provide profits after the business’ breakeven point which we expect to reach within one year. And besides selling our product to house owners, another source of revenue would be the consignation of our product with Home Constructors. Also, monetary incentives from 23 Utility Companies and Governmental Agencies could be negotiated. Those incentives would be derived from the amount of electrical energy saved by the use of our home energy monitor. Additional Reflections on Project Outcome Project Eco-efficient or Sustainable Design? The Interactive Home Energy Monitor is a very strong example of sustainable design, primarily due to the behavior change it encourages among its users. Although the device will have some negative environmental impacts at production and end of use, it will encourage users to conserve electricity, resulting in a net positive environmental impact. Additionally, the device will be produced with sustainable design in mind. By making the device web based, no lengthy user’s manual or installation media will be required. Further, by focusing on ecommerce sales, retail environmental overhead will be minimized. Recyclable materials will be used when possible, and all of the electronics will be RoHS compliant. Ultimately, the hardware to be able to create such a device is not specialized and would not be exceedingly difficult for another company to reproduce. In order to prevent other companies from encroaching on this section of the market, the software for the device will have to be continually updated to stay on the cutting edge of features. Additionally, privacy can be a concern for this design. If consumer data were to leak out, there could be a serious backlash among customers. Design Critique One of the major changes that would have improved the design process would have been to look at and gather ethnography data earlier on in the design process. It took us some time to finally get valuable ethnography data. This information would have been more helpful earlier on in the design process. Additionally, one of the features that has been brought up is the ability to enable and disable power to devices. In order to ad this feature, cost would be significantly increased, and the concept would likely have to be redesigned. If we were going through the design process again, this feature would have been attempted to be included from the very beginning. Additionally, it would have been very helpful to have gathered actual energy usage data using current sensors on a wide variety of homes. This would have allowed us to work on creating an algorithm for the scoring system, and could have given us better baseline data for typical usage. Additionally, the amount of time for the project was very limited. If we would have had more time, we would have been able to do a more detailed analysis of the product life cycle, and would have been able to put together a more thorough design plan. As mentioned previously, having data upfront on typical usage for a wide variety of households could have helped determine an algorithm for ranking users. By looking at details of the households, such as size of family, number of children, geographical region, home size, and more. If we had this data, we would likely find important criteria that had not even been considered at this point. Additionally, in order to add the standby mode to the device, there would likely have to be additional devices at each outlet that the device would be required to control. In order to control the device, a relay or triac would likely be used. Safety concerns would have to be looked at if this feature were to be implemented. Because mains voltage would be switched, a proper design would have appropriate failure modes considered, and proper certification and testing completed thoroughly. 24 Recommendations In the future, it will be essential to do a full life cycle analysis. Due to the time constraints, a full life cycle analysis was not completed, but would allow for the sustainability of the device to be more easily quantifiable. Further, due to the precision requirements for the device, a full hardware design and analysis would need to be completed in order to ensure than the precision of the measurements is precise enough for the device to perform as expected. Because the device will be located near and will interact directly or indirectly with mains voltage, a full design failure mode and effects analysis will need to be created. This will work to ensure that the design has all failure modes are taken into account, and that these failures to not result in unsafe behavior. Additionally, workshops should occur with a wide variety of potential customers. These should show the device, along with its closest competitors, so that people can interact with the device and provide feedback. This will not only be helpful for finalizing the design, but will also help with identifying use cases that may not have been identified initially. By providing beta devices to households of different size, location, family size, age, and other factors, important data can be collected to help identify issues in the hardware and software. This will also allow for an opportunity to improve and develop the scoring algorithm with actual customer data. Project Reflections and Future Project Recommendations Overall, we feel that we have learned much more about sustainable design since starting the class. Working on the project has been effective in relating concepts taught in class to real life examples, however the time constraints for the class are quite tough to meet. We feel that if we would have skipped the first assignment, and immediately jumped into the project, we would have had a more complete design. Even though important concepts had not been presented at that point, we feel that some of the initial work could have still been completed and would have allowed us to get a head start on the design. Further, I think enabling the ‘chatroom’ feature in CTools would have made it easier to ask questions and find common answers. I think this would have allowed for more casual communication with the GSI and professor, while enabling peers to answer questions. Further, by sharing design reviews among the class, we would have had a much better idea of what needed to be improved in our design. Distance learning makes it difficult to talk with class members out of our group. By being able to look at other design reports, we would have been able to better understand where our weaknesses and strengths were. Acknowledgements We would like to initially thank Professor Steve Skerlos and Siddharth Kale, as both of them have provided invaluable feedback and have enabled us to continually improve our design throughout the semester. Additionally we would like to thank Deep’s neighbors Bob and Alan, as they answered several sets of questions for our ethnography and provided helpful insight. Additionally, we would like to acknowledge Hansons Roofing Contractors and Ms. Priscila Marreiro of Tecnisa, both of which took valuable time out of their days to give us feedback from the home constructor perspective. Finally, we’d like to thank the multiple people that answered questions from us. They provided us with a huge amount of data that helped to shape the design, and impact our final concept. 25 Appendix Alpha Design Surveys Female – 56 years old Owns Home Professional 1. What do you like from what you saw a. Socially and ecologically responsible. Makes people not waste energy 2. What do you dislike a. A bit labor intensive 3. Is this something you would consider purchasing? a. Yes 4. How much would you be willing to pay? a. $100 5. What sort of factors would you like to be included in the ranking setup? a. Household size, Children and ages, age of house, geographic climate b. Are there scenarios where you think you would be discouraged of using the device if you weren’t doing well in the rankings? i. Perhaps 6. Are there other features you would like to see integrated into the design? a. No. Maybe motion detection to see if people are home 7. Would you be willing to install this yourself or would you hire a professional to install? a. Yes 8. What would your motivation be in purchasing this device? (saving money in utility builds, protecting the earth, etc) a. Environment and social aspects. Male – 65 years old Owns home Professional 1. What do you like from what you saw a. Feedback loop of knowing what you are using 2. What do you dislike a. Characterization of individual devices seems a bit tough 3. Is this something you would consider purchasing? a. Yes 4. How much would you be willing to pay? 26 5. 6. 7. 8. a. 100-150. Would need to make back the money fairly quickly What sort of factors would you like to be included in the ranking setup? a. Age of the house, size of house, region b. Are there scenarios where you think you would be discouraged of using the device if you weren’t doing well in the rankings? i. No Are there other features you would like to see integrated into the design? a. Ability to measure devices individually Would you be willing to install this yourself or would you hire a professional to install? a. Yes What would your motivation be in purchasing this device? (saving money in utility builds, protecting the earth, etc) a. Money Single female, 34 yo. São Caetano do Sul, SP/Brazil. 1100 ft apartment. Questions 1. What do you like from what you saw - The Alert system which would allow me to control my electricity consumption. I also like the possibility to have a home appliances control. Because my daily routine I sometimes forget or don´t thing to take actions to avoid electricity waste. That feature would take the responsibility away from me. 2. What do you dislike - I dislike the Ideas Sharing database. I think I would not make use of it to get ideas on how to save energy. 3. Is this something you would consider purchasing? - Yes. 4. How much would you be willing to pay? - USD 500,00 once it´s going to allow me saving energy. 5. What sort of factors would you like to be included in the ranking setup? - Besides the users rank, I think would be interesting to have a hot spot ranking for energy consumption, which would be based on users setup for different types of consumption spots. a. Are there scenarios where you think you would be discouraged of using the device if you weren’t doing well in the rankings? - No. If I wasn´t doing well I would work harder to improve my position in the rankings. My bad performance would be a clear sign that I wouldn´t be consuming energy in a conscious way. 27 6. Are there other features you would like to see integrated into the design? - No, I think the current package delivers everything is needed to take effective actions to avoid electricity waste. 7. Would you be willing to install this yourself or would you hire a professional to install? - I would require outside help to install and setup the system, once it involves more than just a software installion. 8. What would your motivation be in purchasing this device? (saving money in utility builds, protecting the earth, etc) - The cost reduction on my electricity bill and the possibility to help reducing the environmental impacts caused by energy consumption would be strong motivational factors for me. Single male 39 yo. São Caetano do Sul, SP/Brazil. 1650 ft apartment. Questions 1. What do you like from what you saw - I like the possibility of sharing with other users ideas about initiatives for energy consumption reduction. I also like the alarm system. It would allow me to take immediate actions whenever abusive energy consumption happens. 2. What do you dislike - I dislike the ranking system. I´m not comfortable about sharing personal information with other people, even though they are friends of mine. The amount of energy I consume or save should be only of my interest. 3. Is this something you would consider purchasing? - Yes. 4. How much would you be willing to pay? - I would pay US$ 200 for that kind of system. 5. What sort of factors would you like to be included in the ranking setup? - Not applicable, once that´s one of the features I dislike. a. Are there scenarios where you think you would be discouraged of using the device if you weren’t doing well in the rankings? - Besides privacy, the motivation for me to reduce energy would be monetary. Also, the possibility to help preserving the environment would motivate me to take actions, but not whether I´m consuming more or less energy than my neighbor. 6. Are there other features you would like to see integrated into the design? - The possibility to pay my electricity bills online, and also some reward system based on the amount of energy I save would be interesting. It would create the possibility to form alliances to Financial Institutions, or sponsors to the reward system. 28 7. Would you be willing to install this yourself or would you hire a professional to install? - I would try installing the system by myself. 8. What would your motivation be in purchasing this device? (saving money in utility builds, protecting the earth, etc) - The money involved in terms of saving, and the environmental issues that could be reduced. Alan, 40-yr old, Commerce Twp, MI (Family of four) 1. What do you like from what you saw: Neat features and functionality, Integration with mobile phone a definite plus. 2. What do you dislike: Not being able to break down usage real time by appliances. 3. Is this something you would consider purchasing? Yes. 4. How much would you be willing to pay? $50 or so. 5. What sort of factors would you like to be included in the ranking setup? Time of year, year over year, size of house. a. Are there scenarios where you think you would be discouraged of using the device if you weren’t doing well in the rankings? No 6. Are there other features you would like to see integrated into the design? The ability to breakdown usage by devices and being able to control lights/devices via app. 7. Would you be willing to install this yourself or would you hire a professional to install? Yes. 8. What would your motivation be in purchasing this device? (saving money in utility builds, protecting the earth, etc) Saving money and reducing carbon foot print. Bob, 50-yr old, Commerce Twp, MI (Family of two) 1. 2. 3. 4. 5. What do you like from what you saw: Alarm if something is using too much power. What do you dislike: Ranking system. Not interested in competing with neighbors. Is this something you would consider purchasing? Maybe. How much would you be willing to pay? No more than $100. What sort of factors would you like to be included in the ranking setup? Ranking should be based on usage or how much more one is using than average consumer. 29 a. Are there scenarios where you think you would be discouraged of using the device if you weren’t doing well in the rankings? If taking recommended actions does not result in improvement of ranking. 6. Are there other features you would like to see integrated into the design? Alarm if the power goes out. 7. Would you be willing to install this yourself or would you hire a professional to install? Yes. 8. What would your motivation be in purchasing this device? (saving money in utility builds, protecting the earth, etc) Save money and a neat gadget that may improve house value. 30 References i Electricity explained: Use of electricity. (2012). Retrieved October 12, 2013, from http://www.eia.gov/energyexplained/index.cfm?page=electricity_use ii TED: Start measuring. start saving. Retrieved October 12, 2013, from http://www.theenergydetective.com/ted5000store/b-5002c.html iii International energy outlook 2013. (2013). Retrieved November 16, 2013, from http://www.eia.gov/forecasts/ieo/world.cfm iv Wattvision: Consumer products. Retrieved October 12, 2013, from http://www.wattvision.com/info/products v Houde, S., Todd, A., Sudarshan, A., Flora, J. A., & Armel, K. C. (2013). Real-time feedback and electricity consumption: A field experiment assessing the potential for savings and persistence. The Energy Journal, 34(1), 87-102. vi Schleich, J., Klobasa, M., & Golz, S. (2012). Does smart metering reduce residential electricity demand? pp. 1. vii Bakker, C. A., Hal, v., J.D.M., & Dam, v., S.S. (2010). Home energy monitors: Impact over the mediumterm. Building Research & Information, 38(5), 458. viii Mahone, A., & Haley, B. (2011). Overview of residential energy feedback and Behavior‐based energy efficiency (Customer Information and Behavior Working Group of the State and Local Energy Efficiency Action Network. San Francisco, CA: Energy and Environmental Economics. ix Parker, D., Hoak, D., Meier, A., & Brown, L. (2006). How much energy are we using? Potential of residential energy demand feedback devices No. FSEC-CR-1665-06). Florida, USA: Florida Solar Energy Center/University of Central Florida.