1
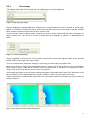
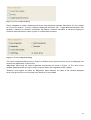
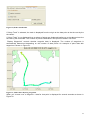
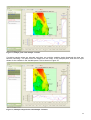
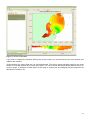
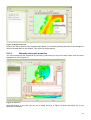
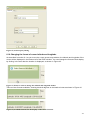
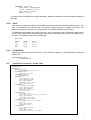
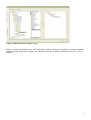
Figure 24, Sample point with multiple variables
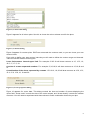
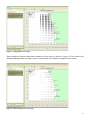
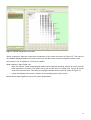
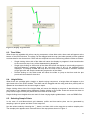
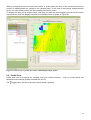
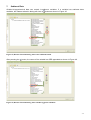
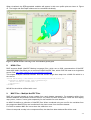
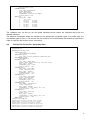
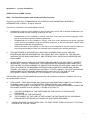
If multiple sample points are selected and there are multiple variables being displayed the plots can
become confusing. The plots lines are made from the colour of the sample point, and the line style
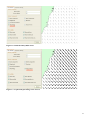
shown for the variable in the Variable panel. This is shown in Figure 25.
Figure 25, Multiple Sample Points and Multiple Variables
18