1
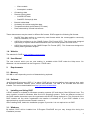
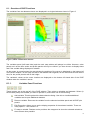
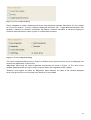
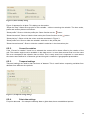
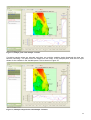
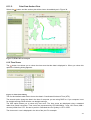
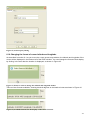
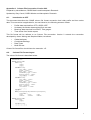
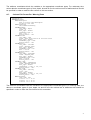
Figure 8, Colour table dialog
Figure 8 appears for all colour plots. Use this to chose the colour scheme used for the plots.
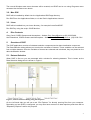
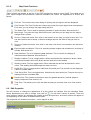
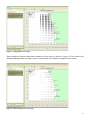
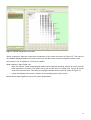
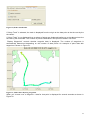
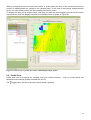
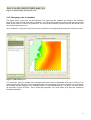
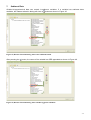
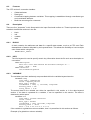
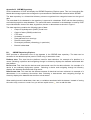
Figure 9, Contours dialog
Figure 9 appears for contour plots. DIVE can auto-scale the contours used, or you can chose your own
contour levels.
If you wish to define your own contour intervals you will need to define the contour range and intervals.
There are several formats for doing this:
Lower limit:contour interval:upper limit: For example 15:0.5:18 will draw contours at 15, 15.5, 16,
16.5, 17, 17.5, 18.
A series of comma separated numbers: For example 15,16,18,21 will draw contours at 15,16,18 and
21.
A combination of the above separated by commas: 15:0.2:16, 19, 20 will draw contours at 15.0, 15.2,
15.4, 15.6, 15.8, 16, 19 and 20.
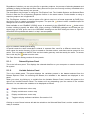
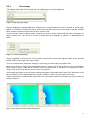
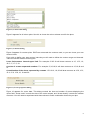
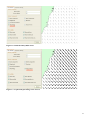
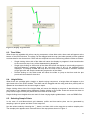
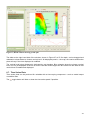
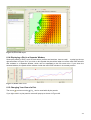
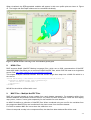
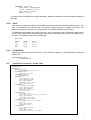
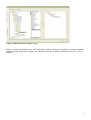
Figure 10, Vector properties dialog
Figure 10 appears for vector data. This dialog controls the size and number of arrows displaying the
vector field. “Arrow scale” controls the size of the vector arrows, and “Arrow density” controls the number
of arrows. You will need to experiment with these values to find a combination that suits your plot.
9