1
PathwaysTM 4 Software
User’s Guide
2
For research purposes only.
International customers refer to www.invitrogen.com for technical support contact information.
3
RGMA10011 rev B
Table of Contents
Book I: Introduction and Overview
Chapter 1: Highlights
9
1.1 Introduction . . . . . . . . . . . . . . . . . . . . . . . . . . . . . . . . . . . . . . . . . . . . . . . . . . . . . . .9
1.2 Highlights of the Software . . . . . . . . . . . . . . . . . . . . . . . . . . . . . . . . . . . . . . . . . . . .9
1.3 Hardware and Software Requirements . . . . . . . . . . . . . . . . . . . . . . . . . . . . . . . . . . .10
1.4 Architecture of the Program . . . . . . . . . . . . . . . . . . . . . . . . . . . . . . . . . . . . . . . . . . .10
1.5 Pluggable Interfaces . . . . . . . . . . . . . . . . . . . . . . . . . . . . . . . . . . . . . . . . . . . . . . . .10
1.6 Compatibility with Previous Versions of PathwaysTM . . . . . . . . . . . . . . . . . . . . . . . .10
1.7 Comparison of PathwaysTM 4 Universal to PathwaysTM 4 GeneFilters . . . . . . . . . .11
Chapter 2: Overview of the Graphical User Interface
12
2.1 Layout of the Graphical User Interface . . . . . . . . . . . . . . . . . . . . . . . . . . . . . . . . . .12
2.2 Menus . . . . . . . . . . . . . . . . . . . . . . . . . . . . . . . . . . . . . . . . . . . . . . . . . . . . . . . . . . .13
2.3 Workspace . . . . . . . . . . . . . . . . . . . . . . . . . . . . . . . . . . . . . . . . . . . . . . . . . . . . . . . .15
2.4 Project Tree . . . . . . . . . . . . . . . . . . . . . . . . . . . . . . . . . . . . . . . . . . . . . . . . . . . . . . .16
2.5 Detail View . . . . . . . . . . . . . . . . . . . . . . . . . . . . . . . . . . . . . . . . . . . . . . . . . . . . . . .17
2.6 Filter View . . . . . . . . . . . . . . . . . . . . . . . . . . . . . . . . . . . . . . . . . . . . . . . . . . . . . . .19
2.7 Quick Start . . . . . . . . . . . . . . . . . . . . . . . . . . . . . . . . . . . . . . . . . . . . . . . . . . . . . . .20
2.8 Contrast Controller . . . . . . . . . . . . . . . . . . . . . . . . . . . . . . . . . . . . . . . . . . . . . . . . .21
2.9 Progress Bars . . . . . . . . . . . . . . . . . . . . . . . . . . . . . . . . . . . . . . . . . . . . . . . . . . . . . .23
2.10 General Settings . . . . . . . . . . . . . . . . . . . . . . . . . . . . . . . . . . . . . . . . . . . . . . . . . .24
2.11 Online Help . . . . . . . . . . . . . . . . . . . . . . . . . . . . . . . . . . . . . . . . . . . . . . . . . . . . . .25
Book II: Universal Concepts
Chapter 3: Frameworks
27
3.1 Introduction to Frameworks . . . . . . . . . . . . . . . . . . . . . . . . . . . . . . . . . . . . . . . . . . .27
3.2 Influence of Frameworks . . . . . . . . . . . . . . . . . . . . . . . . . . . . . . . . . . . . . . . . . . . . .28
3.3 The PathwaysTM Framework . . . . . . . . . . . . . . . . . . . . . . . . . . . . . . . . . . . . . . . . . . .30
3.4 The Spreadsheet Framework . . . . . . . . . . . . . . . . . . . . . . . . . . . . . . . . . . . . . . . . . .31
3.5 The GEMLTM Framework . . . . . . . . . . . . . . . . . . . . . . . . . . . . . . . . . . . . . . . . . . . .37
Chapter 4: The Array Designer
39
4.1 Introduction . . . . . . . . . . . . . . . . . . . . . . . . . . . . . . . . . . . . . . . . . . . . . . . . . . . . . . .39
4.2 Concepts: Importing . . . . . . . . . . . . . . . . . . . . . . . . . . . . . . . . . . . . . . . . . . . . . . . .39
4.3 Concepts: Auto/Crop Mode . . . . . . . . . . . . . . . . . . . . . . . . . . . . . . . . . . . . . . . . . . .40
4.4 Concepts: Template Mode . . . . . . . . . . . . . . . . . . . . . . . . . . . . . . . . . . . . . . . . . . . .41
4.6 Reading from a Spreadsheet File . . . . . . . . . . . . . . . . . . . . . . . . . . . . . . . . . . . . . . .45
4.7 Reading from a GEMLTM File . . . . . . . . . . . . . . . . . . . . . . . . . . . . . . . . . . . . . . . . .49
4.8 Reading from a Clontech AtlasTM Array Gene List File . . . . . . . . . . . . . . . . . . . . . .49
4.9 Reading from a Corning CMTTM Map File . . . . . . . . . . . . . . . . . . . . . . . . . . . . . . . .50
4.10 The Array Design Stage . . . . . . . . . . . . . . . . . . . . . . . . . . . . . . . . . . . . . . . . . . . . .51
4
RGMA10011 rev B
Book III: Core Concepts: Data Flow and Importing Images
Chapter 5: Data Flow - From Experiment to Analysis
57
5.1 From Experiment to Analysis: The Importing Process . . . . . . . . . . . . . . . . . . . . . . .57
5.2 Supported Image Formats . . . . . . . . . . . . . . . . . . . . . . . . . . . . . . . . . . . . . . . . . . . .57
5.3 Microarray Description Plug-Ins . . . . . . . . . . . . . . . . . . . . . . . . . . . . . . . . . . . . . . .58
5.4 Finding the Location of Clone Centers . . . . . . . . . . . . . . . . . . . . . . . . . . . . . . . . . . .59
5.5 Sampling Microarray Data . . . . . . . . . . . . . . . . . . . . . . . . . . . . . . . . . . . . . . . . . . .59
5.6 PathwaysTM Sample and Image Files . . . . . . . . . . . . . . . . . . . . . . . . . . . . . . . . . . . .60
Chapter 6: Importing
61
6.1 Image Import Dialog . . . . . . . . . . . . . . . . . . . . . . . . . . . . . . . . . . . . . . . . . . . . . . . .61
6.2 Introduction to Interactive Importing . . . . . . . . . . . . . . . . . . . . . . . . . . . . . . . . . . . .64
6.3 Interactive Importing: Auto / Crop Mode . . . . . . . . . . . . . . . . . . . . . . . . . . . . . . . .67
6.4 Interactive Importing: Template Mode . . . . . . . . . . . . . . . . . . . . . . . . . . . . . . . . . .69
6.5 Reviewing Alignments and Saving . . . . . . . . . . . . . . . . . . . . . . . . . . . . . . . . . . . . .71
6.6 Invalidating a Clone . . . . . . . . . . . . . . . . . . . . . . . . . . . . . . . . . . . . . . . . . . . . . . . .72
6.7 Batch Importing . . . . . . . . . . . . . . . . . . . . . . . . . . . . . . . . . . . . . . . . . . . . . . . . . . . .73
Book IV: Core Concepts: PathwaysTM Data Organization and Management
Chapter 7: PathwaysTM Projects
76
7.1 Projects . . . . . . . . . . . . . . . . . . . . . . . . . . . . . . . . . . . . . . . . . . . . . . . . . . . . . . . . . .76
7.2 Conditions . . . . . . . . . . . . . . . . . . . . . . . . . . . . . . . . . . . . . . . . . . . . . . . . . . . . . . . .77
7.3 Grouping of Data . . . . . . . . . . . . . . . . . . . . . . . . . . . . . . . . . . . . . . . . . . . . . . . . . .78
7.4 Creating Projects in PathwaysTM . . . . . . . . . . . . . . . . . . . . . . . . . . . . . . . . . . . . . . . .79
7.5 Single Microarray Projects . . . . . . . . . . . . . . . . . . . . . . . . . . . . . . . . . . . . . . . . . . . .79
7.6 Two Microarray Comparison Projects . . . . . . . . . . . . . . . . . . . . . . . . . . . . . . . . . . .81
7.7 Empty Project . . . . . . . . . . . . . . . . . . . . . . . . . . . . . . . . . . . . . . . . . . . . . . . . . . . . .82
Chapter 8: Normalization
85
8.1 Basic Concepts in Intensity Normalization . . . . . . . . . . . . . . . . . . . . . . . . . . . . . . . .85
8.2 PathwaysTM Normalization Algorithms . . . . . . . . . . . . . . . . . . . . . . . . . . . . . . . . . . .85
8.3 Normalization Groups . . . . . . . . . . . . . . . . . . . . . . . . . . . . . . . . . . . . . . . . . . . . . . .87
Chapter 9: Data, Paths, and Filters
89
9.1 Analysis Data . . . . . . . . . . . . . . . . . . . . . . . . . . . . . . . . . . . . . . . . . . . . . . . . . . . . .89
9.2 Data Filtering . . . . . . . . . . . . . . . . . . . . . . . . . . . . . . . . . . . . . . . . . . . . . . . . . . . . .90
9.3 Strict Setting . . . . . . . . . . . . . . . . . . . . . . . . . . . . . . . . . . . . . . . . . . . . . . . . . . . . . .91
9.4 Simple Data Filters . . . . . . . . . . . . . . . . . . . . . . . . . . . . . . . . . . . . . . . . . . . . . . . . .92
9.5 Statistical Data Filters . . . . . . . . . . . . . . . . . . . . . . . . . . . . . . . . . . . . . . . . . . . . . . .94
9.6 Paths . . . . . . . . . . . . . . . . . . . . . . . . . . . . . . . . . . . . . . . . . . . . . . . . . . . . . . . . . . . .94
9.7 Creating a New Path . . . . . . . . . . . . . . . . . . . . . . . . . . . . . . . . . . . . . . . . . . . . . . . .95
9.8 Editing Paths . . . . . . . . . . . . . . . . . . . . . . . . . . . . . . . . . . . . . . . . . . . . . . . . . . . . . .96
9.9 Path Filtering . . . . . . . . . . . . . . . . . . . . . . . . . . . . . . . . . . . . . . . . . . . . . . . . . . . . . .97
9.10 Invalid Clone Filtering . . . . . . . . . . . . . . . . . . . . . . . . . . . . . . . . . . . . . . . . . . . . . .98
5
RGMA10011 rev B
Chapter 10: Reports and Exporting Data
99
10.1 PathwaysTM Reporting . . . . . . . . . . . . . . . . . . . . . . . . . . . . . . . . . . . . . . . . . . . . . .99
10.2 Report Wizard . . . . . . . . . . . . . . . . . . . . . . . . . . . . . . . . . . . . . . . . . . . . . . . . . . . .99
Book V: PathwaysTM Analysis
Chapter 11: Comparison
102
11.1 Introduction to Comparison Analysis . . . . . . . . . . . . . . . . . . . . . . . . . . . . . . . . . . .102
11.2 Comparison Toolbar . . . . . . . . . . . . . . . . . . . . . . . . . . . . . . . . . . . . . . . . . . . . . . . .102
11.3 Synthetic Microarray . . . . . . . . . . . . . . . . . . . . . . . . . . . . . . . . . . . . . . . . . . . . . . .103
11.4 Scatter Plot . . . . . . . . . . . . . . . . . . . . . . . . . . . . . . . . . . . . . . . . . . . . . . . . . . . . . .106
11.5 Chart Properties . . . . . . . . . . . . . . . . . . . . . . . . . . . . . . . . . . . . . . . . . . . . . . . . . . .106
11.6 Table . . . . . . . . . . . . . . . . . . . . . . . . . . . . . . . . . . . . . . . . . . . . . . . . . . . . . . . . . . .108
Chapter 12: Profiling
109
12.1 Introduction to Profiling Analysis . . . . . . . . . . . . . . . . . . . . . . . . . . . . . . . . . . . . .109
12.2 Profiling Toolbar . . . . . . . . . . . . . . . . . . . . . . . . . . . . . . . . . . . . . . . . . . . . . . . . . .109
12.3 Plot . . . . . . . . . . . . . . . . . . . . . . . . . . . . . . . . . . . . . . . . . . . . . . . . . . . . . . . . . . . .110
12.4 Bar Charts . . . . . . . . . . . . . . . . . . . . . . . . . . . . . . . . . . . . . . . . . . . . . . . . . . . . . . .111
12.5 Table . . . . . . . . . . . . . . . . . . . . . . . . . . . . . . . . . . . . . . . . . . . . . . . . . . . . . . . . . . .112
Chapter 13: Clustering
113
13.1 Introduction to Clustering . . . . . . . . . . . . . . . . . . . . . . . . . . . . . . . . . . . . . . . . . . .113
13.2 Clustering Algorithms . . . . . . . . . . . . . . . . . . . . . . . . . . . . . . . . . . . . . . . . . . . . . .113
13.3 Cluster Visualization . . . . . . . . . . . . . . . . . . . . . . . . . . . . . . . . . . . . . . . . . . . . . . .114
13.4 Clustering in PathwaysTM . . . . . . . . . . . . . . . . . . . . . . . . . . . . . . . . . . . . . . . . . . . .114
13.5 KMeans Clustering . . . . . . . . . . . . . . . . . . . . . . . . . . . . . . . . . . . . . . . . . . . . . . . .115
13.6 Hierarchical Clustering . . . . . . . . . . . . . . . . . . . . . . . . . . . . . . . . . . . . . . . . . . . . .116
13.7 SOM Clustering . . . . . . . . . . . . . . . . . . . . . . . . . . . . . . . . . . . . . . . . . . . . . . . . . . .117
13.8 Profile . . . . . . . . . . . . . . . . . . . . . . . . . . . . . . . . . . . . . . . . . . . . . . . . . . . . . . . . . .119
13.9 Tabular . . . . . . . . . . . . . . . . . . . . . . . . . . . . . . . . . . . . . . . . . . . . . . . . . . . . . . . . .120
13.10 Clustergram . . . . . . . . . . . . . . . . . . . . . . . . . . . . . . . . . . . . . . . . . . . . . . . . . . . . .121
Chapter 14: PathwaysTM Data Updates
123
14.1 Web Links and the Integrated Web Browser . . . . . . . . . . . . . . . . . . . . . . . . . . . . . .123
14.2 Adding and Editing Web Links . . . . . . . . . . . . . . . . . . . . . . . . . . . . . . . . . . . . . . .124
14.3 Introduction to PathwaysTM Updates . . . . . . . . . . . . . . . . . . . . . . . . . . . . . . . . . . . .125
14.4 Launching the Updater . . . . . . . . . . . . . . . . . . . . . . . . . . . . . . . . . . . . . . . . . . . . . .126
14.5 Updating from CD . . . . . . . . . . . . . . . . . . . . . . . . . . . . . . . . . . . . . . . . . . . . . . . . .127
Chapter 15: Examples
129
15.1 Introduction to Example 1 . . . . . . . . . . . . . . . . . . . . . . . . . . . . . . . . . . . . . . . . . . .129
15.2 Example 1 Step One: Import Microarray Images . . . . . . . . . . . . . . . . . . . . . . . . .129
15.3 Example 1 Step Two: Create a Project Using the Project Wizard . . . . . . . . . . . . .134
15.4 Example 1 Step Three: Comparison Analysis & Report Generation . . . . . . . . . . .135
15.5 Example 2: Complex Time Study . . . . . . . . . . . . . . . . . . . . . . . . . . . . . . . . . . . . .137
15.6 Example 2: Comparison Analysis . . . . . . . . . . . . . . . . . . . . . . . . . . . . . . . . . . . . .138
15.7 Example 2: Profiling Analysis . . . . . . . . . . . . . . . . . . . . . . . . . . . . . . . . . . . . . . .139
15.8 Example 2: Clustering Analysis . . . . . . . . . . . . . . . . . . . . . . . . . . . . . . . . . . . . . .142
6
RGMA10011 rev B
Book VI: Appendices
Appendix I: ResGenTM GeneFilters Microarrays
146
I.1 Introduction . . . . . . . . . . . . . . . . . . . . . . . . . . . . . . . . . . . . . . . . . . . . . . . . . . . . . . .146
I.2 The GeneFilters Microarray System . . . . . . . . . . . . . . . . . . . . . . . . . . . . . . . . . . .146
I.3 Layout of GeneFilters Microarrays . . . . . . . . . . . . . . . . . . . . . . . . . . . . . . . . . . . .148
151
Appendix II: Migrating to PathwaysTM 4 Universal
II.1 Introduction . . . . . . . . . . . . . . . . . . . . . . . . . . . . . . . . . . . . . . . . . . . . . . . . . . . . . .151
II.2 Image Import and Alignment . . . . . . . . . . . . . . . . . . . . . . . . . . . . . . . . . . . . . . . . .151
II.3 Grouping of Data and Complex Analysis . . . . . . . . . . . . . . . . . . . . . . . . . . . . . . . .152
II.4 Normalization and Data Filters . . . . . . . . . . . . . . . . . . . . . . . . . . . . . . . . . . . . . . . .153
II.5 Viewing Data . . . . . . . . . . . . . . . . . . . . . . . . . . . . . . . . . . . . . . . . . . . . . . . . . . . . .153
II.6 Data Management and Updates . . . . . . . . . . . . . . . . . . . . . . . . . . . . . . . . . . . . . . . .153
II.7 Making the Change . . . . . . . . . . . . . . . . . . . . . . . . . . . . . . . . . . . . . . . . . . . . . . . . .154
II.8 Migrating from PathwaysTM 3 . . . . . . . . . . . . . . . . . . . . . . . . . . . . . . . . . . . . . . . . .154
Appendix III: Exporting Images from Fuji Software
155
Appendix IV: License Agreement
156
Appendix V: Technical Support
159
Glossary
160
Index
167
7
RGMA10011 rev B
Book I: Introduction and Overview
8
RGMA10011 rev B
Chapter 1: Highlights
1.1 Introduction
As a comprehensive tool for the analysis of microarray data, the PathwaysTM 4 software unleashes microarrays’ potential for discovery. From image importing through data mining, data analysis is rapid, accurate, and extensible.
This manual describes the process of data analysis in PathwaysTM 4. Book I offers a product
overview, including program highlights and a tour of the graphical interface. Book II introduces
new features exclusive to PathwaysTM Universal. Book III describes the flow of data and the
image importing process. Book IV addresses some of the core concepts in PathwaysTM data
analysis, including project organization, data normalization, and filtering tools for large data set
reduction. Book V describes the three primary types of data analysis (comparison, profiling,
and clustering), and it offers practical examples of each technique.
1.2 Highlights of the Software
The PathwaysTM 4 software encompasses a sophisticated and comprehensive set of tools for the
analysis of differential gene expression using microarray data. The following highlights are
included.
· Batch importing for rapid, automated importing of multiple microarray images.
· Support for multiple image formats, including Tiff, Fuji, and PathwaysTM image formats.
· Multiple views of each data set and analysis results, including scatter plots, tables, and
synthetic images of the microarray.
· Statistical analysis of data sets, including unrelated t-tests and ANOVA.
· Isolation of genes in large data sets by filtering based on user-specified criteria.
· Multiple clustering algorithms, including KMeans, Hierarchical clustering, and SOM.
· An embedded browser enabling hyperlinks between a clone and public sites like the
National Center for Biotechnology Information’s (NCBI's) GenBank and
Unigene databases.
· Updating of default data files and plug-ins from the ResGenTM Data Server to ensure that
data for each clone is always current (subscription service).
· Java architecture for ease of cross-platform use.
· Multiple pluggable components, allowing PathwaysTM functionality to be extended by
ResGenTM, third party vendors, or end users.
9
RGMA10011 rev B
1.3 Hardware and Software Requirements
Processor: Pentium II, 400 MHz or better
Memory: 256 MB RAM
Hard drive: Core program 45 MB, including Java runtime environment and two sample images
Operating system: Windows (95, 98, 2000, or NT), Linux, Solaris, Macintosh OSX, or any
platform supporting the Java 1.3 runtime environment.
Video: SVGA with 1024 x 768 resolution or better, 256 color palette or better
1.4 Architecture of the Program
The PathwaysTM 4 software is written in Java 1.3, allowing significant flexibility in the choice of
operating systems, extensibility of the program, and ease of internet data access.
1.5 Pluggable Interfaces
PathwaysTM is designed with multiple "pluggable" components that allow the program to be
extended at runtime by placing new java jar files in the appropriate PathwaysTM distribution
directory. Pluggable components include sampling, clustering (core algorithms and visualization), normalization, data analysis, image formats, microarray descriptions and web interconnectivity. New plug-ins can be created by ResGenTM, third party software vendors, or end users.
1.6 Compatibility with Previous Versions of PathwaysTM
PathwaysTM 4 represents a significant advance in technology over PathwaysTM 2.0. The algorithms for autocentering imported images, sampling, and normalization have been revised and
improved. As an improvement on PathwaysTM 2, PathwaysTM 4 includes the following analysis
capabilities.
· Statistical analysis
· Clustering
· Multiple modes of visualization
Furthermore, PathwaysTM 4 stores microarray data in sharable files, whereas PathwaysTM 2.0
stored data in Microsoft Access databases. These improvements mean that microarray images
that were previously imported into PathwaysTM 2.0 must be reimported into PathwaysTM 4. The
improved import process allows rapid reimport of previously imported data.
10
RGMA10011 rev B
PathwaysTM 4 is fully compatible with all PathwaysTM 3 projects and image files.
1.7 Comparison of PathwaysTM 4 Universal to PathwaysTM 4 GeneFilters
PathwaysTM 4 Universal supports multiple microarray products, while PathwaysTM 4
GeneFilters software is designed specifically for ResGenTM GeneFilters microarrays.
Features exclusive to PathwaysTM 4 Universal include the Array Designer and Frameworks,
which allow for analysis of other microarray products or previously analyzed array intensities.
Refer to Book II for more information about the Array Designer and Frameworks.
Whenever this symbol appears, the text following it refers to features exclusive to
PathwaysTM 4 Universal.
11
RGMA10011 rev B
Chapter 2: Overview of the Graphical User Interface
This chapter offers an overview of the PathwaysTM Graphical User Interface (GUI). Detailed
descriptions of importing, project creation, and data analysis are presented in later chapters.
2.1 Layout of the Graphical User Interface
The PathwaysTM GUI has five primary sections.
· Main Menu
· Workspace
· Project Tree
· Detail View
· Filter View
Main Menu
Project
Tree
Workspace
Detail
View
Filter View
The main menu contains menu items for all aspects of the PathwaysTM program, from file management to data analysis. The workspace contains active analysis windows for the current project. The project tree shows the current project’s microarrays. The detail view shows relevant
information about the currently selected clone(s) in the active analysis window, including a
thumbnail view of the clone in the original experimental image. The filter view displays data
filters that are available for the currently active analysis window. Each of these sections is discussed in more detail in the following text.
12
RGMA10011 rev B
Each section of the GUI is divided by borders that can be resized to allow more space for a section of the GUI. To change the size of a section:
Move the cursor over the border that needs to be moved.
A double-headed arrow appears.
Click and drag the border.
2.2 Menus
The File menu commands create and save projects, import images, and exit the program.
New Project: Opens a new project dialog.
Open Project: Opens a dialog box from which a saved project can be loaded.
Save Project: Saves the current project.
Save Project As: Saves the Current Project as a new file name.
Import Image: Opens a dialog box for importing a new microarray image.
Recent Projects: A list of recently opened projects appears here.
Exit: Exits the program.
13
RGMA10011 rev B
The Edit menu offers a variety of choices for editing the current project and allows general program settings to be adjusted.
Project: Edit project properties such as project and researcher name.
Normalization: Edit the normalization groups and methods for the current project.
Add Condition: Add a condition to the current project.
Rename Condition: Rename the current condition (active only when a condition is
selected in the Project Tree).
Remove Condition: Remove the current condition from the project tree (active only
when a condition is selected in the Project Tree).
Add Microarray: Add a microarray to the current condition (active only when a
condition is selected in the Project Tree).
Remove Microarray: Remove the current microarray (active only when a microarray
is selected in the Project Tree).
Settings: General program settings (see Settings section).
The Comparison, Profile, and Cluster menus represent the core analysis capabilities of
PathwaysTM. Comparison analysis is used to analyze data for an entire set of clones (e. g., determination of upregulation or downregulation of clones over two experiments). Profiling analysis
views data as a function of experimental conditions (e. g., determination of the general trending
of a subset of genes in a time course study). Clustering analysis generates associations between
clones in a data set, automatically.
14
RGMA10011 rev B
Each analysis menu has four submenus that represent how microarray data could be grouped for
the analysis: Microarray(s), Microarray Pair(s), Condition(s), Condition Pair(s).
These analysis modes and the analysis groupings are discussed in detail in later chapters.
The Tools menu offers access to the Quick Start palette, Path editor, an internet Browser window, and a Web link editor. Updating of PathwaysTM data and plug-ins is also launched from
the Tools menu. The Array Designer is only available in PathwaysTM 4 Universal (refer to
Chapter 4 for more information on the Array Designer).
The Help menu offers access to help on the PathwaysTM program, including general information
about the program, and a searchable version of the PathwaysTM manual.
The Windows menu presents several options for managing the active analysis windows in the
workspace. For details, refer to the description of the workspace.
2.3 Workspace
During a PathwaysTM analysis session, the Workspace may contain multiple analysis windows.
The current analysis window completes the appropriate information in the detail and filter views
(the browser, for example, does not use the detail and filter views).
15
RGMA10011 rev B
When an analysis window is open, the Window menu options on the main screen are active.
The four options (Cascade, Maximize, Tile Horizontally and Tile Vertically) allow management of multiple windows simultaneously.
Cascade
Horizontal
Vertical
Maximize
In addition, each current analysis window is displayed in this menu.
An analysis window displays a title bar at the top of the window, along with minimize, maximize, and close buttons. The title bar displays the type of analysis. It also gives details of the
averaging method (microarray address or clone address, refer to Chapter 7 for more information) used for data analysis.
2.4 Project Tree
The Project Tree area displays the current Project as a tree of conditions and their microarrays.
Right clicking in the Tree window generates menus that serve as a shortcut to much of the functionality in the Edit menu.
Right clicking outside any conditions generates a menu that allows adding a condition. Right
clicking on a condition generates a menu that allows adding a microarray to the condition or
renaming or removing the condition. Right clicking on a microarray generates a menu that
allows removing the microarray from the project. Adding or removing conditions or microarrays to the project generates a prompt to close any active analysis windows that would be
affected by the modification.
16
RGMA10011 rev B
2.5 Detail View
The detail view area of the GUI shows thumbnail pictures of the analysis window’s currently
selected clone, along with a table of information on the selected clones. The detail view area
starts with web links, then thumbnail(s), and finally an information table (associated meta data).
The detail view area of the GUI may appear different if a framework is used that does
not supply geometry.
The Web Links button at the top of the detail view opens a web browser that connects to
Unigene, Genecards, and other web sites that display information related to the clone. These
sites can be expanded by either editing links through the Tools menu or through the pluggable
web interface (refer to the Data Updating chapter).
The forms of the thumbnail section depend on the grouping selected for the analysis.
· Microarray(s): A thumbnail image is shown for the currently selected clone.
· Microarray Pair(s): A thumbnail image is shown of the current clone from each of the
two microarrays. The ratio and difference of the normalized intensities are shown
in the meta data table below the thumbnails.
· Condition(s): A thumbnail for each microarray that contributes to the current point is
‘stacked’ on the thumbnail view. A spinner control flips through each thumbnail
(if this data point does not have any repeats, then the spinner is disabled). The
average normalized intensity for the currently selected clone is displayed in the table
below the thumbnail.
· Condition Pairs(s): Condition pairs are displayed as two ‘stacked’ condition thumb
nails. The average normalized intensity for each condition is listed in the table
below, as are the ratio and difference between the pairs. Because each condition
can contain clones from different microarrays, a check box next to each condition
label indicates the condition from which to derive the meta data in the table.
The ratio is displayed in a ‘+ / - ratio’ format, meaning that upregulation (B>A) is displayed as
positive B divided by A and downregulation (B<A) is displayed as negative A divided by B.
17
RGMA10011 rev B
Examples of each detail view are shown below.
Microarray
Microarray Pair
Condition
Condition Pair
The intensity, background, and normalized intensity values are displayed to the right of each
thumbnail image. The signal intensity and background intensity represent the sampled intensity
values that were measured during the importing process. The normalized intensity is the calculated normalized intensity for this clone in the current project. The background value is the raw
intensity, useful when evaluating low intensity points. Genes with intensities at or near the
background average could be noise.
Meta data such as cluster ID, accession number, and cDNA ID is also listed in the detail view.
This data can be updated as new information becomes available through the ResGenTM data
server (for details, refer to Chapter 14).
18
RGMA10011 rev B
Right clicking on the thumbnail image generates a menu with options for contrasting the image
(see Contrast Controller, below), viewing the original image, and saving the thumbnail images.
Image and data files are stored separately, and if a data file is moved, the location of the image
file must be updated. The menu includes an option updating the location of the image.
Additionally, options for adding the current clone to an existing or new path or invalidating a
particular clone appear in the menu.
2.6 Filter View
The filter view displays available data filters for the current analysis window.
When a filter setting is adjusted, a check mark appears beside the filter name in the filter view.
Refer to Chapter 9 for a detailed discussion of filter use.
19
RGMA10011 rev B
2.7 Quick Start
The Quick Start palette offers a quick method of accessing core functionality in PathwaysTM 4,
including the Array Designer (disabled with PathwaysTM 4 GeneFilters).
Quick Start appears automatically at startup (unless the option is disabled), or it may be
launched at any point from the ToolsQuick Start menu. Quick Start reappears after tasks are
finished, unless the Close button is clicked.
Quick Start performs the following functions.
· Imports images
· Opens project files
· Launches the new project wizard
· Analyzes one or two microarrays
· Edits Paths
· Launches the Array Designer
These functions are discussed in detail in this manual.
The Quick Start menu includes the Array Designer in PathwaysTM 4 Universal. Refer
to Book II for information about using the Array Designer.
20
RGMA10011 rev B
2.8 Contrast Controller
A contrast controller is available when an experimental image is displayed in PathwaysTM. The
contrast controller is visible in the left pane of the interactive importing windows. Otherwise,
the contrast controller can be accessed through right clicking on any experimental image, such
as on the thumbnail in the detail view.
The contrast controller allows enhancement of experimental images.
Contrast slider: generates minimum contrast when the slider is to the left,
maximum contrast when the slider is to the right.
Auto: automatically adjusts the brightness levels of the displayed image to the
minimum and maximum intensities for the experimental image.
Invert: inverts the image intensities (for example, black on white image is displayed as
white on black).
Color: indicates whether the image is displayed in grayscale or color.
In addition to the standard settings, the contrast controller for the thumbnail has an option to
display the entire original image from which the thumbnail is being displayed, to save the
thumbnail image, and to update the location of the saved image.
Changing the contrast for the thumbnail image changes the contrast for thumbnails that are displayed for the same microarray. However, this change does not affect the contrast of thumbnails for other microarrays that are being displayed; each image must be contrasted separately.
21
RGMA10011 rev B
Thumbnail images are framework-dependent. Some frameworks may not supply the
geometry necessary to construct an image of the microarray. In such cases, the
thumbnail image will contain the text “N/A,” as shown below.
Additionally, right-clicking on the detail view window area generates a different
menu.
The options for invalidating a clone and adding a clone to a new or existing path are
present, but the thumbnail options are not.
22
RGMA10011 rev B
2.9 Progress Bars
Progress bars are shown in PathwaysTM when lengthy operations are performed to indicate the
progress of the operation. The progress bar on the lower right of the GUI indicates the progress
of a basic operation like loading a file or calculating clone centers in the importing process.
A drawing progress bar appears in the upper left corner of a panel when a time consuming
drawing operation is underway, such as drawing a synthetic array or an experimental image.
23
RGMA10011 rev B
2.10 General Settings
General settings for PathwaysTM 4 are found under the EditSettings menu.
General settings allow entry of a default Researcher name for projects and imports, the preferred look and feel for PathwaysTM, and whether to load the last project when PathwaysTM is
started. The Look and feel option can be set to System (the program would, for example, look
like a Windows application when running on a Windows operating system) or Java (a characteristic look for Java applications that appear the same on any operating system). The Load last
project option, when checked, loads the most recent project. The Hide clone cursor during
snapshots option, when checked, hides the clone cursor while snapshots are being taken.
Internet settings allow specification of the built-in web browser and for online update services.
The default options for Update Source may be set to either Network or CD. The default
Browser font size and Proxy settings can be entered. For computers behind a firewall,
PathwaysTM supports proxies and proxy authentication. To enable proxy support, check the Use
Proxy checkbox, and enter the host and port in the Proxy host and Proxy port fields, respectively. Microsoft Proxy™ users must complete the IP address of the proxy and not the windows
domain name (for example, \\Proxy is not a valid proxy name). If the proxy requires authentication, check the Authentication box, and enter a username and password. The proxy password is stored in an encrypted format in the settings. These proxy settings are used for browser
windows (and weblinks) and the update service. Contact the system administrator to determine
whether proxy settings are required to access the internet.
24
RGMA10011 rev B
2.11 Online Help
The help menu allows access to two submenus: Help Topics and About. About offers general
information on PathwaysTM software, including the license key. Help Topics offers online
access to the full PathwaysTM manual, a glossary of terms, and a keyword search utility.
25
RGMA10011 rev B
Book II: Universal Concepts
26
RGMA10011 rev B
Chapter 3: Frameworks
3.1 Introduction to Frameworks
PathwaysTM Universal introduces the concept of frameworks. Frameworks are collections of
modules that work together to provide a method of importing microarray data from various
sources.
Previous versions of PathwaysTM came with one framework that limited the importing of
microarray data to ResGenTM GeneFilters image files. ResGenTM GeneFilters microarrays
were imported into the PathwaysTM program using the standard PathwaysTM framework.
Sophisticated image processing techniques then transformed the raw image file into a computational description of the microarray. PathwaysTM used this description in its analysis of the
microarray.
Create Project
GeneFilter
GF
Description
Plugin
Normalize
Data
Raw
Image
Importer
(Batch/
Interactive)
Analyze
Data
Data Source
Data File
Comparison
Visualization
Time Series
Filtering
Cluster
Web-links
Report
PathwaysTM Universal allows the importing of microarray data from several different sources
and formats. In addition to ResGenTM GeneFilters microarrays, the standard PathwaysTM
framework now supports other microarray formats through the use of the Array Designer (refer
to Chapter 4 for details about the Array Designer). PathwaysTM Universal also comes bundled
with new framework plug-in modules which can take data from spreadsheet files, Gene
Expression Markup Language (GEMLTM) files, and other formats (e.g. databases) through a
pluggable interface. Through the use of the framework plug-in modules, PathwaysTM can take
microarray data from nearly any source and transform that data into a format the program can
use for analysis.
27
RGMA10011 rev B
Affymetrix
spreadsheet
Other
spreadsheet
Clontech
Spreadsheet
Framework
GeneFilter
GF
Description
Plugin
Array
Designer
Universal
Description
Plugin
Corning
GEML
Spreadsheet
Other
Descriptions
(Pluggable)
Other
formats
Pathways
Framework
Raw
Image
Data Source
Normalize
Data
Data File
Analyze
Data
Affymetrix
Genechip
GATC file
Rosetta
Flexjet DNA
Microarrays
Create Project
Importer (Batch/
Interactive)
Rosetta
GEML
Conductor
Comparison
Visualization
Time Series
Filtering
Cluster
Web-links
GEML
Framework
BioDiscovery
AutoGene
Other GEML
Sources
Other
Frameworks
(Pluggable)
Report
Frameworks provide a means of loading and saving data, but they may serve other functions.
Frameworks that use raw image files may provide a different way of importing and viewing
images. The functionality of the framework depends on the type of microarray data being
imported. Because frameworks are plug-in modules, new frameworks for previously unsupported microarray data sources can be developed and integrated into PathwaysTM.
3.2 Influence of Frameworks
Frameworks influences the File menu, where new menu options may be introduced for importing microarray data. Some frameworks obtain their microarray data through a relatively simple
process, such as reading the data from a spreadsheet file. For these frameworks, an image
import tool is unnecessary. For other frameworks, where the process of converting the original
array image into a useful representation is more complicated, the framework must provide an
image import tool.
One example of this kind of framework is the standard PathwaysTM framework, which transforms an image file into a computational description of a microarray. For PathwaysTM to identify the locations of spots on a microarray and then sample their intensities, some user intervention may be required during the process (e.g. to verify that the auto-centering algorithm correctly identifies the spots' centers before it samples their intensities).
28
RGMA10011 rev B
Since each framework may provide a tool for importing microarray data into PathwaysTM, the
File menu may list multiple import options. The number of import options in the File menu
depends on the frameworks available with the PathwaysTM installation. For example, when only
the standard PathwaysTM framework is present, or when other frameworks that do not import
other file formats are present, the File menu lists a single import option, Import Image.
When an additional framework is present that supports the importing of other file formats, such
as a database, the Import Image option becomes a cascading menu with entries for all frameworks that support importing (the database framework is available as a reference implementation in source code format upon request).
Other features may depend on the type of framework. The detail viewer may not display
thumbnails with certain frameworks. Refer to Chapter 2 for more information about thumbnails. Additionally, the synthetic microarray view is unavailable if the framework does not provide geometry. Refer to Chapter 11 for more information about the synthetic view.
29
RGMA10011 rev B
3.3 The PathwaysTM Framework
The PathwaysTM framework is the standard framework used to import microarray data for analysis. Before data reaches the PathwaysTM framework, it must be processed by a Description plugin. Description plug-ins provide a format for geometry, meta data, and other information that
PathwaysTM can use for analysis. ResGenTM GeneFilters microarrays pass through the GF
Description plug-in before the PathwaysTM framework utilizes them. Other data types pass
through the Universal Description plug-in, after the Array Designer processes them (refer to
Chapter 4 for more information on the Array Designer).
PathwaysTM stores a list of previously imported microarrays in a library file, organized by
microarray brands and types. This library is similar to a collection of recently accessed files.
The user needs only to import the data for a microarray once. After that, the data is available in
the library or by browsing directly for the imported file. Use this library to set up new projects
in PathwaysTM.
A project consists of one or more conditions, which in turn consist of one or more microarrays.
The process of creating a project involves creating a condition and then adding microarrays to
it. To add a microarray to the currently selected condition, choose the Add Microarray menu
item from the Edit menu, or right click on the condition name. The Add/Remove Arrays dialog box appears.
30
RGMA10011 rev B
The Framework field allows the user to choose a framework in which to work.
The contents of the rest of this dialog box depend on the current framework. The PathwaysTM
framework allows the user to add microarrays to a condition by selecting them from the library
of previously imported microarrays or by browsing the file system for additional microarray
files that are not in the library. Chapter 15 contains a detailed example of adding a microarray
using the PathwaysTM framework.
For frameworks that do not provide an import tool or a library of previously imported files, the
only way to add new microarrays to the project is to browse the file system. In this case, the
user's responsibilities are reduced to selecting the file and answering a few questions about how
to map the data in that file to a microarray data model.
3.4 The Spreadsheet Framework
One way of adding a new microarray to a project without using an image import tool is through
using the Spreadsheet Framework. The spreadsheet framework derives intensities and meta
data and may optionally derive geometry from a delimited text file. In this example, an
Affymetrix GeneChip file is imported, though the process is the same for any spreadsheet.
To add a microarray from a spreadsheet file, select the project condition to add the GeneChip
experiment to and select Add microarray(s) from the Edit menu.
31
RGMA10011 rev B
The Add/Remove Arrays window appears. Select Spreadsheet from the Framework field at
the top of the window.
Switch to the Browse tab to locate the GeneChip file. Click on the file, and then click on the
Add button. The Import Spreadsheet wizard appears.
The first time a spreadsheet layout is being used, a profile of the layout must be created. The
program remembers this profile so that future microarrays using the same spreadsheet layout
may be imported without resetting the parameters. The first screen of the Import Spreadsheet
wizard contains fields where the microarray Brand, File Layout, and Type can be set. The File
Layout is the most general descriptor; it contains information about the layout of the spreadsheet. The same File Layout may be used for many different Brands. Similarly, the same
Brand may contain many different Types.
In addition, Experiment and Researcher names and Annotations may also be entered on this
screen. Once the layout has been created, click the Next button to continue.
32
RGMA10011 rev B
If the file layout has been created, the next two steps may be skipped by clicking the Finish button. The microarray is imported without changing the layout. Clicking the Next button will
generate a window asking if the user wants to Edit or Copy the layout.
Set the layout of the spreadsheet on the second screen of the Import Spreadsheet wizard.
The Layout name field contains the name that was entered in the File Layout field on the previous screen. In the Text Qualifier field, select the symbol used to delineate text from the rest
of the spreadsheet. Typically, this symbol is either an apostrophe (') or quotation marks (").
Select None if the spreadsheet does not delineate text. For Affymetrix spreadsheets, quotation
marks are used as the text qualifier.
33
RGMA10011 rev B
In the Start with row field, select the row on which the data begins. In the Header row field,
select the row on which column headers for the spreadsheet are located, or select None when
there is no header. Typically, the header row will be one row above the first row of data. For
this example, the data start on row 5, and the header row is row 4.
In the Delimiter field, select the character used to separate columns in the spreadsheet. The
Affymetrix spreadsheet in this example is separated by the Tab character. If the Ignore consecutive delimiters box is checked, PathwaysTM treats two consecutive delimiter characters as one.
34
RGMA10011 rev B
Once these fields have been selected, click the Next button to continue. The third screen of the
Import Spreadsheet wizard appears.
In the Column Identification section, a Data Type and a Label for each column may be
entered. One column must be set as the Primary Key. The Primary Key is a unique identifier
for genetic material that PathwaysTM uses to distinguish between microarrays. The clone key is
usually the accession number or image ID of the clone although the key could follow any other
naming convention. As discussed in Chapter 9, the key field is one way of grouping similar
clones together for statistical analysis. A Secondary Key mst be specified if the spreadsheet
has any missing Primary Key entries. Refer to Chapter 7 for more information on keys. In this
example, the first column is used as the Primary Key for Affymetrix spreadsheets.
35
RGMA10011 rev B
One column must be set as the Intensity. The average difference (Avg Diff) column is used as
the Intensity setting for this example.
The last column of the example Affymetrix spreadsheet file contains a text description of the
experiment. Set the data type for this column to Meta Data to see it during analysis. The label
for Meta Data may be edited by the user. In addition, the data type for additional columns may
be set to Meta Data to view those columns during analysis.
A spreadsheet may provide geometry in the form of X and Y coordinates. If it does so,
PathwaysTM will create a synthetic view of the microarray during the importing process. Set the
appropriate columns to specify X and Y coordinates for a layout.
36
RGMA10011 rev B
The Data Preview section of the window contains the finished layout of the spreadsheet. If the
spreadsheet is improperly laid out, click the Back button to change its parameters. To finish
importing the spreadsheet, click the Finish button.
3.5 The GEMLTM Framework
The Extensible Markup Language (XML) is a syntax format created by the World Wide Web
Consortium for creating customized markup languages. XML can be used to create tags that
focus on a particular type of data. XML-based tag sets are designed according to their content,
allowing them to provide specific information about their content and how that content relates
to other data. They are self-describing, eliminating the need to include extraneous documentation when transmitting data.
The Gene Expression Markup Language (GEMLTM) is an XML-based tag set that provides a
method for exchanging gene expression data and related annotations. Rosetta Inpharmatics
developed GEMLTM as a means of transmitting data between different gene expression systems,
databases, and tools. GEMLTM separates data collection and reporting from the methodology
used to collect and report that data, enabling the analysis of data derived from differing methodologies through the use of the same syntax.
PathwaysTM Universal features a GEMLTM-compatible framework that takes GEMLTM files and
translates them into a format the program can use in the analysis of data. PathwaysTM processes
GEMLTM files directly with the GEMLTM framework. Other gene expression data files can be
converted to GEMLTM files through a program like the Rosetta GEML ConductorTM.
The GEMLTM framework does not provide an import tool, so new microarrays must be added by
browsing the file system. In this way, adding a GEMLTM file is similar to adding a spreadsheet
file.
To add a new microarray to the project from a GEMLTM file, select the project condition to add
the experiment to and select Add Microarray(s) from the Edit menu. The Add/Remove
Arrays window appears. Select GEML from the Framework field at the top of the window.
37
RGMA10011 rev B
Switch to the Browse tab to locate the file in the system. The GEMLTM framework can automatically decompress ZIP and GZIP files in addition to opening GEMLTM files, so make sure the
Files of type field is set appropriately.
Select the GEMLTM file, click the Add button, and then click the Ok button to continue. A window will appear asking for confirmation.
To finish importing the microarray from the GEMLTM file, click the Yes button.
38
RGMA10011 rev B
Chapter 4: The Array Designer
4.1 Introduction
Previous versions of PathwaysTM imported a single microarray type, ResGenTM GeneFilters.
PathwaysTM Universal introduces the Array Designer feature, which facilitates the import of any
microarray type as long as certain data is known about the array layout. Using the Array
Designer is a simple matter of telling PathwaysTM some information about the type of microarray to be used.
Different microarray types use different array layouts. To import an image, PathwaysTM must
know what kind of array layout to expect. The Array Designer allows the user to give the
program the layout information it needs to import a microarray image for use in analysis.
During the analysis process, the user may want to know more information about a microarray
spot with a certain intensity. The Array Designer allows the user to associate descriptive
information (meta data) with intensity for each microarray spot in the layout.
The Array Designer provides customized microarray layouts for GEMLTM files, Clontech AtlasTM
Array Gene List files, and Corning CMTTM Map files. It can also design layouts for any other
type of microarray that is described in a spreadsheet format. The spreadsheet must include
the X and Y coordinates for the array layout and the associated meta data for each spot on
the microarray. The Array Designer takes this information from the spreadsheet file and creates a visualization of the microarray, which can then be imported for analysis.
When a layout is designed using the Array Designer, the user will enter the Brand and Type of
the microarray. A microarray brand is usually the name of the product line (e.g. GeneFilters),
while a microarray type is the specific kind of microarray from that product line (e.g. GF200).
A specific brand may contain many different types. Once the Array Designer creates a layout
for a particular type of microarray, PathwaysTM stores information about that microarray in
description files. These description files are located in the installation directory in the folder
Descriptions\Universal\<Brand>, where <Brand> is the user-inputted name of the product
line.
The user needs to design a layout for a particular microarray type only once. After that,
the user can import images of this microarray type multiple times without having to
design a new layout.
4.2 Concepts: Importing
Microarray intensity levels must be measured before a microarray experiment can be analyzed.
The importing process begins with a raw image (Tiff, Gel, Fuji, etc.) of a microarray and ends
with sampled intensity levels for each spot present on the microarray.
39
RGMA10011 rev B
The Array Designer allows the user to provide PathwaysTM with the information necessary to
import and sample microarray images. This information includes the physical location of the
spots on a reference (ideal) layout and descriptive information (meta data) for each spot. Once
the array design has been provided to PathwaysTM, a description of the design will be stored on
the computer’s hard drive, and this description will be used in importing and analysis of the
given brand and type.
Before the spot intensity can be sampled, it is necessary to determine the location of each spot
on the experimental image. There are two primary steps in the spot centering process:
1 Determining seed locations for the spots
2 Refining the seed locations to more exactly match the experimental image
Each of these steps is discussed in more detail below.
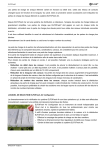
4.3 Concepts: Auto/Crop Mode
The PathwaysTM importer has a built-in capability for determining the skew (angulation) of
microarray images and then searching for the rows and columns that are typically present in
microarray layouts. These rows and columns can be used to automatically generate seed locations for each spot, based upon the individual spot's row and column in the reference geometry
provided to the Array Designer. This concept is illustrated below (the crosses represent the seed
locations which would be determined for these rows and columns).
40
RGMA10011 rev B
Seed locations will not necessarily find the exact location of the spot centers. Therefore, each
seed location is independently adjusted using a user-specified autocenter mode.
The three autocenter modes which are available in the current release of PathwaysTM are
Centroidal, Profile, and None. These modes will be discussed in more detail later in this chapter.
The PathwaysTM importer allows a cropping window to be specified. The purpose of this cropping window is to reduce the region of the image which will be searched during the auto alignment process. This cropping window should not be confused with the template bounding box,
which is described later in this chapter.
The PathwaysTM importer only requires the x and y location of the spot centers in a reference layout and the choice of autocenter mode in order to execute the auto/crop mode for
determining centers.
4.4 Concepts: Template Mode
Sometimes noise levels in the image or other characteristics of an experimental image prevent
the auto/crop mode from successfully aligning the image. If this is the case, the user will manually generate the seed locations for the spots using templates. Templates are sketches of the
ideal position of the spots which are superimposed upon the experimental image in the
PathwaysTM importer to generate the initial seed positions. All templates are tied to a global
bounding box which is used for initial sizing and positioning of the templates. This global
bounding box is by default anchored at the minimum and maximum positions on the microarray, but can be set by the user to, for example, lie on top of control points on the user's array.
Once the global adjustments are complete, each point on each template can be individually fine
tuned before generating the seed locations.
41
RGMA10011 rev B
In a simple microarray geometry, such as the one shown below, the user may choose to have a
single template that lies on top of the global bounding box (this is the default configuration for
the Array Designer).
Once this template is overlaid on the experimental image, PathwaysTM will generate the seed
positions for each spot based upon a comparison of the template in the ideal coordinates versus
the position of the template in the overlay in the experimental image.
Often the manufacturing process for microarrays introduces known offsets in spot positions
based upon the mechanical devices that create the microarray. For example, each subgrid in a
microarray layout with multiple subgrids might be offset from the other subgrids due to the
manufacturing process.
42
RGMA10011 rev B
If this is the case, then it is advisable that each subgrid be assigned its own template in the
Array Designer (in the figure below, templates are shown in red, global bounding box in black).
In general, the smallest number of templates needed to adequately describe the geometry should
be used because each template may require further individual adjustment by the user during the
import process.
Regardless of the number of templates, the final portion of the template importing process is
identical to the auto/crop mode. The seed positions which are generated from the template
overlay are fine tuned according to the autocenter mode choice.
For more information on the autocentering and the importing process, refer to Chapters 5 and 6.
43
RGMA10011 rev B
4.5 Opening the Array Designer
To open the Array Designer, select Array Designer from the Tools menu, or click the bottom
button in the Quick Start menu.
The Array Designer - Data Source window appears.
44
RGMA10011 rev B
WARNING
Pathways must be restarted if a microarray description which
has been loaded into the current PathwaysTM session (e.g. the
description has been used within a project or within the importer)
is modified. Changes made in the Array Designer will not take
effect until PathwaysTM is restarted.
TM
If a layout has already been defined for the type of microarray layout being designed, select
Read layout information from a Previously created design, and click the Next button. A
window appears, and it asks for the location of the description file.
Click the Browse button to locate the description file in the system. PathwaysTM creates a
description of the attributes of every microarray layout designed with the Array Designer. The
program can then access these files quickly for future use. Description files must be stored in
the Descriptions\Universal\<Brand> folder in the PathwaysTM installation directory, where
<Brand> is the entered name of the product line.
4.6 Reading from a Spreadsheet File
The Array Designer provides customized microarray layouts for GEMLTM files, Clontech AtlasTM
Array Gene List files, and Corning CMTTM Yeast Array Map files. When the microarray data is
in none of these formats, a layout for the microarray must be designed from a spreadsheet file.
45
RGMA10011 rev B
To design a layout for a spreadsheet, select Read layout information from a Spreadsheet file
from the Array Designer - Data Source window, and click the Next button. A window
appears, and it asks for the file location.
Click the Browse button to locate the file in the system. Once the file has been located, click
the Next button. A window appears, and it asks for information about the spreadsheet.
In this window, enter the microarray File Layout, Brand, and Type. The name entered in the
File Layout field is used to signify a set of attributes for the spreadsheet. The name entered in
the Brand field is the name of the product line, and the name entered in the Type field is the
kind of microarray from the product line.
PathwaysTM stores this information and creates a profile for the spreadsheet layout, allowing the
researcher to quickly import a microarray that uses the same layout. If a spreadsheet has been
defined for the microarray being imported, click the Finish button to proceed to the array design
stage.
46
RGMA10011 rev B
If a microarray layout is being designed for the first time, click the Next button to define the
attributes of the spreadsheet in the Spreadsheet Import wizard.
The Layout name field contains the name that was entered in the File Layout field on the previous screen. In the Text Qualifier field, select the symbol used to delineate text from the rest
of the spreadsheet. Typically, this is either an apostrophe (') or quotation marks ("). Select
None if the spreadsheet does not delineate text.
In the Start with row field, enter the row on which the data begins. In the Header row field,
enter the row on which column headers for the spreadsheet are located, or enter None when
there is no header. Typically, the header row is one row above the first row of data.
In the Delimiter field, select the character used to separate columns in the spreadsheet. If the
Ignore consecutive delimiters box is checked, PathwaysTM treats two consecutive delimiter
characters as one.
47
RGMA10011 rev B
Once these fields have been selected, click the Next button. The next window of the Import
Spreadsheet wizard appears.
In the Column Identification section, a Data Type and a Label for each column may be
entered.
When designing a layout for a microarray image with the Array Designer, the user must
indicate which columns are to be used for X and Y Coordinates. When these columns are
not specified, the program lacks the geometry data that it needs to construct an image for
importing.
One column must be set as the Primary Key. The Primary Key is a unique identifier for genetic material that PathwaysTM uses to distinguish between microarrays. The clone key is usually
the accession number or image ID of the clone although the key could follow any other naming
convention. As discussed in Chapter 9, the key field is one way of grouping similar clones
together for statistical analysis. A Secondary Key mst be specified if the spreadsheet has any
missing Primary Key entries. Refer to Chapter 7 for more information on keys. The user may
edit the Label field for Primary and Secondary Keys.
Any column containing descriptive information can be set as Meta Data. When a column’s
Data Type is set as Meta Data, the column information for each spot is available during the
analysis process. The user may edit the Label field for Meta Data.
48
RGMA10011 rev B
The Data Preview section of the window contains the finished layout of the spreadsheet. If the
spreadsheet is improperly laid out, click the Back button to change its parameters. To proceed
to the Array Design stage, click the Finish button.
4.7 Reading from a GEMLTM File
To design a microarray layout for a GEMLTM file, open the Array Designer and select Read layout information from a GEML file from the Array Designer - Data Source window. Then
click the Next button. A window appears asking for the file location. Click the Browse button
to locate the file in the system. Once the file has been located, click the Next button. A window
appears, and it asks for information about the GEMLTM file.
In this window, enter the microarray Brand and Type. PathwaysTM stores this information and
creates a profile for GEMLTM files of this type. Once the microarray Brand and Type have been
entered, click the Finish button to proceed to the array design stage.
4.8 Reading from a Clontech AtlasTM Array Gene List File
To design a microarray layout for a Clontech Gene List file, open the Array Designer, and select
Read layout information from a Clontech Gene List file from the Array Designer - Data
Source window. Then click the Next button.
49
RGMA10011 rev B
A window appears, and it asks for the file location and for the Array Type of the gene list file.
Select the appropriate Array Type for the gene list file. The Array Designer currently supports
Clontech 1.2 Arrays, Trial Arrays, Small Arrays, and Large Arrays (see http://www.clontech.com/atlas/index.shtml for more information about these array types). The Brand is automatically set as Clontech, and the Type is derived from the filename. Click the Browse button
to locate the file. Once the file is located, click the Finish button to proceed to the array design
stage.
4.9 Reading from a Corning CMTTM Map File
To design a microarray layout for a Corning CMTTM Map file, open the Array Designer and
select Read layout information from a Corning Map file from the Array Designer - Data
Source window. Then click the Next button. A window appears, and it asks for the file location
and for the Array Type of the file.
50
RGMA10011 rev B
At the time of printing, Corning supports only CMTTM Yeast Gene Arrays. Future plug-ins
will provide support for other Corning formats as they become available. Click the Browse button to locate the file. Once the file is located, click the Finish button to proceed to the array
design stage.
4.10 The Array Design Stage
After the layout information is specified, the Array Designer window appears.
This window creates a view of the microarray from the layout information in the file. The
fields along the top of the window allows the user to adjust certain attributes of the microarray
and of the importing process.
Trim size allows the user to set the amount of space to trim from the edge of the image. If the
user specifies a Trim size, trimming occurs after centering during the import process. The designated Trim size is cropped from the edge of the imported image. The units used to calculate
this space are the same as the units in the input file (e.g. pixels). Spot size allows the user to
set the size of the microarray spots, using the same units as the input file. Spot shape allows
the user to set whether the microarray spots should be circular or rectangular. Both Spot size
and Spot shape are considered during the import process, after centering has been completed.
51
RGMA10011 rev B
The Autocenter mode allows the user to set the mode to use to find the centers of spots. When
a microarray is imported, the program calculates a seed position for the center of each spot.
However, many factors can introduce noise into the image, causing the positioning of centers to
be slightly off. When the microarray image is clean and uniform, the Autocenter mode can be
set to None to keep the positions of the centers where they are in a rigid grid pattern. There are
two other centering modes that can be used to recalculate the positions of spot centers.
· Profile: Profile autocentering scans the area around each spot and finds a peak intensity
both horizontally and vertically. The two intensities are cross-matched, finding the area
of highest intensity, which is usually the center of the spot. This mode is useful when the
image is high contrast.
· Centroid: Centroid autocentering scans the area immediately around the current
position of the spot center. The center position is moved towards the nearest area
of higher intensity. This movement occurs until all the areas around the center position
are of lower intensity. This mode is useful when the image is low contrast.
The user may need to experiment with different Autocenter modes to find what works
best.
The Color by field allows the user to set which microarray attribute to use in differentiating
color between the spots in the image, allowing for more accurate visual comparisons when creating a bounding box or template. In addition, the user may set the field to None to show the
location of the spots. The Color by field affects only the image during the layout design stage.
In the upper left section of the window, three buttons appear. The first button allows the user to
create a bounding box.
A bounding box is automatically created around the edges of the image when the layout is
designed. The bounding box serves as a global template for an array layout. It tells the program where to look for other templates. When it is not properly aligned, the user may create a
new one manually.
52
RGMA10011 rev B
To create a new bounding box, click on two places on opposite corners of the area to be bounded.
The bounding box appears. The bounding box provides PathwaysTM with a rough sizing estimate for any templates that may be present.
53
RGMA10011 rev B
The second button in the upper left section of the Array Designer window allows the user to
create a template.
Sometimes, microarrays are laid out in sections. Templates allow the user to mark the boundaries of these sections so that the program recognizes that the microarray is not uniformly
arranged (for more information on templates, refer to Chapter 6 and to Sections 4.3 and 4.4).
To create a template around a section of a microarray, click the four corners of the section.
The template appears around the section.
The third button from the left in the Array Designer window allows the user to delete a template.
54
RGMA10011 rev B
To delete a template, first move the cursor over one of the edges of the template.
The selected template is highlighted. Click on the template to delete it.
Once the bounding box is set and necessary templates have been created, click the Ok button to
finish designing the microarray layout. The microarray is ready to be imported into PathwaysTM.
55
RGMA10011 rev B
Book III: Core Concepts
Data Flow and Importing Images
56
RGMA10011 rev B
Chapter 5: Data Flow - From Experiment to Analysis
This chapter describes how the Pathways Framework imports and stores data. Other
Frameworks may use alternate methods to import and store data.
5.1 From Experiment to Analysis: The Importing Process
Microarray intensity levels must be measured before analysis of the microarray experiment can
begin. The PathwaysTM 4 image importing process begins with a microarray image and ends
with sampled intensity levels for the clones. There are five steps in the process of importing an
image file.
1 Loading the image
Pathways reads the image file and displays it on the screen.
2 Aligning / cropping / template
Adjust the image orientation and optionally apply a cropping window, or manually
specify the ‘grid’ of clones on the microarray.
3 Computing centers
PathwaysTM automatically computes the centers of the clones on the microarray.
4 Verifying centers
After computing the centers, PathwaysTM displays the computed points for
review and any necessary adjustment.
5 Writing output
The import process is complete when the PathwaysTM sample and image files are
written.
With a description file for a microarray, these PathwaysTM files contain information necessary to analyze microarrays in PathwaysTM 4.
In interactive mode, it is necessary to interact with the import process in Steps 2 and 4. Other
steps are automated by PathwaysTM. In batch mode, PathwaysTM performs steps automatically.
The Trim option automatically trims the boundaries before storing the image in PathwaysTM
image format. Trim reduces the file size of the stored image.
5.2 Supported Image Formats
Phosphor imaging systems store data in image file formats; the data represent intensities for
each pixel in the image. The intensity values may be encoded (scaled) to make the image files
smaller.
Tiff, Fuji, and PathwaysTM image formats are supported in PathwaysTM 4. Image readers are
pluggable in PathwaysTM, so the program can be extended to include any other image format.
57
RGMA10011 rev B
The Tiff option reads grayscale Tiff images (‘.tif’ or ‘.gel’) with or without square root encoding. The Fuji option reads the Fuji Bas scanners’ img/inf file combination (see Appendix II for
details). The PathwaysTM image format is a proprietary image format that stores raw image
data, image encoding parameters, and computed clone center locations after the import process.
The format is described in more detail below.
Users of Molecular Dynamics and Packard
phosphor imaging systems
Images originating from Molecular Dynamics and Packard
brand phosphor imaging systems use a special encoding of the
TIFF standard, characterized by a .GEL or .TIF extension.
While PathwaysTM software is capable of reading these specially
encoded files, do not open them in another application first.
Opening the images in a graphics application (such as Adobe
PhotoshopTM) strips out critical information used to decode the
image, leading to incorrect pixel intensities in the image.
5.3 Microarray Description Plug-Ins
The variety of available microarray products differ in geometrical layout, biological contents,
and manufacturing materials (e. g., glass versus nylon membranes). The differences in each
product potentially require different algorithms to describe the geometry, determine the location
of clone centers, and sample the data.
PathwaysTM 4 has a generic Microarray Description plug-in option (the GF Description plug-in)
that allows any microarray product to interface with the PathwaysTM suite of tools. The GF
Description plug-in has the following responsibilities.
· Providing PathwaysTM with a description of the product geometry (for example, describing
the arrangement of the oligos or clones on the supporting material)
· Providing PathwaysTM with meta data (accession, description, et cetera) for each clone on
the microarray
· Providing PathwaysTM with the location of clone centers on an experimental image
· Miscellaneous customizable items
The GF Description plug-in accesses this file to provide PathwaysTM with necessary information
for each clone. These description files can be augmented with additional data.
GeneFilters description files can be updated through the ResGenTM data server.
The user must select a microarray brand (e. g., GeneFilters) and a microarray name (e. g.,
GF200). When the brand and type are specified, PathwaysTM automatically locates the appropri-
58
RGMA10011 rev B
ate microarray description plug-in (e. g., ‘ResGenTM GeneFilters’).
5.4 Finding the Location of Clone Centers
Once the appropriate image format and description for the microarray is established, PathwaysTM
searches for clones on the microarray image. PathwaysTM has two methods for locating clones
on an experimental image: autocentering and template centering.
With autocentering, PathwaysTM searches for clones on the experimental image without user
input. The autocentering algorithm looks for patterns indicating rows and columns in the image
and then focuses on these rows and columns to locate clones. Experimental images are of varying quality, and the autocentering algorithm may not locate all the clones or it may misidentify
rows and columns. Therefore, visually inspect the results of the autocentering algorithm.
It is possible to give the autocentering algorithm a ‘hint’ as to where the microarray is located
on the experimental image by dragging a cropping rectangle around the microarray. The algorithm finds the clone locations as before, but it does not look outside the cropping window.
The cropping rectangle is available only during interactive importing. In batch mode, it is
impossible to specify the cropping rectangle (refer to Chapter 6 for more information about
these importing modes).
With template centering, drag a template (a sketch of the microarray layout) on top of the experimental image and adjust alignment points until they match the experimental image exactly.
The centering algorithm uses the template to identify the clone locations, rather than searching
the entire experimental image.
The most common use of template centering is when the autocentering algorithm fails during
importing. In addition, an alternate microarray product might not lend itself to autocentering
(for example, when there is no periodic, identifiable pattern to the clone layout). In this case,
the alternate microarray product would rely on the template mode for image importing.
5.5 Sampling Microarray Data
When the clone locations on the image are known, PathwaysTM samples each clone’s intensity
and background. In general, the sampled data for each clone includes an intensity and either an
overall background intensity or a background intensity per clone. The values of the clone and
background intensity are determined with the sampling plug-in to allow sampling algorithms to
be added.
59
RGMA10011 rev B
5.6 PathwaysTM Sample and Image Files
Once the microarray data is sampled, PathwaysTM stores the imported data in two files: a
PathwaysTM sample file and a PathwaysTM image file. The PathwaysTM sample file (‘.pws’
extension) contains the sampled clone intensities. The PathwaysTM image file (‘.pwf’ extension)
contains the calculated clone locations and a full resolution version of the original image. The
image may be rotated and cropped, depending on the alignment of the clones on the original
image.
PathwaysTM 4 uses the PathwaysTM sample file for data analysis. The PathwaysTM image file provides thumbnail pictures of the currently selected clone in an analysis window. The
PathwaysTM image format allows rapid file-based access to the raw image data for clones. The
advantage of file-based access is that the entire image need not be loaded into memory to view
clones, thereby dramatically decreasing the memory requirement for thumbnail views in the
analysis modules.
PathwaysTM 4 does not require the PathwaysTM image file to perform data analysis. If a
sample file (pwf) is loaded and there is not an accompanying image file, PathwaysTM issues a
warning and then proceed with the analysis. The only noticeable difference is that a question
mark icon is displayed in place of the selected clone thumbnail. Having two files means that
the sample file is small and can be shared between researchers, whereas the image file (pwf),
being a full resolution image file, can be 5 MB or larger.
PathwaysTM image files can be read back into PathwaysTM 4. A PathwaysTM image file can
be treated as a regular image file with the usual import procedure. In addition, PathwaysTM 4
files can be reimported into PathwaysTM without locating the clones, because this information is
already in the PathwaysTM image file. Therefore, it is possible, for example, to change the sampling technique for a file without finding clone centers. Likewise, it is possible to reimport and
adjust clone centers (if the center is found to be in error) without performing global alignments.
60
RGMA10011 rev B
Chapter 6: Importing
6.1 Image Import Dialog
The image import dialog sets the relevant parameters for an import session. Open the import
dialog: FileImport Image (CTRL+P)
PathwaysTM Universal users may see a completely different import dialog if they are
using a Framework that implements importing other than the Pathways Framework.
Before adding images to the import window, adjust the Files of type selection to indicate the
appropriate image extension. Next assure that the Image Format, Microarray Brand,
Microarray type, and Sampling type are adjusted appropriately. Check the Batch process
box to process these imports in a batch mode (see the section on batch importing for more
details). Select the Trim option to automatically trim the image to reduce the size of the saved
PathwaysTM image file.
The Reimport box is active when the selected image format is a PathwaysTM image. A
PathwaysTM image can be imported as a regular image. Otherwise, skip the initial centering
step, and read the computed centers from the PathwaysTM file. When reimport is selected, the
initial centering step is skipped, and the import process proceeds directly to data sampling and
clone adjustment. This feature is useful if the purpose of the reimport is to adjust a single
spot or to resample the data using a different sampling technique.
Normally, the importer expects to find black spots on a white background. Select the White on
61
RGMA10011 rev B
Black option to load the file as a white image on a black background. This option should be
selected if raw image file consists of white spots on a black background. The White on Black
option works differently from the Contrast Controller Invert option, which takes an image that
has already been imported and inverts it, turning the black spots into white spots on a black
background.
To add images to the import window, click once on the file to highlight the first import file in
the file browser, and click the Add button or double click the file icon to the left of the file
name. Add multiple files by following the same procedure (they must be of the same microarray brand and type and image format). Remove files from the list by highlighting the desired
file(s) and clicking the Remove button.
The default output file name for the imported data is the same base name of the input file, but
with a different extension. To change the name of the output files, edit the output name column by double clicking in the selected file table and typing the new file name.
To change the output directory for the imported files click the Browse button next to the output
directory field and select a directory from the output directory dialog box. A directory must be
selected in the directory dialog box for the Ok button to register the new directory.
In attempting to import an image with the same output file name and directory as an existing
PathwaysTM file, a dialog box appears and requests verification before overwriting the existing
file.
Image format, Microarray brand, Microarray type, and Sampling type are plug-in choices that
may have additional, specified properties. As an example, a sampling plug-in might allow
62
RGMA10011 rev B
changing the area around each sampled spot. When additional options are present, the button
to the right of the plug-in is enabled. Clicking this button allows specification of additional
options.
The default Sampling type for ResGenTM GeneFilters microarrays is called ResGenTM mean.
This algorithm visits each clone center and determines the mean image intensity inside a circular area surrounding the clone. The background level is determined by sampling intensities in
the gap between fields 1 and 2 of the GeneFilters microarray.
The ResGenTM mean sampling routine is set by default to sample
75 % of a spot. A pop up menu next to the sampling selection in
the dialog box (discussed below) allows changing the default setting. ResGenTM recommends this default setting. However, if the
default sampling area needs to be changed, do not compare
imported images with two different sampling areas. If the sampling area size is changed, the new size is remembered in future
PathwaysTM sessions to help assure consistent sampling from session to session.
The available sampling routines are dependent on the brand of Microarray (e.g. GeneFilters
are the only brand to use the ResGenTM mean). The Basic sampling type is available for all
microarray brands. To change the sampling routine, select the Basic sampling type.
Click the Edit plug-in properties button, located next to the Sampling type field.
63
RGMA10011 rev B
The Sampler plug-in Settings window appears. The spot sampling percentage may be adjusted
by moving the slider bar.
The Basic sampling type is a more generalized version of the ResGenTM mean sampling type
that allows the user to adjust the spot sampling percentage. Instead of determining the background level by sampling intensities in the center of the image, the Basic sampling type samples
a strip around the edge of the image. The spot sampling percentage is set to 75%, but the user
should experiment with different sampling percentages for different microarray types.
6.2 Introduction to Interactive Importing
Interactive importing is launched after clicking the Ok button in the Import dialog box without
the Batch option checked. Interactive importing consists of five steps for each image.
1 Load image
2 Align / Crop / Template
3 Compute centers
4 Verify centers
5 Write output
Interaction with the import process is required for only Steps 2 and 4; PathwaysTM performs
other steps automatically. The import window shows the current step highlighted in the upper
left corner.
Contrast slider and color options are available throughout the import process to enhance the displayed image. The contrast and color have no effect on the data sampling; instead, they
enhance the displayed image. Traditional gray scale images are displayed in 256 shades of gray.
False coloring makes 256 values available for each of the color channels (red, green, and blue),
and it can display over 16 million colors for the same image. See the graphical interface
overview chapter for instructions on adjusting the image contrast.
64
RGMA10011 rev B
The first window that appears is the image alignment window.
The image alignment window allows rotating the image and optionally applying a cropping rectangle (auto / crop mode) or template overlay (template mode). The Auto / Crop mode invokes
the fully automated centering routine, while the template mode uses a template overlay to locate
the centers.
Use the four rotation buttons to rotate the image by 0, 90, 180, and 270 degrees, respectively.
Rotation allows the image to be aligned.
Array images created using the Array Designer must be rotated to correspond with the
same image orientation used in the Array Designer.
65
RGMA10011 rev B
ResGenTM GeneFilters Microarrays Users
Most GeneFilters images autocenter without problems (assuming the orientation is as shown below).
In general, first try the autocentering without a cropping rectangle (click Next in the alignment window).
If PathwaysTM cannot find all the clones in this mode,
add a cropping rectangle. If PathwaysTM still cannot
find all the centers, use the template mode.
After the initial alignment setup, click the Next button; PathwaysTM calculates the clone centers.
When PathwaysTM is unable to calculate the clone centers, the alignment window is redisplayed,
and there is a prompt to adjust the alignment.
66
RGMA10011 rev B
On successful alignment, the alignment verification window appears.
When the centering process is not satisfactory, click the Back button to revert to the previous
window and adjust the centering parameters (see discussion below on cropping rectangles and
templates). Click Done to write the PathwaysTM sample data and image files and to complete the
import process. The following sections describe the interactive importing windows in more
detail.
6.3 Interactive Importing: Auto / Crop Mode
The auto / crop alignment mode invokes an automated algorithm that finds clones in the image.
A cropping rectangle can be dragged over the image to better define where the arrayed spots are
located. The crop / auto and template buttons are located to the right of the rotation buttons.
Use a cropping rectangle when multiple microarrays are within the image or when PathwaysTM
cannot find all the centers in the fully automatic mode.
67
RGMA10011 rev B
The cropping rectangle lies outside of the arrayed spots without overlapping the spots.
Perform the following operations to use a cropping rectangle:
· Click anywhere on the image and drag for the cropping rectangle to appear.
· Click anywhere inside the cropping rectangle and drag to move it.
· To stretch the cropping rectangle drag any of the handle points on the side or corners of
the rectangle.
· To rotate the cropping rectangle, press the Ctrl key, and drag any of the corners
(the center of rotation is the opposing corner).
· To remove cropping rectangle, click anywhere outside the rectangle.
When satisfied with the image orientation and with the positioning of the cropping rectangle (if
used) click the Next button to invoke the PathwaysTM autocentering routine.
68
RGMA10011 rev B
6.4 Interactive Importing: Template Mode
The template mode allows more precise specification of the alignment of the arrayed spots in
the image. The template mode overlays a template (skeleton representation) of the microarray
layout on top of the experimental image. When the template is lined up properly with the
experimental image, the clone centers can be determined by referring to the manufacturing layout of the microarray.
The template mode involves the following two stages.
1 Global alignment
2 Adjusting alignment points (with or without magnifier)
The Global setting drags (and rotates and stretches) a global rectangle that has the microarray
template type attached to it. The function is similar to that of the cropping mode discussed
above, but the objective is to use the global rectangle to align the template on top of the
microarray data, rather than to place the rectangle outside the microarray data points.
After the templates are adjusted using the global rectangle, the location of the alignment points
can be further refined using fine adjustments to alignment points in the template. These points
can be adjusted either with or without a magnifier, a feature that locally enhances the image for
more accurate adjustment of the alignment points.
Template mode is selected using the template button at the top of the import window.
Adjust the global setting.
Select Adjust Global (initially selected by default).
Drag / Resize / Move / Rotate the global rectangle as with a cropping rectangle
(instructions above).
As the global rectangle is dragged, a template is attached to it. Use the global rectangle as with
a cropping rectangle to align the template on top of the experimental image.
After the global alignment, uncheck the Adjust Global box, and refine the location of the template alignment points.
69
RGMA10011 rev B
To adjust template points with a magnifier present, perform the following steps.
1
Deselect the Adjust Global option, and select Use Magnifier.
2
Move the pointer over each alignment point, and a magnifier window appears
(an alignment hint picture also appears on the left panel).
3
Click anywhere in the magnifier window, and the alignment point snaps to this
location.
4
The magnification can be increased or decreased using the up or down arrow keys
while the magnifier is present.
Perform the following steps to adjust alignment points without magnification:.
Deselect the Use Magnifier check box.
Click and drag the alignment point to move it.
With ResGenTM GeneFilters microarrays, the template alignment points are located over 16 of
the control spots for each microarray. In Field 1 of the GeneFilters microarray, the template
alignment points are the upper right control spot in each grid. In Field 2 of the GeneFilters
microarray, the template alignment points are the lower right control spot in each grid (refer to
Appendix I). When the control spots are not visible (e. g., in cross-species hybridization), then
the alignment points must be in the approximate position where the control spots normally
reside; verify the accuracy of the alignment by viewing the overall template positioning.
70
RGMA10011 rev B
When dragging a template over a ResGenTM GeneFilters microarray
image, first click the upper right control point and then drag the template to the lower left corner of the microarray. Perform refinements
(resizing and rotation) to the global template position with the lower
left corner of the global template once the upper right control point is
positioned.
6.5 Reviewing Alignments and Saving
The second screen in the import process is the verification window. This window displays the
imported image with an overlaid grid representing the detected clone center locations. A detail
viewer is shown in the left panel.
A tool palette at the top of the window allows toggling the grid on or off, displaying of x’s to
mark invalid clones, exporting the sampled data to a spreadsheet file (comma separated text
file), or annotating the image with the researcher name and comments.
To bring clones into focus in the detail viewer:
Click the image at the appropriate location or
Use the up, down, left or right arrow keys
The detail window on the left of the screen can be used to zoom in and out of the image to better review the overall alignment of the image (up arrow key zooms in and down arrow key
zooms out when the cursor is in the detail viewer).
If the overall alignment of the image appears to be inaccurate, click the Back button, and repeat
the initial alignment step. When repeating the alignment step, add a cropping window or overlay a template for images that are problematic. If clone alignment appears to be inaccurate, then
71
RGMA10011 rev B
this clone can be adjusted individually.
To adjust clones, perform the following steps.
1
Select the clone (so that the appropriate clone is in the detail window).
2
Press the Ctrl key, and drag the alignment circle in the detail viewer.
Click the Done button to complete image import. When additional images are specified in the
import dialog box, the next image loads automatically. When no additional images were specified, the import process stops.
6.6 Invalidating a Clone
For microarrays originating from an image, a spot can be marked as invalid during the image
import process, after spot centers have been identified, by checking the Invalid clone box
below the detailed view of a selected spot.
Invalid spots are marked on the main microarray view with crosses.
72
RGMA10011 rev B
Such markings can be shown or hidden by selecting and deselecting the Toggle Invalid Clones
button on the toolbar in the upper left corner of the main view.
Spots marked as invalid during the image import process are seen as such initially during future
uses of the resulting microarray file in projects.
Refer to Chapter 9 for more information about Invalid Clones.
If analyzed microarray data comes from a spreadsheet file, clones with missing intensity or background data are marked as invalid automatically.
6.7 Batch Importing
Batch processing allows for the rapid, automatic import of multiple images. From an algorithmic standpoint, batch processing mode is identical to interactive mode without applying the
cropping rectangle. The autocentering algorithms in PathwaysTM 4 are robust. However, the
quality of experimental images varies, and the autocentering algorithm can fail to locate all the
clones or incorrectly identify rows and columns, especially for images with relatively low signal
levels (even if they appear to be normal by visual inspection). Therefore, visually inspect the
results of the autocentering algorithm. To determine how well the autocentering algorithms
work on experimental images before proceeding to a full batch mode, import multiple experimental images in the iterative auto / crop mode.
To start Batch importing, select Batch Process in the import dialog box, and click the OK button.
The batch import dialog box appears and shows a table of files being imported and the status of
each file in the import process. This dialog box begins the import process for images that were
selected in the import dialog box. When the import process is completed, the status for images
is listed in the second column. If the autocentering algorithm does not locate all the clones in
an image, then the Interactive box is checked next to the image, indicating that PathwaysTM
proceeds with an interactive importing session for this image.
When the files have been imported, the images and alignments can be previewed either in a
slide show fashion by successively clicking the Next or Previous buttons or by selecting files
from the table.
73
RGMA10011 rev B
Annotation information (Researcher / Comments) can be added by using the Annotate button.
The image contrast and color scheme can be adjusted by a menu that pops up after right clicking
on the image (see the section on image contrasting in Chapter 2). The grid can also be turned
on and off through this menu.
If an alignment passes autocentering but it still does not appear to be correct, select the checkbox to interactively import the image.
After previewing imports:
If one or more images are checked for interactive import, click the Interactive button at
the bottom of the dialog box to proceed with interactive import for the selected image(s)
or
Click the Done button. If imports were successful, it ends the importing process. When
any images are marked for interactive importing, a warning is issued before closing the
window.
74
RGMA10011 rev B
Book IV: Core Concepts
Pathways Data Organization and Management
TM
75
RGMA10011 rev B
Chapter 7: PathwaysTM Projects
7.1 Projects
A PathwaysTM analysis session begins with the creation of a project. PathwaysTM projects
organize previously imported microarray data into conditions that represent states in an experiment. Each condition contains one or more sampled microarray data sets.
A simple project can consist of one or two microarrays.
Project
Simple
Experiment
Project
Control
Condition
Condition
Two
Microarray
Experiment
Microarray
Microarray GF200
Control
Diseased
GF200
GF200
A more complex project can consist of multiple conditions, each containing multiple microarray
types and / or repeat data for the same microarray type.
Drug Time
Course Study
Project
Condition
Microarray
Time 0
GF200
GF200
1 Month
GF211
GF211
GF200
GF200
76
RGMA10011 rev B
GF211
GF211
6 Months
GF200
GF200
GF211
GF211
7.2 Conditions
Conditions can represent any experimental grouping. The most common uses of conditions are
for state comparison (e. g., normal versus diseased) or for time series comparison (each condition represents a time in the study). Each project can contain as many conditions as are necessary to represent the study.
Microarrays of a single condition need not be of the same type. Instead of analyzing data sets
one microarray type at a time (which could, for example, limit the analysis to approximately
5,000 clones for GeneFilters), the data set can comprise multiple microarray types, enabling
analysis of an unlimited number of clones.
Repeated clones in a condition are detected automatically during analysis. If a condition
contains repeat clones, then the analysis uses the mean of the normalized intensity for each set
of repeated clones. In addition, the existence of repeat elements enables the calculation of
experimental statistics for the sampled data sets.
PathwaysTM searches for repeat elements based on one of two entered methods: microarray
address or clone key.
The microarray address method identifies repeats based on common microarray types (physical location). For example, when two GF200 GeneFilters are present in a condition, and the
microarray address method is selected, the first clone in the first GF200 microarray is averaged
with the first clone of the second GF200, the second clone in the first microarray with the second clone in the second microarray, et cetera; standard deviation values for the repeated clones
are calculated for use in the analysis process. This type of averaging does not average multiply spotted clones in a microarray (if a clone appears in multiple locations in a microarray,
the clone key is the same, but the microarray address is different).
77
RGMA10011 rev B
A clone key is a unique identification that is present for each clone in a microarray. The clone
key is usually the accession number of the clone although the key could follow other naming
conventions for biological materials that are not in the public databases (for example, ResGenTM
uses the string “tgDNA” to identify total genomic spots). The option to identify repeats by
clone key searches for repeats of a clone key and groups these together. Averaging by clone
key enables statistical analysis for repeated clones in a single microarray and also enables
statistical analysis of the same clone across different microarray types.
When it is undesirable to average repeated experimental results, place the microarrays in
different conditions.
7.3 Grouping of Data
There are four ways of grouping data in a new analysis window: by Microarray(s), by
Microarray pair(s), by Condition(s), and by Condition pair(s).
Microarray grouping examines a single microarray to analyze normalized intensities (expression levels). Depending on the analysis type, synthetic arrays, line plots, tables, and other techniques view the data. When multiple microarrays are selected in a comparison analysis, then
the data from the microarrays are overlaid (synthetic microarrays and tables appear in tabbed
windows, while scatter plots show different colors or symbol types). Profiling and clustering
use multiple microarrays to analyze data over a range of experiments.
Microarray pair grouping examines the ratios and differences of normalized intensities
between a pair of microarrays (differential expression). These data may be viewed in a fashion
similar to that of the non-paired option. If multiple microarray pairs in a comparison analysis
are selected, then the paired data is overlaid in the analysis windows. Profiling and clustering
use multiple microarray pairs to analyze upregulation or downregulation over a range of experiments.
Condition grouping is similar to single microarray grouping, except that the analysis uses conditions rather than microarrays. Therefore, this analysis looks at a condition’s average normalized intensity (for repeated clones) across the microarrays. Multiple conditions may be selected
to overlay the data (comparison analysis) or analyze the data over a range of experiments (profiling and clustering analysis).
78
RGMA10011 rev B
Condition pair grouping is similar to microarray pair grouping, except that the ratios and differences represent the differences or ratios between averaged normalized intensities across the
microarrays. Multiple condition pairs may be selected to overlay the data (comparison analysis)
or to analyze the data over a range of experiments (profiling and clustering analysis).
7.4 Creating Projects in PathwaysTM
Create a new project in PathwaysTM 4 by selecting New Project from the File menu. This selection launches the Project wizard, which presents a guide for the creation of new projects. In
the first panel of the wizard, there is a prompt to select a single microarray project, a two
microarray comparison project, or a new blank project.
Each of these options is discussed in this chapter.
7.5 Single Microarray Projects
A single microarray project is a quick route to analyze normalized intensities for a single
microarray. After selecting this option, click the Next button. The wizard prompts input for the
project and the researcher’s name.
79
RGMA10011 rev B
In the next window, a prompt appears for the selection of a microarray for the project.
The Framework field at the top of the screen allows PathwaysTM Universal users to
select the appropriate framework from which to obtain the microarray data (refer to
Chapter 3 for more detail on frameworks).
80
RGMA10011 rev B
Click on a microarray, and then click Next. A prompt appears for a normalization technique
(use the default value, or refer to the Normalization Chapter for more details).
Click Next to generate a summary of the project setup.
If items require modification, click Back, and make necessary modifications. Clicking Finish
creates a single microarray project and opens a comparison analysis window.
7.6 Two Microarray Comparison Projects
A two microarray comparison project offers a mechanism for generating a project that compares two microarrays. The Project Wizard steps for the two microarray comparison project are
identical to those for the single microarray except for the microarray selection page.
81
RGMA10011 rev B
Each microarray for the comparison is selected by clicking on the desired microarray and then
clicking the Add button for the first array. A second array can be selected similarly. If two
arrays are added and the Clear button is clicked, the second array will automatically move to
the first slot.
Once the wizard setup is complete, a two microarray project is created and a comparison analysis window is displayed.
7.7 Empty Project
The empty project option in the new project wizard creates a project without any microarrays
or conditions. This option is used when setting up more complex projects that have multiple
conditions and / or multiple microarrays in each condition. A wizard prompts the user to enter
the researcher and project name and creates an empty project.
To add conditions to the project, select Add Condition from the Edit menu, or right click in the
project window outside any conditions or microarrays that have been added.
82
RGMA10011 rev B
To add a microarray to a condition, either select the condition, and select Add Microarray from
the Edit menu, or right click on a condition in the project tree.
Selecting the Add microarray option causes the Add/Remove Arrays window to appear. For
the PathwaysTM Framework, this window has two tabs (for a full description of Frameworks,
refer to Chapter 3). The first tabs allows adding at least one microarray to the current condition,
based on records in the library file. This file contains information on imported images and / or
information on files that have been used in a PathwaysTM project. The second panel allows
browsing the file system to locate additional PathwaysTM files.
Adding microarrays with the Library tab
83
RGMA10011 rev B
Adding microarrays with the Browse tab
Clicking on a microarray in either section of the dialog box activates the Add button in the dialog box. To add a microarray to the condition, click the Add button, or double click on the
microarray. To remove a microarray from the Condition, select the microarray in the condition
field, and click Remove.
Clicking the Refresh button in the library section of the dialog box verifies that each file in the
library still exists and that the library reflects each file’s correct microarray type.
In addition to the basic project creation options discussed above, the Edit menu allows the following modifications.
· Changing project properties (researcher name, project title)
· Editing normalization options (refer to the Normalization chapter)
· Renaming or removing conditions in the project
· Removing microarrays from the project. Removing conditions or microarrays from
the project may affect open analysis windows. In this case, PathwaysTM requires
closing the affected analysis windows before the PathwaysTM session proceeds.
84
RGMA10011 rev B
Chapter 8: Normalization
8.1 Basic Concepts in Intensity Normalization
Microarray experiments may yield sampled clone intensities that are brighter or darker than
similar intensities for a reference image(s) (due to experimental variations such as pipetting,
hybridization time, et cetera). To compare experiments, adjust for global shifts in intensity levels, so that, for example, high intensity ratios truly represent upregulated genes.
Normalization algorithms correct for global intensity shifts across multiple experimental
images. The normalization process creates a set of ‘normalized intensities,’ which vary from
the sampled intensities by a scaling factor. These normalized intensities are the basis for
PathwaysTM 4 data analysis.
8.2 PathwaysTM Normalization Algorithms
Four standard normalization plug-ins are included with the basic PathwaysTM 4 installation. In
addition, normalization is a pluggable component and therefore new normalization algorithms
can be added to PathwaysTM at any time.
Data point normalization is the default normalization technique for PathwaysTM 4
GeneFilters microarray analysis. This technique generates normalized intensities by dividing
sampled intensities by the mean sampled intensity of all clones, except the control points, total
genome spots identified by the key tgDNA.
PathwaysTM 2 users
PathwaysTM 2 normalized spots such that the average normalized
intensity for spots was 2,000 (based on empirical observations of
microarray intensities). PathwaysTM 4 normalization typically normalizes the intensity to an average of 1.0. This normalization allows
the PathwaysTM 4 user to immediately recognize normalized values
that are greater than the mean sample (> 1.0) or less than the mean
sample (< 1.0). To compare PathwaysTM 4 normalized intensity values directly with PathwaysTM 2 normalized values, divide PathwaysTM
2 normalized intensity values by 2,000.
Control point normalization normalizes sampled intensities by dividing each sampled intensity by the mean sampled intensity of the control points present on the current microarray.
Path normalization is a normalization technique that normalizes sampled intensities by dividing each sampled intensity by the mean sampled intensity of a defined criterion (path). With
GeneFilters, Control Point Normalization is an example of Path normalization (the path selects
“tgDNA” spots). When different types of microarrays are grouped together for normalization,
85
RGMA10011 rev B
only the elements of the path that are common to all microarrays in the group are used in the
normalization process.
Path normalization has a checkbox selection labeled Use anti-path. An anti-path represents all
spots except those contained in the path. Anti-path normalization therefore normalizes the data,
using points that are not contained in the path. With GeneFilters, Data Point Normalization is
an example of a Path normalization technique in which the ‘clones not in path’ option was
selected (normalize by points not in the “tgDNA” path).
Path normalization also has a checkbox selection labeled Subtract background. When this
box is checked, the input to the normalization algorithm will be the difference between the
intensity and the background intensity (intensity - background intensity) for each spot, rather
than intensity alone.
A Minimum intensity level for the normalization algorithm may also be specified. This value
will be applied either to the intensity alone or to the difference between the intensity and the
background intensity if background subtraction is enabled. The minimum intensity value is typically used to assure that all inputs to the normalization algorithm are greater than zero. If zero
or negative intensity values are present in the normalized data sets, then ratios will be disabled
for microarray pair and condition pair analysis. Pathways disables these ratios to prevent division by zero errors and ambiguous ratio values (e.g. a ratio of -1 could result from an intensity
of 1 in the first spot and -1 in the second spot).
Y. C. normalization is a normalization technique adapted from a manuscript by Yidong Chen et
al. (Chen Y, et al., J. Biomedical Optics 2(4): 364-374, October 1997, ISBN 1083-3668). This
manuscript covers several important topics in microarray analysis, including an iterative normalization technique that normalizes a pair of microarrays such that the mean ratio between the
microarrays is 1.0. A number of assumptions derive the normalization technique; review the
manuscript before using this technique.
86
RGMA10011 rev B
As the technique is iterative, it does require as input the maximum number of iterations (Max.
Iterations) and a Termination Criterion. Five iterations are sufficient to ensure that the mean
ratio between the arrays is 1.0, although it is possible to select a larger number of iterations.
The algorithm stops the iteration process if the difference between the calculated mean ratio and
1.0 is less than the termination criteria.
The normalization technique has been extended to normalize more than two microarrays by setting the first microarray in a multiple microarray set as the reference microarray and normalizing the ratios of the other microarrays to the first microarray. The user can select Normalize
using all spots to do this. The concept of paths has been added to this algorithm, so that the
mean ratio can be estimated using only the spots in a path (or outside of a path, depending on
the selected option). The user can select Normalize using only the path spots to do this.
This normalization technique does require that microarrays in a normalization group (see below)
are of the same microarray type.
8.3 Normalization Groups
Normalization techniques generally fall into two classes: auto normalization and dependent
normalization. An auto normalization technique normalizes intensities based on data that are
contained completely in the microarray data set. For example, the Data Point Normalization
technique is performed by dividing sampled intensities in a microarray by the mean sampled
intensity value in the same microarray.
Dependent normalization techniques exhibit a dependency on other microarrays to perform
the normalization algorithm. The Y. C. Normalization algorithm, for example, normalizes a pair
of microarrays to the mean ratio of intensities between the arrays. The Path Normalization
algorithm is structured so that only the elements of the path that are common to all microarrays
are used in the normalization algorithm.
87
RGMA10011 rev B
PathwaysTM’ normalization groups explicitly assign a normalization technique to a group or
groups of microarrays. These groups enable the following options.
· Assigning different normalization techniques to subgroups of microarrays in a project
· Applying the same normalization technique to different groupings of microarrays in a
project (used to selectively apply dependent normalization techniques)
By default, PathwaysTM 4 groups microarrays by their type (e. g., ‘GF200’, ‘GF211’), and it
applies the data point normalization technique (mean of all points, except controls). To
change normalization techniques and / or normalization groupings, select ‘normalization’ from
the project menu to generate the following dialog box.
The window shown above was created from a project that had only one microarray type,
GF200. As discussed above, initially all of the GF200s were grouped into a default group with
data point normalization. To change the normalization technique, select this group in the
Normalization Groups window, and edit the group properties. In addition to the group properties, each normalization plug-in may require additional data items (e. g., maximum iterations for
Y. C. Normalization), which appear in the plug-in properties window.
To add a new normalization group, click New Group, and edit the properties. Individual
microarrays can be moved between normalization groups by dragging them from their current
folder and dropping them into a new folder. Normalization groups can be removed by highlighting the group and clicking the Remove group button.
88
RGMA10011 rev B
Chapter 9: Data, Paths, and Filters
9.1 Analysis Data
PathwaysTM supports a set of analysis data that depend on the grouping method.
· Microarray(s): Clone Number, Intensity, Paths
· Microarray pair(s): Clone Number, Intensity I, Intensity II, Ratios, Differences, Paths
· Condition(s): Clone Number, Intensity, Paths
· Condition pair(s): Clone Number, Intensity I, Intensity II, Ratios, Differences, Paths
Microarray or Condition
Microarray Pairs or Condition Pairs
The clone number is the index of the clone in the microarray (the microarray address is the filter type plus the clone number, e. g., ‘GF200 100’). For GeneFilters microarrays, the clone
number is ordered by field, grid, row, and column.
Intensity is the normalized intensity for a clone. This value represents an average for conditions with repeats. The Intensity variable is labeled I or II for the first or second set in a paired
analysis. Paths are discussed in detail below.
The analysis data is pluggable. New data fields that derive from the base types (intensity,
ratios, et cetera) can be added to the basic set by adding a plug-in. The outlier plug-in, for
example, appears for each paired analysis. An outlier describes clones that yield consistently
high or low ratios across multiple pairs of microarrays / conditions. An outlier index near 1.0
indicates consistently high ratios and an outlier index near -1 indicates consistently low ratios.
The outlier is calculated by first sorting the ratios for each microarray / condition pair and then
scaling the sort index from -1 to 1, corresponding to the minimum-through-maximum ratio in
the current pair (the unscaled sort index would vary from 1 to the number of clones). The corresponding scaled sort indices for each clone are averaged across the pairs to yield the outlier
index.
89
RGMA10011 rev B
The Chen test is a statistical analysis plug-in that determines whether two sampled intensities
are different, based on a desired confidence level. When a clone is not filtered at a confidence
level, then the difference in intensity between two samples is statistically significant (at the
specified confidence level). Unlike the t-Test, this test is applied to paired data (microarray pair
or condition pair grouping, control and experimental data). The Chen test plug-in is extended
from a manuscript by Yidong Chen (Chen Y et al., J. Biomedical Optics 2(4), 364-374, October
1997, ISBN 1083-3668). This statistical test is based on an assumption that the coefficient of
variation is constant across microarray / condition data points. Before using the plug-in, carefully review this manuscript, including the assumptions involved in derivation of the test.
The manuscript limits the test to an assumed distribution of the data. The Chen test plug-in, as
an option, extends the test to a distribution free form.
The t-Test is a statistical analysis plug-in that determines whether two sampled intensities are
different, based on a desired confidence level. When a clone is not filtered at a confidence
level, then the difference in intensity between two samples is statistically significant (at the
specified confidence level). This test is applied to paired data with repeats and is limited to
condition pairs. The t-Test plug-in is an implementation of the commonly used Unrelated tTest (Student’s test). Unlike the Chen test, this test involves a single microarray sampled multiple times. It determines whether the difference between two condition-averaged clones is significant compared to the standard deviation of the sampled intensities for each of the conditionaveraged clones. This plug-in offers both a Gaussian distributed and a distribution free form.
Analysis of variance (ANOVA) is used to test if the differences in mean intensity values
obtained under different experimental conditions are statistically significant. ANOVA compares
the variance of the data calculated within conditions to that across conditions. If the variances
are not the same, then it is an indication that the means are different. The t-Test is a special case
of ANOVA for two conditions. The algorithm here is formulated in way that allows the experimenter to create and install a Java plug-in to exploit experimental design.
ANOVA in PathwaysTM has been designed to accommodate different experimental designs
through the use of plug-ins. A plug-in is provided for One-Way Analysis. If the data will support an analysis (three or more conditions and two or more samples for at least one clone in
each condition) then the ANOVA entry will appear in the data filter window. The filter control
sets confidence levels of 99.9%, 99%, 95%, 90%, 75%, and 50%, and "any" which shows all
points. At a given confidence level, the filter will remove from the display those spots whose
value of the test statistic is less than the critical value for the selected confidence.
9.2 Data Filtering
Microarray experiments generate massive data sets. A single microarray can hold 5,000 or more
clones and even the simplest experiments uses two or more microarrays. In general, these large
data sets must be reduced before the underlying significant data sets become apparent.
90
RGMA10011 rev B
Data filtering reduces the data set based on a specified set of criteria to generate a more manageable set of data. Data filtering can take various forms.
· Simple data filters establish a threshold for the data. An example of a simple data filter
is a requirement that the ratio of normalized intensity be greater than 2.0 or less
than 0.5 (‘thresholding’ a level of up and down regulation).
· Statistical data filters reduce the data set by eliminating clones that lie outside a
specified significance level.
· Path data filters reduce the data set by requiring that clones be either members or nonmembers of a specified list of clones (a path). Each filter type is described in
detail in this chapter.
· Invalid clone filters reduce the data set by allowing the researcher to show all clones,
only valid clones, or only invalid clones.
The data displayed in the analysis window are those that have not
been filtered out; they are data that meet the criteria. The default
behavior for all filters is to not filter any data until the user interacts with the filter (by, for example, adjusting a histogram). A
check is next to each active filter in the current analysis window.
When the cursor is inside the filter selection window, the current
status of the filtered data is displayed as a status message.
9.3 Strict Setting
Two data filtering options are available for the case when multiple data sets (multiple microarrays, microarray pairs, conditions or condition pairs) are selected for an analysis window. Strict
data filtering eliminates a clone from the analysis if the corresponding clone in any of the multiple data sets falls outside of the range of the filter. Non-strict data filtering eliminates a
clone from the analysis only if the corresponding clone in all of the multiple data sets falls outside the range of the filter. As an example, consider an analysis window where two microarrays
are displayed. If a clone has a normalized intensity of 1 in the first microarray and 2 in the second microarray, a data filter specifying a minimum intensity of 1.5 with the strict setting on filters the clone, while a non-strict setting does not filter the clone.
91
RGMA10011 rev B
Strict data filtering is the default. To change the data filtering type, right click on the filter list
and select (deselect) the strict option.
9.4 Simple Data Filters
Simple data filters use histograms and min / max value key-ins to limit a variable to a specified
range of values. With variables like normalized intensity and intensity ratios, simple data filters
reduce the data sets by eliminating data that the user regards as uninteresting.
The window above shows a simple data filter applied to the Ratio of normalized intensity. The
histogram is being used to filter data from the current analysis window. To use the histogram to
filter data, drag the edges of the histogram until the hashed data regions encompass only the
desired range of data. To key in limits, check the Key-in box and type the min / max limits in
the text fields.
The standard mode for the histogram is to include only data between the min / max values specified (Min less than or equal to Data less than or equal to Max). The Invert check box selects
only data that are outside the min / max bounds (Data less than or equal to Min or Data less
than or equal to Max). This option affects both the visual histogram filter and the Key-in of
min or max values.
92
RGMA10011 rev B
To generate a menu with options for enhanced viewing, right click on the histogram. The + / Ratio menu item appears for only the Ratio filter. This option reformats the histogram by the
upregulation or downregulation format for ratios (if intensity B > intensity A, ratio = B / A; otherwise ratio = -A / B).
The Log option creates bins based on a logarithmic, rather than a linear scheme. This option
works well with leveling data in a histogram that has a few large bins and multiple small or
empty bins due to one or two data points at the extreme end of the data scale. Another fix for a
skewed histogram is to lump a certain amount of the data into the first or last bin, and use a linear scale for the rest of the histogram.
Linear Bins
Logarithmic Bins
10 % of Data in Last Bin
93
RGMA10011 rev B
9.5 Statistical Data Filters
Statistical data filters reduce the data set by eliminating data falling outside a specified statistical confidence level. The unrelated (Student’s) t-test analyzes each clone in a condition pair to
determine whether the difference in intensities is statistically significant (this test requires at
least two measurements per clone). Likewise, the Chen test determines whether the difference
in intensity of each clone in a pair is statistically significant, but it does not require repeated
measurements. Finally, the analysis of variance (ANOVA) test determines whether the means
of three samples differ significantly from one another.
Each statistical test may have more than one distribution type, as shown below.
9.6 Paths
The three Path types offer the ability to include or exclude clones from an analysis window.
Microarray address paths identify a clone number on a microarray type. For example, a
Microarray address path might specify clones 30, 45, 1000, and 2010 on GF200. This path type
is specific; no members of this path are on a GF211 filter, for example. Create microarray
address paths manually, through the path editor, or automatically, based on analysis window
clones.
Microarray address paths routinely exclude certain clones from analysis. For example, if the
thumbnail image of a clone shows an experimental or sampling error, a microarray address path
could be created with the address of this clone, and then the clone could be filtered using a path
filter.
Clone key paths are similar to microarray address paths, except the clones in this path are listed by the Clone Key (the accession number, when it is available) or by a unique identifier (such
as ‘tgDNA’). Clone key paths are not microarray specific, and they are therefore a preferred
means of identifying clones. Create clone key paths manually through the path editor or automatically based on the clones in an analysis window.
Clone key paths identify a set of clones for further research. For example, if an experiment
shows that a set of clones is consistently upregulated, then these clones could be isolated into a
clone key path for investigation on further experiments. Likewise, if a researcher has a set of
clones on which their efforts are focused, then a clone key path would be created with keys for
this set of clones.
94
RGMA10011 rev B
Automated search paths create a dynamic path based on keyword searches. Specify the following information.
· a rule
· a field to search
· the keyword for which to search
· location in the field (start, beginning, in the text)
· whether to match or mismatch the keyword
Multiple rules can be added to a path, and it is possible to select whether to match clones that
satisfy the rules or to match clones that satisfy one or more rules.
Automated search paths isolate a research concept. For example, create an automated search
path by requesting clones that have the keyword ‘cancer’ in the clone’s description field.
Search paths are dynamic. Whenever a GeneFilters microarray description is updated
(through the PathwaysTM update service), automated search paths may change. For example, if
PathwaysTM data files are updated and new clones have the keyword ‘cancer’ in their description, they are added to the path automatically.
Paths are matched without regard for the case of the
input string (paths are case insensitive).
9.7 Creating a New Path
The Path editor can be accessed from the Quick Start palette, from the Path creation button in
an analysis window, or from the Path filter view. When creating a path in the Path editor or in
the Path filter window, the New Path dialog box appears.
This dialog box allows creation of an empty path, copy an existing path, or import a path from a
text file (key and address paths only). Start the new path creation by typing the new path name
in the Name text field. To create an empty, editable path, select the appropriate type in the New
95
RGMA10011 rev B
tab of the import dialog box, and click Ok. To copy an existing path and then edit that path,
select a path from the Copy tab, and click Ok. To import a path (key or address), select the
Import tab, select a file and path type, and click Ok. To import a key path, create a text file
with a single column of data representing a list of clone keys. To import an address path, create
a three column text file representing a list of microarray brand, type, and clone numbers (e. g.,
“GF Description”, “GF200”, “2” for the second clone in a GF200 microarray). Separate the
columns in the file by commas.
To create a new path from any analysis window, click the New Path button on the analysis toolbar. The new path contains the clones that are not filtered in the current analysis window. A
window appears and prompts the user to enter the name for the new path and whether the path
is stored by clone key or by microarray address.
9.8 Editing Paths
Once a new path has been added or an existing path has been selected for edit, the Path Editor
dialog box appears automatically.
The left portion of the Path editor shows the available paths and includes options for adding
new paths, removing paths, and exporting paths to a comma separated text file for use in
spreadsheets.
For the Path icons, an envelope is used to depict clone address paths, a key is used to depict
clone key paths, and a magnifying glass is used to show automated search paths.
The right portion of the Path Editor is specific to the type of path being edited. Clone key and
microarray address paths display a list of keys or a list of entries consisting of (Microarray
Brand, Microarray Type, Clone Number), respectively. Entries can be added and removed using
the Add or Remove buttons, respectively.
96
RGMA10011 rev B
The Automated Search editor displays a list of rules for the current path along with a radio button to select how these rules are applied.
When the path is set to satisfy any rule, a clone is included in this path when any of the rules
are satisfied. When the path is set to satisfy all rules, a clone is included in this path only when
all the rules are satisfied. Each rule requires four inputs.
· Field - the meta data field to use for this rule.
· Match - field that specifies whether or not clones must follow this rule
· Method - conditions for the text
·
·
·
·
as a substring in the field (contain),
at the beginning of the field (start with),
as the end of the field (end with), or
for an exact match (equal)
· Text - the text for which to search in the clone data field.
After editing a Path, click Ok to accept any changes and close the dialog box, Cancel to revert
any changes, or Apply to apply any changes to the current analysis, but leave the dialog box
open.
9.9 Path Filtering
Path filtering allows including or excluding members from paths. The Path filter window offers
a list of paths and check boxes for showing members or non-members of the Path.
97
RGMA10011 rev B
The default behavior is to show both members and non-members for all Paths. To include only
members of a path, uncheck the Show non-members check box. To include only non-members
of a path, uncheck the Show members check box. Unchecking both boxes for a path excludes
all data points, because all points can be categorized as being either members or non-members
of a path.
When path filtering is applied to more than one path, the results set includes the intersection of
the modified filters. For example, showing only members of the path “Breast” and non-members of the path “Cancer” yields clones that are in the Breast path but not the Cancer path.
Showing only members of the Breast and Cancer paths would yield clones that are in both the
Breast and Cancer paths.
9.10 Invalid Clone Filtering
During microarray analysis, some clones do not provide valid sampled data. Multiple factors,
including less than optimal experimental parameters, a damaged microarray, or the subjective
opinion of the researcher, may render some clones unusable for the analysis process.
PathwaysTM provides several tools to flag and keep track of such invalid clones. An individual
clone marked as invalid will not be automatically excluded from the analysis process but can be
excluded using the invalid clone filter. If an invalid clone is used for the calculation of an average intensity during condition analysis, the resulting combined spot will also be marked as
invalid.
Invalid Clone filtering allows including or excluding specific clones from the data set. The
Invalid Clone filter window offers three options for showing all clones, showing invalid clones
only, or showing valid clones only.
Clones marked as invalid from in a project are seen as such in the current project only.
Invalid clones are marked as such with crosses if the Mark invalid clones button in the upper
right corner of the workspace is selected.
There are two places where the user can mark clones as invalid. If the user marks a clone as
invalid during the data analysis process, the clone will be treated as invalid only within the current project. The user may also mark a clone as invalid during the image import process (using
the PathwaysTM Framework importer). If the user marks a clone as invalid during the image
import process, any project using the microarray will display this clone as invalid (refer to
Chapter 6 for more information about marking invalid clones during the image import process).
98
RGMA10011 rev B
Chapter 10: Reports and Exporting Data
10.1 PathwaysTM Reporting
PathwaysTM supports reporting / exporting data from all analysis windows. Reports include
clones that are not filtered in the current analysis window. The report can contain any combination of data sources (such as intensity, ratios, et cetera) and meta data (accession, title, et
cetera).
There are four options for output.
· Printer - send report to printer
· PDF file - save report in Adobe Portable Document Format (PDF)
· HTML file - save report in html format for web viewing
· CSV file - save the report as a comma separated value (CSV) for export to spread
sheets like Microsoft Excel.
10.2 Report Wizard
PathwaysTM analysis windows support reporting in the toolbar by clicking the Report button,
, which generates the Report Wizard dialog box. For comparison analysis, the Report
Wizard dialog box appears.
The output format (printer, PDF file, HTML file, CSV file) can be changed through the Output
to selection. For the printer output format, a Preview option is available. The Researcher,
99
RGMA10011 rev B
Project, and Description fields are editable. The Series section contains options for printing
the Selected experiment or All experiments. Selecting All shows data for all experiments in a
single table and should only be done when outputting to a CSV file. The check boxes on the
right of the dialog box allow customization of the report to include the data source (intensity,
ratios, et cetera) and meta data (accession, title, et cetera).
The Show error option on the Report Wizard adds a report column for the standard deviation of
a condition’s intensity. The Show point validity option adds a report column for whether or not
points are flagged as invalid. If the user wishes to exclude invalid points from the report, apply
the invalid clone filter before generating the report.
When the report is configured, click the Print button. When the output is being sent to the
printer, a Print Preview window appears; from this window, the document can be sent to the
printer. When the output is being sent to a file, a file chooser dialog box appears.
The report formatting that generates the printer, PDF, and
HTML output is time consuming with large data sets. ResGenTM
recommends including no more than 250 clones in the formatted
reports. The CSV file does not require any special formatting,
and it can be used with an arbitrary number of clones.
The profiling and clustering versions of the Report Wizard dialog box are slightly different from
the Comparison Wizard dialog box.
For profiling and clustering, a single ‘index’ column is selected followed by a data source selection. The index column can be the clone key, microarray address, or any meta data field. A single data column value can be selected for the report. This data column is displayed for each
item (microarray, microarray pair, condition, or condition pair) that is included in the analysis.
Other functionality is as described for the comparison report dialog box.
100
RGMA10011 rev B
Book V: Pathways Analysis
TM
101
RGMA10011 rev B
Chapter 11: Comparison
11.1 Introduction to Comparison Analysis
Comparison analysis reviews the data in a single condition (or microarray) or compares data
between two conditions (or microarrays). A simple comparison analysis would be to display a
synthetic image of a single microarray; such an analysis would allow a determination of the
peak expression levels in the microarray. A more complex comparison analysis might involve a
comparison of one or more pairs of conditions to determine peak upregulation or downregulation between the conditions.
A comparison analysis displays microarray data as synthetic microarrays, scatter plots, or tables.
The microarray(s) and condition(s) groupings allow determination of minimum and maximum
expression levels or analysis of expression levels of a set of clones (using Paths and other data
filters). The microarray pair(s) and condition pair(s) allow determination of the following characteristics.
· Highly upregulated or downregulated clones
· Analysis of ratios
· Differences between a set of clones
11.2 Comparison Toolbar
The comparison toolbar offers functions for comparison windows.
The first three icons in the toolbar enable the synthetic microarray, scatter plot, and table
views, respectively (more about these below).
The path icon creates a path based on the data remaining after the active filters are applied. A
dialog box appears and requests the name for the path and whether the path is stored by
microarray address (location in the current microarray type) or clone key (accession or other
unique identifier). The path icon is the fourth icon on the toolbar.
The save image icon (camera) saves an image of the current data view. Images can be saved in
either JPEG or PNG formats. This icon is disabled for the table view. The save image icon is
the fifth icon on the toolbar.
The report icon creates reports or export data based on the remaining data after the active filters are applied. The report icon is the sixth icon on the toolbar.
102
RGMA10011 rev B
The find icon (binoculars) locates clones in the current data view. The find dialog box appears
and allows searching for clones by entering a clone key, microarray address, or path. The find
icon is the last icon on the toolbar.
Detail views are available in data views by clicking on a data point. In addition, the clone
selection can be moved around in the synthetic microarray view using the arrow keys.
11.3 Synthetic Microarray
The first data view for comparison analysis is the synthetic microarray view.
A synthetic microarray shows analysis data as colored spots that are arranged in the same pattern as that of the microarray. When multiple microarrays or multiple conditions are presented,
the different microarrays appear in tabbed panels as shown in the Comparison: Condition pair
window.
103
RGMA10011 rev B
The synthetic microarray view is not available if the framework being used does not
supply geometry (X and Y coordinates).
The coloring on synthetic views depends on painters selected from the toolbar.
For microarray(s) or condition(s), the synthetic array shows expression levels. Three
painters are available.
1 Color: highest normalized intensity is bright red, lowest is dim blue
2 White on black: highest normalized intensity is white, lowest is black
3 Black on white: highest normalized intensity is black, lowest is white.
For microarray pair(s) or condition pair(s), the synthetic array shows upregulation or
downregulation. Two painters are available.
1 Ratio: upregulation (high ratio) is green, downregulation (low ratio) is red,
brightness is relative to the normalized intensity of contributing spots
2 Difference: upregulation (high difference) is red, downregulation (low difference)
is blue, brightness is relative to the normalized intensity of contributing spots
A Brightness slider increases spot brightness. Moving the slider to the right allows viewing
low intensity spots.
The synthetic microarray may also display invalid clones. Once a microarray is added to a project, individual spots can be marked as invalid by right-clicking on the detailed view of a selected clone and selecting the Invalid clone option.
104
RGMA10011 rev B
If an opened analysis window is affected by such a change, a dialog box appears, and it lists relevant analysis windows and prompts for an action.
Select Yes to automatically close relevant windows. To mark several other spots as invalid,
select No. Those windows must be closed and recreated later to take effect.
Spots marked as invalid from in a project are seen as such in the current project only.
Invalid clones are marked as such with crosses if the Mark invalid clones button in the upper
right corner of the view is selected.
105
RGMA10011 rev B
11.4 Scatter Plot
The plot view enables viewing the data set as a scatter plot with defined axes.
The variable for each axis is selected in the X and Y pulldown menus in the comparison toolbar.
If the current axis variable contains no negative data, then click the log button to change the
axis to a log scale. When a condition is viewed and the data points have repeats, click the error
bar button to superimpose error bars on each data point.
11.5 Chart Properties
Right clicking on the plot area generates a menu that allows the user to zoom in / out on the
chart view, to Reset the axis limits, and to display the Chart Properties dialog box. The Chart
Properties dialog box allows customization of the current graph.
106
RGMA10011 rev B
The Global tab has options for the chart title and background and foreground colors.
The Series tab allows the symbol color, size, and shape to be specified for each series.
The Axes tab allows the limits for each axis to be specified explicitly; the default option automatically scales the axes.
To apply the modifications, click Apply. To exit the dialog box without applying changes, click
Cancel. To exit the dialog box and apply changes, click Ok.
Control + drag pans the chart on the screen. Shift + drag creates a region for zooming.
107
RGMA10011 rev B
11.6 Table
The table view for comparison analysis presents the microarray data in spreadsheet-like format.
When multiple microarrays or multiple conditions are presented, microarrays appear in tabbed
panels as shown above. Each column can be sorted by clicking the label at the top of the column. Clicking the label again toggles between descending and ascending ordering.
The index column (labels on left side of the table) can be modified using the buttons at the top
of the table. Options for indexing include the clone key, microarray address, or a meta data
item.
108
RGMA10011 rev B
Chapter 12: Profiling
12.1 Introduction to Profiling Analysis
Profiling analysis determines the data trends from one experiment to the next. One example of
profiling analysis is plotting the intensity of genes associated with cancer at multiple times in a
study.
The “microarray(s)” or “condition(s)” groupings allow determination of trends in the expression
levels of the clones from one experiment to the next. The “microarray pair(s)” or “condition
pair(s)” groupings allow determination of trends in the upregulation or downregulation of the
clones between pairs of experiments.
12.2 Profiling Toolbar
The profiling toolbar is present for profiling views.
The first three buttons represent the plot, bar chart, and table views for profiling analysis
(these buttons are discussed in more detail below).
The remaining four toolbar buttons are the path, save image, report, and the find buttons.
Refer to Chapter 11 for details.
109
RGMA10011 rev B
12.3 Plot
The plot window displays a variable (intensity, ratio, difference, et cetera) on the Y axis, while
the X axis displays labels for the microarray, microarray pair, condition, or condition pair,
depending on the data grouping type.
The foregoing plot used a path filter to isolate only certain clones. Path filtration is advisable
when using the plot view, because the plot becomes overcrowded with large data sets.
Clicking the left and right arrow keys moves a selected clone to the left or right data point for
the current clone. For example, if the selected clone is in the ‘1 Month’ condition above, then
the left arrow moves the selection to the same clone in the ‘Control’ condition, and the right
arrow moves the selection to the same clone in the ‘3 Months’ condition.
The y axis variable is selected in the Data menu in the profiling toolbar.
Path data is unavailable for plotting in profile analysis, because there is little meaning in plotting two values on the y axes (Member / Non-Member) versus a handful of profile state points.
110
RGMA10011 rev B
If the current axis variable does not contain negative data, then the axis can be changed to a log
scale using the log button. When a condition is being viewed and the data points have repeats,
then error bars can be superimposed on each data point using the error bar button. Clicking
the connect lines button toggles between symbols with lines connecting the data points and
symbols alone.
Right click on the plot to display the chart menu: Chart Properties, Zoom In, Zoom Out,
Reset (see Chapter 11 for a detailed explanation of the Chart Properties dialog). Control +
drag pans the chart on the screen. Shift + drag creates a region for zooming.
12.4 Bar Charts
Bar charts provide the summary of a variable at each state in the profile analysis.
The height of each bar represents the average value of a variable for clones that have not been
removed by data filters.
The y axis variable is selected in the Data pulldown menus in the profiling toolbar.
If the current axis variable contains no negative data, then the axis can be changed to a log scale
using the log button. The error bar button displays the error bars representing the standard
111
RGMA10011 rev B
deviation of the data points. These deviations represent each state’s average value. This result
is not the same as error bars for repeated clones that are displayed in other analysis windows.
Right clicking on the bar chart displays the standard chart controls, including the Chart
Properties dialog box. This version of the Chart Properties dialog box is slightly different from
the version for condition comparison. The bar color has been added to the Global tab in the
Chart Properties dialog box, and the Series tab is not present, because no additional specifications are necessary for each series.
12.5 Table
The table view presents the profiled data in a spreadsheet format.
Items of analysis data (e.g. intensity) are displayed in a tab panel as shown above. Each column
can be sorted by clicking the label at the top of the column. Clicking the label again toggles
between descending and ascending sort ordering.
The index column (labels on left side of the table) can be modified using the radio buttons at
the top of the table. Options for indexing include the clone key, microarray address, or any
meta data item.
112
RGMA10011 rev B
Chapter 13: Clustering
13.1 Introduction to Clustering
Clustering analysis automatically generates associations between clones in an analysis set. For
example, clustering could find clones that respond similarly (upregulation or downregulation)
over the course of a study. Mathematically, clustering algorithms locate points that are close
together in a multi-dimensional clustering data space.
Clustering is complex, and a complete explanation of the clustering process is beyond the scope
of this guide. The following sections are an introduction and overview of clustering analysis.
Clustering data space is based on the analysis grouping and a variable. For example, a cluster
analysis of normalized intensity of three microarrays might group clones that are close together
in a three dimensional space defined for each clone as: {intensity in first microarray, intensity
in second microarray, intensity in third microarray}. An effective clustering algorithm groups
clones that are {bright, bright, bright} across the three microarrays. Likewise, clones appearing
as {dark, bright, dark}, {dark, dark, dark}, {bright, bright, dark}, et cetera over the three
microarrays are grouped together. Therefore, this analysis seeks clones that have similar
expression profiles across the three microarrays.
As another example, a time study could be clustered based on ratios between each time point
and the control, which is at time zero. Assuming four time points plus the control, the cluster
space would be four dimensional: {time 1 / control, time 2 / control, time 3 / control, time 4 /
control}. Therefore, the clustering algorithms would group together clones that have a similar
upregulation and / or downregulation pattern over the course of the study.
13.2 Clustering Algorithms
Clustering algorithms differ in how they group points together in data space. For example, the
KMeans algorithm groups data into a specified number of clusters by finding the center of the
cluster and assigning data to the nearest cluster center in an iterative fashion. KMeans is a partitional clustering algorithm, because the clustering process consists of finding the best cluster
(partition) for each clone.
Hierarchical clustering algorithms work by finding the two closest clones and calling this a
cluster. The cluster is assigned a position in the data space that is based on the linkage method.
Next, the closest two entities (clone or cluster) are found and grouped into the second cluster.
This process repeats until all clones are grouped into clusters.
The self-organizing map (SOM) clustering algorithm finds clusters in an input data set by mapping the data onto a two-dimensional array of nodes. Each node contains a reference vector that
records the value associated with that node. The data points represent successive expression
levels of a clone. The map is constructed by comparing each point in succession with the refer113
RGMA10011 rev B
ence vector of each node. The node with the reference vector that is nearest an input vector is
updated with a weighted combination of the reference and input vectors. This process is repeated over many iterations. The number of iterations in each stage and the initial values are userdefined.
There are many ways to describe the Distance between points in data space. The traditional
distance calculation is a Euclidian calculation. The squared Euclidian distance places a heavier
weighting on distances than the standard Euclidian calculation. The correlation metric is
Pearson's correlation coefficient proposed by Eisen et al. (1998), and it is analogous to the vector inner product.
13.3 Cluster Visualization
Visualization of clustering is a challenging task. Clusters can be viewed in one of two
‘spaces’: data space or cluster space. Data space, as described above, is defined by the variable
and the grouping (e. g., five conditions = five dimensional space). Cluster space is the distance
from each clone to a cluster. This representation of the data helps to display how close each
clone is to an arbitrary cluster. The number of dimensions is equal to the number of clusters.
Both data and cluster space tend to be greater than three-dimensional space, and they are impossible to view in a traditional sense. Therefore, visualization techniques focus on displaying as
much information as possible within the constraints of the two-dimensional computer screen.
13.4 Clustering in PathwaysTM
In recognition of the complexity of the entire clustering process, PathwaysTM clustering analysis
has been designed to be highly modular through the use of plug-ins. Plug-ins are available for
the following major components.
· Cluster plug-in: core clustering algorithms, such as KMeans and Hierarchical.
· Cluster Distance plug-in: calculates the distance between two clones or between a
cluster and a clone, based on the locations in data space (used in tandem with
Cluster plug-in).
· Cluster Visualization plug-in: takes a cluster calculated by any method and displays
the cluster. The plug-in establishes the format of the display (graph or table).
Therefore, the process of clustering consists of the following components.
1 Selecting the desired clustering plug-in and specifying any auxiliary information
needed
2 Selecting the desired visualization technique
Implemented plug-ins are described in more detail below.
114
RGMA10011 rev B
A cluster filter is added to the filter view after performing a clustering operation.
The cluster filter has the following four settings.
· Show all clusters: no filtering
· Show clusters in specified range: isolates one or more clusters with a series of
specified cluster numbers, e. g., 1 to 5, 10, 25.
· Sweep through clusters: a slider bar reviews multiple clusters. As the slider is moved
from the left to the right, the first through the last cluster is shown in the cluster
visualization window. If the number of visible clusters is set to greater than one, the
slider shows multiple clusters around the currently visible cluster.
· Isolate cluster for selected clone: shows only that cluster associated with the
selected clone. This feature is powerful when it is combined with the Find
Clones dialog box. For example, turn on the isolate cluster feature, and use Find
Clones to find each clone in a cancer path; the result identifies the clones
clustering with each cancer clone.
13.5 KMeans Clustering
Selecting an analysis grouping from the Cluster menu generates a dialog box. The dialog box
includes the current clustering algorithms in a pulldown menu.
115
RGMA10011 rev B
The Clustering Algorithm is the first option in the Clustering dialog box. Available selections
are KMeans, Hierarchical, and SOM. The next selection is the Cluster Variable. Variables like
intensity, ratio, and differences are available, depending on the selected analysis grouping.
The Properties section of the dialog box allows entry of information that is specific for the
selected clustering algorithm. For KMeans, specify the following options.
· Distance: plug-in calculates the cluster distance
· Number of means: the number of means (clusters) that the KMeans algorithm
generates
· Maximum iterations: the KMeans algorithm groups and regroups clones into clusters
according to the distance from the clone to the cluster center. The maximum
iterations field sets a limit as to the number of iterations on the grouping process.
· Tolerance: the iteration process stops if the difference between the ‘cost’ (average
clone to cluster distance) at the current iteration and the cost at the previous
iteration is less than this number.
When the properties are set, click Ok to proceed with the cluster analysis.
13.6 Hierarchical Clustering
Hierarchical clustering is a second option for clustering analysis.
As with all clustering algorithms, the cluster variable must be chosen before proceeding with
cluster analysis.
116
RGMA10011 rev B
In addition to a cluster variable, hierarchical clustering requires the following information.
· Distance: plug-in calculates the cluster distance
· Merge Option: linkage method (see below)
The merge option (linkage) dictates where a new cluster (created when two clones and / or clusters are combined) is located relative to existing clones / clusters. Single linkage dictates that
the distance between a new cluster and an existing entity is the minimum of the distances
between the new cluster’s components and the entity in question. Complete linkage dictates
that the distance between a new cluster and an existing entity is the maximum of the distances
between the new cluster’s components and the entity in question. Unweighted and weighted
averages calculate the new distance as the average of the previous distances (“weighted averages” weights this average by the number of subentities in a cluster). Unweighted and weighted centroids use the average of the cluster location in data space to calculate the new distance
(“weighted centroids” weights the average by the number of subentities in a cluster).
When the properties are set, click Ok to proceed with the cluster analysis.
13.7 SOM Clustering
SOM Clustering is a third option for clustering analysis.
117
RGMA10011 rev B
After the cluster variable has been selected, SOM clustering requires the following information.
· Distance: plug-in calculates the cluster distance
· Output Layer X Dimension: number of dimensions for nodes on the X-axis
· Output Layer Y Dimension: number of dimensions for nodes on the Y-axis
· Ordering Iterations: number of iterations during the ordering phase
· Initial Rate: Ordering: initial rate of calculation during the ordering phase. The initial
rate decreases monotonically over the duration of the phase to small values near
zero.
· Initial Radius: Ordering: initial radius of calculation during the ordering phase. The
initial radius decreases monotonically over the duration of the phase to small values near
zero.
· Convergence Iterations: number of iterations during the convergence phase
· Initial Rate: Convergence: initial rate of calculation during the convergence phase.
The initial rate decreases monotonically over the duration of the phase to small values
near zero.
· Initial Radius: Convergence: initial radius of calculation during the convergence
phase. The initial radius decreases monotonically over the duration of the phase
to small values near zero.
· Kernel Selection: type of kernel used for calculation. The Cylindrical option weights all
nodes equally, while the Gaussian option decreases the weight with increased distance
from the updated node.
When the properties are set, click Ok to proceed with the cluster analysis.
118
RGMA10011 rev B
13.8 Profile
The profile plug-in displays the cluster data as a connected series of lines, similar to the profile
analysis technique.
The profile view shown above has isolated a cluster using a cluster number filter set to show the
cluster of a clone associated with cancer.
The Cluster Information button generates a dialog box with the details of the clustering algorithm that generated the current results. The Cluster Information button is available for all
cluster visualization techniques.
The left and right arrow keys moves a selected clone to the left or right data point for the current clone. For example, if the currently selected clone is in the ‘1 Month’ condition above,
then the left arrow moves the selection to the same clone in the ‘Control’ condition, and the
right arrow moves the selection to the same clone in the ‘3 Months’ condition.
Right clicking on the plot generates the chart menu: Chart Properties, Zoom In, Zoom Out,
Reset (see Comparison Analysis for a detailed explanation of the Chart Properties dialog box).
Control + drag pans the chart. Shift + drag creates a region for zooming.
119
RGMA10011 rev B
13.9 Tabular
The tabular plug-in displays cluster data in a spreadsheet-like format.
The rows of the table include the cluster number and data values for contributing microarrays
or conditions. Each column can be sorted by clicking the label at the top of the column.
Clicking the label again toggles between descending and ascending sort ordering.
The index column (labels on left side of the table) can be modified using the buttons at the top
of the table. Options include the clone key, microarray address, or a meta data item.
120
RGMA10011 rev B
13.10 Clustergram
The clustergram plug-in generates the same information as the cluster table above, but colors
are used, instead of numbers. The vertical axis of the clustergram represents a clone number
and the colors across the clustergram represent a variable for each contributing microarray /
condition or microarray / condition pair.
13.11 Hyperbolic tree
The hyperbolic tree plug-in displays the cluster as a tree of interconnected clones and subclusters.
121
RGMA10011 rev B
This tree is mapped onto a hyperbolic surface that displays the tree spiral starting from the root
of the cluster tree out to clone nodes. The tightness of the spiral is controlled by a slider on the
top bar. Clones can be selected by clicking on the clone or through the find clones dialog box.
Clicking the center clone button centers the current clone in the viewing window. Clones are
labeled using the Clone Key, Microarray Address, or available Meta data.
The tree can be magnified by creating a zoom rectangle (shift + left drag) or using the up or
down arrow keys (zoom in or out). The image can be panned using control + left drag.
Right clicking generates an options menu for the cluster tree.
This menu allows for High quality drawing (slows the drawing process down, but produces
higher quality images), Label size selection, Zoom In / Out, and Reset (resets the cluster tree
to the original zoom and spiral).
122
RGMA10011 rev B
Chapter 14: PathwaysTM Data Updates
The information on clones in a microarray may change daily as discovery in genetics progresses. Likewise, analysis techniques improve as the field matures. PathwaysTM ensures that clone
data and analysis techniques are current with the following features.
· An integrated web browser with links from each clone to critical sites such as
Unigene and GenBank.
· Regular updates of GeneFilters data and Plug-in features through the ResGenTM
PathwaysTM data server.
Each of these methods are discussed in detail below.
14.1 Web Links and the Integrated Web Browser
PathwaysTM 4 has an integrated web browser that can connect a clone and related web sites.
In addition, a browser window can be accessed through the ToolsBrowser menu.
The web links that are shown for each clone are implemented through web plug-ins. These
plug-ins search meta data for each clone to determine whether key fields like the clone accession are present and then dynamically generate web links based on the availability of this data.
123
RGMA10011 rev B
14.2 Adding and Editing Web Links
Simple web links are managed using the Edit Web Links dialog box (ToolsEdit Web Links).
This dialog box allows web links to be added or modified based on a link name and certain key
fields. For example, access to Unigene for an accession requires a format like
“http://www.ncbi.nlm.nih.gov/Unigene/query.cgi?TEXT=[acc]”,
where ‘[acc]’ corresponds to the acc (accession) field in the meta data for each clone. An item
from this table can generate web links. For example, if a fictional link required unigene build
information and cluster ID, it would be entered as
“http://someplace.com/mylink?UG=[build_version]&CLUSTER=[cluster_id]”.
Determine the appropriate pattern for a web site by visiting the link directly in the PathwaysTM
browser (or any other web browser) and observing how the URL changes when, for example,
different clones are examined online.
To edit an existing link, highlight the link, and click Edit. The Link Name and Link URL
fields are activated for editing until Abort or Apply is clicked (the Abort and Apply buttons are
present during the editing process). To add a new link, click New, and enter a link name and
URL. When finished, click Add or Abort to add the new link or abort the edit (the Add and
Abort buttons are present during the editing process).
Certain web links require a specialized plug-in. For example, a Unigene cluster search requires
the organism and cluster ID to be separated (the link looks like
“http://....&ORG=organism&CID=clusterid”).
The Unigene cluster plug-in splits up the cluster ID (e. g., “Hs.2”) to yield the desired web link
(e. g., “http://...&ORG=Hs&CID=2”).
124
RGMA10011 rev B
14.3 Introduction to PathwaysTM Updates
PathwaysTM data and plug-ins can be updated on a regular basis from the ResGenTM data server.
These regular updates offer the following enhancements.
· Data updates: description files for each GeneFilters microarray updated to
reflect, for example, a new Unigene build.
· New microarrays: description files for new GeneFilters microarray products
will be added as they become available.
· Plug-In enhancements: enhancements to existing plug-ins are supplied as they
become available.
· New plug-Ins: as they become available, new plug-ins are added to PathwaysTM
automatically.
Data updates are performed by establishing an internet connection between PathwaysTM and the
ResGenTM data server. PathwaysTM sends a message to the data server asking if any updates are
available. The data server replies with a list of available updates. PathwaysTM retrieves each
selected update from the data server. The updated data become available the next time
PathwaysTM is launched (PathwaysTM must be shut down and restarted after the update is complete).
Additional data can be added to the microarray description files; therefore, these files must be
treated specially during a PathwaysTM update. The description file updates are performed as a
merge between the old and new files, so that auxiliary data added to the description files are not
lost.
125
RGMA10011 rev B
14.4 Launching the Updater
To launch the updater, select ToolsUpdate Pathways. A dialog box appears and indicates that
PathwaysTM is contacting the ResGenTM data server. Once a successful connection has occurred,
PathwaysTM displays a list of available updates (PathwaysTM data and / or plug-ins).
Select items to update, and click Update, or click Update All. When a large number of updates
are available, download times are reduced by selecting a single update, rather than all of the
updates.
When the updates are complete, a dialog box appears, and it indicates the status of the updated
files. Save the project, and restart PathwaysTM to use the updated data and plug-ins.
126
RGMA10011 rev B
14.5 Updating from CD
For those customers whose PathwaysTM installation computer does not have access to the internet, a CD based updating facility is provided. The CD Updater will update both GeneFilters
and program files, giving the user access to the latest GeneFilters data as well as new program
features and bug fixes. Enabling CD updates is accomplished by selecting the EditSettings
menu item. As shown below, there are two updating protocols that are available to the user:
Network and CD. Network updates are the initial default. To change this setting, simply select
the CD option and PathwaysTM will attempt to update from a CD when the update tool is
invoked. CD updates are recommended only for those with internet access problems.
After setting the update source to CD, CD updates may be accessed from the ToolsUpdate
Pathways menu item. When the user selects ToolsUpdate Pathways, a file dialog will be
displayed. Select the CD drive that contains the PathwaysTM Update CD by single clicking on
the appropriate drive letter as shown below. Click Ok to start the update process.
127
RGMA10011 rev B
After the CD update has started, the dialog for selecting and updating data files and programs
files is identical to that of the Network updater.
When either a network update (bad connection, update server is down, et cetera.) or a CD
update (unreadable disk, incorrect cd location) fails, PathwaysTM will display an Update
Interruption/Failure dialog as shown below. This dialog contains four choices. The user may
retry the update, change the update source to CD, change the update source to network or the
update can be cancelled. If the user elects to retry the update, PathwaysTM either tries to reestablish the network connection or presents the user with a file dialog box, depending on the
update source. The second and third choices temporarily change the update source and try to
update from that new source. This change is only temporary and does not affect the update
source as defined in the settings dialog box. Finally, if cancel is selected the update process is
aborted, and the user is returned to the PathwaysTM main window.
128
RGMA10011 rev B
Chapter 15: Examples
15.1 Introduction to Example 1
This section is a quick reference for a basic application using the PathwaysTM framework: comparison of two microarrays to analyze the intensity ratios and differences. Parts of the process,
such as importing, have been explained in detail in previous chapters. The aim of this example
is to provide a guide for a simple project from start to finish. GeneFilters microarray images
are used in this example.
In this example, there are three steps in the PathwaysTM Quick Start palette.
1 Import new microarray images.
2 Use the project wizard to create a new project.
3 Compare two microarray images and print a report.
Interactive importing of two GeneFilters microarray images in the template mode are outlined
in this example. Finally, printing a report of the project is demonstrated.
The PathwaysTM Quick-Start palette appears at start-up, unless it is disabled by checking the Do
not show at start-up box at the bottom of the palette. Alternatively, the Quick-Start palette can
be selected from the Tools main menu and clicking on Quick-Start or pressing Ctrl + K.
15.2 Example 1 Step One: Import Microarray Images
From the Quick-Start palette, select the Import microarray icon.
129
RGMA10011 rev B
When the Import dialog box appears, perform the following steps.
1 Select the images to import from the appropriate directory / folder / file from the
'Look in' field.
2 Complete or select fields in the import dialog box to specify microarray name and
brand, image format, sampling type, file type, output directory, et cetera.
3 Click the Add button and Ok to continue importing.
Uncheck the Batch process box for interactive importing.
In this example, Tiff images named Sample_gf225_1.tif and Sample_gf225_2.tif are selected
from the PathwaysTM 4 folder. The output file is selected by clicking the Browse button.
130
RGMA10011 rev B
The interactive importing process in this example consists of three steps after the image has
been automatically loaded.
1 Align Template Click the Template button. Instructions on creating, resizing, and
moving the template appear on the screen to the left of the image.
Uncheck the Adjust Global box, and check Use Magnifier to fine tune the alignment using the
template hints that appear on the screen to the left of the image. In this example, 16 alignment
points are adjusted for the GeneFilters microarray images.
131
RGMA10011 rev B
In the magnifier box, the alignment points can be moved by left-clicking anywhere in the magnified image. Up and Down arrows on the keyboard increase or decrease magnification when
the magnifier window is active.
2 Compute centers
Click the Next button after alignment. Centers are computed automatically.
3 Verify centers
Verify centers by clicking the crosshair on any alignment point in the image. A detail
viewer in the window to the left shows the detail view of each point. From this
window, spots can be manually centered.
132
RGMA10011 rev B
To add the research name and notes on the project click the Annotation button on the toolbar.
Yield a better picture of the alignment by zooming in and out on the detail viewer with the up /
down arrow keys.
133
RGMA10011 rev B
To manually invalidate a clone, check the Invalid Clone box in the Detail View area.
Click Done if the alignment is satisfactory, or click Back to realign the image.
The importing process for the first image is complete. When the next image is loaded automatically, repeat the preceding steps. The importing process is completed, and the Quick-Start
palette reappears on the main screen when no more images are selected for importing.
15.3 Example 1 Step Two: Create a Project Using the Project Wizard
The Project Wizard icon on the Quick-Start opens a wizard that guides project creation.
Creating a project allows a researcher to organize the data for analysis, save the data, and
reopen the data later. Setting up the project includes specifying the kind of project and choosing the microarray images from a list of imported images. In this example, a project is created
to compare the intensity ratios and differences of the two imported images.
To start a new project, perform the following steps.
1 Click the Project Wizard icon in the Quick-Start palette.
2 Select 'Compare intensities of two microarrays' as the project type.
3 Enter Project name and Researcher's name.
4 Choose the two microarrays.
5 Select the normalization type (in this example, Data Point Normalization).
6 Click Finish to exit the wizard.
134
RGMA10011 rev B
15.4 Example 1 Step Three: Comparison Analysis & Report Generation
After exiting the Project Wizard, the workspace displays the comparison data for analysis.
Showing the intensity ratios in a red / green overlay, the synthetic view is the default setting.
Data can also be viewed as a scatter plot or table. Plots and tables may be saved as images. In
this example, the data appears as a scatter plot (below).
135
RGMA10011 rev B
To generate a report, perform the following steps.
1 Click the Report button to generate the report wizard.
2 Select how to output the report (e.g. printer).
3 To include information that appears in the report, check the boxes on the right, and
complete the description fields.
4 Click the Print button to generate a Report Preview window that allows the report
to be previewed and printed.
136
RGMA10011 rev B
15.5 Example 2: Complex Time Study
The following example describes the use of PathwaysTM for a more complex project: a time
study with repeat data. The example offers an overview of the analysis capabilities of
PathwaysTM, and there is a brief description on the creation of the project and the analysis windows.
First, an Empty Project is created from the new project wizard. Conditions and microarrays are
added using menus accessed by right clicking in the project tree.
This project shows four conditions in a time study: Control and 1, 2, and 3 Month trials. Each
condition has two microarray types: GF200 and GF202. Each microarray is repeated in triplicate for each condition. Repeated elements allow statistical data analysis.
137
RGMA10011 rev B
15.6 Example 2: Comparison Analysis
Comparison analysis obtain a broad overview of the data by displaying data from entire
microarrays or conditions in a single plotting window with different series overlaid or with multiple table separated synthetic microarray or table windows.
For the current study, clones that are up or down regulated are determined across the time study
in comparison with the Control condition. A comparison view is first created by selecting
CompareCondition Pairs from the main menu.
Conditions are used for this analysis, rather than microarrays, because both microarray types
(including repeats) will be reviewed across all conditions. A condition pair is chosen to observe
the upregulation and downregulation of the clones, relative to the control condition. Therefore,
pair each condition in the time study with the control condition to establish differential expression.
138
RGMA10011 rev B
After selecting the condition pairs, click the Ok button to generate the condition analysis window. The first view shown is the scatter plot. Specify a 99 % confidence interval for the t-Test
filter (the points shown have a 99 % likelihood of being differentially expressed) to ensure a
statistically significant difference in expression.
A title has been added to the plot, and error bars are enabled (these options are established in
the chart customization dialog box, which is generated by right clicking on the chart).
15.7 Example 2: Profiling Analysis
After reviewing the differential expression for the experiment, focus on how the genes that are
associated with cancer behaved in the study. To analyze expression levels, rather than differential expression, choose the Condition(s) grouping for the analysis from the Profile menu.
139
RGMA10011 rev B
Isolate the cancer genes by unclicking Show non-members in the Path filter list. The chart title
is entered in the chart customization dialog box, which is generated by right clicking.
To learn more about the most highly expressed gene in the control study, select this gene from
the chart view, and activate a web link to Unigene.
140
RGMA10011 rev B
Finally, to view the overall trending of the cancer genes, rather than the detailed plot of each
gene, open the bar chart view. The bar chart view presents the average of the cancer genes,
along with standard deviation bars.
141
RGMA10011 rev B
15.8 Example 2: Clustering Analysis
As a final step in the time study analysis, locate clones that behaved similarly to the cancer
genes. Clustering the analysis data allows us to group the set of clones into clusters of similarly
behaving clones. As with the profiling analysis, start with the appropriate menu selections for a
condition grouping.
142
RGMA10011 rev B
The Clustering dialog box allows us to specify the type of clustering algorithm and the properties for the algorithm. Choose a KMeans cluster with 50 means (clusters).
To view the clusters for specific cancer genes, activate the cluster filter at the bottom of the
screen. Open the Find Clones window from the cluster window toolbar, and click on the
clones in this path to display the corresponding clusters.
143
RGMA10011 rev B
Finally, save the results from the study to a text file for later reference by opening the Report
dialog box from the cluster window toolbar.
144
RGMA10011 rev B
Book VI: Appendices
145
RGMA10011 rev B
Appendix I: ResGenTM GeneFilters Microarrays
I.1 Introduction
Being able to profile gene expression patterns of tens of thousands of genes in a single experiment, cDNA microarrays have generated great interest in the past few years. When combined
with the PathwaysTM 4 software package, ResGenTM GeneFilters microarrays offer the scientific community an opportunity for low cost entry into the microarray arena without compromising
experimental quality. By offering a reusable microarray system without the need for complex
and expensive laboratory setup, this powerful tool is affordable to every laboratory involved in
genomics research.
This Appendix includes an overview of ResGenTM GeneFilters microarrays' technology, as well
as brief descriptions of each microarray product: GeneFilters Mammalian microarrays
(human, rat, and mouse); GeneFilters Yeast microarrays and MyArray DNA. The many different applications of microarray technology, such as differential gene expression, gene discovery, genotyping, pharmacogenetics, et cetera, can greatly accelerate genomic research.
I.2 The GeneFilters Microarray System
Templates for genes are obtained from ResGenTM cDNA libraries arrayed in multi-well culture
plates. The insert DNAs are prepared and quality-control checked before being printed onto
positively charged nylon membranes using an automated robotic system. The DNA is then UVcross linked to the membranes. These printed membranes are the ResGenTM GeneFilters
microarrays.
In a typical experiment (Fig. 1), total RNA from both control and experimental samples are
reverse transcribed and simultaneously radioactively labeled by incorporation of α-33P dCTP in
the reverse transcription reactions. These labeled probes are then purified and used in parallel
hybridization experiments. Expression levels of the genes on the arrays are observed as
hybridization "spots.” A phosphor imaging system detects the intensity, and the image data set
is then imported into PathwaysTM 4 for analysis. Pseudo-colored images are created in
PathwaysTM 4 for each data set. When comparing expression patterns between control and
experimental samples, the two pseudo-colored images are merged to show intensity differences
and ratios. Information related to each clone, including gene name, clone ID, accession number
et cetera. are attached to each target. Tools for data analysis and data management are available
in PathwaysTM 4.
For detailed experimental protocols, visit the http://www.resgen.com/products/GF200_protocol.php3.
146
RGMA10011 rev B
Figure 1. An overview of the GeneFilters microarrays system
On-line resources for GeneFilters microarrays
For a current list of GeneFilters microarray products, visit
http://www.resgen.com/products/MammGF.php3 for GeneFilters Mammalian microarrays, and
http://www.resgen.com/products/YeastGF.php3 for GeneFilters Yeast microarrays.
For a list of genes spotted on each membrane, visit the ResGenTM ftp site at
ftp://ftp.resgen.com/pub/genefilters.
For a query for identifying each spot on a membrane, visit
http://www.resgen.com/resources/apps/genefilters/.
147
RGMA10011 rev B
I.3 Layout of GeneFilters Microarrays
On the GeneFilters microarrays membranes, there is a system of controls, including total
genomic DNA and putative housekeeping genes. The controls help to orient and align the membrane when using PathwaysTM software. Familiarity with GeneFilters microarrays membrane
layout facilitates image importing.
A GeneFilters Mammalian microarrays
The GeneFilters Mammalian microarrays contain a total of 5,184 genes spotted on a single
nylon membrane. Each membrane is cut in the upper right corner for orientation and the DNA
is on the labeled side of the membrane. Figure 2 illustrates the general format of a
GeneFilters Mammalian microarray membrane. Each membrane is divided into two fields.
Field 1 is at the top and Field 2 is at the bottom. Each field is then further divided into eight
grids. Grids are laid out right to left, A through H in each field and then organized into 12
Columns and 30 Rows. Columns are numbered 1 to 12, right to left in each grid. Rows are
numbered 1 to 30, from top to bottom, in all grids, in both fields. Control positives are in
Column 1, Rows 1, 3, 5, 7, 9, 11, 25, 27, and 29; and in Column 2, Rows 1, 3, and 5, in each
grid. Also in each grid, the housekeeping genes are in Column 1, Rows 13 through 24 (Fig. 2
and Fig. 3). The spacing between each spot is 750 microns from center to center (Fig. 3).
148
RGMA10011 rev B
Figure 2. Example of a GeneFilters Mammalian microarray format (all releases). The 'control
positive' or total genomic spots are shown as filled black circles. The putative 'house keeping
genes' are shown as filled red circles. Data spots are shown as open circles. GeneFilters
Tissue Specific and Named Gene microarray releases have the same overall format, but there
may be some areas on the membranes without DNA spots, depending on the number of cDNAs
included on each membrane.
B GeneFilters yeast microarrays
The GeneFilters Yeast microarrays consist of 6,144 gene ORFs spotted on a set of two nylon
membranes (GF100-I and GF100-II) each containing 3,072 ORFs. Each membrane is cut in the
upper right corner and the DNA is on the labeled side of the membrane. Figure 4 illustrates the
format of the GeneFilters Yeast microarrays membranes. Each membrane is divided into two
fields; Fields 1 and 2 for GF100-I and Fields 3 and 4 for GF100-II. Fields 1 and 3 are at the
top, Fields 2 and 4 are at the bottom. Each field is further divided into eight grids per field.
Grids are laid out right to left, A through H in all fields. The grids are organized into nine
Columns and 24 Rows. Columns are numbered 1 through 9, right to left in each grid. Rows
are numbered 1 through 24, from top to bottom, in each grid. Control positives are in Column
1, every other Row, in all grids, in both fields. The spacing between each spot for GeneFilters
Yeast microarrays is 1,000 microns from center to center.
149
RGMA10011 rev B
Figure 3. Example of a GeneFilters Yeast microarray format (all releases). The control positive, or total genomic spots, are shown as filled black circles. Data spots are displayed as open
circles.
150
RGMA10011 rev B
Appendix II: Migrating to PathwaysTM 4 Universal
II.1 Introduction
Compared to PathwaysTM 2, PathwaysTM 4 offers additional capabilities like statistical analysis
tools and graphical visualization of data. Data storage has been improved in PathwaysTM 4, with
data stored in sharable files.
Other useful features include hyperlinks to online databases and an available update service to
the ResGenTM Data Server. PathwaysTM 4 has the flexibility to accommodate other commercial
or custom microarray formats, rather than ResGenTM GeneFilters microarrays alone.
This software supports other image formats. PathwaysTM, Tiff, and Fuji image formats may be
imported, and there the software can be extended to include other image formats. From image
format and sampling to normalization and data analysis, PathwaysTM 4 can be customized.
Along with many others, these changes allow PathwaysTM 4 to perform as a complete package
for the analysis of differential gene expression using microarray data.
II.2 Image Import and Alignment
Image format and microarray format capability
PathwaysTM 4 supports multiple image formats including PathwaysTM, Tiff and Fuji formats.
Because different researchers have access to different scanning equipment, other image formats
can also be accommodated. Unlike PathwaysTM 2.0, PathwaysTM 4 can be used for microarray
formats other than ResGenTM GeneFilters microarrays. The software can be customized to
analyze microarray products marketed by other vendors or even on custom arrays through the
use of the array designer. The analysis tools featured in PathwaysTM 4 Universal are made available to researchers no matter what type of microarray they decide to use for their experiments.
These features are unavailable in PathwaysTM 4 GeneFilters.
Batch import
Data from PathwaysTM 2.0 images must be reimported into PathwaysTM 4 using the original
images. These images must be generated by a phosphor imager, not by PathwaysTM 2.0, a necessary step because of the different way that data is handled and stored in PathwaysTM 4. With
the 'batch importing' feature, reimporting images is faster, and the process is easier. Batch
importing automatically imports multiple images using the software's autocentering algorithms.
The images can then be visualized to ensure proper alignment before continuing with analysis.
An option to perform interactive importing allows manual image alignment (see below).
151
RGMA10011 rev B
Interactive import
The interactive importing of PathwaysTM 4 goes beyond what was available in PathwaysTM 2.0.
For instance, when an image has been imported in an incorrect orientation, PathwaysTM 4 allows
it to be rotated. A global alignment feature allows a template to be dragged over the image.
This template includes alignment points that help locate the corresponding reference spots on
the image. A magnifier with zooming capabilities aids in centering the points for better image
alignment. Should there be difficulty finding spot centers, a pseudo-color option is available to
help with visualization. After aligning the image, PathwaysTM 4 detects clones with a centering
algorithm, and a verification window appears. Select spots to check for proper alignment and
readjust them, if necessary. These features were unavailable in PathwaysTM 2.0 (refer to
Importing Images).
II.3 Grouping of Data and Complex Analysis
There is a dramatic improvement once images pass the importation steps and move into the data
analysis process. Using the terminology 'microarray(s), 'microarray pair(s),' ‘condition(s),' and
'condition pair(s)' is one of the new concepts of PathwaysTM 4.
Once researchers become familiar with these new concepts of data grouping, they will value the
global and complex analysis options PathwaysTM 4 has to offer (refer to the "Core Concepts in
PathwaysTM Data Analysis: grouping of data" section). In PathwaysTM 2.0, single GeneFilters
microarrays are analyzed for intensities by selecting Analyze GeneFilter from the tool palette.
To look at the ratios of normalized data from two GeneFilters, select Compare GeneFilters.
These same functions can be performed in PathwaysTM 4, but the terms that describe them are
different. In PathwaysTM 4, these analysis tools are found under the Comparison menu. Analyze
a single GeneFilters microarray by selecting Microarray(s). Analyze two GeneFilters
microarrays by selecting Microarray pair(s) from the Comparison pull down menu. In addition,
these options are on the Quick Start menu, which is similar to the PathwaysTM 2.0 tool palette.
Multiple microarrays can be examined simultaneously. For example, by adding more than one
GeneFilters microarray when selecting 'microarray(s)' from the 'Comparison' menu, it is possible to view the intensities of filters in an overlay. This means that the intensity data of each filter is still viewed separately and no ratios are calculated. In graphical representations of the
data, both the intensities of each filter are displayed on the same graph, each with a different
color-coding. In the same manner, multiple sets of microarrays can be added into the 'microarray pair(s)' comparison analysis. PathwaysTM 4 also has an option for a new, broader level of
data analysis, termed a condition. By grouping data under a condition, a researcher can include
more than one microarray (i.e., repeated experiments) and even microarrays of different types
(i.e., ResGenTM GF200 and GF211), together in one group. The behavior of that set of data versus that of another set of data (i.e. condition A versus condition B) can be analyzed by comparing Condition pair(s). Other PathwaysTM 4 analysis tools are profiling and clustering.
152
RGMA10011 rev B
II.4 Normalization and Data Filters
Because of the large amount of data generated by microarray experiments, normalize and filter
data. Select the way that PathwaysTM 4 normalizes data from a preset list, or even customize the
process. The software extracts the information to display intensities and calculate ratios from
the normalized data.
In PathwaysTM 2.0, intensity ratios are displayed in a + / - fashion to show the upregulation and
downregulation of genes, respectively. In PathwaysTM 4, users can select how ratios are represented. PathwaysTM 4 plots the true ratio (not the ‘+ / -’ convention), but it allows the + / - ratios
to be displayed when filtering ratios. As in PathwaysTM 2.0, PathwaysTM 4 offers the ability to
filter large sets of data to certain areas through the following techniques.
· Manipulating histograms
· Designating paths or lists of clones
· Keyword or string searches
II.5 Viewing Data
The filtered data can be viewed in various different graphical representations such as scatter
plots, histograms, and clustergrams. Of the different graphical representation offered, each is
interactive. A clone can be selected from the graph and a detailed view of that clone from the
original image appears. The clone title, accession number, cluster ID, and more are also included. The tables, graphs, and reports generated in PathwaysTM 4 can be saved and printed for use
in papers, posters, and presentations (refer to “Core Concepts in Data Analysis: Reports”).
II.6 Data Management and Updates
PathwaysTM 4 does not employ the Microsoft Access Database; therefore, it allows users to share
data files. After microarray images are imported into the software, the images and data are cataloged in a library. They are organized and saved by microarray type along with the information
pertinent to each microarray. For example, the library displays the original image file, image
type, import date, and any experimental annotation associated with the microarray that is highlighted. Select microarrays from this library for analysis. Analysis performed on these microarrays is saved as a project, which can be reopened later. Project organization lets a researcher
save work. Once analysis is complete, users can generate printable reports.
Other key features of PathwaysTM 4 are hyperlinks and data file updates. Clones can be
searched for on public databases such as GenBank and Unigene through hyperlinks. Users
can also add hyperlinks to other web sites. To ensure that the data for each clone are current,
ResGenTM offers a subscription service to help keep information up-to-date.
153
RGMA10011 rev B
II.7 Making the Change
The easiest way to convert to PathwaysTM 4 from PathwaysTM 2.0 is to use this manual. The
PathwaysTM 4 manual contains detailed explanations and descriptions of the features contained
in the PathwaysTM 4 software. Book V of this manual contains a chapter of examples to guide
researchers through the basic steps of image importing and analysis. This chapter illustrates
how to simulate the functions of PathwaysTM 2.0, and it shows detailed examples of how to use
the new analysis features of PathwaysTM 4. Questions about the PathwaysTM 4 software can be
answered by emailing the GeneFilters / PathwaysTM technical support group at
[email protected].
II.8 Migrating from PathwaysTM 3
PathwaysTM 4 is fully compatible with PathwaysTM 3 image files and projects, so current
PathwaysTM 3 users should encounter no difficulties when they migrate to PathwaysTM 4.
Changes to the user interface have been kept to a minimum in order to provide the user with a
familiar experience.
PathwaysTM 4 contains many new features, making the use of PathwaysTM 4 files impossible on
older versions of the software. PathwaysTM 3 users should carefully read through this manual to
learn how to access the new features available to them with PathwaysTM 4.
PathwaysTM 3 users need to obtain a new license key to use PathwaysTM 4 from the ResGenTM
Customer Care Unit ([email protected]). Older license keys will not work with PathwaysTM 4.
154
RGMA10011 rev B
Appendix III: Exporting Images from Fuji Software
The PathwaysTM 4 Fuji plug-in reads the Fuji img/inf file combination, which is output by Fuji
Bas scanners. The 'img' (image) file contains raw image bytes, while the 'inf' (information file)
contains fundamental image information, such as width, height, encoding parameter, et cetera.
The following paragraphs describe how to export inf / img formats from the Fuji ImageGage©
software.
Obtaining Images in MacOS ImageGauge© 3.3
Obtain images by selecting "File | Export | Fuji Exchange Format..." in the menu. Doing this
outputs the two files (the ~.img and the ~.inf), which is in the directory read by the converter. It
is possible to select "File | Export |RAW...”, but the ~.inf information must be supplied to the
Fuji plug-in manually in the properties view (see Locating the ~.inf information below).
Obtaining images in Windows ImageGauge© 3.12
The Windows standard format is already in the two file (~.img and ~.inf) form and so is ready
to be read by Fuji to Tiff Converter©. The two files must be in the same directory when opened
in the converter.
Obtaining images in other ImageGauge© versions
In "File | Export" search for an option "RAW..." or "Fuji Exchange Format...". If "RAW..." is
selected, the ~.inf information must be supplied (see Locating the ~.inf information below).
When "Fuji Exchange Format..." is selected, the two files are output (the ~.img and ~.inf files),
and both files must be in the same directory to be read by the converter.
Locating the ~.inf information
This information can be directly viewed from the file with the ~.inf extension (just open the file
in a text editor). If this view is impossible, the information can be obtained from Image
Gauge© under "File | File Info..." The appropriate encoding parameters can be entered in the
'properties' view for the Fuji plug-in in the PathwaysTM image import dialog box.
155
RGMA10011 rev B
Appendix IV: License Agreement
STOP! READ THIS INFORMATION CAREFULLY.
USE OF ANY OF THE SOFTWARE PROVIDED WITH THIS AGREEMENT (THE "SOFTWARE") CONSTITUTES YOUR ACCEPTANCE OF THESE TERMS. IF YOU DO NOT
AGREE TO THE TERMS OF THIS AGREEMENT WITH RESPECT TO ANY OF THE
SOFTWARE PROVIDED, CLICK "CANCEL" BELOW AND RETURN THE MEDIA CONTAINING THE SOFTWARE AND THE ACCOMPANYING ITEMS (INCLUDING WRITTEN
MATERIALS AND PACKAGING AND ALL COPIES THEREOF) TO THE LOCATION
WHERE YOU OBTAINED THEM FOR A REFUND. PLEASE NOTE THAT YOU WILL BE
REQUIRED TO REGISTER THE SOFTWARE PROVIDED WITH THIS AGREEMENT
PRIOR TO USE.
1. LICENSE GRANT. Unless otherwise authorized by ResGenTM under a separate agreement,
ResGenTM grants you a limited, non-exclusive, non-transferable license to use the SOFTWARE
on only one (1) computer. Further, you agree to not load the SOFTWARE on a file serve without first obtaining permission to do so from ResGenTM. You also agree that you will only copy
the SOFTWARE into any machine-readable or printed form as necessary to use it in accordance
with this license or for backup purposes in support of your use of the SOFTWARE. This
license is effective until terminated. You may terminate it at any point by destroying the SOFTWARE together with all copies of the SOFTWARE, modifications of the SOFTWARE, and all
supporting written materials and packaging, and certifying such termination in writing to
ResGenTM. Also, ResGenTM has the option to terminate this license if you fail to comply with
any term or condition of this Agreement. You agree upon such termination by ResGenTM to
promptly destroy the SOFTWARE together with all copies of the SOFTWARE, modifications of
the SOFTWARE, and all supporting written materials and packaging. Any failure on the part of
ResGenTM to exercise its option to terminate this license shall not be found to be a waiver or
estoppel of such right.
2. UPGRADES. This license is limited to the version of the SOFTWARE enclosed and does
not include the right to upgrades except as provided in this Section 2. If you purchased this
SOFTWARE directly from ResGenTM, you are entitled: (a) as to products other than Pathways™
software, to download from our web site, http://www.resgen.com, and use all upgrades of the
SOFTWARE (including filter libraries) released during the one year period following purchase;
and (b) as to Pathways™ software, to download from our web site, http://www.resgen.com, and
use all upgrades of the SOFTWARE released during the one year period following purchase.
You must in any event register with ResGenTM to receive all upgrades hereunder.
3. COPYRIGHT. The SOFTWARE, including the source code, file definitions, and object
code, is protected by United States copyright law and international treaty provisions. You
acknowledge that no title to the intellectual property in the SOFTWARE is transferred to you.
You further acknowledge that title and full ownership rights to the SOFTWARE will remain the
exclusive property of ResGenTM or its suppliers, and you will not acquire any rights to the
SOFTWARE except as expressly set forth in this license. You agree that this license does not
156
RGMA10011 rev B
allow you to modify or prepare derivative works of the SOFTWARE or written materials. You
agree that any copies of the SOFTWARE, modifications, and supporting written materials permitted hereunder will contain the same proprietary notices that appear on and in the SOFTWARE.
4. REVERSE ENGINEERING. You agree that you will not attempt to reverse compile, modify, translate, or disassemble, or otherwise attempt to reverse engineer the SOFTWARE in whole
or in part.
5. LIMITED WARRANTY. For thirty (30) days from the date purchase, ResGenTM warrants to
the original purchaser, as evidenced by a copy of the invoice, that the media (i.e. diskettes) on
which the SOFTWARE is contained will be free from defects in materials and workmanship
which substantially affect performance. Any failure that results from misuse, abuse or a failure
to follow the operating instructions in the accompanying written materials shall render this
Limited Warranty inapplicable.
6. CUSTOMER REMEDIES. If the media does not conform to the limited warranty in Section
5 above ("Limited Warranty"), your sole remedy shall be to return the media and notify
ResGenTM in writing within thirty (30) days of your claim of any defect, including a description
thereof. The defective media in which the SOFTWARE is contained will be replaced by
ResGenTM at no additional charge to you. If you do not receive media which is free from
defects and materials and workmanship within thirty (30) days of ResGenTM being notified of
your claim of defect, ResGenTM will refund to you the amount you paid for the SOFTWARE.
Any replacement SOFTWARE will be warranted for the remainder of the original Limited
Warranty period.
7. LIMITATION OF WARRANTIES AND LIABILITIES. EXCEPT FOR THE EXPRESS
LIMITED WARRANTY IN SECTION 5 ("LIMITED WARRANTY"), ABOVE, THE SOFTWARE AND MEDIA ARE PROVIDED ON AN "AS IS" BASIS AND NEITHER RESGENTM
NOR ITS SUPPLIERS WARRANT THAT THE SOFTWARE OR MEDIA ARE ERROR
FREE. RESGENTM AND ITS SUPPLIERS DISCLAIM ALL OTHER WARRANTIES WITH
RESPECT TO THE SOFTWARE AND THE MEDIA, EITHER EXPRESS OR IMPLIED,
INCLUDING WITHOUT LIMITATION THE WARRANTIES OF MERCHANTABILITY, FITNESS FOR A PARTICULAR PURPOSE AND NON-INFRINGEMENT OF THIRD PARTY
RIGHTS. THE ENTIRE RISK IS BORNE BY YOU AND IF THE SOFTWARE PROVES TO
BE DEFECTIVE, YOU AND NOT RESGENTM ASSUMES THE ENTIRE COST OF ANY
SERVICE OR REPAIR. SOME JURISDICTIONS DO NOT ALLOW THE EXCLUSION OF
IMPLIED WARRANTIES OR LIMITATIONS ON HOW LONG AN IMPLIED WARRANTY
MAY LAST, OR THE EXCLUSION OR LIMITATION OF INCIDENTAL OR CONSEQUENTIAL DAMAGES, SO THE ABOVE LIMITATIONS OR EXCLUSIONS MAY NOT APPLY
TO YOU. THIS WARRANTY GIVES YOU SPECIFIC LEGAL RIGHTS AND YOU MAY
ALSO HAVE OTHER RIGHTS WHICH VARY FROM JURISDICTION TO JURISDICTION.
8. SEVERABILITY. In the event of invalidity of any provision of this license agreement, the
parties agree that such invalidity shall not affect the validity and enforceability of the remaining
157
RGMA10011 rev B
portions of this license.
9. NO LIABILITY FOR CONSEQUENTIAL DAMAGES. IN NO EVENT SHALL
RESGENTM OR ITS SUPPLIERS BE LIABLE TO YOU FOR ANY CONSEQUENTIAL, SPECIAL, INCIDENTAL OR INDIRECT DAMAGES OF ANY KIND ARISING OUT OF THE
DELIVERY, PERFORMANCE OR USE OF THE SOFTWARE, EVEN IF RESGENTM HAS
BEEN ADVISED OF THE POSSIBILITY OF SUCH DAMAGES. IN NO EVENT WILL
RESGENTM OR ITS SUPPLIERS' LIABILITY FOR ANY CLAIMS, WHETHER IN CONTRACT, TORT OR ANY OTHER THEORY OF LIABILITY, EXCEED, IN THE AGGREGATE THE LICENSE FEE PAID BY YOU, IF ANY.
10. GOVERNING LAW. This license will be governed by the internal laws of the State of
Alabama without regard to that State's conflicts of law provisions. The United Nations
Convention on Contracts for the International Sale of Goods is specifically disclaimed.
11. ENTIRE AGREEMENT. This is the complete and entire agreement between you and
ResGenTM and its suppliers and it supersedes any prior agreement or understanding, whether
written or oral, relating to the subject matter of this license. This license may not be modified
or altered except by written instrument duly executed by both parties.
UNITED STATES GOVERNMENT RESTRICTED RIGHTS
Any distribution or license of the SOFTWARE and its supporting written materials to the
United States Government or its agencies or instrumentalities (the "Government") is made only
with RESTRICTED RIGHTS. Use, duplication or disclosure by the Government is subject to
restriction as set forth in subparagraph (c) (1) (ii) of the Rights in Technical Data and Computer
Software clause at DFAR 252.227-7013, or as set forth in the particular department or agency
regulations or rules which provide ResGenTM protection equivalent to or greater than the abovecited clause. Contractor/Manufacturer is ResGenTM, 2130 Memorial Parkway SW, Huntsville,
Alabama 35801. Should you have any questions concerning this license agreement, or if you
desire to contact ResGenTM for any reason, please call (800) 533-4363, fax (256) 536-9016, or
write: ResGenTM, 2130 Memorial Parkway SW, Huntsville, Alabama 35801.
ResGenTM is considered a Supplier for purposes of this License. ResGenTM is a branded product
line of Invitrogen Corporation.
158
RGMA10011 rev B
Appendix V: Technical Support
For more information or technical assistance, call, write, fax, or email. Additional international
offices are listed on our Web page (www.invitrogen.com).
Corporate Headquarters:
Invitrogen Corporation
1600 Faraday Avenue
Carlsbad, CA 92008 USA
Tel: 1 760 603 7200
Tel (Toll Free): 1 800 955 6288
Fax: 1 760 602 6500
E-mail: [email protected]
Japanese Headquarters:
Invitrogen Japan K.K.
Nihonbashi Hama-Cho Park Bldg. 4F
2-35-4, Hama-Cho, Nihonbashi
Tel: 81 3 3663 7972
Fax: 81 3 3663 8242
E-mail: [email protected]
European Headquarters:
Invitrogen Ltd
Inchinnan Business Park3
Fountain Drive
Paisley PA4 9RF, UK
Tel: +44 (0) 141 814 6100
Tel (Toll Free): 0800 5345 5345
Fax: +44 (0) 141 814 6117
E-mail: [email protected]
159
RGMA10011 rev B
Glossary
ANOVA. This is an acronym for Analysis of Variance. ANOVA is a statistical analysis plug-in
that compares the variance of the data calculated within conditions to that across conditions. If
the variances are not the same, then it is an indication that the means are different.
Array Designer. The Array Designer is a tool available to PathwaysTM Universal users. It
allows any type of microarray to be imported by creating a layout for associating data with an
image of the microarray.
AtlasTM Array Gene List. This is a microarray type developed by Clontech Laboratories, Inc.
For more information, see http://www.clontech.com/atlas/index.shtml.
Autocentering. Autocentering algorithms analyze microarray experimental images and determine the location of each clone in an experimental image. The process for locating the clone
centers does not require user input and is therefore automatic.
Background. The background display shows the computed background intensity for the image.
This display is useful when evaluating low intensity points. Spots with intensities at or near the
background average could be noise.
Batch. The batch importing mode uses the autocentering algorithms to automatically import
multiple microarray images.
Brightness. Brightness adjusts the viewed intensity of the spots in the SynFilter window. If the
spots cannot be seen easily, the brightness is low; it can be increased by using the Brightness
Slider. If the spots appear to be the same, the brightness is high; it can be decreased by using
the Brightness Slider.
Brightness slider. This tool adjusts the brightness or intensities of the spots in the Synthetic
Microarray Windows. Sliding the brightness slider to the right increase the brightness; sliding it
to the left decreases the brightness level.
Chen test. This test is a statistical analysis plug-in that determines whether two sampled intensities are different, based on a desired confidence level.
Clone key. A clone key is a unique identification string that is present for each clone in a
microarray. The clone key is the accession number when available, but it could be any identifier such as "tgDNA" for total genomic DNA. Repeat spottings in a microarray must have the
same clone key to be treated as repeats for statistical analysis. The clone keys are contained in
the microarray’s description file.
Clone number. The clone number is the index of the clone in the microarray (the microarray
address is the filter type plus the clone number, e. g., ‘GF200 100’). For GeneFilters, the
clone number is ordered by field, grid, row, and column.
160
RGMA10011 rev B
CMTTM Map File. This is a Corning Microarray Technology Map File. A microarray type
designed by Corning Incorporated. For more information, see
http://www.corning.com/CMT/Products/CMTGeneArray.asp.
Compare two microarrays. This button on the Quick Start Palette initiates a Two Microarray
Comparison Project.
Conditions. Conditions represent states of previous imported microarray data in an experiment.
Each condition can contain one or more sampled microarrays that do not have to be of the same
type (e. g., GeneFilters GF200 could be grouped with GF201).
Control points. Control points are the "landing lights" or positive controls that are used for orientation and in the PathwaysTM alignment process for ResGenTM GeneFilters.
Cropping rectangle. A cropping rectangle is a rectangular box that is used in the importing
process to better identify the location of a microarray in an image.
Difference. In a Microarray Pair or Condition Pair analysis window, difference is the numerical
value resulting from the subtraction of the Normalized Intensity of one clone on the first data
set from the Normalized Intensity of the same clone on the second data set.
Filter. PathwaysTM data filters reduce the amount of microarray data that is displayed in analysis windows or shown in reports. Data filters can restrict the displayed clones to a range of
intensities or ratios, and / or to a minimum level of statistical significance, and / or to be members / non-members of selected paths.
Framework. A Framework is a collection of modules that work together to provide a method
of importing microarray data from various sources. Frameworks are only available in
PathwaysTM Universal.
.GEL file. This type of image is a form of .TIF file that is acceptable for PathwaysTM analysis.
See the .TIF File.
GEMLTM. This is an XML-based tag set that provides a method for exchanging gene expression data and related annotations. It is used for transmitting data independent of the methodology used to collect that data.
GenBank. This is an annotated collection of all publicly available DNA sequences located at
http://www.ncbi.nlm.nih.gov/Genbank/.
161
RGMA10011 rev B
GeneFilters microarrays. This is a reusable microarray system that can be probed by standard auto-radiographic methods, offering low cost entry into the microarray arena. Developed
in conjunction with PathwaysTM analysis software, GeneFilters microarrays simplify gene
expression analysis and take advantage of the combination of GeneFilters membranes and isotopic detection.
GeneFilters Human microarrays. These microarrays consist of a single membrane containing up to 5,184 non-control spots. The membrane (5 cm x 7 cm) also contains controls:
genomic DNA monitors the homogeneity of the hybridization, and a series of housekeeping
genes is included for orientation and alignment. Each of the non-control spots on the membrane
contains at least 0.5 ng of insert DNA from an Integrated Molecular Analysis of Genomes and
their Expression / Lawrence Livermore National Laboratories (I.M.A.G.E. / LLNL) cDNA clone
containing the 3' untranslated region end of a gene. These clones were isolated, sequenced, and
verified to be correct. Insert DNA was denatured and UV cross-linked to the positively charged
membrane.
GeneFilters Yeast microarrays. These consist of a total of 6,144 gene ORFs (Open Reading
Frames) derived from the same SGD, individually amplified and spotted onto two nylon membranes. The amplification reactions use specific primer pairs designed to amplify the entire
open reading frame. The primers were generated from unique sequences containing the start
codon ATG and termination codon (supplied by M. Cherry at Stanford Genome Center).
Therefore, the insert DNA consists of the complete open reading frame including the start and
stop codons. A robotic device spots approximately 1 / 10 of a microliter of the denatured insert
DNA solution on a positively charged nylon membrane. The DNA is then UV cross-linked to
the membrane. A system of positive controls, consisting of total yeast genomic DNA, is printed
on each membrane, and it is used for orientation and alignment.
Hierarchical clustering. This is a clustering algorithm that works by finding the two closest
clones and then calling this a cluster. It repeats this step until all clones have been assigned to a
cluster.
Histogram. A histogram is a graphical representation of the distribution of a data set.
Histograms divide a data set from the lowest to highest values into equally sized bins. The
number of items in the data set that fall into each bin allows a graphical representation of the
distribution of the data set.
Housekeeping genes. Housekeeping genes are genes whose expression is required for normal
function of the cell. In general, their expression is consistent, regardless of stimulus.
Import microarray. Selecting Import image from the File menu or clicking this button on the
Quick Start Palette begins the process of importing a new microarray image into PathwaysTM
software.
162
RGMA10011 rev B
Importing. Importing is the process of loading an image from a phosphor imaging system file
into PathwaysTM software. In this process, the image must be loaded into PathwaysTM, the location of each clone must be determined, and the clone intensities must be sampled. The results
of this process are stored in two files: the PathwaysTM sample file (‘.pws’ extension) and the
PathwaysTM image format file (‘.pwf’ extension). The results are then imported into PathwaysTM
database, aligned, and intensity data is recorded into the database.
Intensity. Intensity is the numerical value assigned to the level of expression of a gene or ORF
through the import and sampling process. PathwaysTM analysis uses normalized intensities, and
PathwaysTM normalizes raw intensity values before proceeding with analysis.
Inverting an image. Inverting an image reverses the background and foreground colors of an
image; that is, if looking at dark spots on a white background, inverting the image allows the
researcher to view light spots on a dark background.
Java. Java is a programming language that creates programs that run on multiple operating systems (Windows, Linux, et cetera). Java is fully object oriented, and it is ideal for writing applications with plug-ins, graphical user interfaces (GUIs), and internet connectivity.
KMeans clustering. This is a clustering algorithm that groups data into a specified number of
clusters by finding the center of the cluster and assigning data to the nearest cluster center in an
iterative fashion.
Known genes. This is a microarray that contains only genes with known functions as the data
points (Catalog #GF211).
Main menu. At the top of the PathwaysTM window, this is the bar that reads Files, Edit, ..., and
Help. The Quick Start Palette offers a short cut to items in the main menu.
Meta data. Meta data is the auxiliary data such as accession, cluster ID, title, et cetera, that is
associated with each clone. Meta data is typically read from a description file for the appropriate microarray.
Microarray address. This is an identifier that associates a clone with a spot on a microarray
(e. g., "GF200, Clone 500"). The microarray address identifies the spot by location, whereas
the clone key identifies only a clone type on the microarray. For example, there are multiple
tgDNA clone keys on ResGenTM microarrays (tgDNA is spotted in multiple locations), but a
tgDNA spot has only a single microarray address.
Molecular Dynamics Storm. This is a phosphor imaging system available from Molecular
Dynamics.
163
RGMA10011 rev B
Normalization. Normalization is compensation for global intensity shifts across multiple
microarray experiments. It is possible to make two images similar enough to reasonably compare them by using either the control points, data points, paths, or other methods currently
installed as normalization plug-ins.
Normalization groups. Normalization groups assign an explicit normalization technique to
one or more groups of microarrays.
Packard Cyclone. This is a phosphor imaging system available from Packard Instruments.
Paths. Paths are bookmarks or shortcuts to certain genes. Paths are specified in one of three
ways: (1) by microarray address (location on a microarray type); (2) by clone key (unique
name of a clone, usually accession number); (3) as a search string(s) with each clone’s auxiliary
data (e. g., contains ‘cancer’ in the clone description).
Phosphor imaging system. This is a high-resolution scanner used with radioactive probes
hybridized to ResGenTM GeneFilters or other microarrays.
Plug-ins. A plug-in is a modular programming unit that adds or modifies key algorithms in the
PathwaysTM analysis process. PathwaysTM supports plug-ins for image formats, microarray type,
data sampling, normalization, statistical analysis, and clustering.
Pluggable. A component of Pathways is called Pluggable when a plug-in is associated with the
component (e. g., clustering).
+ / - Ratio. This is a convention for displaying the ratio of the normalized intensities of two
clones that facilitates the recognition of upregulation and downregulation. The + / - ratio of
clone ‘A’ versus clone ‘B’ is equal to the normalized intensity of B divided by A if the normalized intensity of B is greater than A and otherwise the + / - ratio is negative A divided by B.
Project. PathwaysTM projects organize previously imported microarray data into conditions that
represent experimental states.
.PWF file. This is an extension for a PathwaysTM image file that contains calculated clone locations on the experimental image as well as a full resolution copy of the original experimental
image (this copy may be cropped and / or rotated, depending on the alignment of the original
image).
.PWS file. This is an extension for a PathwaysTM sample file that contains sampled data from a
PathwaysTM import session. This file contains the data that is used throughout the PathwaysTM
analysis process.
Quick start palette. This is the picture menu that reappears when a task (such as importing,
analysis, comparison, et cetera) has been completed or exited. This palette can be enabled or
disabled in the Options.
164
RGMA10011 rev B
Ratios. Ratios are the numerical value of the Normalized Intensity of a spot on a microarray in
a microarray pair or condition pair divided by the Normalized Intensity of the same spot on a
second microarray.
Release plate / row / column. These describe the location of the verified clone in the
ResGenTM cDNA libraries.
Reimport. PathwaysTM image files can be read back into PathwaysTM (reimported) without the
need for finding the location of the clones. Reimport allows changing sampling technique for a
file without dealing with finding clone centers or to adjust clone centers (if the center is found
to be in error) without having to deal with global alignments.
Reports. Reports are printable documents compiled by PathwaysTM software that allows the
data specified in an analysis window to be viewed on-screen, printed out, or saved to a text file.
Rosetta GEML ConductorTM. This is a program that converts gene expression data files into
GEMLTM. For more information, see http://www.geml.org/conductor/conductor_home.htm.
Sample image. These are images supplied with PathwaysTM software that allow the researcher
to practice using the applications.
Sampling. Sampling is the process by which raw image data generate an intensity value for
each clone on a microarray. A typical sampling algorithm averages the image data in a circular
area of a clone center, yielding a clone intensity value.
Settings. From the Edit menu, this selection allows the researcher to customize some of the
applications in the software.
SOM clustering. This is the self-organizing map clustering algorithm. A clustering algorithm
that finds clusters in an input data set by mapping the data onto a two-dimensional array of
nodes and then running these nodes through a series of iterative calculations.
Synthetic microarray. This is the view of the microarray image(s) currently being analyzed in
PathwaysTM software. This image is a synthetic, or cleaned-up, version. The spots appear to be
the same size (with differing intensities), allowing analysis and comparison between different
microarrays.
t-Test. This is a statistical analysis plug-in that determines whether two sampled intensities are
different, based on a desired confidence level. The t-Test is a specific application of ANOVA
for two conditions.
Template. A template is a computer-generated sketch of the critical points in a microarray that
can be overlaid on top of an image. Templates can be stretched and rotated, and template points
can be dragged to aid the location of clones in a microarray image during an import process.
165
RGMA10011 rev B
Thumbnail. A thumbnail is an enlarged and enhanced picture of a spot, as it appears on the
original image stored in the PathwaysTM image format file for the current microarray. This picture is intended to be a visual reference, and it is useful only when numerical intensity values
are used simultaneously.
.TIF file (or TIFF File). This image file format created by phosphor imaging systems can be
analyzed by PathwaysTM software.
Unigene. This is a system for partitioning GenBank sequences into a non-redundant set of
gene-oriented clusters, containing sequences representing a unique gene and its associated meta
data. It is located at http://www.ncbi.nlm.nih.gov/Unigene/.
166
RGMA10011 rev B
Index
Analysis Data 89
Annotation 71, 74, 133
ANOVA 90, 94
AntiPath 86
Architecture 10
Array Designer 15, 27, 39
Auto/Crop 67
Autocentering 10, 59, 73, 151, 160
Automated search paths 95
Background 18, 160
Bar Chart 111
Batch Importing 57, 61, 73, 160
Chart Properties 106, 111, 119
Chen test 90
Clone key 78, 160
Clone key paths 94
Clone number 89, 160
Cluster filter 115
Clustergram 121
Clustering 113, 142
Comparison 102, 135, 138
Condition grouping 78, 89
Condition pair grouping 79, 89, 138
Conditions 76, 77, 82, 137, 161
Contrast Controller 21, 64
Control Point Normalization 85
Cropping rectangle 59, 161
CSV File 99
Data Point Normalization 85
Detail View 17
Difference 17, 161
Empty Project 82, 137
Error bars 106, 111
Examples 129
Filters 90, 92, 94, 97, 153, 161
Frameworks 22, 27, 80, 104, 129
Fuji 155
Gel 58, 161
GEML 27, 37, 49
GenBank 123, 153
GeneFilters 162
Global 69, 131
Glossary 160
Graphical User Interface (GUI) 12
Grouping of data 78
Help 25
Hierarchical clustering 113, 116
Histogram 92, 162
HTML File 99
Hyperbolic tree 121
Image Formats 57, 61
Image Import dialog 61
Importing Process 57, 130, 163
Index column 108, 112, 120
Intensity 18, 89, 163
Interactive importing 57, 64
Invert 92
Key-in 92
KMeans clustering 113, 115, 143
License Agreement 156
Log 93, 106, 111
Look and feel 24
Magnifier 69, 131
Menus 13
Meta data 18, 163
Microarray address 77, 163
Microarray address paths 94
Microarray brand 58, 61
Microarray grouping 78, 89
Microarray name 58, 61
Microarray pair grouping 78, 89
Normalization 81, 84, 85, 153, 164
Normalization Groups 87, 164
Normalized Intensity 18
Outlier 89
Path Filtering 97, 98
Path Normalization 85
Paths 94, 164
Pathways 2 10
Pathways image 58, 61
PDF File 99
Plot 106, 110
Plug-ins, Pluggable 10, 57, 58, 59, 62, 85, 89, 114, 164
+/- ratio 17, 93, 164
Printing 99
Profile (cluster) 119
Profiling 109, 139
Progress Bars 23
Project Tree 16
Projects 76, 79, 164
Proxy 24
Quick Start 20, 129, 164
Refresh 84
Reimport 60, 61, 165
Repeated clones 77
Reports 99, 135, 136, 144, 165
Requirements, Hardware and Software 10
Reviewing alignments 71
Sampling Data 61, 165
Settings 24, 165
Single Microarray Projects 79
SOM 113, 116, 117
Strict 91
Synthetic Microarray 103, 165
Table 108, 112, 120
Template 59, 69, 131, 165
Thumbnail 60, 166
Tiff 58, 166
Trim 61
Two Microarray Comparison Projects 81
Unigene 17, 123, 124, 140
Updates 123, 125, 153
Web Browser 123
Web Links 17, 123, 140
Workspace 15
Y.C. Normalization 86
Zoom 106, 111, 119
167
RGMA10011 rev B