1
deviation of the data points. These deviations represent each state’s average value. This result
is not the same as error bars for repeated clones that are displayed in other analysis windows.
Right clicking on the bar chart displays the standard chart controls, including the Chart
Properties dialog box. This version of the Chart Properties dialog box is slightly different from
the version for condition comparison. The bar color has been added to the Global tab in the
Chart Properties dialog box, and the Series tab is not present, because no additional specifications are necessary for each series.
12.5 Table
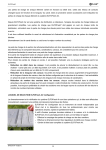
The table view presents the profiled data in a spreadsheet format.
Items of analysis data (e.g. intensity) are displayed in a tab panel as shown above. Each column
can be sorted by clicking the label at the top of the column. Clicking the label again toggles
between descending and ascending sort ordering.
The index column (labels on left side of the table) can be modified using the radio buttons at
the top of the table. Options for indexing include the clone key, microarray address, or any
meta data item.
112
RGMA10011 rev B