1
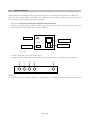
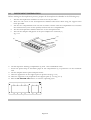
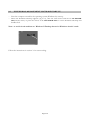
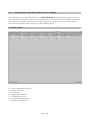
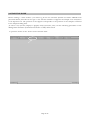
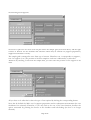
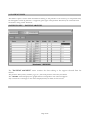
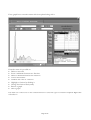
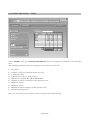
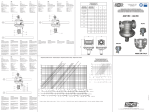
ElePhor 24S AUTOMATIC ELECTROPHORESIS ANALYSER USER MANUAL REV. 01-2011 ELEPHOR 24S - USER MANUAL INDEX Page 4 4 5 5 6 1.0 DESCRIPTION OF THE INSTRUMENT 1.1 Standard components 1.2 Technical characteristics 1.3 Host computer requirements 1.4 Installation 2.0 TURNING ON 2.1 Instrument preparation 2.2 ELEPHOR 24Smanagement software start-up 7 8 9 3.0 ‘ELEPHOR 24S ’ MANAGEMENT SOFTWARE 3.1 Main Panel 3.2 Starting Work 3.3 Patient Lists 3.4 Archive Management - Storage - Search by date - Search by name - Data backup - Restore Data - Deletion 3.5 Display graphs - Delete areas - Insert minimums - Remove minimums - Edit baseline - Calibrate Fraction - Highlight fraction - Set fraction name - Cancel Changes - Print current graph 3.6 Configuration - EXAM parameters - VARIOUS - REAGENTS 3.7 Printout - Print graphs in archive - Print graphs of the day 10 10 12 14 16 16 17 18 19 20 21 22 24 24 24 24 25 25 25 25 25 26 26 29 30 31 31 32 4.0 4.1 4.2 MAINTENANCE Daily maintenance Routine maintenance Page 2/52 33 33 33 5.0 QUALITY CONTROL QC New Control Modify Control Delete Control Exec a QC statistics 34 35 36 37 38 A REMOTE HOST A.1 Setting Remote Host Info A.2 Start – Selecting data from Remote Host A.3 Sending data to the Remote Host A.4 Send Database Items to Remote Host 40 40 41 42 43 B VETERINARY SCIENCE MANAGEMENT B.1 Configuring species B.2 Managing species 44 44 46 C 5.1 5.2 5.3 5.4 TROUBLESHOOTING REMOTE HOST INTERFACE SPECS Page 3/52 47 50 1.0 DESCRIPTION OF THE INSTRUMENT ELEPHOR 24Sis able to perform the electrophoretic procedures of the following clinical tests automatically: - Serum proteins - Haemoglobins - Lipo proteins - Urinary proteins furthermore additional tests may be created and customized, such as Serum protein multifractionation. ELEPHOR 24S uses supported cellulose acetate strips which are managed completely automatically. Simply insert them in the appropriate slots and tell the machine which strips to use. The patient archive is stored on an external computer (HOST) connected to the machine through a standard USB cable. The number of patients which can be stored in the archive (never less than 100,000 in any case) therefore depends on the capacity of computer's magnetic storage medium (HARD DISK). 1.1 STANDARD COMPONENTS ELEPHOR 24S comes complete with the following standard components: Eight-thin plate serum applicators for MICRO methods 24-place sampler (3 supports x 8 samples) 3 supports for cellulose acetate strips 1 reagent tank with two compartments for automatic reagent handling Usb cable Power cord Destainer, washing and waste tank connection tube (external diameter = 5 mm; internal diameter = 3 mm) One reagent tank (buffer) Manuals ELEPHOR 24Ssoftware CD-ROM Page 4/52 1.2 1.3 TECHNICAL CHARACTERISTICS Power supply voltage: 220 V 50Hz Power consumption: 250 W max Automatic reagent loading and handling Sample refrigeration by a Peltier cell Reagent (buffer and stain) recycling upon job completion Fluid circuit washing routine upon job completion Electrophoresis power supply unit with voltage (100V-300V ) and current regulation (7mA-30mA) Pneumatic support handling Operating capacity of 16 tests per hour Measurement with non cleared supports Dimensions (WxHxP): 56x46x54 cm Weight : 30 Kg HOST COMPUTER REQUIREMENTS The minimum configuration for correctly interfacing with the ELEPHOR 24Ssystem is: 700 MHz PENTIUM III PC (or equivalent) 128MB RAM 1.2 Gbyte hard disk 800x600 resolution 65000 colour video adapter 15” monitor 2X CD-ROM drive Windows XP SP1 operating system Recommended configuration: 1200 MHz PENTIUM III PC 256MB RAM 1.2 Gbyte hard disk or better 800x600 resolution 16 million colours video adapter 17” monitor 2X CD-ROM drive or better Windows XP SP3 operating system or better About 30MByte of free space is needed on the hard disk for installation. The remaining space may be used for the patient archive until full. Note : to avoid visual artifacts set Windows ® Desktop theme in “Windows classic” mode and set numeric format in “0.00” notation using ‘.’ (dot) as decimal separator. Page 5/52 1.4 INSTALLATION The instrument must be placed on a perfectly flat surface in a room with a temperature of between 15°C and 30°C and humidity of 40/80% max. Make sure the ventilation slits are not obstructed and leave at least 10 cm of space behind the back panel. Remove the lock screw from the mechanical arm before use Connect the USB cable provided to 'USB' connector on the left panel of the instrument (fig. 1.4.1) and connect the other end to the computer USB hub RESET Button Power Plug USB I Main Power Switch Link to P.C. USB O fig. 1.4.1 Connect the power cord to the Power Plug Connect the five connectors on the back of the instrument (fig. 1.4.2) using the tube provided (1) (2) (3) (4) (5) Where : (1) =stainer tank, (2) = destainer tank, (3) = buffer tank, (4) = washing solution tank and (5) waste tank Page 6/52 2.0 TURNING ON To turn the instrument on press the power switch on the left panel of the device; the system starts to move back to the home position. Note: during the first activation, be sure to remove the lock screw from the mechanical arm ! Page 7/52 INSTRUMENT PREPARATION 2.1 Before starting an electrophoresis process, prepare the electrophoretic chamber in the following way: 1 2 3 4 5 Pull the electrophoretic chamber out from its slot by the sides Place the two floats in the electrophoretic chamber and fasten them using the support with holes provided Fill the two compartments with 150 ml of buffer solution until the compartment level reaches the reference line; level off the quantity between the two compartments. Put the electrophoretic chamber back into its slot and push home. Pull out the sampler and pipette 25-30 l of sample into each well (1) fig. 2.1.1 (3) (1) (2) Fig . 2.1.1 6 7 Fill the depositor washing compartment (2) with 1 ml of bidistilled water Insert the special strip of absorbent paper in the compartment (3) in position E on the treatment rack 8 Put the sampler back in place and push home 9 Place the applicator on the support plate in position D (Fig. 2.1.2) 10 Place the supports to be prepared on the support plate (1-3 in Fig. 2.1.2) 11 Run the ELEPHOR 24Ssoftware to start the operating cycle. Fig . 2. 1. 2 Page 8/52 2.2 ELEPHOR 24S MANAGEMENT SOFTWARE START-UP Turn the computer on and let the operating system (Windows 9x) start up When the Windows Desktop appears (fig 2.2.1), click the start button and choose ELEPHOR 24Sfrom the menu, or point the mouse at the ELEPHOR 24Sicon on the Windows Desktop and double-click. Note : to avoid visuals artifacts set Windows ® Desktop theme in “Windows classic” mode. ELEPHOR 24P ELEPHOR 24P Follow the instructions in section 3.2 to start working. Page 9/52 ‘ELEPHOR 24S’ MANAGEMENT SOFTWARE 3.0 The Management Software provided with the ELEPHOR 24S analyser allows electrophoresis traces to be selected, customized, corrected, stored and printed through an intuitive hierarchical organization. Every function or group of functions is brought together on a single screen, which can be selected from the main panel by simply clicking the corresponding button 3.1 MAIN PANEL (1) (1) (2) (3) (4) (5) (6) (7) (2) (3) (4) (5) Archive Management Button Patient List Button Start Button Graph Display Button Configuration Button Print Management Button Quality Control Button Page 10/52 (6) (7) 3.2STARTING WORK Before starting a “work routine” you must Log in into the software (default user name ADMIN with password admin) and choose the type of test and the number of supports the sample to be analysed is to be deposited on. The position of the support corresponds to the position of the samples contained in the sample holding base. To select a test and the samples to prepare and/or measure, carry out the following procedure on the Management Software (hereinafter referred to as MS) main screen: point the mouse at the “Start” button and left-click: Page 11/52 the following screen appears: the screen is split into two areas. The left part shows the sample grid (seen from above) and the right consists of buttons for the methods and functions which may be carried out (support preparation, support measurement or both). The sample grid is arranged in rows from top to bottom. Therefore row 1 corresponds to support 1, row 2 to support 2, etc.; the position of the first sample in each row is indicated by a yellow dot. Therefore by selecting a row from the sample base, you also select the position of the support to be used: All you have to do after that is select the type of test required by clicking the corresponding button. Note that by default the MS is set for support preparation and its subsequent measurement (the two checkboxes are selected). Therefore, if you only wish to do one of the two functions, deselect the option concerned by pointing the mouse at the checkbox and left-clicking (the box is no longer selected): Page 12/52 Once the supports/samples to be used and the test to be performed have been selected a button marked “Start” appears: By clicking this button, the chosen process starts and a status screen appears which shows the progress of the various stages of the method for each support, as well as data regarding certain parts of ELEPHOR 24S (migration voltage and current) and the levels of the reagents in the tanks. Note: it is advisable to wait until ELEPHOR 24S has carried out all the initialization operations before leaving the MS workstation unmanned (if necessary) since error messages may appear which must be corrected by the operator so that the processes may be restarted correctly. One typical error which may occur is insufficient reagent in the storage tank. In the case of a method with automatic reagent level handling, this results in failure to reach the operating level and leads to the corresponding error message. Once the ELEPHOR 24S has started up correctly, the MS workstation may be left unmanned. In order to correct an error, the operator must fill the corresponding reagent storage tank, click the “Continue” button on the error screen, and click the “Start” button on the main screen again. Note: button named “Remote Host” will be explained into appendix A Page 13/52 3.3 PATIENT LISTS This button opens a screen with information relating to the patients to be tested. Up to 24 patients may be managed at a time (8 patients x 3 supports) plus eight other patients which may be retrieved from the archive using search functions. PATIENT LISTS - PATIENT ARCHIVE The "PATIENT ARCHIVE" menu contains the data relating to the support selected from the archive. The patient's data (name, surname, age, etc.) and total proteins value may be edited. The "SHOW" button displays the graphs which correspond to the selected support. Any corrections or changes to the traces displayed may be made on this screen. Page 14/52 PATIENT LISTS - CURRENT DATA Select "CURRENT DATA" from the "PATIENT MANAGEMENT" menu to input the patient data corresponding to the pherogram to be measured. Once this function is chosen, the set of selected supports appears and it is possible to input patient data for all the supports displayed. Simply type the surname, name, sex, sampling date (the default is always the current data), patient ID, total proteins and department into the Patient Data table The Q.C. field is used to select a previously defined Control. Page 15/52 3.4ARCHIVE MANAGEMENT This screen provides complete control over the report archive. Patients may be searched for by name or by storage date, reports which have not yet been stored or edited may be saved, and data may be backed up on removable media or deleted. ARCHIVE MANAGEMENT - STORE Select "STORE" from the "ARCHIVE MANAGEMENT" menu to save the supports measured along with the corresponding patient data in the archive. When this option is selected, all valid supports are selected for storage. Deselect any supports you do not wish to save by left-clicking beside them. Once selection/deselection is complete, click "DONE" to start saving the graphs in the archive. Page 16/52 ARCHIVE MANAGEMENT - SEARCH BY DATE Select "SEARCH BY DATE" from the "ARCHIVE MANAGEMENT" menu to search for a support in the archive by its storage date. Select the year, then the month then the day concerned: a list of supports stored on the date input appears. Scroll through the list to find the support required. Once selected, click "DONE" to load the support. The patient data for the chosen support may be displayed by choosing "PATIENT ARCHIVE" from the "PATIENT LISTS" menu. Page 17/52 ARCHIVE MANAGEMENT - SEARCH BY NAME Select "SEARCH BY NAME" from the "ARCHIVE MANAGEMENT" menu to search for a support in the archive by the patient's name, the patient's exam or id code (any combination is valid). Type the patient's name into the appropriate field to start searching: the result is highlighted in blue. Left-click the result to select the patient found along with the types of tests concerned and their storage date and press Confirm to display it. The patient data relating to the graph and support selected may be displayed by choosing "PATIENT ARCHIVE" from the "PATIENT LISTS" menu. Page 18/52 ARCHIVE MANAGEMENT - BACKUP It is advisable to save the archive data periodically on a floppy disk or backup unit (for example IOMEGA ZIP). Select "BACKUP" from the "ARCHIVE MANAGEMENT" menu to save all or part of the data archive. In order to make a backup: 1. Select the backup unit (floppy disk drive A: by default) 2. Select the type of backup Whole Database (default) One particular year only One particular month only. Then input the year and/or month to be saved. Once done, click the DONE button to save the data on the backup media selected (for example floppy disk A:) In the case of floppy disks, the backup procedure may require more than one disk; it is advisable to number each disk used during the procedure. The last disk must be labelled "Restore Disk" and may be used to restore the data saved if necessary. Page 19/52 ARCHIVE MANAGEMENT - RESTORE Select "RESTORE" from the "ARCHIVE MANAGEMENT” menu to restore data previously stored on BACKUP media to the archive. In order to restore data: 1. 2. Select the backup unit (floppy disk drive A: by default) Select what to restore Whole archive (default) One particular year only One particular month only. Then select the year and/or month to be restored and insert the disk labelled "Restore Disk" in the chosen unit (for example floppy drive A:). Once done, click the "DONE" button to start restoring the data. If necessary, insert the other numbered disks in the order in which they are requested. Note: button “Remote Host” will be explained into appendix A. Page 20/52 ARCHIVE MANAGEMENT - DELETION Select "DELETE" from the "ARCHIVE MANAGEMENT" menu to delete all or part of the archive. First of all, select the type of deletion required: Delete Year Delete Month Delete Support. Once the support has been selected, you may also choose to delete only certain graphs. By default all graphs are selected for deletion. To prevent certain graphs from being deleted, deselect them by left-clicking. Page 21/52 3.5 DISPLAY GRAPHS After preparing/measuring a support, its graphs may be displayed. The "DISPLAY " menu shows a list of available supports (prepared and measured). By selecting a support with the mouse, a preview appears where it is possible to display the contents of the whole support and immediately see if any errors have occurred during the preparation and measurement stages. In order to leave the preview of the entire support and display the individual graphs for editing or correcting, simply click the mouse on one of the traces displayed. Note: In order to display traces retrieved from the archive, select ‘DISPLAY’ again from the ‘PATIENT LISTS ’ -> ‘PATIENT ARCHIVE’ screen. It is possible to display both the patient data associated with a graph and the percentage values of its individual fractions from the individual graph correction and display menu. Page 22/52 Every graph has a correction menu with icons placed along side it. From the menu it is possible to: Delete a trace area Insert a minimum between two fractions Delete a minimum between two fractions Correct the baseline Calibrate the value of a fraction Highlight a fraction by dividing it Change the fraction label (name) Restore a graph Print a graph Left-click one of the icons on the correction menu to select the type of correction required. Right-click to deselect it. Page 23/52 DELETE TRACE AREAS When this button is clicked, a vertical light blue line appears which may be positioned at the point where the area to be deleted is found using the mouse. A yellow square appears next to the displayed graph showing the optical density (O.D.) of the trace. This parameter changes with the movement of the cursor line. The O.D. is useful when determining the position where deletion is necessary. By left-clicking the first half of the graph, everything between the beginning of the graph and the cursor line is deleted; by left-clicking the latter half of the graph, everything between the cursor line and the end of the graph is deleted. Right-clicking or selecting another button from the correction menu cancels the deletion function. INSERTING MINIMUMS When this button is clicked, a vertical light blue line appears which may be positioned at the point where the minimum is to be inserted using the mouse. A yellow square appears next to the displayed graph showing the optical density (O.D.) of the trace. This parameter changes with the movement of the cursor line. The O.D. is useful when determining the position where the minimum is to be inserted between two graph fractions. Left-click to insert the minimum. Right-clicking or selecting another icon from the correction menu cancels the minimum insertion function. REMOVE MINIMUMS When this button is clicked, a vertical light blue line appears which may be positioned on the minimum to be removed using the mouse. Left-click to remove the selected minimum. Right-clicking or selecting another icon from the correction menu cancels the minimum removal function. A yellow square appears next to the displayed graph showing the optical density (O.D.) of the trace. This parameter changes with the movement of the cursor line. The O.D. is useful when checking the position of a minimum between two graph fractions. EDIT BASELINE This function is useful for correcting supports which have undergone uneven destaining, and therefore have ODs above the baseline value at the beginning or towards the end of the graph. In this case the graph must be corrected so that its beginning and/or end have a uniform O.D. value equal to zero. When this button is clicked, two adjustment bars appear along side the graph which may be used to move the baseline where necessary. Select one of the two bars by left-clicking, and adjust the corresponding cursor either using the cursor keys on the keyboard or by dragging with the mouse (hold the left button pressed). Adjust the other cursor if necessary in the same way. Once cursor adjustment is complete, click the button again and correct the graph baseline obtained by moving the end points of the trace onto the zero O.D. line. CALIBRATION FRACTION The % value of a single measured fraction may be calibrated applying a calibration factor. When this button is pressed a grid of values will be displayed. Set the single calibration factor by changing the value and pressing the ‘Enter’ key to validate it. After you changed the values click on “Confirm” to apply it. Page 24/52 SET FRACTION NAME Click the grid containing the fraction names to display an input box where a new name for the fraction or sub-fraction may be input. INSERT NEW FRACTION Right clicking on the grid containing fraction names it will be displayed an input box where setting a new fraction name and a new (optional) range of values in pct. The new added fraction will be placed where the right mouse button was pressed. HIGHLIGHT FRACTION This function highlights certain fraction characteristics by dividing it into several areas (maximum of 3). In this way precise information may be obtained regarding the concentrations of certain pathological components (e.g. monoclonal peaks). CANCEL CHANGES If you make irreversible mistakes while correcting a graph (for example when correcting its baseline or deleting an area), it is possible to restore the graph as measured. Click this button to restore the graph to its original state. The graph is restored when it is displayed. Once a new support has been displayed, it is no longer possible to go back and restore the original state of a previously displayed graph. PRINT GRAPH Click this button to print the graph displayed. Printing takes place according to the settings made by choosing "VARIOUS" from the "CONFIGURATIONS " menu". Page 25/52 3.6 CONFIGURATIONS - EXAM Select "EXAM" from the "CONFIGURATIONS" menu to configure the parameters for individual tests. The following parameters may be configured on this screen for each test: Test name Number of fractions and their names (max 10) % reference tables g/dl reference table for total proteins Deposition step (MICRO and SEMIMICRO) Number of points to eliminate in the deposition area Migration voltage Migration current Multifractionation technique (serum proteins only) Method operating values Note: you can change the test name in order to rename a pre-defined exam. Page 26/52 A new name is automatically selected for a fraction (or edited) after the name of the fraction itself is written. If the FRACTIONS field is not completed, the fraction itself is not included in the graph minimums calculation. Numerical percentage values are expressed as ##.# (for example 12.7), i.e. with only one decimal place and a decimal point separator. The program beeps if characters or numbers with a different format are typed in. After inputting the min-max % reference table, a congruity test may be carried out by clicking the ‘T’ key found beside the table. Any errors found are automatically highlighted in sequence by a box which appears on the cell(s) containing the incorrect value(s). The min-max total proteins reference values in g/dl together with the min-max % reference table determines the min-max reference table in g/dl for the single fractions; For example: Min. ALBUMIN value in g/dl = Min. g/dl value for TOTAL PROTEINS * Min. % value for ALBUMIN If a SEMI-MICRO deposition step is chosen, only four traces may be selected (choose "CURRENT DATA" from the "PATIENT LISTS" menu). The odd traces are available for measurement, whereas the even ones are automatically defined as NOT VALID. On this screen, you can choose whether to carry out constant voltage or constant current migration for the type of test concerned and set the appropriate value. Clicking the “METHOD” button displays a new screen where the time of operations performed by ELEPHOR 24S may be edited. All times are in seconds, changing these times changes the method and affects the quality of the traces produced. The default method parameters are a good compromise between process speed and result quality. It is therefore unadvisable to change these settings unless you are fully aware of what you are doing. Page 27/52 Parameters modification related to tracks editing are shown on this screen: Application Line : by decreasing this value more points at the end of the track will be displayed. ( needs membrane re-scanning ) Filter Calibrator : allows to change the filter parameter used by the instrument to compensate variation density of the acetate membrane (default value is 23). Change of this parameter is password protected ( PW : device ) and should be performed only by authorized technical service personnel . It is higly reccomended not to modify this parameter unless to be able to prove its correctness by means of a proper serum calibrator. Calibration Factors : allows to set a calibration factor for each fraction defined into the exam Page 28/52 CONFIGURATIONS - VARIOUS Select the "VARIOUS" button from the "CONFIGURATIONS" menu to edit the printing and instrument connection parameters. REPORT PRINTOUT CONFIGURATION PARAMETERS "PAGE HEADER": this is the space reserved for the header of the printed report, it’s possible to modify font, size and text formatting. "Notes at Bottom of Page": this space is used to print fixed text at the bottom of values "Additional Line at the Bottom Of Page": a single line can be typed in which is printed under the footnotes with the same layout as used when writing. "Print Report in Colour": it is possible to choose either a colour or black and white trace printout. This selection only refers to the trace printout. Depositions are normally printed in red. "Mark Values out of Range": this option prints any fraction values which are out of the normal range in bold. "Kit Management": it’s reserved for analyzers with smart card reader. Page 29/52 CONFIGURATIONS - REAGENTS It’s not a real configuration, but it offers a way to manage some operations on Reagents individually (Fill, Flush, Recycle). In this screen it is also possible to Recycle all Reagents (Recycle button) or to Recycle Reagents and Clean Sides (Recycle + Clean button). VERY IMPORTANT NOTE: YOU MUST BE SURE THAT ALL CONNECTORS OF SIDES ARE PLUGGED IN ! ANYWAY IT MAY RESULT IN DAMAGES TO THE CIRCUIT OF REAGENTS. Page 30/52 3.7 PRINTING The whole printing process may be set up in one place on this screen, where the graphs to be included in the report may be selected. PRINT - PATIENT ARCHIVE Select "PATIENT ARCHIVE" from the "PRINT" menu to print the support selected from the patient archive. When this option is selected, all the valid graphs for the support are selected for printing. Graphs may be deselected by left-clicking beside the traces which you do not wish to print. Once selection is complete, click "DONE" to start printing. Printing may be interrupted at any time by clicking the "CANCEL PRINT" button on the top right of the screen. Page 31/52 PRINT - CURRENT DATA Select "CURRENT DATA" from the "PRINT" menu to print the supports produced during the operating cycle. When this option is selected, all valid supports and graphs are selected for printing. Supports and/or graphs may be deselected by left-clicking beside the supports or graphs you do not wish to print. Once deselection is complete, click "DONE" to start printing the graphs. Printing may be interrupted at any time by clicking the "CANCEL PRINT" button on the top right of the screen. Page 32/52 4.0 MAINTENANCE 4.1 DAILY MAINTENANCE At the end of each work session, it is advisable to carry out the following cleaning operations: Wash the serum plate under running water and dry with absorbent paper Empty the electrophoretic chamber and recycle the buffer; remove the floats from their housings, rinse them with deionized water and leave them to dry. Remove the acetate supports from the strip racks. Clear the depositor by a soft bristle brush. 4.2 ROUTINE MAINTENANCE It is advisable to wash the following parts more carefully at regular intervals: Migration chamber: fill the chamber, fill it with distilled water and leave it for an hour Clear the buffer side: Remove the buffer tank and put a tank with a 10% hypochlorite solution. From the Reagents Menu, click on the buffer 'Fill' button and after a couple of seconds press the 'Recycle' button. Immerse the serum plate in 10% hypochlorite solution for an hour and rinse with distilled water. Page 33/52 5.0 QUALITY CONTROL Here must be defined all Samples used for control purpose. It’s possible define one or more samples for each exam indicating the average value attended for every fraction. When a Control is defined it’s possible to select it by the Q.C. dropdown menu into the “List of Patient” screen. Page 34/52 5.1 NEW CONTROL The first thing to do to properly use the QC management is to select the type of exam from the dropdown "Exam:" In this menu we offer exams currently configured in the software, click the mouse on the exam for which you want to make a QC or where you want to add a new control. By default the software comes with no parameters related 'standard' samples, as this is made by "known sample" for the laboratory or using special kits. First create a control sample pressing the button "New Control": after selecting the exam by the drop-down menu and fill in the text box “Control” with the name that identify that caontrol. Fill in the bottom grid from left to right with the theoretical values of the control and click on “Confirm”. Page 35/52 5.2 MODIFING CONTROL DATA Once you create the control is always possible to change the values expected in the following way: Select the exam From the control box, select the name of the control to change Once you pop the grid values, select the "Edit" button and proceed to the modification of values in the grid Click on “Confirm” to store the modified data. Page 36/52 5.3 DELETING A CONTROL To delete a control from the list of available controls, select the Exam and the control name as done in the previous paragraph,once the pop-up screen: Click on “Delete Control” and press “Confirm” to submit the operation. Page 37/52 5.4 EXECUTION OF A QC STATISTICS To perform a useful statistical QC for a monthly or annual review and select the control you want to make statistics and press "Search": It will appear a box with a list of all the years of work in which the reference control was used, clicking the right mouse button on the year with a series of options appear: Run QC: QC statistics starts and displays the result Delete: delete the selected item (Year / Month) from the QC Abort: Closes the menu If the entry for the year you left click mouse, a screen appears containing the list of months, the year selected, which was used as the reference standard. Page 38/52 Now right-click mouse menu appears as described above from which to start statistics on the option with the click left button: The screen displays the average values for each reference sample, relative to the day of the month in which it was performed for each portion of the examination in which the QC will appear: Reference value Median Variance Diversion CV% The total number of points on which it is performed to Statistical Values of samples are shown on the graph in the range of confidence-2s, +2 s that is in the range of 2 times the standard deviation. Pressing the button press produces printed copy of the QC for all these villages, regardless of the currently displayed. Page 39/52 APPENDX A REMOTE HOST ELEPHOR 24Ssoftware is capable of exchange data with a remote host in order to manage exams Work list automatically. A.1 SETTING REMOTE HOST INFO Pressing the "REMOTE HOST" button you’ll be able to indicate where remote host data are located. You must first indicate the name of input file without extension (this file contains the work lists) after this you can use the browse button “…” to locate your file folder. The same is for the output file (this file contains the results of exams). Page 40/52 A.2 START – SELECTING DATA FROM REMOTE HOST In order to select data from a remote host you must: Press the button "START" from the main screen of program Press the button "REMOTE HOST" Now you’ll see all available exams queued and for each exam the work list. Selections are possible into the right box clicking on the little box on the left of the patient name by the left button of the mouse. Press the right button to select all patient listed into the box. When you have selected some patients press the “Select Items” button to add this selection to the sample grid. Note: you can select only a single exam list per operative cycle. Pressing the button "Delete All Selections" all elements selected for that exam will be deselected, pressing the button "Delete Last Selection" the last elements queued are deselected. To obtain a printed work list press the button "Print All Selections". Page 41/52 A.3 SENDING DATA TO THE REMOTE HOST To send the results of an exam to the remote host you must: Press the button Start from the main screen an then select "REMOTE HOST" Press thebutton "Items To Send" Select items into the box Press the button "Send Items" It’s also possible to send data from the local database to the remote host (see next session). Page 42/52 A.4 SEND DATABASE ITEMS TO REMOTE HOST To send Database items to a remote host you must: Select the button "Database" from the main screen Press the button "Remote Host" Search the items to send using the name, exam and data filter Select items you want to send Press the button "Send" Page 43/52 APPENDIX B VETERINARY SCIENCE MANAGEMENT This appendix describe program items to manage animal species, by using a dedicated software program. ( version 'V' ) All things described for the standard version are valid too. B.1 CONFIGURING SPECIES Using the "Settings" window you can create for each exam one or more species with a particular range of normal values and a particular number of fractions(max 10 fractions). Note: Veterinary program version doesn't allow the creation of a user defined exam. Pressing the button "SPECIES" will appear a drop-down menu where you can: 1. Create a new species 2. Select a species 3. Delete a species You can create a species by pressing the button "SPECIES" and choosing "Create Species", it will be created a new table of normal ranges and a new label where you can input the name of the created species. Page 44/52 To delete a species press the button "SPECIES" and choose "Delete Species", it will appear the list of species available where you can select the item to delete. Note : the default species cannot be deleted, but can only be modified in all its parts. Page 45/52 B.2 MANAGING SPECIES Species management can be done for each sample by selecting the appropriate species item into the "Work Lists" window. Where not stated, default species parameters are used. Samples recalled from the database not allow species to be changed. To change a species on a sample click on the drop-down list button into the field "SPECIES" and select the species you want. To change the species all eight samples in one pass click on the button "SPECIES" and make your selection. Page 46/52 APPENDIX C TROUBLESHOOTING Problem Probable cause Solution The analyzer is turned off Turn on the analyzer The analyzer is on and the Busy indicator Reset the analyzer by pressing the Reset on the status window is active button and re-run the software USB cable is not connected to the P.C. Control the connection of the cable between correctly the analyzer and the P.C. host 1 Analyzer not linked to the P.C. Host 2 Serum sample is not in appropriate quantity or it is not uniformly dispensed in the serum Samples are not applied correctly on plate the acetate plate Tips of applicator are not independed the one from the others Damaged applicator tips Insufficient migration current 3 Remove the serum samples from the plate and re-add, well distributed, a sufficient quantity (25 microliters each) Clean the applicator assuring the indipendent moving of each tip Replace damaged tips with new one Acetate membrane is too wet before the Increase the drying 1 time on the method application of samples parameters configuration (up to 120 sec.); increase the application time (up to 25 sec.) One or both wicks are glided down respect Replace the wicks assuring the correct their correct position position Insufficient buffer solution level in the Refill the buffer solution in both sides of the electrophoretic chamber chamber, up to reach the contact with the wicks (total buffer volume: 150 ml, equally distributed in the sides of the electrophoretic chamber) Acetate membrane is bad mounted on the Assure the correct mounting of the plastic frame membrane on the plastic frame Page 47/52 4 5 Problem Probable cause Soluzione Too high migration current (over 10 Wrong dilution of the buffer (too much Replace the buffer solution correctly diluted mA) concentrated) (1:10) (Migration at constant voltage) Acetate membrane too much wet before Increase the drying time 1 in the method migration parameter configuration (up to 120 sec.) Too high migration voltage (over 250 Too dry acetate membrane Decrease the drying 1 time on the method volts) parameters configuration (up to 30 sec.); (Migration at constant current) One or both wicks are glided down respect Replace the wicks assuring the correct their correct position position Distortion on migrations 6 7 One or both wicks are glided down respect Replace the wicks assuring the correct their correct position position Too high buffer solution level in the Recheck the buffer solution level in both electrophoretic chamber sides of the chamber, up to reach the contact with the wicks (total buffer volume: 150 ml, equally distributed in the sides of the electrophoretic chamber) Acetate membrane is too wet before the Increase the drying 1 time on the method migration parameters configuration (up to 120 sec.) Insufficient staining of the fractions Exhsausted staining solution (too low alpha1 fraction) Destaining solution too diluted Too low quantity of samples in the wells 8 Replace the staining solution Replace the destaining solution with well diluted one (dilution is = 1:20) Remove the serum samples from the plate and re-add, a sufficient quantity (25 microliters each) , well distributed Inhomogeneous destaining of the Destaining tank empty during the analytical Check, before the startup of the machine, acetate membrane background cycle the presence of enough destaining solution in the external tank (for a complete cycle of 3 membrane, the minimum quantity of 500 ml is required) Page 48/52 9 10 Truncation of the gamma fraction in Back migration of the gamma zone fraction Decrease, in the params configuration, the the graph during the migration deposition line value (up to 130) and re-scan the membrane (before to re-scan, please assure the complete drying of the membrane Gamma fraction is moving forward Too high migration Tension/Currente at See points 4 and 5 respect the application point the startup Page 49/52 REMOTE HOST INTERFACE SPECS Remote Host Specifications The data relating to a test and to the patient related thereto are sent by a remote computer (host) by sending a text file to the NetDir folder of ELEPHOR 24S management program, located on the local PC connected to the instrument. The coding of the data contained in such file will be explained later in this section. Requirements: in order to properly interface ELEPHOR 24S analyser with a remote host, first you have to network the PC (by a LAN network, serial connection, etc…) physically connected to the analyser and the remote host. Such operation does not need the information provided herein and is pertaining exclusively to the final user and/or the host program providers. Interfacing the two computers requires the compliance with the standard rules of LAN connections or other management specifications allowing text file exchange and folder sharing by two or more computers (please note that if you have computers running under Windows 2000/XP or Linux, you may need to configurate the user accounts with administrator rights). In general, you just need to share the NetDir folder of the computer the analyser is connected to and a folder of the computer the host is part of, such folder will be indicated in the ELEPHOR 24Snet program configurations. Coding of acceptance data: Acceptance takes place through a text file in the NetDir folder sent by the remote computer, such file will have a fixed name followed by the extension “.txt”, typical of text files. (Eg.: Acceptance.txt) The acceptance/host software shall take exclusive care of the removal of such file from the NetDir folder, the updating of the data contained therein shall be made concurrently by the two software (ELEPHOR 24S and the host program), consequently we recommend the use of methods allowing to synchronise the file access by the acceptance/host software. Acceptance file data format : The acceptance file is an unformatted text file the lines of which are the acceptance data of an individual test in the following form: <Name>,<age>,<gender>,<date>,<Idcode>,<TP>,<department>,<Testcode>,<Acceptedflag>,<Sen tflag><CR><NL> The following rules are applicable: - Each line consists of a set of 10 (ten) string type fields separated by a comma - Each line ends with a character <CR> (Carriage Return) and a character <NL> (New Line) - Each field must be indicated, for the fields that are not desired just key in a character <SP> (SPace) and maintain the correct sequence as above specified. Field meaning: <Name>=Name of the Patient the test is relating to (max 30 characters) <age>=age (max 3 characters) <gender>=gender (1 character M/F) <date>=date related to the test in dd/mm/yy format (this field must be compulsory) <Idcode>=patient identity code (max 9 characters) <TotalProteins>=float type value, format 0.00 accounting for total proteins <department>=name of relevant department (max 25 characters) Page 50/52 <Testcode>=test code (1=Seroproteins,2=Haemoglobins,3=Lipoproteins). This field is COMPULSORY. <Acceptedflag>=boolean flag indicating the occurred acceptance of the test relating to that patient. It is set at <F> (False) by the host the last time the file is sent and is modified into <T> (True) by ELEPHOR 24S software when such patient is accepted. <Sentflag>=boolean flag indicating the occurred dispatch by ELEPHOR 24S software of the report data relating to that patient. It is set at <F> (False) by the host the first time the acceptance file is sent and is modified into <T> (True) by ELEPHOR 24S software when the report data are sent. Typical line examples of an acceptance file, please note that the use of characters <> is only the result of an agreement in order to highlight the used fields and characters, they are not shown in the text file: Acceptance of Seroproteins MARIO ROSSI,33,M,15/09/02,0001,6.0,HAEMATOLOGY,1,F,F<CR><NL> when the test is accepted the line becomes: MARIO ROSSI,33,M,15/09/02,0001,6.0,HAEMATOLOGY,1,T,F<CR><NL> when the test is sent to the remote host, the line becomes: MARIO ROSSI,33,M,15/09/02,0001,6.0,HAEMATOLOGY,1,T,T<CR><NL> Now, the report data of the patient MARIO ROSSI are available and the remote host may retrieve them from the report file. For partial acceptance, for example, with no information about age, gender, Total Proteins and department you would obtain the following: MARIO ROSSI,<SP>,<SP>,15/09/02,0001,<SP>,<SP>,1,F,F<CR><NL> When the field <Sentflag> becomes <T> the data have been keyed in the report file and may be decoded and processed by the host. Page 51/52 Report file specifications The report file is organised very similarly to the acceptance file: an unformatted text file containing the patient’s data and the report data including the scan data. Individual report line data format: <Name>,<age>,<gender>,<data>,<Idcode>,<TP>,<department>,<Testcode>,<Acceptedflag>,<Sen tflag>,<Testname>,<RefMinPT>,<RefMaxPT>, <NumRef>,<RefMinPct1>,…,<RefMinPct NumRef>,<RefMaxPct1>,…,<RefMaxPct NumRef>, <NumVal>,<ValPct 1>,…,<ValPct NumVal>, <Label1>,…,<Label NumVal>, <NumMarks>,<Mark 1>,…,<Mark NumMarks>, <NumPoints>,<Point1>,…,<Point numPoints><CR><NL> The same rules of the acceptance file are applicable and the initial fields are identical to those of the acceptance file. Now let us examine the report specific fields: <Testname>=string indicating the test name as it is shown on the analyser <RefMinPT>=float string type min reference value for Total Proteins in g/dL (format 0.00) <RefMaxPT>=float string type max reference value for Total Proteins in g/dL (format 0.00) <NumRef>=this value indicates the number of elements forming the test reference table, followed by NumRef values being the percentage minimum reference values, followed by NumRef values being the percentage maximum reference values. All values of reference tables are of float string type in format 0.0, so following the <NumRef> field there will be 2*NumRef values forming the percentage reference tables. To retrieve the reference tables expressed in g/dL use the parameters RefMinPT and RefMaxPT with the percentage Min/Max reference tables. <NumVal>=Number of elements forming the table of the read concentration values, such value takes also into account a fraction partitioning values. Then there area NumVal values being the percentage concentration values. All concentration values are of float string type, format 0.0 These are followed by NumVal strings <Label1>,…,<Label NumVal> representing the names of fractions and partitioning; please consider that the partitioning names are always preceded by a character <@> (at). In order to obtain the concentration values expressed in g/dL use the TP value (if available) and the percentage concentration values. <NumMarks>=Number of elements being fraction marks, followed by NumMarks values of full type representing the abscissa where the fraction marks are shown, such values are associated with the scan data values <NumPoints>=Number of points being the scan, followed by NumPoints values of full type being the scan curve. The report file name reflects the rules of the acceptance file, it will be of ‘Report.txt’ type. The host management program takes care of the removal of such file from the folder. Page 52/52