1
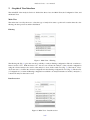
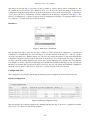
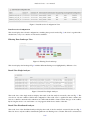
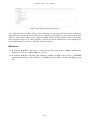
Analysis Service - user manual
version 0.2.0 - 13 December 2013
http://www.posecco.eu
Analysis Service - user manual
Contents
1
2
Introduction
2
Intra-Policy . . . . . . . . . . . . . . . . . . . . . . . . . . . . . . . . . . . . . . . . . . . . . . .
2
Inter-Policy . . . . . . . . . . . . . . . . . . . . . . . . . . . . . . . . . . . . . . . . . . . . . . .
2
Graphical User Interface
3
Main View . . . . . . . . . . . . . . . . . . . . . . . . . . . . . . . . . . . . . . . . . . . . . . . .
3
Filtering . . . . . . . . . . . . . . . . . . . . . . . . . . . . . . . . . . . . . . . . . . . . . .
3
Data Protection . . . . . . . . . . . . . . . . . . . . . . . . . . . . . . . . . . . . . . . . . .
3
Distributed . . . . . . . . . . . . . . . . . . . . . . . . . . . . . . . . . . . . . . . . . . . .
4
Configuration View . . . . . . . . . . . . . . . . . . . . . . . . . . . . . . . . . . . . . . . . . . .
4
Filtering Configuration . . . . . . . . . . . . . . . . . . . . . . . . . . . . . . . . . . . . . .
4
Data Protection Configuration . . . . . . . . . . . . . . . . . . . . . . . . . . . . . . . . . .
5
Filtering Zone Landscape View . . . . . . . . . . . . . . . . . . . . . . . . . . . . . . . . . . . . .
5
Result View Single Analyser . . . . . . . . . . . . . . . . . . . . . . . . . . . . . . . . . . . . . .
5
Result View Distributed Analyser . . . . . . . . . . . . . . . . . . . . . . . . . . . . . . . . . . . .
5
1/6
Analysis Service - user manual
1
Introduction
The role of this document is to provide an overview on how to use the Analysis Service implementation.
The Analysis Service allows the user to perform a intra-policy and inter-policy analysis of filtering and data
protection configurations. Filtering and data protection configurations are defined in “D3.3 Configuration MetaModel”.
Intra-Policy
Intra-Policy analysis is performed on one single filtering or data protection configuration. The Analysis Service
Implementation handles intra-policy analysis of filtering and data protection configurations separately and also
presents them in that way. The Analysis Service Implementation can identify the following intra-policy anomalies: shadowing anomaly, correlation anomaly, generalization anomaly, redundancy anomaly, and irrelevance
anomaly.
Given two rules r1 and r2 where r1 is the highest priority rule, the rule-pair anomalies are:
shadowing anomaly : r2 is shadowed when r1 matches all the packets that r2 matches, so that r2 will never
be activated;
correlation anomaly : r1 and r2 are correlated if they enforce different actions and there exists some packet
matching both r1 and r2 and there exists some packet matching r1 but not r2 and vice versa;
generalization anomaly : r2 is a generalization of r1 if they enforce different actions and all the packets
matching r1 also match r2 , but not the contrary;
redundancy anomaly : r2 is redundant if r1 matches the same packets and enforces the same action as r2 , so
the removal of r2 will not change the policy behaviour;
irrelevance anomaly : a rule is irrelevant if does not match any packet that could pass trough the firewall. It
does not concern relations between rules, rather between a rule and the enforcing device.
Inter-Policy
Inter-Policy analysis nominated by the Analysis Service implementation as “distributed” is performed on all
policy (filtering and data protection) between two filtering zones. The analysis takes also in consideration
potential address translations introduced by NAT/NAPT and IPsec tunnels. The distributed analysis serves to
verify what happens to packets exchanged between these zones, that is, if packets are allowed or deny.
The analyser searches for serial and parallel anomalies, serial anomalies are found on one single path between
two security devices where parallel anomalies are found by comparing the applied actions in multiple paths.
Moreover, the distributed model supports IPsec policies using transport mode actions and classifies all the types
of IPsec anomalies identified in literature [1], [2].
Serial conflicts include shadowing anomaly, the spuriousness anomaly, the redundancy anomaly and the correlation anomaly. A shadowing anomaly occurs if an upstream firewall blocks the network traffic accepted by a
downstream firewall. A spuriousness anomaly occurs if an upstream firewall permits the network traffic denied
by a downstream firewall. A redundancy anomaly occurs if a downstream firewall denies the network traffic
already blocked by an upstream firewall. A correlation anomaly occurs as a result of having two correlated rules
in the upstream and downstream firewalls. There exists only one parallel anomaly which is when the applied
filtering actions is not the same one all paths between to policies.
IPsec anomalies include overlapping conflict and weak-protection conflict, this kind of anomalies can be found
between rules of one single policy or of a distributed policy. Overlapping conflict exists if two tunnel-mode
tunnels overlaps or the first is transport-mode tunnel and the second is tunnel-mode tunnel and the rule which
sends the packet to the nearer device takes priority of the rule which sends the packet to the farther device.
Weak-protection conflict exists if ESP transport mode applies over AH transport mode or AH transport mode
applies over ESP tunnel mode.
2/6
Analysis Service - user manual
2
Graphical User Interface
The main GUI of the Analysis Service is divided into three views: the Main View, the Configuration View, and
the Result View.
Main View
The main view is used by the user to select the type of analysis he wants to perform. It contains three tabs: the
filtering, the data protection, and the distributed.
Filtering
Figure 1: Main View - Filtering
The filtering tab (Fig. 1) gives the user the possibility to analyse filtering configuration. The tab contains two
buttons and two lists. With the button “Go” the user can execute the analysis of the selected configuration
using the selected analyser, the result of the analysis is show in the result view (Fig. 7). The button “View”
allows the user to visualize the selected configuration in the filtering configuration view (Fig. 4). The first list
(“Configurations”) contains all filtering configurations available to be analysed and the second list (“Analysers”)
contains all analysers that can be used.
Data Protection
Figure 2: Main View - Data Protection
3/6
Analysis Service - user manual
The data protection tab (Fig. 2) gives the user the possibility to analyse data protection configurations. The
tab contains two buttons and two lists. With the button “Go” the user can execute the analysis of the selected
configuration using the selected analyser, the result of the analysis is show in the result view (Fig. 7). The button
“View” allows the user to visualize the selected configuration in the filtering configuration view (Fig. 4). The
first list (“Configurations”) contains all data protection configurations available to be analysed and the second
list (“analysers”) contains all analysers that can be used.
Distributed
Figure 3: Main View - Distributed
The distributed tab (Fig. 3) gives the uses the possibility to analyse distributed configurations. A distributed
configuration is identified by the source filtering zone and the destination filtering zone. The tab contains
one button and three lists. With the button “Go” the user can execute the analysis of the selected distributed
configuration using the selected analyser, the result of the analysis is show in the result view (Fig. 7). The first
two lists contain all available filtering zones, the fist list (“Source FilteringZone”) identifies the source filtering
zone and the second list (“Destination FilteringZone”) identifies the destination filtering zone. By selecting one
filtering zone from the first list and one from the second one, the user can specify the distributed configuration
which he wants to analyse. The last list (“analysers”) contains all analysers that can be used.
Configuration View
The configuration view displays the filtering and data protection configuration selected in the main view.
Filtering Configuration
Figure 4: Filtering Configuration View
This view displays the selected configuration containing filtering rules Fig. 4, the view is organized in a tabular
form, every row contains one rule and its attributes.
4/6
Analysis Service - user manual
Figure 5: Data Protection Configuration View
Data Protection Configuration
This view displays the selected configuration containing data protection rules Fig. 5, the view is organized in a
tabular form, every row contains one rule and its attributes.
Filtering Zone Landscape View
Figure 6: Filtering Zone Landscape
This view displays the landscape Fig. 6 with the different filtering zones highlighted by different colors.
Result View Single Analyser
Figure 7: Result View Single Analyser
The result view of the single analyser displays the result of the last analysis executed by the user Fig. 7. The
view shows only the conflicts found in the configuration. The result view is organized in three columns, the
first two columns contain the rules which are in conflict and the third column contains the type of the conflict.
By moving the mouse over a rule name a tool-tip appears which shows details of the rule.
Result View Distributed Analyser
The result view of the distributed analyser displays the result of the last analysis executed by the user Fig. 8.
The view shows only the conflicts found in the path from one filtering zone to another. The view is structured as
5/6
Analysis Service - user manual
Figure 8: Result View Distributed Analyser
a tree, where the first level specifies the type of the conflict, the second level specifies the involved configuration
and the third level specifies the involved rule. Every configuration is divided into two parts, IN contains all rules
applied to a packet before a IPsec action is applied and OUT contains all rules applied to a packet after a IPsec
action is applied. In the case no rule is applied a a certain point and the default action of the configuration is
activated the third level of the tree contains the string DefaultAction.
References
[1] E. Al-Shaer, H. Hamed, “Taxonomy of conflicts in network security policies”, IEEE Communications
Magazine, Vol. 44, No. 3, March 2006, pp. 134-141,
[2] E. Al-Shaer, H. Hamed, “Modeling and verification of IPSec and VPN security policies”, 13TH IEEE
International Conference on Network Protocols (ICNP’05), Boston (MA), November 6-9 2005, pp. 259278,
6/6