1
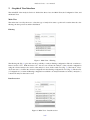
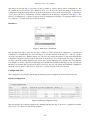
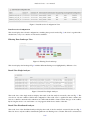
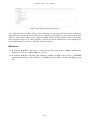
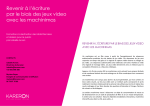
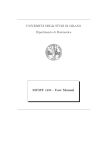
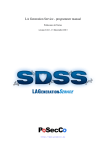
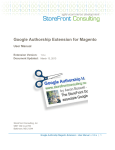
Analysis Service - user manual
Figure 5: Data Protection Configuration View
Data Protection Configuration
This view displays the selected configuration containing data protection rules Fig. 5, the view is organized in a
tabular form, every row contains one rule and its attributes.
Filtering Zone Landscape View
Figure 6: Filtering Zone Landscape
This view displays the landscape Fig. 6 with the different filtering zones highlighted by different colors.
Result View Single Analyser
Figure 7: Result View Single Analyser
The result view of the single analyser displays the result of the last analysis executed by the user Fig. 7. The
view shows only the conflicts found in the configuration. The result view is organized in three columns, the
first two columns contain the rules which are in conflict and the third column contains the type of the conflict.
By moving the mouse over a rule name a tool-tip appears which shows details of the rule.
Result View Distributed Analyser
The result view of the distributed analyser displays the result of the last analysis executed by the user Fig. 8.
The view shows only the conflicts found in the path from one filtering zone to another. The view is structured as
5/6