1
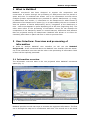
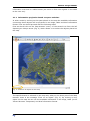
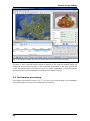
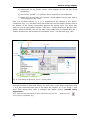
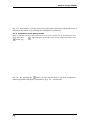
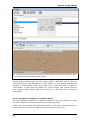
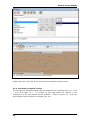
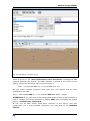
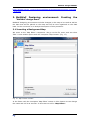
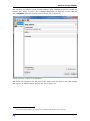
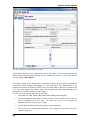
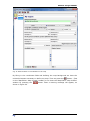
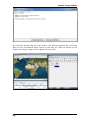
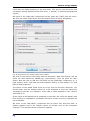
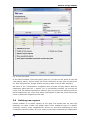
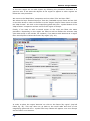
Educational Technology Lab National and Kapodistrian University of Athens School of Philosophy Faculty of Philosophy, Pedagogy and Philosophy (P.P.P.), Department of Pedagogy Director: Prof. C. Kynigos ’MaStHoF ’ User Manual \ Ver.: 1.1 v MaStHoF design MANUAL TABLE OF CONTENTS 1 WHAT IS MASTHOF ......................................................................................................3 2 USER INTERFACE: OVERVIEW AND PROCESSING OF INFORMATION .........3 2.1 Information overview .................................................................................................................. 3 2.1.1 Information projection based on space and time ............................................................ 4 2.1.2 Serial information overview ................................................................................................. 6 2.2 Processing of information ............................................................................................................ 8 2.2.1 Expressing simple queries .................................................................................................. 10 2.2.2 Projection of the query results ........................................................................................... 11 2.2.3 In search of more mutual features among the objects .................................................. 13 2.2.4 Projection of details for a specific object ......................................................................... 14 2.2.5 Expressing complex queries ............................................................................................... 15 3 MASTHOF DESIGNING ENVIRONMENT: CREATING THE ‘MaStHoF design.mwd.’.......................................................................................................................... 17 3.1 Inserting a background map .......................................................................................................... 17 3.2 Definition of coordinates on the map ............................................................................................ 20 3.3 Defining objects on the map .......................................................................................................... 23 3.4 Map-Data base correspondence .................................................................................................... 24 3.5 Object projection based on their chronological succession ........................................................... 24 3.6 Defining new regions .................................................................................................................... 26 3.6.1 Creating new regions in the world Atlas ..................................................................................... 27 EDUCATIONAL TECHNOLOGY LAB (ETL/NKUA) 2 MaStHoF design MANUAL 1 What is MaStHoF MaStHoF microworld has been designed to support the composition and construction of stories through the processing of data/events that are placed in space and time. It combines two states: one is the information overview where multiple dynamic representations are provided for specific data/events: a) image, b) abbreviated text version, c) information on the data/event on table format d) placement of the data/event in space (eg. on a map enabling the user to contrast it with the position of similar data/events) and e) integration of the data/event in time – each event appears in space depending on its life time (beginning-end). The other state refers to the processing of information where we can attempt the composition of the data/story based on mutual features, differences and patterns that are projected among the data/events. MaStHoF also allows us to insert our own data, place them in space and time in order to process them. 2 User Interface: Overview and processing of information In order to analyse MaStHoF user interface we will use the MaStHoF design.mwd.. As we mentioned above the MaStHoF user interface has two states: one is the information overview and the other is the processing of information. Both of them will be explicitly presented. 2.1 Information overview The information overview state is the one projected when MaStHoF microworld opens (Fig. 1). Fig. 1: Information overview state MaStHoF provides us with two ways to examine the registered information. The first one is through the map and in combination with time. The second one is the serial EDUCATIONAL TECHNOLOGY LAB (ETL/NKUA) 3 MaSthoF design MANUAL information overview in a table format (we move on from one register in the table to the next one). 2.1.1 Information projection based on space and time In other words by clicking on the spots placed on the map the available information concerning these objects will be projected in an image, table and brief information format. First we should proceed with the following steps: First we should click on the ‘Map browser’ menu, on the second icon from the left depicting an oblique arrow (Fig. 2) which allows us to select the objects placed on the map. Fig. 2: Selection of objects on the map The specific button is selected on the map only when on the lower part of the ‘Map browser’ there is the message “Click on an object” (Fig. 2). By clicking on any object on the map we can see the available information in an image, table (in the ‘Record browser’ component) and brief information format. EDUCATIONAL TECHNOLOGY LAB (ETL/NKUA) 4 MaSthoF design MANUAL Information in image format Information in table format Brief information format Fig. 3: The different information formats for Place 5 which was selected on the map The objects that appear on the map belong to the specific era defined by the ‘Time machine’ which is found right below the ‘Map browser’ (Fig. 3). Therefore the objects that appear on the map are not all the microworld objects but only the objects belonging to the specific era. So by moving the cursor (inside the orange circle in Fig. 3) we observe that different places appear on the map. In particular, in Fig. 4 we can see on the left depiction, when the cursor of the 'Time machine' has been placed during 1940-1960 only 'Place 4' is projected on the map. Whereas on the right depiction, where the cursor on the ‘Time machine’ has been placed during 1960-2000 two spots are projected on the map (‘Place 4’ και ‘Place 5’) (Fig. 4). EDUCATIONAL TECHNOLOGY LAB (ETL/NKUA) 5 MaSthoF design MANUAL Fig. 4: Projection of events on the map based on time 2.1.2 Serial information overview As mentioned above we can serially browse through the registered information in the microworld, in order to see the information one after the other by using the arrows at the bottom of the ‘Record Browser’ component. EDUCATIONAL TECHNOLOGY LAB (ETL/NKUA) 6 MaSthoF design MANUAL Fig. 5: Information overview through the ‘Record Browser’ With the ‘Record Browser’ we can overview, looking one after the other one by one the objects/events. Our serial navigation through the ‘Record Browser’ from one object to another results in the appearance of the relevant to the object image and text information as well (Fig. 6) without any changes on the map. EDUCATIONAL TECHNOLOGY LAB (ETL/NKUA) 7 MaSthoF design MANUAL Fig. 6: Changing the image and the text information through the serial navigation In order to see a specific object which is placed on the map we should define its time span by placing the cursor on the right spot depending on the time mentioned in the 'Record Browser' and then to trace it in space depending on the information provided by the 'Record Browser' according to its place or origin. 2.2 Information processing By pressing the Inquiry button (Fig. 7) we are in the second state of the MaStHoF microworld which concerns the information processing. EDUCATIONAL TECHNOLOGY LAB (ETL/NKUA) 8 MaSthoF design MANUAL Fig. 7: State of information processing transition button After pressing on the Inquiry button we get to the state shown in Fig. 8 Fig. 8: State of information processing In the state of information processing we can pose questions in an effort to find mutual features among the objects. This is feasible with the use of the component ‘Query’: EDUCATIONAL TECHNOLOGY LAB (ETL/NKUA) 9 MaSthoF design MANUAL Fig. 9: The ‘Query’ component in MaStHoF design.mwd As we can see in (Fig. 10a and Fig. 10b) on the left side of the ‘Query’ component we can track the general categories based on which features of the objects have been analyzed, such as Name, From, To, Photo, Description, Distinguished person, Dish Name, Web Site, Web Site HREF. Whereas on the right side we can see the individual cases/examples for each category. Fig. 10a General categories Fig. 10b Individual cases If, for example, we choose the General category «Dish Name» (Fig. 10a) then on the right side of the ‘Query’ component we have the names of the dishes registered in the microworld. Respectively if we click on the general category “From” (Fig. 10 b) then on the right side of the ‘Query’ component we have the date that the dishes first appeared as registered in the microworld. 2.2.1 Expressing simple queries In order to express a question such as show me which dishes first appeared after 1900 (Fig. 10b), we must proceed as follows: EDUCATIONAL TECHNOLOGY LAB (ETL/NKUA) 10 MaSthoF design MANUAL a) double click on the phrase «From» which appears on the left side of the component, b) click on the ‘greater’ (>) operator which is placed in the middle and c) double click on the date “01/01/1900” which appears on the right side of the component (Fig. 10b). Each one of these actions (a, b, c) is registered at the bottom of the ‘Query’ component (Fig. 11). Therefore when we double click on the phrase «From» then at the bottom of the ‘Query’ component appears the phrase From. The same way when we click on the greater symbol > then the > symbol follows the phrase From. Finally, when we double click on the date 01/01/1900 then it is added after the > symbol and this way the question is formulated: From > 01/01/1900 (Fig. 10b). Execute a question Delete a question One click Double click Double click Valid query expression Fig. 11: Expressing the Question «From > 01/01/1900» ATTENTION: The succession of the three steps mentioned above is important and must be followed as described earlier, eg. first step a, then step b and finally step c. It is also important that none of the steps be omitted, eg. if you forget > and write From 01/01/1900, then a message will appear saying «Invalid query expression». If we want to delete a question we have expressed we press the of the ‘Query’ component (Fig EDUCATIONAL TECHNOLOGY LAB (ETL/NKUA) button on top 11 MaSthoF design MANUAL Fig. 11). Alternatively, we can click next to the space where the expressed query is projected and delete it by pressing the backspace or delete key. 2.2.2 Projection of the query results After we express our query we must execute it to see the results. For its execution we must press the button placed on the top left side of the ‘query’ component next to the button (Fig Fig. 11). By pressing the button we can see the dots in the ‘Set’ component – placed right after the ‘Query’ component’ (Fig. 12) - turned blue. EDUCATIONAL TECHNOLOGY LAB (ETL/NKUA) 12 MaSthoF design MANUAL Fig. 12: Projection of dots ‘responding’ to the question ‘ «From > 01/01/1900» However, since it is possible that in some cases the selected objects may not be easily distinguished due to their density, the ‘Set’ component enables us to see the words responding to the expressed questions inside an ellipse. In order to activate the ellipse we must press the ellipse symbol (new ellipse) placed on the top left of the ‘Set’ component (Fig. 13) and then we press the button for the question to be newly executed and the words responding to the question to be placed inside the ellipse. EDUCATIONAL TECHNOLOGY LAB (ETL/NKUA) 13 MaSthoF design MANUAL Query execution New ellipse Fig. 13: Data gathered in an ellipse As you can see in Fig. 13, inside the ellipse we have created are the clues which respond to the question registered above. In particular we can see that all the blue objects inside the ellipse respond to the question «From > 01/01/1900». If you press the Χ button next to the frame above the ellipse which shows the question to which the objects respond, then the Ellipse will be deleted. If you want to create a new ellipse then you press again the button new Ellipse (Fig. 13). If you do not annul an ellipse and express a new query then new clues responding to the new question will be inserted into the ellipse. 2.2.3 In search of more mutual features among the objects You may create up to three ellipses in the ‘Set’ component by pressing the new ellipse button. In order to express a new query and retain the query you have already posed you should: A) Create a new ellipse B) Delete the query that may already be registered in the ‘query’ component C) Express a new query D) Execute this query In Fig. 14 we can see that we have created two ellipses EDUCATIONAL TECHNOLOGY LAB (ETL/NKUA) 14 MaSthoF design MANUAL Fig. 14: Objects with a date greater than 01/01/1900, objects with a date less than or equal to 31/12/2000 and objects sharing both features In the first ellipse we have objects with a date greater than 01/01/1900, in the second ellipse (bottom left) we have objects with a date less than or equal to 31/12/2000 and in the intersection of both ellipsis we have objects sharing both features (a date greater than 01/01/1900 and a date less than or equal to 31/12/2000). In case there are objects out of the ellipses, this means that they have neither a date greater than 01/01/1900 nor a date less than or equal to 31/12/2000. 2.2.4 Projection of details for a specific object The ‘Set’ component enables us to watch the details for any of the objects. In order for this to happen we should proceed with the following steps: A) We click on the Select elements button placed on the ‘Set’ component Menu. It is the third button on the left depicting an arrow and a dot (Fig. 15). EDUCATIONAL TECHNOLOGY LAB (ETL/NKUA) 15 MaSthoF design MANUAL Fig. 15: Image projection of the selected element details B) Next we click on the dot of the element whose details we want to see. 2.2.5 Expressing complex queries The two queries expressed earlier can be combined into a complex one: e.g. From > 01/01/1900 AND To <= 31/12/2000. In this case ONLY the objects in the intersection of the two ellipses will be selected – shown in figure 15 – and only these objects will be placed in an ellipse (Fig. 16). EDUCATIONAL TECHNOLOGY LAB (ETL/NKUA) 16 MaSthoF design MANUAL Fig. 16: Expressing a complex query In order to create such complex queries we must repeat for each query the a, b, c steps as shown in unit (Error! Reference source not found.) inserting the AND operator between the queries. The AND operator is placed in the centre of the ‘Query’ component and all we have to do is click on it. From > 01/01/1900 AND To <= 31/12/2000 (Fig. 16). We can create complex questions with more than one queries and as many questions as we want. From > 01/01/1900 AND Το <= 31/12/2000 AND Dish Name = Bigos. ATTENTION: If you omit one of the intermediate steps for one of the questions or omit to combine one of the questions by adding AND, then a message will appear saying: «Invalid query expression». In this unit we have shown some basic functions of the ‘Query’ and ‘Set’ components. For a more detailed description you may look at the MaStHoF manual: EDUCATIONAL TECHNOLOGY LAB (ETL/NKUA) 17 MaSthoF design MANUAL http://etl.ppp.uoa.gr/_content/download/Material/eslate2/taxinomoume_egxeiridio _xrisis.pdf 3. MaStHoF Designing ‘MaStHoF design.mwd.’ environment: Creating the MaStHoF designing environment includes changes in the map to be used as well as the data that will be placed on the map and will be next organised on the data base. In this unit there is an analytic description of this procedure. 3.1 Inserting a Background Map We move to the ‘Map Editor’ component. We go to the file menu and we select ‘Edit’. A new window opens with the inscription ‘Map Creator’ (Fig. 17). Fig. 17: ‘Map Creator’ window In the frame with the inscription ‘Map Editor’ written in blue letters we can change the name and call it as we wish. In this case we call it «Map Editor». EDUCATIONAL TECHNOLOGY LAB (ETL/NKUA) 18 MaSthoF design MANUAL We move to the bottom of the window where it says ‘Database’ and we choose the button New1 which is next to the message ‘Database not defined’. In this case we call it MyData. Now the window looks like the one in figure 18. Fig.18: Insertion of name in the Database We move the mouse to the left side of the frame and we click on the spot saying ‘My region’. A window opens as you can see in figure 19. 1 We use the search button only if we have an already made data base in a .cdb file. EDUCATIONAL TECHNOLOGY LAB (ETL/NKUA) 19 MaSthoF design MANUAL Fig. 19: Projection of the window ‘My region’ In the frame placed on the upper part saying ‘My region’ in blue letters [Above the frame saying ‘Background Images’] we can change the name. In this case we will call the region «My region». The map consists of the background, transparent object layers and the information concerning these objects that appear on the data base. The background is for instance the image of what we would call in an atlas ‘Map of Europe’ or ‘Map of the U.S.’ You may imagine the object layers as transparencies with dots placed in the background, in other words the map image. In order to insert the background of the map We press the ‘Add’ button (Below the title ‘Background Images’) A window appears that asks to define the file of the image that we want to set as background of the map. [In order for files to be accepted as background they must be .gif or .jpg) In this case we have selected a map file called atlas.gif. You must give a name that describes your image. In this case we call it «globe» (Fig. 20). EDUCATIONAL TECHNOLOGY LAB (ETL/NKUA) 20 MaSthoF design MANUAL Fig. 20 Inserting a file as a map background There appears a window with the description of your image in a green frame and a message saying ‘All time periods’. 3.2 Definition of coordinates on the map In order to define the map it is necessary to determine the bottom left corner and the top right corner coordinates. We move to the frame with the inscription ‘Geographic coordinates of this region’ and we select Cartesian or Terrestrial (In a trial phase it would be better to select Cartesian). We move to the frame saying ‘Bottom-Left X’ and we define the value 0. Then we move to the frame saying ‘Bottom-Left Y’ and again we define the value 0 (therefore the bottom left corner coordinates are 0.0). Of course you can define any values that you wish. Finally, we move to the frame saying ‘Top-Right X’ and we define the value 593 and then in the frame saying ‘Top-Right Y’ we define the value 539. After you have defined the values the Map Creator window will include the elements shown in figure 21. EDUCATIONAL TECHNOLOGY LAB (ETL/NKUA) 21 MaSthoF design MANUAL Fig. 21 Determination of coordinates on the map By filling in the coordinate fields and defining the map background we have the minimal elements necessary to define our map. Then we press the button [last on the ‘Map Editor: Map Creator’ toolbar] or we close the ‘Map Editor: Map Creator’ window by pressing the button. Next a warning message will appear, as shown in figure 22. EDUCATIONAL TECHNOLOGY LAB (ETL/NKUA) 22 MaSthoF design MANUAL Fig. 22 Projection of the ‘Map integrity check’ window We press the ‘Accept map and close’ button. This warning appears due to the fact that we have not defined object layers on the map yet. With the closure of the window the image in figure 23 will appear on our screen. Fig. 23 EDUCATIONAL TECHNOLOGY LAB (ETL/NKUA) 23 MaSthoF design MANUAL 3.3 Defining objects on the map In this unit we describe the procedure that we should follow in order to define objects on the map. In this case we define objects on the map according to the place of origin of certain dishes with the use of the ‘Map browser’ component. We proceed with the following steps: We select the 7th button on the right on the ‘Map browser’ component displaying the icon of a tack. By placing the cursor on the button the following message appears: ‘Insert object’. At the bottom of the component, in the grey frame a message appears saying: ‘You may insert, delete or modify objects’. We click on the spot we want to place the object on the map. Two windows appear, one over the other (Fig. 24). Fig. 24 First we fill in the data of the first window: In the frame under the title “New layer name” we write the layer title «Point information» We retain the selection “Show the layer in this region only” We press the button “OK” Then we move on to fill in the data in the second window (Fig. 25) Fig. 25 EDUCATIONAL TECHNOLOGY LAB (ETL/NKUA) 24 MaSthoF design MANUAL As you can see in the frame under the title “Choose the layer to put the new object” the title ‘Point information’ is written; the one we defined when we filled in the window shown in figure 24. We press the button “OK” By going back to the map we can see the following changes: a) on the spot on the map where we clicked now a new dot has been placed b) on the Data base a new table has been registered with the name “Point Information” (It has the same name as the name of the layer we defined in order to show that any information registered in this table is connected with the map layer entitled “Point Information”) c) on the Data base a new field has appeared with the name “Field 1” as well as a new register. This register is connected with the specific object that we have just placed on the map. To check it we select the register on the base and we observe that the object on the map is also selected (It turns from blue to purple and it is placed in a yellow frame). We change the name of the field from Field 1 to “Name” We write in the first register the name of the object we have placed on the map. (In this case we have written Place1) We continue placing objects on the map by following the same procedure. [We click on the spot we want to place the object, press the “New” button in case the object we place is a place of origin and fill in the name of the object in the new register of the ‘Data base’]. 3.4 Map – Data base correspondence Each register of the ‘Point Information’ table responds to a specific object on the map. If we have placed some objects on the map without filling in their names on the Data base we must NOT try to fill in the registers at random since as we said before each object responds to a specific register! In order to find out which object responds to the relevant register we have two options: we can either select the object on the map (by clicking it) and this way the relevant register on the Data base will be selected enabling you to give it a name or we can select the register and we will see the object to be selected on the map and this way we understand which name we should write in the relevant register. 3.5 Object projection based on their chronological succession The projection of objects of a certain layer based on their chronological succession demands defining the information that determines the period during which the EDUCATIONAL TECHNOLOGY LAB (ETL/NKUA) 25 MaSthoF design MANUAL event that the object depicting on the map lasts. This way we can check the time correlation among objects/events that occur, in parallel, in different geographical regions. We move to the ‘Data base’ component and we select the ‘Table’ from the menu. We click and select ‘Preferences’ and the window shown in figure 26 appears. Fig. 26 Projection of the “Table preferences” window We click on the arrow in the frame with the inscription “Date field format” and we select the date defined as dd/MM/yyyy (03/05/2013). Then we press the “OK” button. Now we have to add two new fields on the ‘Data base’ component: a) a field entitled “From” and Date as field properties and b) a field entitled “To” and Date as field properties. The values of the added fields must be of the form 01/01/1950. Moreover, you should make sure the defined dates not to be scattered in time but defined by overlapping intervals, e.g. Register1: from 1950 to 1999, Register2: from 1970 to 2000 and so on. If the values to be applied are all scattered in time then one event will appear each time and thus a comparative correlation with other events occurring in parallel will not be feasible. We move to the “Map Editor” component and we select ‘File’ and then ‘Edit’. A window appears and in the ‘Region Layers’ we double click on the inscription “MyLayer”. The window shown in figure 27 appears. EDUCATIONAL TECHNOLOGY LAB (ETL/NKUA) 26 MaSthoF design MANUAL Fig. 27 Time being field In the frame entitled ‘Time being field (from-to)’ we click on the arrow on the left (now saying ‘None’) and we select the ‘From’ field while on the right we select the ‘To’ field. We press the ‘Accept’ button and we go back to the E-slate interface. We move to the ‘Timemachine’ component and we press the first button with magnifying glass with the + symbol (if it is not already pressed). By moving cursor over the different periods we observe that only the events starting from period depicted by the cursor and whose termination is after the period where cursor is placed are depicted on the map. 3.6 the the the the Defining new regions E-slate enables us to define regions on the map. This entails that we have the possibility to create “inside” the global map a more analytical map of a specific continent, country, town, neighborhood, and so on, and thus addressing an issue on different layers of detail. Any new region of the map constitutes an independent EDUCATIONAL TECHNOLOGY LAB (ETL/NKUA) 27 MaSthoF design MANUAL map which can be connected with the existing regions over and below it. In this specific microworld beside the global map, Europe and America have also been defined as new regions. To move from one region to another, e.g. from the world atlas to Europe we press the magnifying glass with the + symbol in the ‘Map browser’ and click on the area of Europe which is now depicted in a hazy frame. 3.6.1 Creating new regions in the world Atlas In order to create a new region in the world Atlas we proceed as follows: We move to the ‘Map Editor’ component and we select ‘File’ and then ‘Edit’. We press the first button of the window (as depicted in an orange circle in fig. 28). By moving the cursor over the button a message appears saying “Add a new region”. A window appears as shown in fig. 28. Fig. 28 Button to add a new region We notice that under the area entitled “My region” a new area has been added, again entitled “My region” (on the left side of the window). We move to the next frame (on the top right side of the window) saying “My region” in blue letters and we change its name to «Europe». EDUCATIONAL TECHNOLOGY LAB (ETL/NKUA) 28 MaSthoF design MANUAL We proceed with the definition of the new region background by moving to the “Background images”. Then we press the button “Add” and we select the background image we want. In order to define the new region coordinates we must take into consideration that Europe constitutes a world atlas “sub-region” and therefore its coordinates should respond to the ones that Europe takes up in the world atlas. If there is no correspondence and we register coordinates at random then in order to move from the world atlas to the map of Europe we may have to click on Europe. We notice that region layers of the region “My region” are registered in the frame “Region Layers” whereas the region layers of Europe are registered in the frame “Available Layers”. This means that the specific layers projected on the world atlas are not available in the map of Europe. If we want to change this function we can select (with the mouse) the layer that we want to add to Europe and press the blue arrow that moves it from the “Available Layers” to the “Region Layers” frame. Next we click on the button or we close the “Map Editor” component. In order to see the new region that we have added we click on the 6th tool on the toolbar of the ‘Map browser’ component, depicting a magnifying glass with the + symbol on it. Now on the map of Europe a hazy frame appears (fig. 29). Fig. 29 Europe in a hazy frame In order to move to the newly defined region we click inside the frame and the newly defined region appears. In order to go back to the world atlas we click on the 7th tool on the ‘Map Editor’ toolbar (a magnifying glass with the - symbol on it). We notice that the whole region is covered by a hazy frame. We click anywhere inside the hazy frame and we go back to the world atlas. EDUCATIONAL TECHNOLOGY LAB (ETL/NKUA) 29 MaSthoF design MANUAL In the new region we can add objects by following the procedure described in a previous unit. If we want the objects of the region to appear in other regions we follow the next procedure: We move to the ‘Map Editor’ component and we select ‘File’ and then ‘Edit’. We select the layer entitled ‘MyLayer’ from the ‘Available Layers’ frame and we click on the blue arrow in order to transfer it to the “Region Layers’ frame. Next we close the ‘Map Creator’. We click on the magnifying glass with the + symbol button of the ‘Map browser’ component and we move to the region of Europe. Finally, if we want to add a second region on the map we follow the same procedure. Depending on the region we want to add we define the relevant map (the wider area) it will include. For instance, if we want to add America as a region then we will place it below the frame ‘My region’ (fig. 30). Fig. 30 Defining the area of ‘America’ In order to place the region ‘America’ we click on the frame ‘My region’ (top left frame fig. 30). This way when we go back to the world atlas and click on the magnifying glass with the + symbol two hazy frames will appear: one over Europe and the other over America. EDUCATIONAL TECHNOLOGY LAB (ETL/NKUA) 30 MaSthoF design MANUAL In case we want to delete a region we click on the region we want to delete and we press the second button of the ‘Map Creator’. EDUCATIONAL TECHNOLOGY LAB (ETL/NKUA) 31