1
POPPI 5.1 User Guide
Page 12
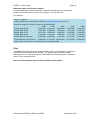
Date/time stamp and version numbers
All downloaded files include information to denote the date and time the file was
produced, and the version number of the system current at the time.
For example:
Data for: England
Table produced on 19/07/2010 10:05 from www.poppi.org.uk version 5.0
Population aged 65 and over, by age, projected to 2030
2009
2015
2020
2025
2030
People aged 65-69
2,349,200 2,952,500 2,695,900
2,945,600 3,364,100
People aged 70-74
2,032,300 2,248,600 2,753,800
2,527,400 2,771,600
People aged 75-79
1,657,700 1,821,000 2,018,500
2,490,100 2,300,100
People aged 80-84
1,232,800 1,342,000 1,518,800
1,711,600 2,129,000
People aged 85 and over
1,154,000 1,350,400 1,576,000
1,912,900 2,314,800
Total population 65 and over 8,426,000 9,714,500 10,563,000 11,587,600 12,879,600
Figures may not sum due to rounding. Crown copyright 2008
Print
The Print facility [top right of the data table] will print the current table of figures as a
report and not the whole browser screen. The printed page includes the local
authority name, the table title, figures, totals and source information plus "Population
data is Crown copyright 2010".
Note: the Print function does not print multiple location tables.
Care Services Efficiency Delivery (CSED)
December 2010