1
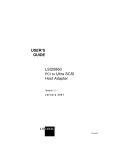
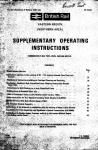
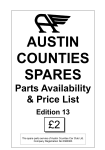
Community Area Profiles: User Guide Overview Profiles have been prepared for each of 42 Community Areas in Derbyshire. (See the final page of this document for a map of the areas.) The majority of these areas are identical to the Community Forum Areas (CFAs) that have been established to facilitate local area working, improve the visibility of the County Council in local communities and encourage community engagement. Where CFAs exist they lie within district boundaries. In districts that do not have CFAs in operation, Community Areas (CAs) have been defined to reflect communities in the underlying population. The resulting 42 CAs vary in population size between 3,800 and over 30,000. Each profile contains a brief description of the Community Area, a map to show its location in the county and an introduction to the profile. There are then 10 sections of information, each following a different Audit Commission Quality of Life theme. Finally, there is a detailed map of the area. Reading the graphics Four different types of graphic have been used to illustrate a particular CA’s statistics in relation to the same statistics for the other Community Areas and for Derbyshire and England. 1. Slider bars • The slider shows the range of values across the 42 CAs . In this example the values range from 31.1% to 14.8% of people with limiting long term illness (llti). Limiting long term illness (%) • The position of the CA on the given statistic is marked ‘A’, that of Derbyshire is marked ‘D’ and England ‘E’. (Figures for England may be missing from the slider bar if not available or if the figure for England falls outside the Derbyshire range.) • Colour is used to broadly define ‘good’ and ‘bad’ levels of a particular statistic with red illustrating the ‘worst’ end of the spectrum and green the ‘best’. • The circle to the left of the bar is coloured according to the CA’s bar colour value and quickly indicates whether the CA value is bad, medium or good. In the above example, the CA’s 21.8% of people with llti falls into the middle band so the circle is coloured yellow. • For some statistics, a high value is good, but for others a low value is good. The scale on the slider bar is reversed to handle the latter situation (as in the example above). Community Area Profiles: User Guide 1 Blue and grey sliders are used to illustrate descriptive statistics where no value is considered ‘better’ than any other e.g. population density. N.B. The small numbers involved in certain CAs can give rise to distorted ranges on the slider bar (see data issues below). 2. Quarter boxes Residents Views on: Clean streets The quarter box illustrates two aspects of residents’ views on factors that make their local area a good place to live. The first is the ‘importance’ of a factor (measured horizontally) and the second is whether a factor ‘needs improving (measured vertically). For a particular CA, the further to the right is the triangle the more important is the factor. Simultaneously, the further up is the triangle, the more the factor needs improving. Thus, in the above example, measuring residents’ views on ‘clean streets’: • The position of the triangle in the top right quarter of the graphic means that ‘clean streets’ rank high on ‘importance and high on ‘needs improving’ for the residents of the CA • The nearby position of the square to the triangle shows that Derbyshire residents overall have similar views 3. Target bars Target bars illustrate how a Community Area is performing in relation to County Council targets that have been set to challenge performance in the future. They also show how a CA’s current performance compares with Derbyshire’s overall performance. In order to make this comparison, the county level targets have been scaled down to equivalent targets for each CA, and the actual county performance has been also been scaled to show what it would be at the CA level. Benefits take-up The form of target bar shown on the right is used where an increase in a statistic is required to show improvement e.g. take-up of benefits. It illustrates a performance statistic where the Derbyshire target for 2008 is 350, Derbyshire’s current performance is 250 and the CA’s is 340. This shows that local performance is ahead of Derbyshire’s but not yet at the required target level. This second example shows a target Domestic burglary rate bar used where a decrease in a statistic is required to show improvement e.g. domestic burglary rates. Thus a low figure is good. In this case the target for 2009 has not been met by either the county or the CA. Community Area Profiles: User Guide 2 The circles to the left of the bar are coloured according the CA’s performance: green where the target is met and red where the target is not met. ‘Orange’ is used for the middle ground where a target is nearly met (within 5% of the target). 4. Bar and column charts As in other graphics, green and red are used to colour bars/columns illustrating ‘good’ and ‘bad’ statistics. Blue and grey are used for purely descriptive statistics. Data issues As mentioned above, the 42 Community Areas in the county vary in population size from 3,800 in Hope Valley CA to three areas with over 30,000 people. The small size of several of the CAs causes data problems. There are instances, in the three surveys used to gain residents’ views, where there are too few respondents to make the information sufficiently robust to publish for all CAs. Further details appear in the ‘Residents Views’ section of the User Guide. Care should also be taken in reading and interpreting other statistics where the numbers involved are small. It is hoped at some point in the future to develop a methodology to screen out misleading small figures. Understanding the statistics Residents’ views These appear in all 10 themed sections of the profile and are drawn from three sources. 1. Best Value Performance Indicator (BVPI) General User Satisfaction Survey 2006 (carried out every three years by all local authorities as a statutory requirement and used to measure a number of performance indicators). To deal with the problem of small numbers of respondents in some Community Areas the following approach has been adopted. For CAs with more than 30 respondents data is shown at CA level. For CAs with less than 30 respondents district level data has been used. There are two such areas: Hope Valley CA in High Peak and Eckington and District CA in North East Derbyshire. In the BVPI survey, residents were asked to highlight what was most important in making somewhere a good place to live. There was a prompt list of 21 factors, from which up to five factors could be checked. They were then asked to think about the local area and suggest what most needs improving (using the same prompt list). The findings from these two questions appear in many parts of the profile. For each factor, the percentage of residents saying a particular factor is important appears in a table together with the percentage saying that the factor needs improving. The rank (out of the 21 factors) on ‘importance’ and ‘needs improving’ is also given. A rank of ‘1’ means a factor of high importance or high priority for improvement. The responses to these two questions are always illustrated by a ‘quarter box’ graphic. Community Area Profiles: User Guide 3 2. MORI Residents Survey 2005 (a survey commissioned by Derbyshire County Council and carried out by Ipsos MORI). Because of the small number of respondents at Community Area level, district level data has been used. Information on ‘volunteering’ in the community cohesion section and ‘internet and mobile phone use’ is published at district rather than CA level. 3. Derbyshire Citizens’ Panel Survey, February 2006 :a postal survey carried out in partnership between District Councils, DCC and Derbyshire Constabulary and other partners The panel consists of around 8,000 Derbyshire residents who are broadly representative of the population of the county. Panel members are surveyed to provide the council and its partners with public and customer feedback on its activities and policies. Themed sections Data descriptions/definitions are given below in the order in which they appear in the profile. People and Place People Population counts and age structure This data is published by ONS as a set of experimental estimates. The figures (for 2004) are based on 2001 Census data rolled forward using registered births and deaths data in conjunction with migration data from health records. Counts for the different age groups are expressed as proportions of the total population. Population density This is expressed as a rate: the number of persons per hectare. Population counts are ONS experimental estimates (as described above). ‘Hectares’ are derived from Ordnance Survey digitised data. Ethnic minority population The data is drawn from the 2001 Census. The question on ethnicity recorded each person’s perceived ethnic group and cultural background. These details were used to produce the classification seen in the table. ‘Asian’ group includes ‘Asian British’, ‘Black’ includes ‘Black British’, ‘Chinese’ includes others not included in any of the preceding groups. The percentage of ethnic minority population in England (9.1%) is missing from the blue slider bar as the value is beyond the range of values seen in the CAs of Derbyshire. Household structure information is drawn from the 2001 Census. Households with dependent children A dependent child is a person aged 0-15 in a household (whether or not in a family) or aged 16-18, in full-time education and living as a family with his or her parent(s). Lone parent households A lone parent family is a father or mother with his or her child(ren) where the parent does not have a spouse or partner in the household and the children Community Area Profiles: User Guide 4 do not have a spouse, partner or child in the household. It also includes a lone grandparent with his or her grandchild(ren) where there are no children in the intervening generation. A lone parent household is a household that contains only a lone parent family and no other person in the household. Pensioner households Males aged 65 or over and females aged 60 or over are identified as people of pensionable age. An ‘all pensioner’ household is one where all the members of the household are of pensionable age. Household types This section contains information from the ACORN Consumer Classification published by CACI. The classification is a marketing tool designed for use in targeting UK customers. It groups together households with similar lifestyle and demographic behaviour. The classification names e.g. ‘Wealthy Achievers’ etc are crude and are only intended as very brief labels. Deprived populations These have been calculated using the Office of the Deputy Prime Minister’s (ODPM) Indices of Deprivation 2004. Seven different aspects of deprivation are drawn into one composite index. A deprivation index is published for each Lower Layer Super Output Area (LSOA) in England and then a ranking attached. (LSOAs form a statistical geography created so that statistics for small areas can be published by government departments). The statistic presented here is the sum of the populations in each Community Area that live in the 30% most deprived LSOAs in England. This population is then expressed as a percentage of the total population in the Community Area. Areas where there are very high levels of deprivation: Brief descriptions of small areas with very high levels (top 20%) are given. Not all Community Areas contain such areas. Place The statistics here are drawn from the BVPI General User Satisfaction Survey 2006 as previously detailed in the “residents’ views” section. Residents were asked how ‘satisfied’ or ‘dissatisfied’ they were with their local area as a place to live. The percentage of residents who were ‘satisfied’, ‘dissatisfied’, or ‘neither’ appear in the table. They were also asked to cite up to five factors that were important in making somewhere a good place to live and also up to five factors that most needed improving in the local area. The top five factors for both aspects appear in the profile. Community Involvement and Cohesion Participation All data in this section is from the BVPI General User Satisfaction Survey 2006. Figures are displayed as a percentage of respondents for the CA Residents were asked: If they were already members or would like to become members of Derbyshire’s Citizens Panel; Community Area Profiles: User Guide 5 How satisfied they were with the opportunities that Derbyshire County Council provides for participation in local decision making; Whether they agreed that they could influence decisions affecting their local area; and Whether they would like to be more involved in the decisions made by the council affecting the local area 50+ Forums There are 14 independently-constituted 50+ Forums in the county. They meet regularly to discuss issues affecting older people in the local area. The primary objectives for the nearest forum (to the CA) are provided. Community Cohesion Volunteering This data is from the MORI Residents Survey 2005. The information provided is at district level only as there were not enough respondents per CA to provide robust data. Residents were asked if they had done any formal volunteering (such as being members of a committee) in the last three years. They were also asked if they had done any informal volunteering (for relatives and also for non-relatives) in the last 12 months. Note that on the sliders for the three statistics on volunteering, ‘A’ relates to a district rather than a CA figure. The BVPI General User Satisfaction Survey 2006 provides the residents’ views on whether people from different backgrounds get on well together (a recognised measure of community cohesion) and on whether they think that people not treating each other with respect is a problem in their local area. Environment Built environment These statistics are drawn from the Rural and Urban Area Classification 2004 developed by the Office for National Statistics (ONS); the Department for Environment, Food and Rural Affairs (DEFRA); the Countryside Agency and others. Large urban areas are defined as settlements with a population of 10,000 or more. Dispersed dwellings, hamlets and villages constitute the ‘rural’ category. Small towns and ‘urban fringe’ constitute the remaining category. The population living in each area type has been calculated as a percentage of the 2001 Census population since the latter is used to construct the classification. The remaining statistics under the built environment section are from the BVPI General User Satisfaction Survey 2006. Residents’ views on clean streets were sought. The percentage of residents saying that ‘clean streets’ were important in making somewhere a good place to live and the percentage that said that ‘clean streets’ need improving is recorded together with the ranked position out of 21 factors. Residents were also asked if ‘rubbish and litter lying around’ and ‘abandoned or burnt out cars’ were problems in their local area. Community Area Profiles: User Guide 6 The percentage of residents who think that these factor are a problem is recorded. Greenspace The statistic on ‘greenspace’ is drawn from January 2005 Land Use Statistics (Hectares) published by the Department of Communities and Local Government, Data & Statistics Infrastructure (DSI) Division. A classification has been developed which allocates all identifiable land features on an Ordnance Survey MasterMap into nine simplified land categories and an additional 'unclassified' category. The categories are: Domestic Buildings; Domestic Gardens; Non-Domestic Buildings; Roads; Railways; Paths; Greenspace; Water; Other (largely hardstanding); and Unclassified. Air quality The statistic published here is the Combined Air Quality Indicator (2003) published by Department for Communities and Local Government. The indicator represents a modelled measure of the concentration of four pollutants (Nitrogen Dioxide, Particulates, Sulphur Dioxide and Benzene). The indicator is available for all Lower Layer Super Output Areas in England. The population living in the most polluted (worst 30% of LSOAs) in England has been expressed as a percentage of the total population in the area. The remaining statistic in this section is from the BVPI General User Satisfaction Survey 2006. Residents were asked if ‘air pollution’ was important in making somewhere a good place to live and also if it needed improving in their local area. The percentage of residents saying that ‘the level of pollution’ was important in making somewhere a good place to live and the percentage that said it needed improving is recorded together with the ranked position out of 21 factors. Housing Housing stock Number of existing dwellings The figures are from the 2001 Census. The total includes unoccupied as well as occupied dwellings. New dwellings This information has been drawn from the Derbyshire County Council Environmental Services Land Availability System. The total number of new dwellings is based on an aggregation of completion data for the financial years 2001/02, 2002/03, 2003/04, 2004/05, 2005/06. Flats are counted as separate units. Demolitions are not included. New dwellings per 1000 existing dwellings The number of new dwellings is expressed as a rate per 1000 existing dwellings. The indicator should help to identify areas where there has been a large amount of new housing built in recent years. In the slider bars, a higher ratio is regarded as good, although it could be argued that the reverse is true. Council Tax bands Figures are published by ONS Neighbourhood Statistics and based on 2003 Community Area Profiles: User Guide 7 figures. This data is drawn from Council Tax valuation lists and provides the overall number of domestic properties (the 'dwelling stock') and the number in each of the eight standard Council Tax bands. These have been combined into four categories (A and B, C and D, E and F, G and H). The total in each of the four categories has been expressed as a percentage of the total number of dwellings stock. Council Tax valuations are based on the price that property would have fetched if it had been sold on the open market on 1st April 1991. Tenure The data on tenure is drawn from the 2001 Census. The data is organised into three categories – owner occupied; renting from a local authority or housing assocation; or renting from private landlord or other. The denominator in the proportion calculation is the sum of all 3 categories. Housing affordability House price data has been extracted from the HM Land Registry Residential Property Price Report. The data relates to houses sold between April 2005 and March 2006. Total sales and total price data is used to calculate the average house price. To give a rough indication of housing affordability in the area a house price to income ratio has been calculated by dividing the average house price for the area by the average household income. Income data is as described in the Economic Well-being section. Residents views on housing affordability This is taken from the BVPI General User Satisfaction Survey 2006. Residents were asked if affordable decent housing was an important factor in making somewhere a good place to live and also whether it needed improving in their local area. The percentage of residents who say that housing affordability is important and the percentage who say that housing affordability needs improving is recorded together with the ranks for this factor. Community Safety Neighbourhood Watch Derbyshire Constabulary hold detailed records on Neighbourhood Watch Schemes operating in the county. The number of schemes operating in the CA is recorded. Recorded crime The data source for this section is Derbyshire Constabulary’s Recorded Crime database. Crime records were extracted for the period April to December 2006. The overall count of crimes is expressed as a rate per 1,000 population. The crime categories included cover those categories identified as priorities in the Council Plan. The count for each crime category is expressed as a rate per 1000 population apart from ‘domestic burglary’ which is expressed as a rate per 1000 households. Community Area Profiles: User Guide 8 ‘Violent’ crime This includes assaults, robbery, and sexual offences. ‘Domestic burglary’ This is burglary to dwellings including attempted and distraction burglaries. A target box for ‘domestic burglary’ is included. The Derbyshire target for 2007/2008 is to reduce by 30% (2003/2004) to 3,242 offences. A local target has been calculated using the proportion of households in the Community Area to Derbyshire’s total. Derbyshire’s current position has been similarly calculated. ‘Vehicle’ crime This includes theft from and theft of vehicles. ‘Criminal damage’ This includes arson, all types of criminal damage including racially or religiously aggravated and threats or possession with intent to commit criminal damage. A target box for ‘criminal damage’ is included. The Derbyshire target for 2007/2008 is to reduce criminal damage by 17% to 10,521 offences. The target has been adjusted to a local target using the proportion of the total population in the Community Area. Derbyshire’s current position has been similarly calculated. Residents’ views on crime These are taken from the BVPI General User Satisfaction Survey 2006. Residents were asked if ‘crime levels’ were important in making somewhere a good place to live and whether it needed improving in the local area. The percentage of residents who say that ‘crime levels’ are important and the percentage who say that ‘crime levels’ needs improving is recorded together with the ranks for this factor. Additionally, residents were asked how often certain crimes took place in their local area. They were asked how often they thought that ‘cars were broken into’ and ‘vandalism or graffiti and other property damage’ incidents happened in the streets around their homes. The data source is the February 2006 Citizens Panel Survey. Youth offending The data in this section is provided by Derbyshire Youth Offending Service. ‘Young people’ in this context are those aged between 0 and 17. First-time offenders Counts are expressed as a percentage of all aged 0-15.(population counts for 0-17 years are not available) Re-offenders Counts are expressed as percentages of all young offenders. Prolific Offenders Counts are expressed as percentages of all young offenders. Prolific offenders are considered by the Youth Offending Service to be likely to commit many offences. A target box for first time youth offenders is included. The Derbyshire target for 2007/2008 is to reduce first-time offenders to 969 for 2007/2008. The Community Area Profiles: User Guide 9 target has been adjusted to a local target using the proportion of the population aged 0-15 in the area. Derbyshire’s current position has been similarly calculated. Anti-social behaviour (ASB) Calls to report ASB The data is from Derbyshire Constabulary’s ‘Calls for Service’ database. This records the general public’s telephone calls to report ASB incidents. Each call made by an individual (whether or not they ring on a number of occasions) is counted. Counts for the total, and two types of call (rowdy/nuisance behaviour and vehicle related) are expressed as rates per 1000 population. The data is for the period April-December 2006 inclusive. Residents’ views on anti-social behaviour Problems in the local area The data source is the BVPI General User Satisfaction Survey 2006. Residents were asked to consider their local area and assess, for a number of different types of ASB, how much of a problem they felt that these were in their area. Frequency of perceived ASB incidents in the local area The data source is the February 2006 Citizens Panel Survey. Residents were asked how often they thought that ASB incidents happened in the streets around their homes. Results for ‘verbal abuse’ and ‘people being drunk or rowdy in a public place’ are published. Road safety The data is from Derbyshire County Council Environmental Services Road Traffic Accidents database and covers the period 2003-2006. The number of road traffic accidents is expressed as a rate per 1,000 population. In addition to the total rate of accidents involving pedestrians and cyclists is shown because these are likely to be local people and hence it provides an indicator of road safety in the local area. Economic Well Being Economic activity Businesses and jobs The Annual Business Inquiry (December 2005) provides the data on the number of businesses and the number of jobs in an area. Numbers are published for a full range of Standard Industrial Classification (SIC) categories. In the profile these have been grouped as follows: Manufacturing (SIC D), Services (SIC G, H, I, J, K, L, M, N), Other (SIC A, B, C, E, F). Note that the self-employed are missing from the job count. Because a particular business may employ one person or many people there are often significant differences between the sector proportions in the businesses and jobs topics. Working age population The data source is ONS 2004 mid-population estimates. Working age is taken to be 16-59 for females and 16-64 for males. Community Area Profiles: User Guide 10 Jobs per worker This is number of jobs in the area divided by the number of people of working age. It can be used to measure the balance between the available workforce in the local area and the number of jobs available. Unemployment The data source is Department of Work and Pensions’ (DWP) February 2007 count of Job Seekers Allowance (JSA) claimants. The unemployment rate is the numbers of claimants expressed as a percentage of the working age population. Youth unemployed These are people aged 16-24 (inclusive) claiming JSA. Of the total youth unemployed the percentage that is male and the percentage that is female is given. The total youth unemployed is expressed as a percentage of the total unemployed (across all age groups). The long-term unemployed These are people who have been claiming JSA for over 12 months. Of the total long-term unemployed the percentage that is male and the percentage that is female is given. The total is expressed as a percentage of the total unemployed. Worklessness A person is counted as workless if they are claiming JSA or they are claiming Incapacity Benefit (IB) or Severe Disablement Allowance (SDA). The number of workless is expressed as a percentage of the working age population. The data source for JSA counts is DWP May 2006 100% scan, IB and SDA. Residents views on job prospects These are drawn from the BVPI General User Satisfaction Survey 2006. They were asked if job prospects are important in making somewhere a good place to live and also whether they needed improving in the local area. The percentage of residents who say that ‘job prospects’ are important and the percentage who say that ‘job prospects’ needs improving is recorded together with the ranks for this factor. Income and economic support Average Household Income The data source is CACI’s PayCheck, April 2006 which provides an estimate of household income at postcode level. It is based on government data (e.g. Census) together with income data for millions of UK households collected from lifestyle surveys. Low Income Populations A count of the population with low income is published as part of the ODPM’s Indices of Deprivation 2004 Index of Multiple Deprivation. Overall counts are available together with figures older people (aged 60 or over). Children (aged 0-15) living in low-income families are also counted. The numbers are derived using a range of benefits data including Income Support. Pension credit claimants The data source is DWP August 2006 100% scan. The number of claimants is expressed as a percentage of females aged 60 or over, males aged 65 or Community Area Profiles: User Guide 11 over and the two combined. The target box shows how each Community Area is performing on pension credit take-up in relation to Derbyshire’s position and also the target for the county (Council Plan Indicator 18.1) for 2007/2008. Because the indicator is a straight count for the whole county (not a rate) the count has been proportioned (using the number of people of pensionable age in the CA) to give a local target. The Derbyshire total count has been proportioned in the same way. Residents views on wage levels These are drawn from BVPI General User Satisfaction Survey 2006. Residents were asked if ‘wage levels’ were important in making somewhere a good place to live and also whether they needed improving in the local area. The percentage of residents who say that ‘wage levels’ are important and the percentage who say that ‘wage levels’ needs improving is recorded together with the ranks for this factor. Regeneration initiatives It is hoped that a list of these will be included at some point in the future. Education and Life-long learning Residents’ views on education provision These are taken from the 2006 BVPI User Satisfaction Survey. Residents were asked if ‘education provision’ was important in making somewhere a good place to live and also whether it needed improving in their local area. The percentage of residents who say that ‘education provision’ is important and the percentage who say that ‘education provision’ needs improving are recorded together with the ranks for this factor. Key stage 1 Information is drawn from Department of Education and Science (DfES) data on Neighbourhood Statistics. Achievement at level 2 in 2005 in Key Stage 1 in reading, writing and mathematics is provided. The denominator for the percentage is the number of pupils taking the tests. The data is based on location of pupil residence rather than on school. ONS have withheld some of the achievement figures at LSOA level to preserve confidentiality. In such instances, the figures have been modelled by applying the percentage achievement figures for the Middle Layer Super Output Area (MLSOA) within which LSOAs are located, to the actual number of pupils taking the key skills exams within the particular LSOAs. MLSOAs are a part of a statistical geography devised by ONS for the publication of small area statistics. Local data relates to local authority maintained schools. England data relates to all schools. 5 GCSEs A*-C Information is drawn from DfES data published by Neighbourhood Statistics. It relates to the academic year 2003/2004. Data is presented for boys, girls and all pupils on the proportion of pupils achieving 5 grades A*-C. The data relates to pupils, who were 15 years old at the start of the academic year in question, taking the exams. In each case the denominator is the number of pupils taking the tests. All the data relates to pupil residence rather than school. ONS have withheld some of the achievement figures at LSOA level to preserve confidentiality. In such instances the figures have been modelled by applying Community Area Profiles: User Guide 12 the percentage achievement figures for the MSOA (within which LSOAs are located), to the actual number of pupils taking the key skills exams within the particular LSOAs. Local data relates to local authority maintained schools. England data relates to all schools. The GCSE target is the Council Plan indicator for 2006/2007. GCSE performance by school Secondary schools in the CA are listed. The performance at each of the secondary schools (in terms of the proportion of students achieving 5GCSEs A*-C) has been ranked. The ranking out of the 47 secondary schools in Derbyshire is given (rank 1 = top performance, rank 47 = bottom performance) Destinations The information is drawn from Connexions Derbyshire 2006 Year 11 Progression Analysis. All pupils who left year 11 in summer 2006 (either from mainstream schools, support centres, or home tuition) were surveyed in November 2006. In the profile pupil progression is recorded under one of 3 headings – 1. in learning (which equates to full-time education/full-time training) 2. not in learning (which is an aggregate of those in employment, in voluntary/part-time activities, or not in education, employment or training (NEET)) or 3. no response. The ‘no response’ heading includes those young people who have moved out of contact, didn’t respond or declined to participate. The denominator used in the percentage calculation is the total number of young people surveyed in this CA, irrespective of whether they responded or not. The data is based on each young person’s location of residence. Pupil exclusions The data source is Derbyshire County Council Education Department data for 2005-06. All fixed term exclusions from Derbyshire primary and secondary schools in the academic year 2005-06 are counted. It is based on the number of exclusions and not the number of pupils excluded – so a pupil excluded twice will be counted twice. The denominator used in calculating the exclusion rate is based on the number of young people aged 5-15, in the particular, geography from the Census 2001. The indicator is the number of exclusions per 1000 pupils aged 5-15. The data is resident based rather than school based. However, the addresses used are the addresses at the time the data is extracted at the year end, as opposed to the address a pupil was living at the time they were excluded (if they had moved). Also, pupils for whom there are no address details have been excluded from the source dataset. Adults The data used here is drawn from 2001 Census Key Statistics. The number adults (aged 16 -74) with no qualifications, with A-levels or equivalent, or with degree level or equivalent, is expressed as a percentage of the total number of people of that age group. Community Area Profiles: User Guide 13 Health and Social Well-being Although this section is called Health and Social Well-being (to tie in with the Audit Commission theme), the statistics mainly relate to ‘Health’. Early death rate Mortality rates have been standardised to England’s rate to allow comparisons to be made between areas that have different age structures. Areas with early death rates higher than 100 show a higher mortality rate than might be expected, given the age profile for the area. Conversely, a rate that is lower than 100 suggests better health. The data has been supplied by East Midlands Public Health Observatory and relates to deaths from all causes to people aged under 75 during the period 1999 – 2003. It is appreciated that ‘early death rate’ is a difficult measure to understand and the statistic will be replaced by ‘Life Expectancy’ figures as soon as these become available for Community Areas. ‘Not good’ general health The 2001 census question asked people to self assess their general health over the last year. Three responses were allowed: good general health, fairly good general health or not good. The number of people with ‘not good’ general health is expressed as a % of the total population. Limiting long-term illness (llti) This is a (self-assessed) long-term illness, health problem or disability (including problems due to old-age) that limits a person’s daily activities or the work that they do. The percentage of people with llti is the number of people as a proportion of the total population. The data source is the 2001 Census. Disability Living Allowance This is a benefit for people who have a long-term illness or disability (either physical or mental) who are aged under 65. The number of claimants is expressed as a % of the total population aged under 65. Attendance Allowance is a benefit for people aged 65 orover who need help with personal care. The number of claimants is expressed as a % of those of retirement age. Low birth weight babies This is a count of the number of babies born in 2005 with a weight of less than 2,500 grams expressed as a rate per 1000 total births. The data has been supplied by East Midlands Public Health Observatory. Accident and Emergency admissions – under19s The number of A and E admissions to hospital is expressed as a rate per 1,000 population aged 0-18. The A and E data has been supplied by East Midlands Public Health Observatory. Asthma emergency admissions – under19: The number of asthma emergency admissions to hospital is expressed as a rate per 1,000 population aged 0-18. The A and E data has been supplied by East Midlands Public Health Observatory. Residents’ views on health services These are taken from the 2006 BVPI User Satisfaction Survey. Residents Community Area Profiles: User Guide 14 were asked if health services were important in making somewhere a good place to live and also whether they needed improving in their local area. The percentage of residents who say that ‘health services’ are important and the percentage who say that ‘health services’ needs improving is recorded together with the ranks for this factor. Culture and Leisure In this section, all residents’ views are drawn from the BVPI General User Satisfaction Survey 2006. Use and satisfaction levels relate to cultural and leisure facilities provided or supported by Derbyshire County Council Museums and Theatres Residents were asked about their use of museums/galleries in the last 12 months, their levels of satisfaction and whether they thought that the museums/galleries had improved in the last 3 years. Similar questions were asked in relation to theatres/concert halls Libraries The number of active library borrowers (i.e. borrowed from a library in the last 12 months) is expressed as a rate per 1000 population living in the Area. Borrowers with faulty or missing postcodes have been excluded from the results. These represent around 6% of the total. Residents were asked about satisfaction with libraries and whether they thought that they had improved over the last 3 years. Sports Residents were asked about their frequency of use (in the last 12 months) of sports facilities with responses classified as regular, infrequent or never used. They were also asked whether they were satisfied with sports facilities and whether they had improved over the last 3 years. Residents’ views on sports/leisure facilities These are drawn from the 2006 BVPI User Satisfaction Survey. Residents were asked if sports/leisure facilities were important in making somewhere a good place to live and also whether they needed improving in their local area. The percentage of residents who say that ‘sports/leisure facilities’ are important and the percentage who say that ‘sports/leisure facilities’ needs improving is recorded together with the ranks for this factor. Leisure for children and young people Residents’ views on ‘activities for teenagers’ These are taken from the 2006 BVPI User Satisfaction Survey. Residents were asked if activities for teenagers’ were important in making somewhere a good place to live and also whether they needed improving in their local area. The percentage of residents who say that ‘activities for teenagers’ are important and the percentage who say that ‘activities for teenagers’ needs improving is recorded together with the ranks for this factor. Similar questions were asked on ‘facilities for young children’. Community Area Profiles: User Guide 15 Young people’s views Both County and District Youth Forums have been established to help gain the views of young people aged 11-19. The Derbyshire Youth Forum conducted a survey in Summer,2006 to seek young peoples’ views on the Youth Opportunity Fund and the Youth Capital Fund. They were asked ‘what they most liked to do in their own time?’ and ‘how they would like to spend a million pounds’ from a list of activity options. Tourism There are few statistics on tourism available especially for areas below county level. In this section, tourist attractions within the local area are listed. The information is drawn from 2005 Visitor Attraction Survey carried out by VisitBritain. Transport and Access Transport Car availability The data is drawn from the 2001 Census. The number of households in the area with no car, one car or two or more cars is expressed as a percentage of all households in the area. Bus services Residents’ views on local bus services are drawn from the BVPI User Satisfaction Survey 2006. They were asked about frequency of use. ‘Regular’ use combines ‘almost every day’, ‘at least once a week’ and ‘about once a month’ categories. ‘Infrequent’ combines ‘within the last 6 months’, ‘last year’ and ‘longer’ categories. The percentage of residents using local bus services regularly, infrequently or never are recorded in the table. Satisfaction rates are for ‘the local bus service overall’. ‘Satisfied’, groups the ‘very’ and ‘fairly satisfied’ categories. ‘Dissatisfied’, groups the ‘fairly’ and ‘very dissatisfied’ categories. Residents’ views on ‘levels of traffic congestion’ These are drawn from the 2006 BVPI User Satisfaction Survey. Residents were asked if levels of traffic congestion’ were important in making somewhere a good place to live and also whether they needed improving in their local area. The percentage of residents who say that ‘levels of traffic congestion’ are important and the percentage who say that ‘levels of traffic congestion’ needs improving is recorded together with the ranks for this factor. Similar questions were asked on ‘public transport’ and ‘road and pavement repairs’. Access The MORI 2005 Derbyshire Residents Survey provides information on mobile phone and internet use. Residents were asked if they personally used ‘mobile phones’, ‘the internet at home’, ‘the internet at work, place of study or elsewhere’. Note that this data is provided at district level only as there were too few responses to merit separate CA figures. Community Area Profiles: User Guide 16 Residents’ views on ‘information about the Council and its services are drawn from the BVPI User Satisfaction Survey 2006. They were asked ‘how well do you think the Council keeps its residents informed about the services and benefits it provides?’. The percentage of people who feel that the Council keeps them ‘Very’ and ‘Fairly’ well informed (combined into one category) is recorded here. Community Area Profiles: User Guide 17 Derbyshire Community Areas March 2007 Tintwistle HP2 HP2 HP2 Charlesworth G lossop (unparished) Ch i s Hope Woodlands wo r th Amber Valley Bolsover AV1 AV2 AV3 AV4 AV5 BO1 BO2 BO3 BO4 Alfreton/Somercotes/Crich Belper/Kilburn Duffield/Kirk Langley Heanor/Codnor Ripley/Heage Derbyshire Dales Derwent Hayfield gga t t F or Tu p ton Wi No r n g th fie l d wn k To tol c Ma I ronv li el l el y ro ok O ck b on el Wo odv li dge y Bri l Holbrook Sm a Sta n le y ll d sa Bre a Id & Ari dg e l to ha n y Tu r nd i tc h S hardl ow & Great Wi l ne upon Weston upon Trent Long Eaton (unparished) ER5 ER5 ER5 ER5 ER5 ER5 Sawley Tren t on b S ta nt a st Tru sle y Mars to n on Do ve H op we ey P li sl on i ng t Ca r s Osl est on & T hur va st on n Ho o de r n Row al nd Ha rth ill n Gr atto Lea Hal l Ha tto n Fi n G rin dl ow ow F ool Wa rdol w to n Map el S omers al Her be rt oo k Netherseal Breaston ER1 ER1 ER1 ER1 ER1 ER1 cr e e al Lullington e rs Ov el l ldw to n s l si Ro SD2 SD2 SD2 ai nd Sa Ingleby Ticknall Calke Swadlincote SD4 SD4 SD4 (unparished) Ca st l eG SD6 SD6 SD6 re s SD6 SD6 SD6 l ey to n Li n u Ca Cot on i n t he E l ms o ne rkest ER4 ER4 ER4 ER4 ER4 ER4 rch Foremark SD5 SD5 SD5 SD5 SD5 SD5 S wa S t ant on by Dal e Risley C hu Barrow upon so n Trent As to n ton Ilk es she d) ri (un pa Ste n Willington S t enson F i el ds ER2 ER2 ER2 ER2 ER2 ER2 o tt& D rayc i nl e W Twyford & Etwall Dale Abbey Elvaston Hartshorne Catton Mapperley ER3 ER3 ER3 ER3 ER3 ER3 Mackworth Repton Walton upon Trent Morley AV4 AV4 AV4 Shipley West Hallam B earwardcot e Newton Solney Drakelow odh y ou se Radbourne Egginton Community Areas & er car y l e A dl La ng l r& n Mi ea no To w H co e s Lo n Hilton s d) di ng R di par i she ( un n Bretby Parishes w ci k o rn d SD1 SD1 SD1 SD1 SD1 SD1 AV2 AV2 AV2 H AV2 AV2 AV2 Wo or sl e Horsley Eaton Q ua Ash n Sw a Duffield el y Ke d les to Kirk Langley S ut t onon-t heHi l l h to n d ol un t to n ton Kil b urn Little oo e rw Longford B ro ug Foston & Scropton ng ol il e rc as Dal bury Lee s Ch u rc h M Denby AV3 AV3 AV3 AV3 AV3 AV3 d Un el y ar t o nB Ravensdal e P ark y Brailsford rd Wa Codnor Belper Town oo d a nd AV5 AV5 AV5 AV5 AV5 AV5Ripley Town Shottle & Postern l ew H az ll Hu h ay ey Hulland el y Pleasley Blackwell South Alfreton Normanton Town South Wingfield Pinxton So m e rco te s Pentrich sl rwa Biggin Shirland & Higham Wessington AV1 AV1 AV1 AV1 AV1 AV1 nd Wi ers le h As we ll Pilsley Brackenfield Dethick Crich Kirk Ireton DD3 DD3 DD3 DD3 DD3 DD3 Bradley H on ont e rdi g Wingerworth Clay Cross Dronfield Eastern Partnership Eckington and District Rural Partnership South Eastern Partnership n sto Atlow Shirley m A kl n M a rsto ry om e M o ntg e Do v BoylestoneB na n R Yeaveley o d s Sudbury North East Derbyshire as to &W ya st o n Hu ng B ry Cubley ent l e y g Ho Tansley Wirksworth Town Callow G al p Ault Hucknall NE2 NE2 NE7 NE2 NE7 NE7 BO4 BO4 NE7 BO4 n BO4 BO4 Morton Tibshelf Cromford on ton High Peak sm Ye ld et ddl Mi s We Snelston Ed l as t on e Kniveton O ffcote & Underwood A shbourne T own Cl i f t on & Compt on O Norbury & Roston Ible Holmewood Stre tto e Al d F en ny B en t l ey o urn Clay Cross Bonsall to n Bra db Ashover Mat l ock DD1 DD1 DD1 DD1 DD1 DD1 B at h I vonbrook Grange p Ho Borrowash/Breaston Ilkeston Ilkeston Rural Kirk Hallam/Sandiacre Long Eaton Winster South Darley Brassington Thorpe Buxton Glossop Hope Valley New Mills/Whaley Bridge/ Chapel Elton Ballidon Newton G range Darley Dale Town Stanton Al d wa rk Parwich Nort hwood & T i nkersl ey Birchover Hartington Nether Q uarter Eaton & Alsop sl ey R ow br i re Sh Middleton & Smerrill Hartington Town Q uarter Barrow Hill/Whittington Brimington/Tapton Dunston/Moor/St Helens Hasland/St Leonards Holmebrook/Rother Newbold/Brockwell Staveley Walton/West Nether Haddon Youlgreave rte r o mo Q ua Beeley le n mp to T er man No r Monyash as s Gr dd l e on Staveley Town to n Ha s so p Baslow & Bubnell rt h er Mi dd O ve r Ha Whitwell BO1 BO1 Clowne BO1 BO1 BO1 BO1 CH3 CH3 CH3 CH7 CH7 CH7 CH7 CH7 O ld Bolsover Elmton CH2 CH2 Chesterfield CH2 CH2 CH2 CH2 Town Brampton CH6 CH6 CH6 (unparished) CH5 CH5 CH5 BO2 BO2 CH5 CH5 CH5 Calow Sutton cum BO2 BO2 BO2 CH8 CH8 CH8 CH8 CH8 Duckmanton CH4 CH4 BO3 BO3 BO3 CH4 CH4 CH4 Holymoorside & Walton BO3 BO3 ScarcliffeBO3 NE4 NE4 NE4 NE4 NE4 NE6 NE6 NE6 NE6 Wingerworth NE6 Heath and NE1 NE1 NE1 wo a ts Ch a rt Qu ton Barlborough i ng DD2 DD2 DD2 DD2 DD2 DD2 CH1 CH1 CH1 Barlow Curbar Calver NE5 NE5 NE5 Unstone Holmesfield m Bri ei l d r i ng Erewash NE1 NE2 NE3 NE4 NE5 NE6 NE7 Stoney Middleton G reat Longstone Tissington HP1 HP2 HP3 HP4 Killamarsh Eckington NE3 NE3 NE3 NE3 NE3 NE3 Dronfield Town G rindleford Ashford Taddington in the Chelmorton Water Edensor Sheldon Flagg Bakewell Town Chesterfield ER1 ER2 ER3 ER4 ER5 l ow Eyam Li t t l e Longst one B rushf i el d rsa g e rf Fai B l ackwel l i n t he P eak King Sterndale h Hi g t kl o w n sto n ee e Up p HP1 HP1 HP1 A bney & A bney Grange Litton Gr Buxton (unparished) e Ha th el l es w Hu c n Ti d Hazl ebadge L H u i t tl e ck ol w G r ea e Wh Ha rti ng ton Wormhill fe rto Peak Forest Dales-Central Dales-North Dales - South O utseats Of Bradwell Chapel-en-le-Frith Ha rt CH1 CH2 CH3 CH4 CH5 CH6 CH7 CH8 B rough & S hat t on Bamford Bu rn Castleton T hornh li l Hope HP4 HP4 HP4 HP4 HP4 HP4 Chinley Whaley Bridge Town DD1 DD2 DD3 HP3 HP3 HP3 HP3 HP3 HP3 Edale As to n New Mills Town Barlborough/Clowne Bolsover Shirebrook South Normanton/Tibshelf Smisby SD3 SD3 SD3 Melbourne South Derbyshire SD1 SD2 SD3 SD4 SD5 SD6 Etwall Linton Melbourne Newhall Repton Swadlincote