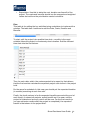
1
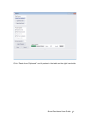
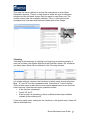
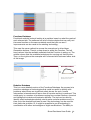
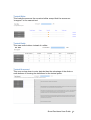
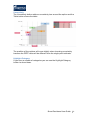
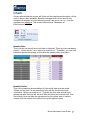
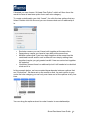
The box at the bottom is optional and allows you to record your reasoning for
choosing that particular measurement scale and value mapping.
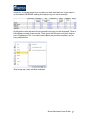
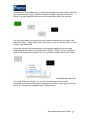
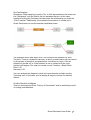
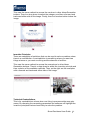
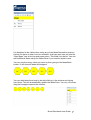
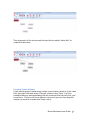
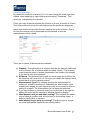
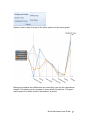
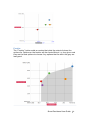
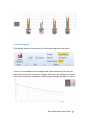
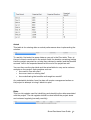
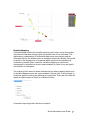
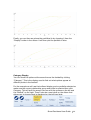
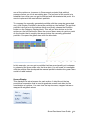
For non-linear mapping (custom) you can create what is called a utility curve.
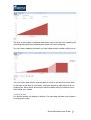
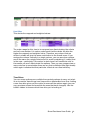
You can enter data directly into the table or click on the dot and move them
to the right or left and up and down. Add new points by right clicking on an
existing dot. Move them around (and use the table) until you create a curve
that meets your values.
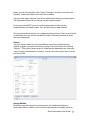
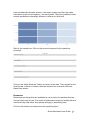
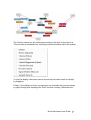
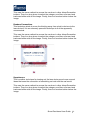
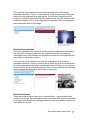
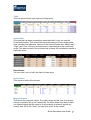
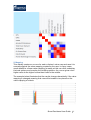
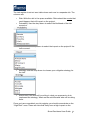
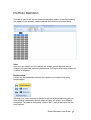
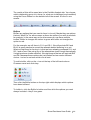
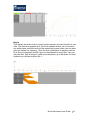
Textual Scales
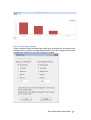
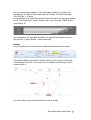
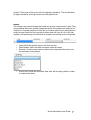
For textual scales, the display is similar. You can drag the bars up and down
to change the value.
Smart Decisions User Guide 57