1
Software User's Guide
winIDEA
Version 2008
This page intentionally left blank.
Contents
Introduction
7
About This Manual .................................................................................................................... 7
Integrated Development Environment....................................................................................... 8
Installation
9
System Requirements ................................................................................................................ 9
Software Installation................................................................................................................ 10
Installing the winIDEA Update ................................................................................. 10
winIDEA Command Line Options ............................................................................ 10
Development Environment
11
Workspaces.............................................................................................................................. 11
Path Specifications .................................................................................................... 11
Working with Workspaces ........................................................................................ 11
Hardware Plug-In..................................................................................................................... 16
Configuration............................................................................................................. 16
Window Management.............................................................................................................. 17
Dockable windows .................................................................................................... 17
Mini Frame Windows................................................................................................ 19
Desktops .................................................................................................................... 19
Full screen operation ................................................................................................. 19
Context Menus .......................................................................................................... 20
Toolbars..................................................................................................................... 20
Document Management
25
Document Windows ................................................................................................................ 25
Creating a New Document ........................................................................................ 26
Opening an Existing Document.................................................................................27
Document Window List ............................................................................................ 28
Document Selector Bar.............................................................................................. 29
The Editor ................................................................................................................................ 30
Selecting Text............................................................................................................ 30
Bookmarking the Text............................................................................................... 33
Search and Replace Operations ................................................................................. 35
Clipboard operations ................................................................................................. 36
Drag and Drop ........................................................................................................... 37
The Context Menu..................................................................................................... 38
Printing ...................................................................................................................... 39
Configuring Editor Options ....................................................................................... 41
Find in Files Utility ................................................................................................... 44
Watch Tips ................................................................................................................ 45
The Trace................................................................................................................................. 46
Getting Started........................................................................................................... 46
Software User's Guide winIDEA
Contents • iii
Working with Signals ................................................................................................ 53
Setting up the Environment ....................................................................................... 68
Recording the Signals................................................................................................ 72
Navigating Through the Document ........................................................................... 74
Handling Multiple Trace Records ............................................................................. 83
Execution Coverage................................................................................................................. 87
Results ....................................................................................................................... 89
Toolbars..................................................................................................................... 90
Getting Started with Execution Coverage ................................................................. 95
Debug Session
97
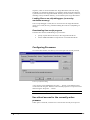
Download Files........................................................................................................................ 97
Configuring Processes ............................................................................................... 98
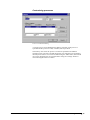
Configuring Download Files ................................................................................... 100
Download File ......................................................................................................... 107
Verify Download..................................................................................................... 110
Load Map ................................................................................................................ 111
Debug Information................................................................................................................. 112
Symbol Browser ...................................................................................................... 113
Specifying Addresses and Values............................................................................ 119
Quick browsing to functions ................................................................................... 120
Debug Options ....................................................................................................................... 121
Memory Access....................................................................................................... 121
Memory Regions ..................................................................................................... 122
Update ..................................................................................................................... 124
Symbols................................................................................................................... 126
Debugging ............................................................................................................... 127
Assume .................................................................................................................... 129
Directories ............................................................................................................... 129
History..................................................................................................................... 131
MMU Options ......................................................................................................... 132
BackTrace options................................................................................................... 132
Operating System Support ..................................................................................................... 133
Operating System Selection..................................................................................... 133
OSEK Operating System Support ........................................................................... 136
OSE Operating System Support .............................................................................. 141
OSE Run Mode Debug Session............................................................................... 148
µC/OS-II Operating System Support....................................................................... 153
Breakpoints............................................................................................................................ 159
Execution Breakpoints............................................................................................. 159
Source Debugging ................................................................................................................. 165
Disassembly Window ............................................................................................................ 170
Suspending and Resuming Program Execution....................................................... 172
Disassembling To Disk............................................................................................ 173
Disassembly options................................................................................................ 174
Memory Window................................................................................................................... 175
Opening a Memory Window ................................................................................... 175
Memory Display Mode............................................................................................ 176
Finding Memory Contents....................................................................................... 177
Modifying Memory Contents .................................................................................. 179
Saving To Disk........................................................................................................ 180
MMU Table Walk Window..................................................................................... 181
Watch Window ...................................................................................................................... 182
Adding Watch Expressions ..................................................................................... 183
Modifying Values.................................................................................................... 185
iv • Contents
Software User's Guide winIDEA
Watching Complex Expressions.............................................................................. 186
Variables Window ................................................................................................................. 187
Modifying Values.................................................................................................... 188
Watching Complex Symbols ................................................................................... 188
The Call Stack ......................................................................................................... 188
Analyzer Tools....................................................................................................................... 190
Profiler..................................................................................................................... 191
Access Coverage ..................................................................................................... 202
Profiler Window .................................................................................................................... 204
Profiler Pane ............................................................................................................ 204
Access Coverage Pane............................................................................................. 206
Special Function Registers Window...................................................................................... 208
Customizing the SFR Window ................................................................................ 210
Finding a Register in the SFR Window................................................................... 211
Custom SFR Windows ............................................................................................ 211
Terminal Window.................................................................................................................. 213
Terminal Window Setup.......................................................................................... 213
The Terminal Window ............................................................................................ 218
List of supported VT100 Commands ...................................................................... 220
FLASH Programming
221
Introduction ........................................................................................................................... 221
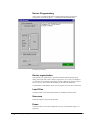
Programming ......................................................................................................................... 222
Configuration........................................................................................................... 222
Device Programming............................................................................................... 228
Build Manager
231
Introduction ........................................................................................................................... 231
Detecting Changes to the Project............................................................................. 231
Project Organization .............................................................................................................. 233
Directory Organization............................................................................................ 234
Targets..................................................................................................................... 235
Groups ..................................................................................................................... 238
Project Files............................................................................................................. 239
Link Order of Files and Groups............................................................................... 240
Compiler Tool-set Integration ............................................................................................... 242
Scope of Settings ..................................................................................................... 242
Configuring Settings for Multiple Files................................................................... 242
General page............................................................................................................ 244
Includes ................................................................................................................... 247
File Extensions page................................................................................................ 249
Customize page ....................................................................................................... 250
Compiler page ......................................................................................................... 253
Assembler page ....................................................................................................... 255
Linker page.............................................................................................................. 257
Build Page ............................................................................................................... 260
Build Manager Macros ............................................................................................ 261
Using an Example Workspace as a Template........................................................................ 263
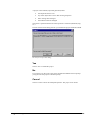
Build Session ......................................................................................................................... 264
Output Window ....................................................................................................... 264
Building................................................................................................................... 266
Workgroup Support ............................................................................................................... 267
Configuring the source control system .................................................................... 267
User interface to a source control system ................................................................ 272
Software User's Guide winIDEA
Contents • v
Which files to put under source control................................................................... 274
Script Language
277
winIDEA Script Language..................................................................................................... 277
ISL Syntax............................................................................................................... 277
Your first ISL program............................................................................................ 279
Running a script program ........................................................................................ 280
ISL from beginning ................................................................................................. 281
Expressions.............................................................................................................. 284
Statements ............................................................................................................... 284
Software API Functions......................................................................................................... 288
Summary of all supported software API functions.................................................. 288
Examples for working with API functions .............................................................. 327
Frequently Asked Questions on API Functions....................................................... 334
Customizing the Environment
335
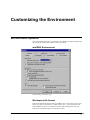
Environment Options............................................................................................................. 335
winIDEA Environment............................................................................................ 335
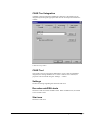
CASE Tool Integration............................................................................................ 337
Keyboard Shortcuts ................................................................................................. 342
Window Colors........................................................................................................ 344
isystem.connect ....................................................................................................... 345
XCP Slave Plug-In .................................................................................................. 348
Custom Tools......................................................................................................................... 352
Entering License Information ................................................................................................ 354
What is a License .................................................................................................... 354
Technical Support.................................................................................................................. 358
Appendix
361
Build Manager Temporary Build Files .................................................................................. 361
Menu Reference..................................................................................................................... 362
File Menu ................................................................................................................ 362
Edit Menu ................................................................................................................ 364
View Menu .............................................................................................................. 365
Project Menu ........................................................................................................... 369
Debug Menu ............................................................................................................ 371
Tools Menu.............................................................................................................. 374
Window Menu......................................................................................................... 375
Help Menu............................................................................................................... 375
SLO Text Format Specification ............................................................................................. 376
Color Syntax Files Definition ................................................................................................ 382
Special Keyword Definition .................................................................................... 382
Assembler Color Syntax File Definition ................................................................. 383
vi • Contents
Glossary of Terms
385
Index
389
Software User's Guide winIDEA
Introduction
About This Manual
This manual is a guide to the winIDEA environment.
It covers following topics:
•
The development environment – workspace and window handling
•
The integrated editor
•
Debug features
•
FLASH programming features
•
The integrated build manager
•
The integrated script language
For hardware specific topics refer to the hardware manual.
Software User's Guide winIDEA
Introduction • 7
Integrated Development Environment
The winIDEA application is an integrated development environment that
encompasses all phases of program development in a single, easy to use yet
powerful environment.
8 • Introduction
•
winIDEA runs on Windows NT, 2000, XP and Vista platforms
•
The integrated multi-file editor serves as an area for both writing and
debugging your program source.
•
All other windows can be docked to a fixed position, thus eliminating
the need for rearrangement after tile, cascade or resize operations.
•
The Build Manager can be configured to support any third party
command line driven compiler toolset, featuring background
compilation, multiple build targets, file level compiler settings and
much more.
•
The hardware interface allows attachment to any debugger that supports
the iOPEN interface.
•
The extensive context-sensitive help covers all aspects of winIDEA.
Software User's Guide winIDEA
Installation
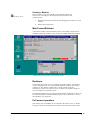
System Requirements
Hardware
•
PC with a Pentium or better CPU
•
128 MB or more memory
•
200 MB or more hard disk space.
Software
winIDEA supports Windows NT 4, 2000, XP, Vista or higher.
Note: In case the on-line help does not work, this could be solved by reinstalling
the Microsoft Internet Explorer or by installing winIDEA onto a local hard disk.
Software User's Guide winIDEA
Installation • 9
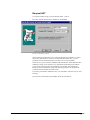
Software Installation
•
Insert the distribution CD-ROM disk in the CD-ROM drive. Master
setup will start automatically.
Select the “Install winIDEA’ option.
•
Follow the installation wizard
Note: on Windows NT you must have administrator privilege to successfully
install the communication driver.
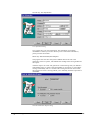
Installing the winIDEA Update
Updates to winIDEA are published regularly on the internet. To update
winIDEA:
•
Get an update link if published on the web site or if it is given to you by
support and download it
•
Run the update
•
Follow the installation wizard
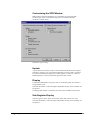
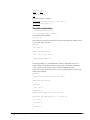
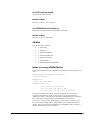
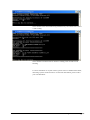
winIDEA Command Line Options
There are a number of command line options availabe when starting winIDEA.
The options are:
/DEMO
run in demo mode
/LOG:<domain>
generate a log of activities for <domain>. Available
domains and their numbers are visible in Help/Support/Log dialog
/DOWNLOAD
start download immediately after loading the project
/DOWNLOAD:<file name>
10 • Installation
download the specified file
<file name>.jrf
load the specified workspace
<file name>.isl
workspace
execute the specified script file after loading the
Software User's Guide winIDEA
Development Environment
Workspaces
winIDEA organizes project development in workspaces. Each workspace
contains the information on how the files necessary for a successful build of your
project are related to each other, along with information on other features that aid
development, such as bookmarks, breakpoints, desktop layout etc.
The workspace file is the mother of Virtually all of the workspace information (except some user
your workspace. She will be very preferences, like color and keyboard settings) is stored in a
happy if her children (project files, workspace file (.XJRF and .JRF extension). Ideally you will
etc.) are kept in her directory or its organize your project in a new directory where the workspace file
sub-directories.
will be located. This is considered to be your working directory.
You are free to create sub-directories and place your source files
there. All file path information in a workspace is stored relative to
the workspace file location, so you will be able to move and copy
the workspace to any other directory without disturbing its
functionality.
Path Specifications
At various places in winIDEA, especially when configuring project settings, you
will need to enter file paths. To assure maximum workspace moveability,
winIDEA recognizes and internally maintains three different path specifications:
•
Paths to files in the directory or sub-directory of the workspace file.
These are stored and displayed in relative form.
•
Paths to files that can be stored in relative form to the compiler toolset
directory (see "General page" on page 244).
These are stored in relative form to the compiler toolset path, but
displayed in absolute form.
18H
•
X
X189H
X
Paths that can not be stored in relative form to either of above
referential directories. These are stored and displayed in absolute form.
Working with Workspaces
There is not much you can do in winIDEA without having a workspace open. To
get you there, you will either open an existing workspace (one you have created
previously or an example workspace shipped with the installation files) or create
a new one from scratch.
Opening an Existing Workspace
•
Software User's Guide winIDEA
Select the ‘Open Workspace…’ command from the ‘File’ menu
Development Environment • 11
•
Browse for the workspace file
•
Click the ‘Open’ button after selecting the desired workspace file
Alternatively you can select a previously opened workspace from the workspace
file pick list in the ‘File’ menu.
•
Open the ‘File’ menu
•
Four most recently used workspaces are listed on shortcuts 5 through 8.
Select the workspace of your choice.
Note: winIDEA can read (but not write) workspace files created by earlier
winIDEA versions (.IRF extension).
After changes have been made, winIDEA will save the new workspace
information in a .XJRF and .JRF file.
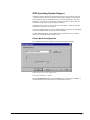
XML Format workspace files
winIDEA always generates both legacy binary (.QRF and .JRF) and XML
format (.XQRF and .XJRF) workspace files. The default file format used by
winIDEA is defined in the Tools/Options/Environment menu, which selects the
format implicit for workspace restore and backup, source control, etc. operations.
12 • Development Environment
Software User's Guide winIDEA
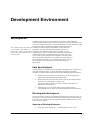
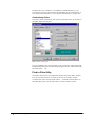
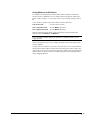
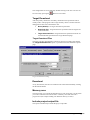
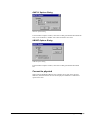
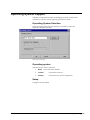
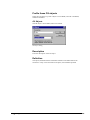
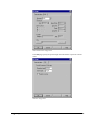
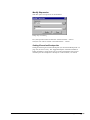
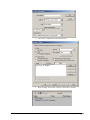
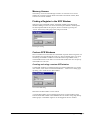
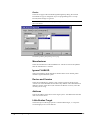
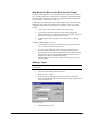
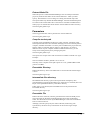
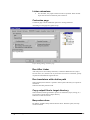
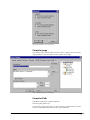
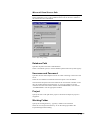
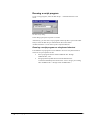
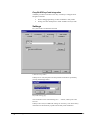
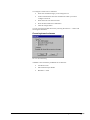
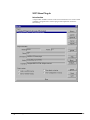
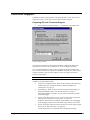
Creating a New Workspace
•
Select the ‘New Workspace…’ command from the ‘File’ menu
•
After prompted for workspace directory and name, browse for directory
of your choice (an empty new directory is recommended) and enter the
name for the workspace file.
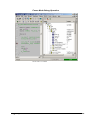
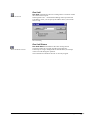
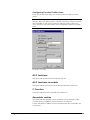
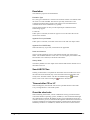
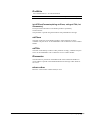
New Workspace dialog
A newly created workspace contains only default project and hardware settings.
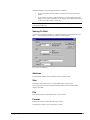
Saving Workspaces
Whenever the current workspace is to be closed, it is saved automatically. This
can happen either upon exiting winIDEA or opening or creating a new
workspace.
You can however explicitly save a workspace with the ‘Save Workspace…’
command. You will find this most useful when creating workspaces with the
same project and hardware configuration (which is often the case), and
sometimes with the same set of project files.
Software User's Guide winIDEA
•
Select the ‘Save Workspace…’ command from the ‘File’ menu
•
Browse for an existing workspace file or
•
browse for the desired directory and enter the name of the new
workspace file manually
•
Click the ‘Save’ button when finished
Development Environment • 13
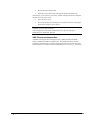
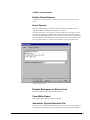
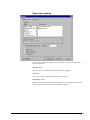
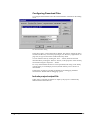
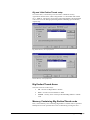
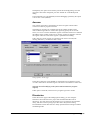
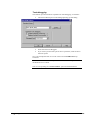
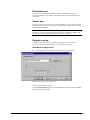
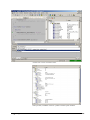
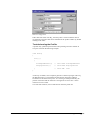
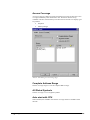
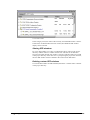
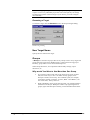
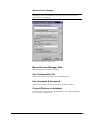
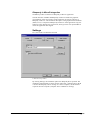
Backup a Workspace
winIDEA's workspace backup feature gives you the possibility to archive all
workspace files in a single file, which you can restore with the Restore
Workspace command.
To backup a workspace select the 'Backup Workspace' command from the file
menu.
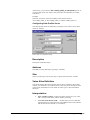
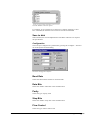
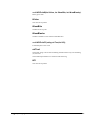
Backup Workspace dialog
When backing up a workspace, winIDEA always stores configuration files (.JRF
and .QRF) and project source files. Optionally, you can choose to backup project
output files (object, listing…) and download files.
To start the backup, click the 'Backup…' button and specify a file name. If your
backup target is on a removable disk, winIDEA swill ask you to provide enough
media to span the backup file.
Note: if possible, winIDEA will store file paths relative to the workspace file.
This way you can restore a workspace to a different directory. Files that are not
located in the workspace directory or one of its sub-directories are stored with
their absolute paths.
14 • Development Environment
Software User's Guide winIDEA
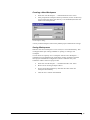
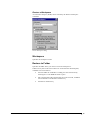
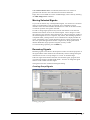
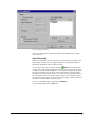
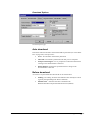
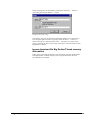
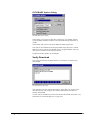
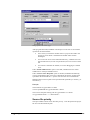
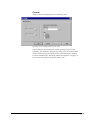
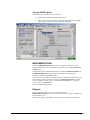
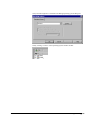
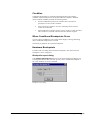
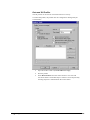
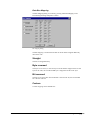
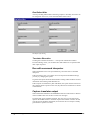
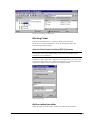
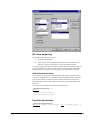
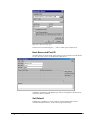
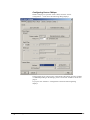
Restore a Workspace
An archived workspace (.WSB) can be restored by the 'Restore Workspace'
command.
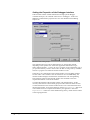
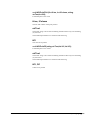
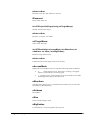
Restore Workspace dialog
Workspace
Specifies the workspace archive
Restore to Folder
Specifies the folder where you want to restore the workspace to.
If there are any files in the archive that were stored with their absolute paths,
winIDEA can restore them to:
Software User's Guide winIDEA
•
the same folder the .WSB file is residing, this can be achieved by
checking the ‘To the WSB file folder’ option
•
their original path. If the original path can not be accessed, winIDEA
restores the files to the 'Restore' sub-directory
•
the 'Restore' sub-directory
Development Environment • 15
Hardware Plug-In
The winIDEA environment can connect to any hardware tool via the iOPEN
interface. The 'hardware tool' is actually a software component that implements
the server side of the iOPEN interface and which in turn controls proprietary
hardware (or software like a simulator).
Through this interface the winIDEA can access following:
•
Debug functions like accessing memory, setting breakpoints,
manipulating CPU operation etc. including real-time trace, profiler and
coverage features (see "Debug Session" on page 97).
X190H
•
X
X19H
X
FLASH device-programming capabilities
(see "FLASH Programming" on page 221).
X192H
X
X193H
X
•
Memory device (RAM, ROM, and FLASH) simulation capabilities
•
Logic analyzer functions
When a plug-in is attached, it will insert its menus into winIDEA's through
which its specific configuration is performed.
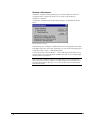
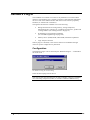
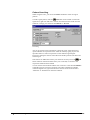
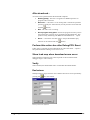
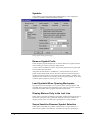
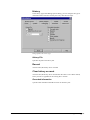
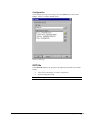
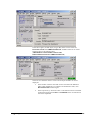
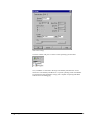
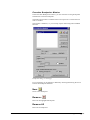
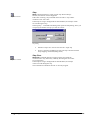
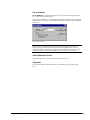
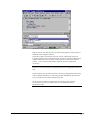
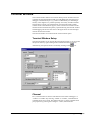
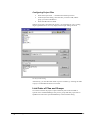
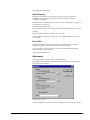
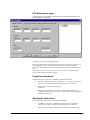
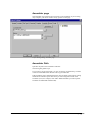
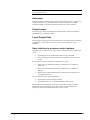
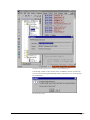
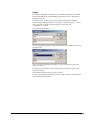
Configuration
The hardware plug-in can be selected by the 'Hardware Plug-In…' command on
the Tools menu.
The Hardware Plug-In selection dialog
Select the desired plug-in from the list.
Note: the list will only show plug-ins currently available. A plug-in is available
if its controlling component (a DLL) is located in winIDEA's \BIN directory.
16 • Development Environment
Software User's Guide winIDEA
Window Management
The winIDEA is a Multiple Document Interface (MDI) application, which means
that several documents can be viewed and edited at the same time. In this case
the term ‘document’ applies to source code files (typically C sources) for your
project that you create and edit using the built-in or an external editor, build
using the Build Manager and debug with the integrated debugger. The MDI
interface enables you to open and process one or more of your source files,
which are displayed in standard MDI child windows.
There is however plenty of other types of information to be displayed in
specialized windows, like the project workspace window (displaying project
hierarchy), the output window (displaying build output), specialized debugger
windows, etc.
Besides standard MDI windows, winIDEA introduces two more window types
that can be manipulated easier than MDI windows.
The type of the window can be set from its context menu:
•
MDI child – the standard window
•
Dockable – a window that can be docked like a toolbar
•
Mini Frame – a window that can be floated above other windows or
even outside the winIDEA application window
Dockable windows
Dockable toolbars have been around in mainstream Windows programs for some
years now, and everyone has come to appreciate that the toolbar is always visible
and at the same time not occupying any unnecessary desktop real estate.
winIDEA promotes the same concept to specialized windows that you will want
to have around all the time. Once they are docked, a document can not obscure
them, they are not subject to repositioning during tile and cascade operations and
they minimize desktop real estate consumption by not displaying a caption bar.
The area occupied by docked windows and toolbars is out of reach of your
documents. When a document is maximized, it will grow to occupy the
remainder of the winIDEA’s application window.
Software User's Guide winIDEA
Development Environment • 17
Typically you will create your preferred window layout along with colors and
fonts in a matter of minutes and then never feel the need to reposition a window
again. Your documents are then best viewed maximized. They can easily be
switched by the document selector bar, the ‘Ctrl+Tab’ keyboard shortcut or
through the window list on the ‘Window’ menu.
Docked Toolbars
Document area
18 • Development Environment
Docked windows
Software User's Guide winIDEA
Docking a Window
Window drag cursor
Place the mouse cursor on the border of the selected window (the
mouse cursor will change to the drag shape when placed over the
window border),
•
Hold down the left mouse button while dragging the window to its new
location.
•
Release the mouse button.
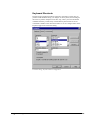
Mini Frame Windows
A mini frame window can be floated anywhere on the desktop. If placed over
winIDEA application window, it will overlap all its MDI and docked windows.
winIDEA and the Watch window as a mini frame window
Desktops
The window layout that you see in winIDEA is called a desktop. The Desktop
can be configured in any way, with opening additional windows, moving the
windows etc. The desktop configuration is saved with the workspace
information, so that every time you open a workspace, the window settings as
you saved them the last time are shown.
Four desktop templates are provided to simplify desktop configuration. They can
be selected using the View/Preset Desktop option. Any of those can, of course,
be modified to your preference.
Full screen operation
The working area of winIDEA can be enlarged to the whole screen. To enable
this option, select the View/Full Screen option. This hides the window control
Software User's Guide winIDEA
Development Environment • 19
and the menu bar and thus enables you to use the maximum workspace your
desktop allows.
With full screen mode, on the other hand, the menus are not visible. This can
sometimes cause you be unable to select menu entries. The menus can always be
invoked with the shortcut key (for example, by pressing Alt+F, the File menu is
invoked). You can select menus in the same way as if they were visible – that
means that you can also 'walk' through the menus with the arrow keys.
The full screen mode can be disabled by clicking the View/Full Screen option
again. The shortcut key for this is Alt+V for the View menu and F for Full
Screen.
Context Menus
Following Windows 95 guidelines for user interface design, every winIDEA’s
window has a context menu, activated either by a right mouse click in the
window or with a ‘Shift+F10’ keyboard shortcut.
You will find context menus richer in options and faster to manipulate than the
global menu. Along with toolbars, context menus make a trip to the menu bar a
rarity.
Toolbars
Toolbars provide easy, one-click access to most often used commands, which
have been grouped in following categories:
20 • Development Environment
Software User's Guide winIDEA
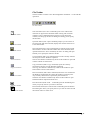
File Toolbar
The File Toolbar contains source file management commands - i.e. file and edit
operations.
The File Toolbar
New File button
Open File button
New File button (File / New command) opens a new edit window
which has no physical file attached. When working with such edit
windows a Save command request (explicit or upon closing the
window) will bring up the Save As dialog box asking you to specify
the file name.
Open File button (File / Open command) prompts you for a name of
an existing file and when selected, displays the contents of the file in
a new edit window.
Save File button
Save File button (File / Save command) saves contents of the current
edit window to its file. If the edit window has no file attached (when
opened with the File / New command), the 'Save As' dialog will open
and ask you to specify the name for the file.
Cut Text button
Cut Text button (Edit / Cut command) removes the currently selected
text and puts it in the Windows clipboard.
The Cut Text button is enabled only when an edit window is open and
contains a block of selected text.
Copy Text button
Copy Text button (Edit / Copy command) copies the currently
selected text and puts it in the Windows clipboard.
The Copy Text button is enabled only when an edit window is open
and contains a block of selected text.
Paste Text button
Paste Text button (Edit / Paste command) inserts the text contained in
the Windows clipboard at the current edit window's insertion point.
Any currently selected text is replaced by the inserted text.
The Paste Text button is enabled only when an edit window is open
and the Windows clipboard contains text.
Find Text button
Find in Files button
Software User's Guide winIDEA
Find Text button (Edit / Find… command) opens the Find dialog box
where you specify the text you wish to search for.
Find in Files button (File / Find In Files command) opens the Find in
Files dialog box where you specify the text you wish to search for and
the location where to search for it.
Development Environment • 21
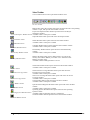
View Toolbar
View Toolbar buttons control specialized windows state.
The View Toolbar
Buttons that control the window state appear pressed when the corresponding
window is open, and up when the window is closed.
Project Workspace Window button opens and closes the Project
Workspace window.
Project Workspace Window button Available when a workspace is loaded.
Output Window button opens and closes the Output window.
Output Window button
Watch Window button
Variables Window button
Disassembly Window button
Memory Window button
Profiler button
Execution Coverage button
Access Coverage button
Trace Window button
Watch Window button opens and closes the Watch window.
Available when a workspace is loaded.
Variables Window button opens and closes the Variables window.
Available when a workspace is loaded.
Disassembly Window button opens and closes the Disassembly
window.
Available when a workspace is loaded.
Memory Window button opens a dialog where you specify the
memory area and the address you wish to view. After that a new
Memory window opens.
Available when the debug hardware is active.
The Profiler Window button opens and closes the Profiler window.
Available when a workspace is loaded.
The Execution Coverage Window button opens and closes the
Execution Coverage window.
Available when a workspace is loaded.
The Access Coverage Window button opens and closes the Access
Coverage window.
Available when a workspace is loaded.
Trace Window button opens and closes the Trace window.
Available when a workspace is loaded.
Special Function Registers Window button opens and closes the SFR
window.
SFR Window button
Available when a workspace is loaded.
Operating System Window button opens and closes the Operating
System window.
Operating System Window button
Available when an Operating System is configured.
Terminal Window button opens and closes the Terminal window.
.
Terminal Window button
22 • Development Environment
Software User's Guide winIDEA
Project Toolbar
Project Toolbar buttons control Build Manager operation
The Project Toolbar
Compile / Assemble button
Compile / Assemble button processes the file in the active edit
window. According to its type either the compiler or the assembler is
run.
Available when an edit window containing a project file is open.
Make button
Make button starts the 'Make' process in which all project files that
are 'out of date' (modified since their last compilation) are processed
according to their type.
Available when a workspace is loaded and Build Manager is idle.
Rebuild button
Stop Build button
Get Latest Version button
Check Out button
Check In button
Software User's Guide winIDEA
Rebuild button starts the 'Build' process in which all project files are
processed according to their type.
Available when a workspace is loaded and Build Manager is idle.
Stop Build button interrupts current Build Manager operation.
Available when Build Manager is active.
The Get Latest Version button gets the latest version of files from the
Source Control Database.
Available when the Source Control is configured and active.
The Check Out button Checks Out the selected files from Source
Control.
Available when the Source Control is configured and active.
The Check In button Checks In the selected files to Source Control.
Available when the Source Control is configured and active.
Development Environment • 23
Debug Toolbar
Debug Toolbar buttons control debug system operation
The Debug Toolbar
Debug Download button
Debug Download button performs an initialization (if necessary) and
a download to the debug system.
Available if the currently selected hardware supports debugging.
Reset button
Reset button performs an initialization of the emulator (if necessary)
and resets the CPU.
Available if the currently selected hardware supports debugging.
Run button
Stop button
Step Into button
Step Over button
Run button starts the CPU.
Available when debugging is active and the CPU is stopped.
Stop button stops the CPU.
Available when debugging is active and the CPU is running.
Step Into button performs a single instruction step when the
Disassembly Window is active or a single high-level language step
when the edit window is active.
Available when debugging is active.
Step Over button performs a 'Step Over' operation.
When the Disassembly Window is active, this will yield a single
instruction step unless a subroutine is called or a block instruction is
being executed. In such case, the subroutine (or the block instruction)
is executed in real-time and the CPU is stopped immediately
afterwards.
When the edit window is active, a single high level step in the current
high level function is performed, unless the step would take program
execution to a different high-level function. In such case CPU is set in
running until execution returns to the current function.
Available when debugging is active and the CPU is stopped.
Run Until button
Run Until button places the CPU in running until the current insertion
point (when the edit window is active) or marked instruction (when
the disassembly window is active) is reached.
Available when debugging is active.
Run Until Return button
Run Until Return button places the CPU in running until the exit from
the current high-level (C, C++) function is reached.
Available when debugging is active and the CPU is stopped inside a
high-level function.
Toggle Breakpoint button
Breakpoints button
24 • Development Environment
Toggle Breakpoint button sets (or clears) an execution breakpoint at
the insertion position in the active edit window, or the marked
instruction in the disassembly window.
Available when either edit or disassembly windows are active.
Breakpoints button opens the Breakpoints dialog, where all types of
breakpoints can be configured.
Available when a workspace is loaded.
Software User's Guide winIDEA
Document Management
Document Windows
The winIDEA is a Multiple Document Interface (MDI) application, which means
that several documents can be viewed and edited at the same time. The term
‘document’ applies to user generate files. The MDI interface allows opening and
processing one or more of your source files, which are displayed in standard
MDI child windows.
winIDEA supports following document types:
Software User's Guide winIDEA
•
ASCII text files
•
Logic analyzer files
Document Management • 25
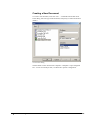
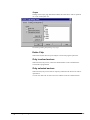
Creating a New Document
To create a new document, select the ‘New…’ command from the File menu.
In the dialog, select the type of the document, and specify its name and location
(folder).
New document dialog
The document can also be based on a template. A template is a pre-configured
file – in case of an Analyzer file, it contains CPU specific configuration.
26 • Document Management
Software User's Guide winIDEA
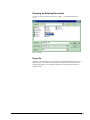
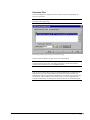
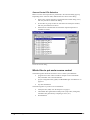
Opening an Existing Document
To open an existing document, select the ‘Open…’ command from the File
menu.
Open File dialog
Open As
Allows you to enforce the type of the document. By default the document type is
determined by file extension. The extension is matched to the extension of all
supported documents. If no matching document is found, the file is shown as
ASCII text file.
Software User's Guide winIDEA
Document Management • 27
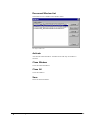
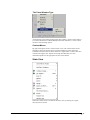
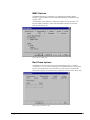
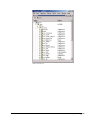
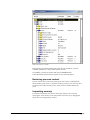
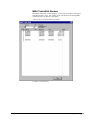
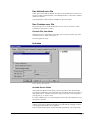
Document Window List
The Window list is available on the Window menu.
The Open window list
Activate
Activates the selected window. Available if one and only one window is
selected.
Close Window
Closes all selected windows.
Close All
Closes all windows.
Save
Saves all selected windows.
28 • Document Management
Software User's Guide winIDEA
Document Selector Bar
The Document Selector Bar displays names record of all currently open files as a
push button bar. When a file is opened a new button with its name is added to
the button bar.
Document Selector Bar
You can now keep your editors maximized all the time and switch between them
easily without making trips to the window menu.
Software User's Guide winIDEA
Document Management • 29
The Editor
The editor is the place where you will probably spend most of your time, both
when writing as well as debugging your sources. winIDEA’s integrated editor
supports you with basic functions for editing non-document type files, like:
•
find and replace operations
•
copy, cut and paste via system clipboard
•
drag and drop text operation
as well as some advanced programming aid features, like:
•
automatic indent
•
color syntax source coloring
•
debug watch tips, etc.
All editor related commands are available from the 'Edit' menu.
Selecting Text
Selecting a block of text is necessary when you wish to copy it to the clipboard,
move or copy it to another location using drag and drop, or erasing it.
Selecting Text with Mouse
30 • Document Management
•
Position the mouse on the place in the editor window where you wish
the selected block to begin,
•
Press the left mouse button,
•
While keeping the left mouse button pressed, drag the mouse to the
location where you want the selected block to end,
•
Release the mouse button
Software User's Guide winIDEA
Selecting a Block of Text with Mouse
Beside the regular selection, the editor can also select rectangular text blocks
(block selections).
•
Position the mouse on the place in the editor window where you wish
the selected block to begin,
•
Hold down the 'Alt' key and press the left mouse button,
•
While keeping the left mouse button pressed, drag the mouse to the
location where you want the selected block to end,
•
Release the mouse button
A block selection
Software User's Guide winIDEA
Document Management • 31
Selecting Text with Keyboard
•
Position the insertion point (caret) on the place in the editor window
where you wish the selected block to begin
•
Press the 'Shift' key
•
While keeping the 'Shift' key pressed, use movement keys to select the
desired block
•
Release the 'Shift' key
Selected Text in edit window
32 • Document Management
Software User's Guide winIDEA
Bookmarking the Text
When a text file is being edited, bookmarks can be set to the required locations.
This enables you to jump to bookmarks easier and doesn’t require you to
remember the locations in the text file by heart.
Bookmarked
locations
Source window with bookmarked locations
The bookmark is set or removed using the Edit/Toggle Bookmark menu option
or the keyboard shortcut Ctrl+F2.
When editing a file, you can immediately jump to the next bookmark location by
selecting Edit/Next Bookmark from the menu or by pressing the F2 keyboard
shortcut.
Software User's Guide winIDEA
Document Management • 33
Editing Bookmarks
The bookmarks can be edited using the Edit/Bookmarks… menu option or by
pressing the Alt+F2 keyboard shortcut.
Bookmarks window
In the Bookmarks window, you can manage the bookmarks currently set in the
edited file.
Goto
The editor jumps to the selected bookmark.
Delete
The selected bookmark is deleted.
Delete All
All bookmarks are deleted.
34 • Document Management
Software User's Guide winIDEA
Search and Replace Operations
Search and replace operations can operate on an entire source file, or just on
currently selected text (if any). You can search for whole words - characters in
front or behind the searched word must not be identifier characters (letters,
digits, and underscore), and it can be case sensitive or insensitive.
The Find dialog
Finding Text
•
Open the 'Find' dialog box,
•
Enter the string you wish to search for,
•
Specify search options (scope, case, whole words)
•
Select the 'Find Next' button to begin search
Replacing Text
•
Open the 'Replace' dialog box,
•
Enter the string you wish to search for and the string you wish to
replace it with,
•
Specify search options (scope, case, whole words)
•
Select the 'Replace All' to automatically replace all occurrences, or use
'Find Next' and 'Replace' button confirm replace of individual
occurrences
The Replace Dialog
Find Matching Brace option
The editor includes an option to find the matching brace. This option by default
does not have any keyboard shortcut assigned to nor is there an option in the
menu. Therefore, a keyboard shortcut must be manually selected in the
Tools/Customize menu. In the Keyboard shortcut configuration menu the
Software User's Guide winIDEA
Document Management • 35
command for this option, “EditorFindMatchingBrace”, can be found in the
category “Plugin: Editor”. Select a keyboard shortcut that would best fit your
needs.
Customize dialog, Keyboard shortcut configuration
For more information, see “Keyboard Shortcuts” on page 342.
X194H
X
X195H
X
Clipboard operations
winIDEA supports Windows clipboard copy, paste and cut operations.
Copying Text to Clipboard
•
Select a block of text
•
Select the 'Copy' command from the Edit menu.
Cutting Text to Clipboard
•
Select a block of text
•
Select the 'Cut' command from the Edit menu.
The selected block will be removed from the editor.
36 • Document Management
Software User's Guide winIDEA
Pasting Text from Clipboard
•
Make sure the desired text is placed in the clipboard.
•
Position the insertion point to the place where you wish to insert the
text
•
Select the 'Paste' command from the Edit menu.
Drag and Drop
A quick alternative to clipboard's copy and paste operation when it comes to
simple move or copy operations inside winIDEA is the usage of editor's drag and
drop ability.
Moving Text using Drag and Drop
•
Select a block of text
•
Place the mouse cursor over the selected block of text – the text drag
cursor will replace the I beam cursor
•
Press the left mouse button
•
While keeping the left mouse button pressed, move the mouse to the
location where you wish to move the selected block
•
Release the mouse button
Copying Text using Drag and Drop
Software User's Guide winIDEA
•
Select a block of text
•
Place the mouse cursor over the selected block of text – the text drag
cursor will replace the I beam cursor
•
Press the left mouse button
•
While keeping the left mouse button pressed, move the mouse to the
location where you wish to move the selected block
•
Before releasing the mouse button, press the 'Ctrl' key.
•
While keeping the 'Ctrl' key pressed, release the mouse button.
Document Management • 37
The Context Menu
Edit Window's context menu
In the editor's popup context menu, you will find editor, build and debug
commands that are used most often.
38 • Document Management
Software User's Guide winIDEA
Editor Properties
Selecting the 'Properties' command from the context menu brings up a mini
frame window showing properties of the current editor.
Editor Properties
Printing
winIDEA supports simple printout of the current editor window or selection
contents.
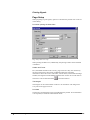
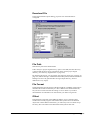
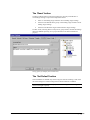
Page Setup
In the Page Setup dialog the header, footer and paper margins are configured.
Page Setup dialog
Header and Footer
You can configure any text as header or footer, as well as insert strings provided
by winIDEA, such as file name, current date and time, etc. These macros are
available by clicking the '>' button on the right of the edit line’s.
Margins
You can specify margins on all 4 sides of the paper.
Note that paper size, as well as other printer properties, is configured in Printer
Settings available from the Print dialog.
Software User's Guide winIDEA
Document Management • 39
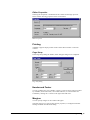
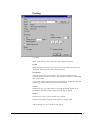
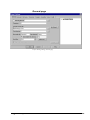
Print
In the Print dialog, the printer, its settings, print range and optional coloring are
configured.
Print dialog
Printer
Shows the printer on which the text will be printed. Use 'Settings…' to change
the printer or its properties.
Range
Specifies whether the entire source file or only the current selection should be
printed.
Use Colors
When checked, text will be printed in the colors used on the screen.
Print
Starts printing.
40 • Document Management
Software User's Guide winIDEA
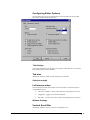
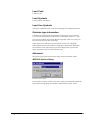
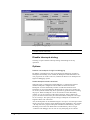
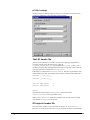
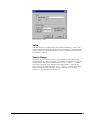
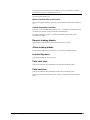
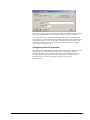
Configuring Editor Options
Several editor options can be customized. You will find them all in the editor
pane of the Options dialog (Edit menu).
Editor Options pane
Tab Settings
Tab settings determine how the editor will interpret Tab characters in a file and
how Tab keystrokes will be handled.
Tab size
determines character indent of each Tab character in the file
Selection margin
Left mouse action
The action upon the left mouse button click in the editor’s selection margin is
configurable between:
•
Line select (default) – allows easier selection of multiple lines of text
•
Toggle BP – toggles an execution breakpoint
•
Run until – runs the CPU until it reaches the indicated source position
Window Settings
Vertical Scroll Bar
determines whether a vertical scroll bar is displayed or not.
Software User's Guide winIDEA
Document Management • 41
Horizontal Scroll Bar
determines whether a horizontal scroll bar is displayed or not.
Enable syntax coloring
when checked, files which are compiled (typically .C files) are colored assuming
ANSI C syntax.
Enable Watch Tips
when checked placing the mouse cursor over an expression that can be
evaluated, evaluates and displays its value.
See "Watch Tips" on page 45.
X196H
X
X197H
X
Display Program Line Markers
When selected, a couple of characters wide margin is reserved for special
markers like bookmarks, breakpoints, etc. on the left side of the editor. This way
painting of indicators does not obscure syntax coloring or text selections.
Drag and Drop Text Editing
When enabled, the text can be dragged and dropped.
Protect Read-only Files from Editing
when checked, winIDEA will refuse to edit files with read-only attribute set.
When cleared, winIDEA will allow editing but will ask for a new file name
when attempting to save or close the modified file.
Disable Editing
When checked, winIDEA opens all files as read-only i.e. it will not allow any
modifications to their contents.
Save to Unix format
When checked, the file is saved to Unix format. This means that when checked,
text files are saved with LF only line delimiter. The default DOS format uses
CR-LF delimiters.
Default Auto Indent
New line indentation is set to the same value as in the previous line.
Smart Auto Indent
New line indentation is set according to the text before previous editor caret
position. Additionally you can choose to indent open and/or closing brace. Smart
indent is supported only when editing C/C++ source or header files. Indentation
step is the same as current tab size.
42 • Document Management
Software User's Guide winIDEA
Further Customization
Enable Virtual Spaces
If enabled, the insertion point caret can be moved to locations where no text
exists.
Insert Spaces
Specifies whether Tab keystrokes are written to file as Tab characters or an
equivalent number of whitespace characters is written.
You may choose not to insert spaces to preserve disk space, this may however
cause source debugging problems with compilers that generate column debug
information and usually interpret tabs as 8 characters long. If you see displaced
position indicators when debugging, either change the tab size to whatever size
your compiler assumes, or select the 'Insert Spaces' option in the first place.
Customize Options pane
Disable Backspace at Start of Line
Prevents joining of lines using the Backspace key.
View White Space
Shows white space characters (blanks and tabs).
Assembler Syntax Definition File
Since there is no syntax standard for assemblers, the syntax must be configured
in a definition file specified here. The dialog will list all syntax definition files
Software User's Guide winIDEA
Document Management • 43
located in the ‘CCS’ subdirectory of winIDEA’s installation directory. If no
color syntax coloring is required, leave the field blank. For more intormation on
CCS file specification please see "Color Syntax Files Definition" on page 382.
X198H
X
X19H
X
Customizing Colors
The colors can be customized to your specific requirements. This can be done in
the Editor/Options/Colors pane.
Editor Options, Colors pane
For every different view a color and font can be set. The color of the foreground
and the background can be selected using the appropriate tabs, and the font using
the ‘Select Font…’ tab.
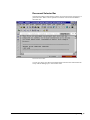
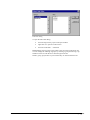
Find in Files Utility
The Find in Files Utility is an integrated multi-file string search utility. With its
aid, you can easily search for any string occurrence in any number of files.
To initiate the search, select the 'Find in Files…' command in the File menu. In
the dialog that opens, select all of the files you wish to include in search.
44 • Document Management
Software User's Guide winIDEA
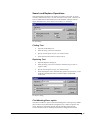
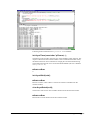
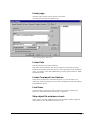
The Find in Files dialog
First, the string to be searched must be defined in the 'Find what' box and the file
types or file names in the 'In files/file types' box and the base folder, in which the
string is to be searched.
The search string can be replaced with another, if the ‘Replace with’ option is
checked and the replacement string is entered.
The search options can be defined next, whether only whole words should be
found, the case should be matched and whether to look for occurences in
subfolders.
You can easily include all your project files by checking 'Include Project files',
files that they depend on by checking 'Include project Dependencies', or any
number of files and directories of your choice, you have entered in the 'Look in
additional folders' box. If 'Scan all matching files in folder' is checked, all files
matching the 'In files/file types' description in all folders, where project files (if
'Include Project files' is checked) or project dependencies (if 'Include project
Dependencies' is checked) reside.
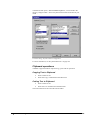
Find in Files results are shown in the Output Window (see "Output Window" on
page 264) on the Find In Files pane. Simple double clicking on a line displayed
in the Output Window will open the file and position you at the place where the
string was found.
X20H
X201H
X
X
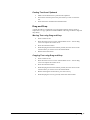
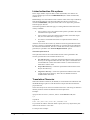
Watch Tips
Watch Tips are an advanced debugging aid. Instead of entering the variable
name whose value you wish to view, you can let the mouse cursor rest over the
variable name in the editor for a moment. Its value (if it can be calculated) is
displayed in a small popup 'Watch Tip' which goes away when you move the
mouse again or start using the keyboard.
szXDATA variable value shown in a Watch Tip
Software User's Guide winIDEA
Document Management • 45
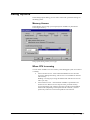
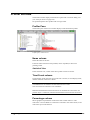
The Trace
The Trace is a specially developed solution to make debugging easier. The Trace
records the required data through the debug interface.
The Trace window is a document inside winIDEA. This gives the user the
possibility to save all recordings into a file. Trace files have a .TRD extension.
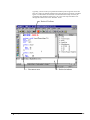
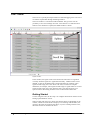
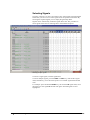
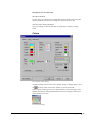
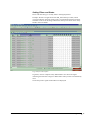
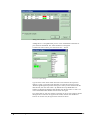
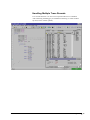
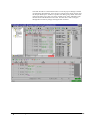
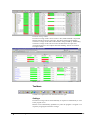
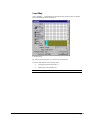
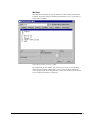
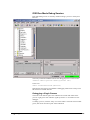
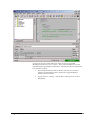
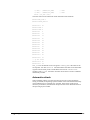
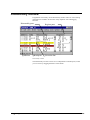
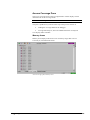
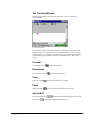
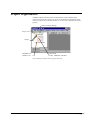
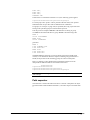
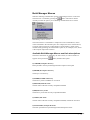
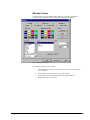
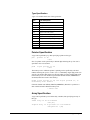
When a Trace document is opened, the default window is shown.
Default window
In this window, the signal values can be monitored. The times are organized
vertically while the signals are organized horizontally. Different states can be
defined. A state can be defined with a simple statement (for example, when
signal CH100 is high, this is the "Power On" state) or with more complex
definitions (for example, when signal CH100 is high or signal CH101 is low and
signal CH102 is high, this is the "Normal" state). The states are shown in a
special column. The Timing and State views are described in detail later.
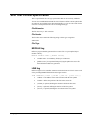
Getting Started
To start using the Trace, the first step is to configure the hardware. Please see the
Setting up the Hardware section.
When working with the Trace, please note that the menus are dependent on the
window, which is focused. If for example you are working with the Editor, the
options in the menu are related to the editor, if you are working with the Trace,
the menus shown are related to the Trace.
46 • Document Management
Software User's Guide winIDEA
To focus a window, left-click on it. The focused window can be identified with
two blue stripes in the name or description of the window.
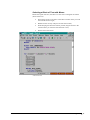
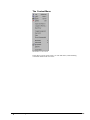
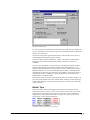
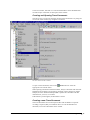
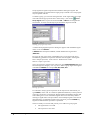
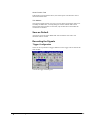
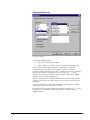
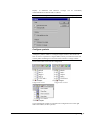
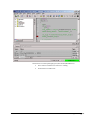
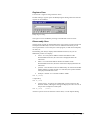
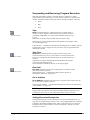
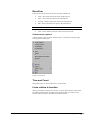
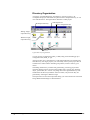
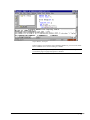
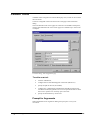
Creating and Opening Trace Documents
The easiest way to create new and open existing Trace documents is by using the
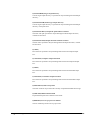
icons in the View toolbar or by using the View menu.
The View menu and View toolbar
To open a Trace document, click on the
appropriate one from the menu.
Trace button or select the
When opening a document with these buttons, always a document with the same
filename as the workspace is opened. For example, if the workspace is named
Sample, the Trace document Sample.TRD is opened. If a document with this
name does not yet exist, it is created.
If the button is pressed again, the document is closed.
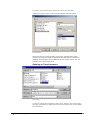
Creating a new Trace Document
The Trace documents are saved in separate files with all details. If a special
recording is required, that you would not like to save as the default Trace
document, a new Trace document can be created.
Software User's Guide winIDEA
Document Management • 47
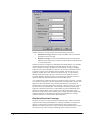
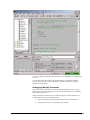
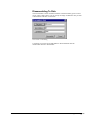
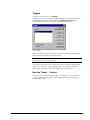
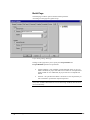
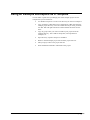
To create a new Trace document, select ‘New’ from the ‘File’ menu.
A dialog box appears where a new file name and file location is entered.
New file dialog
When new files are created, templates can be used. Template files are files
located in the Templates folder (located under the folder where winIDEA was
installed). Some templates are provided, but the user can also use his own. The
templates will be discussed later on.
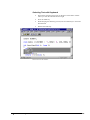
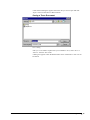
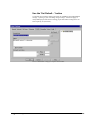
Opening an Trace Document
Open dialog
To open an existing Trace document, select ‘Open’ from the ‘File’ menu. This is
especially useful if the recordings have been saved to another file, not the default
Trace document.
48 • Document Management
Software User's Guide winIDEA
A file selection dialog box appears. Select the file you want to open and click
‘Open’. The Trace files have a TRD extension.
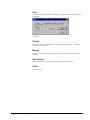
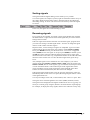
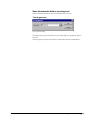
Saving a Trace Document
Save as dialog
After you’ve recorded a sequence that you would like to save, select ‘Save’ or
‘Save As’ from the ‘File’ menu.
A dialog box appears where the default name can be confirmed or a new one can
be entered.
Software User's Guide winIDEA
Document Management • 49
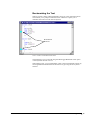
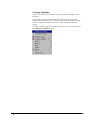
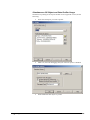
Creating Templates
The user can create his own templates for all documents, including the Trace
document.
In a template, all settings will be saved and new files with the same initial
settings can be generated. This is especially useful when, for example, multiple
Trace recordings are needed, but all with the same settings for signals and
groups.
To create a template, right-click with the mouse in the Trace window and select
the 'Add File to Templates' option.
The Add File to Templates option
50 • Document Management
Software User's Guide winIDEA
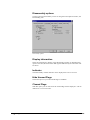
The Trace Window Type
All documents can be either docked in the main window, used as a mini frame or
as a normal document in a MDI (Multiple Document Interface). Use the context
menus to select docking options.
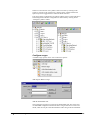
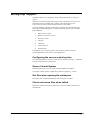
Context Menus
By right-clicking the mouse a context menu occurs. The content of the menus
depends on where the mouse has been clicked. Different context menus are
available when the mouse has been clicked on a signal name or when it has been
clicked in the signals area. Options are briefly described here, for more
information please see the appropriate section in the manual.
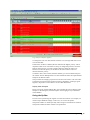
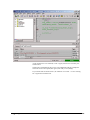
State View
When the context menu is invoked in the State view by clicking on a signal,
these options are shown.
Software User's Guide winIDEA
Document Management • 51
Insert File into Project
The Trace file can be inserted into the project into any of the existing groups.
Add File to Templates
The Trace file can be saved as a template with this option.
Configure Trigger
The trigger can be configured here.
List Triggers
Displays the list of Triggers.
Jump To
This option allows you to jump to the Trigger Position, the Pointer or the Source.
The option Synchronize allows you to synchronize the two views (Timing and
State).
Markers
Markers can be set and removed and the zero point can be set and reset.
Search
The Search option allows you to find occurrences of certain samples. Also, the
next and the previous occurrence can be found.
Signals
The Signals dialog is invoked with this option.
States and Filters
The States and Filters dialog is invoked with this option.
Options
The Trace Options can be set in the Options menu.
Set Default Options
By selecting this option, the current view options will be used when creating a
new document.
Relative Time
The time can be displayed in either absolute format or relative to the CPU start.
If relative time display is desired, select this option.
52 • Document Management
Software User's Guide winIDEA
Working with Signals
A Signal is a base unit when working with the Trace and represents data,
monitored through Trace. The signals can be edited either in the Signals menu or
in the main Trace window in State or Timing view.
There are a few rules concerning signal names:
Software User's Guide winIDEA
•
Signal names must start with the character ‘A’ trough ‘Z’, ‘a’ trough ‘z’
or underscore. They mustn’t start with the number or any other nonalpha character. Also, the space and local characters can not be used in
the signal name.
•
The signal names are case insensitive, therefore the name A001 and
a001 are the same signal.
•
The leading zeros in the signal name are ignored, therefore the name
A001 is the same signal as A1.
Document Management • 53
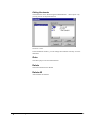
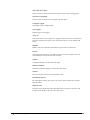
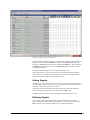
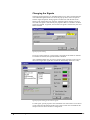
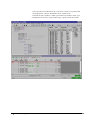
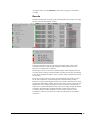
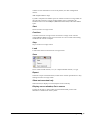
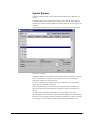
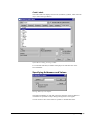
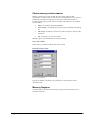
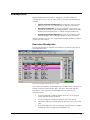
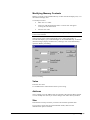
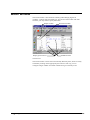
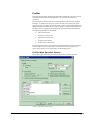
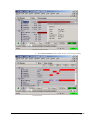
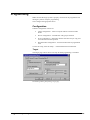
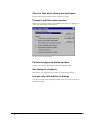
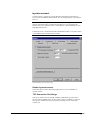
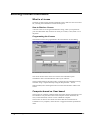
Editing Signals in the Signals dialog
The signals can be managed in the Signals dialog, invoked in the Edit/Signals
menu, by pressing the shortcut S or by clicking on the
icon in winIDEA.
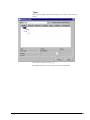
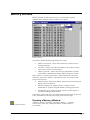
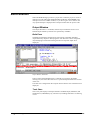
Configure Signals
Signals dialog
Selecting the signals is best done with the mouse. The Signals dialog utilizes
both mouse buttons. The left mouse button can be used as in every other window
in Windows:
•
To select a single signal, click the signal name,
•
To select multiple signals, press the SHIFT or CTRL key, click the first
signal name, hold the key, move the mouse pointer over another signal
name and left click – the SHIFT key selects all signals between the two
mouse clicks, the CTRL key selects only the signals you click on. The
combination of SHIFT and CTRL keys can also be used.
To edit the selected cell or cells, click on the cell, which has last been selected
(the focused cell). The left-click anywhere outside the focused cell unselects the
cells.
The right mouse button is used in this dialog strictly for editing. You can rightclick on any selected cell and this will invoke the editing of that field. By using
the right mouse button there is no fear to lose the cell selection.
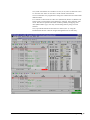
The first column shows the hardware related channel names, which can not be
changed and displays the type of the signal shown in that row.
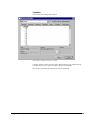
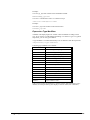
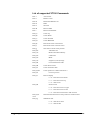
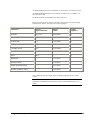
In general, there are four types of signals, marked with different icons:
•
54 • Document Management
Physical signals
Software User's Guide winIDEA
Each channel corresponds to one physical connection
•
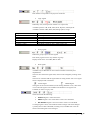
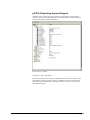
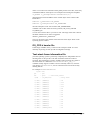
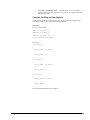
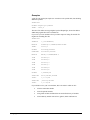
Logic signals
Defined by user (with expression similar to C expressions)
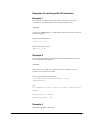
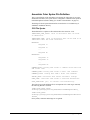
Available operators: OR, XOR, AND, NOT, EQUAL, NOT EQUAL
Available constants: HEX, DEC, BIN, debug symbol, strings
Expression:
CH100
CH100==0
CH100 & CH101
ADR1==0x100
ADR1=={Type_Struct}
Content==”mov”
Evaluates to one when:
CH100 equals 1
CH100 equals 0
CH100 equals 1 and ch101 equals 1
ADR1 equals 0x100
ADR1 equals value of symbol Type_Struct
CONTENT signal has “mov” string in state view
•
Group signals
Defined as group of up to 64 other signals
Each binary signal can be in any number of groups
Display mode can be set to HEX, BIN or DEC
•
State signals
Available only in TRD files for trace and in LAD files if bus analysis is
implemented
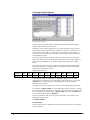
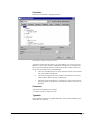
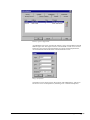
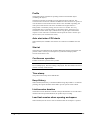
The next cell contains the signal name, which can be changed by clicking on the
name.
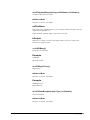
The next two columns hold the signal status for timing and for state view. Signal
status is displayed with a checkbox.
Visible Signal
Hidden Signal
The signal can also be unavailable (in both Timing and State views). This status
occurs when the signal is not available in the hardware. If a signal is not
available, its name is in gray color.
These states mean the following:
•
Enabled. Signal is visible and active.
•
Hidden. Signal is not visible and its value is not calculated.
•
Not Available. Signal is not active and its value is not calculated.
To change signal’s status, click inside the white rectangle. The status changes
cyclically from visible to disabled (in timing view) to hidden state. Also the
status of selected signals can be changed.
Software User's Guide winIDEA
Document Management • 55
To change the ‘Not Available’ state, the hardware configuration must be
changed. The signal corresponds to the physical signal on the inactive module –
refer to Hardware User’s Guide, the ‘Trace’ section.
The fifth column holds the colors of the signal line, signal background and the
value. To change it, click on the colored rectangle. A color selection pop-up
appears. The procedure to change color is the same as already explained in the
subchapter “Global Settings”.
Expressions are displayed in the next column, but only for logical and group
signals. To change the signal’s expression, double-click or right-click the cell.
This invokes the ‘Define Logical Signal Expression’ or the ‘Define Group Signal
Expression’ dialog depending on the signal type. If the expression is not valid,
the old expression is preserved.
The display mode of signals can be changed. The values can be displayed
Binary, Decimal or Hexadecimal. The display mode can only be changed for
signals that evaluate to more than one bit (if a signal only has a logical state of 0
or 1, the display mode can not be changed).
You can describe every signal in the ‘Descriptions’ field for better explanation.
Insert Group
To insert a new group, press the Insert Group button. Creation of groups will be
discussed in detail later.
Insert Signal
To insert a new logical signal, press the Insert Signal button. Creation of signals
will be discussed in detail later.
Delete Signal
To delete a signal, press the Delete Signal button.
Only logical, group and 'Not Available' signals can be deleted. Physical signals
(channels) can not be deleted. To delete a signal, select it and select ‘Delete’
from the pop-up menu or press the shortcut Del. A message box will appear
asking you to confirm the deletion.
Let’s take a look at the following signals:
A = CH100 & CH101
B = A & CH102
B signal is dependent on A signal. If A signal is deleted, B signal will be
removed as well.
When a group signal is created, all contained signals become hidden by default.
If such a signal is deleted, all contained signals are displayed back.
56 • Document Management
Software User's Guide winIDEA
Sorting signals
The signals inside the Signals dialog can be sorted by every column.
To sort the signals, for example, by name, right-click the button Name on top of
the column. Right-click the button again to alternate between ascending and
descending sorting. An arrow will occur next to the name by which the signals
are sorted.
In this case, the signals are sorted ascending by name.
Renaming signals
Every signal can be renamed. To rename a single signal, double-click with the
left mouse button or right-click the name of the signal that you wish to rename
and type the new name.
If the new signal name matches the name of some other signal, program warns
you with error message “Invalid Signal Name”. You have to change the signal
name to avoid conflict with other signals.
Repetitive tasks, such as naming bus signals are simplified. Type a new name
with an index at the tail of the name. For example: rename CH103 to DATA1.
Don’t press ENTER. Instead, press the down arrow. You can see a suggested
name (DATA2) for the next signal. To accept it press ENTER, to discard it press
the ESC key and to continue renaming signals press down arrow again. Auto
decrement works in the same way, except that the number at the end of the name
decreases until it reaches zero. To auto decrement signal name, press the up
arrow.
Also, multiple signals can be renamed at once. For example, if you wish to
rename signals from CH100 to CH104 to A100 to A104, select the signals from
CH100 to CH104, edit one of the signals, type A instead of CH, then press Enter
or click outside the edit box. The numerical part of the signal name will be
preserved and the text part of the signal name will be changed. If the name
contains no numerical information, the name will not be changed.
If the entered signal name already exists, the previous name will be preserved.
Immediately after the new name is accepted, the changed signal name is visible
in the signal names area.
To accept all changes click ‘OK’, to discard them, click ‘Cancel’ or press ‘ESC’.
The signal can be renamed regardless of its status (hidden, disabled, visible).
The signals can be displayed in the Signals window all at once or by groups. To
select just a certain group of signals, deselect 'All' and select the required group.
For example, to display the Group signals, deselect 'All' and select 'Group' only.
Software User's Guide winIDEA
Document Management • 57
Selecting Signals
On many occasions it is more convenient to have some signals grouped together
and for this you have to move some signals from one position to the other. By
selecting the required signals you can simply drag and drop them.
Signals can be selected only within the signal names area. The procedure to
select signals is the same as selecting files in the Windows Explorer.
Selecting multiple signals
To select a single signal, click the signal name.
To select multiple signals, press the SHIFT or CTRL key, click the first signal
name, hold the key, move the mouse pointer over another signal name and left
click.
For example: press and hold the SHIFT key, left click the X5 signal name, move
the mouse over the signal X7 and left click again. Selected signals are now
highlighted.
58 • Document Management
Software User's Guide winIDEA
Selecting multiple signals not in sequence
To select multiple signals that are not in sequence do the following: left click the
X3 signal, press and hold the CTRL key and left click the X4 signal. Move the
mouse over the X8 signal and left click. Still hold the CTRL key, press and hold
the SHIFT button, move the mouse over the X10 signal and left click. You can
now depress both keys.
To deselect selected signals, left click within the signals area.
If the main window is split, some signals can be selected in the upper and the
others in the lower window. This is useful in case you are working with many
signals and not all of them can be displayed at once.
Hiding Signals
Sometimes it is convenient for the user to be able to hide certain signals that he
currently does not use or require. This way, a bigger number of signals important
to the user can be seen at once on the screen.
Select the signals to hide. Within the signal names area right click and select
‘Hide’ from the pop-up menu or press the shortcut CTRL + H.
A hidden signal can be shown again through the Configure Signals menu.
Deleting Signals
Only logical, group and 'Not Available' signals can be deleted. To delete a
signal, select it and select ‘Delete’ from the pop-up menu or press the shortcut
Del. A message box will appear asking you to confirm the deletion.
Software User's Guide winIDEA
Document Management • 59
Changing the Signals
Changing signal properties is a straightforward process. Select signals and right
click within the signal names area. From the pop-up menu, select ‘Properties’
and the ‘Signal Properties’ dialog appears. Double-click with the left mouse
button on the signal name area opens the ‘Signal Properties’ dialog as well. If
more than one signal is selected only the properties that are common to all these
signals are enabled. In general, if more than one signal is selected only the color
field is enabled.
Signal properties dialog
In case if a logical signal or a group signal is selected, all the fields are enabled.
If a channel is selected, the expression field is disabled.
Also, a different dialog can occur for a specific signal, especially in the case of
the Content signal (the signal that contains the disassembly and source code).
Signal properties dialog for the Content signal
For this signal, special properties can be defined. The content that is to be shown
can be selected in this dialog and the colors of the content can be modified. The
sample content is shown for easier configuration.
60 • Document Management
Software User's Guide winIDEA
If the 'Show Function Tree' is unchecked, the function tree will not be
generated. The Function Tree will be discussed in more detail later.
Empty lines can be hidden for a more readable display. This is done by checking
the 'Hide Empty Lines' checkbox.
Moving Selected Signals
If you want to monitor only a few dependant signals, it is much more convenient
if they are located side by side. For example, if we would like to inspect
channels 10 and 121 and would like them both to be visible in the same window,
we need to reposition one signal to the other.
In order to change signal positions they must be selected first. Left click and
hold the mouse button on one of the selected signals. Cursor changes to reflect
the currently active operation. Move the mouse up or down to drag the signals. If
the selected signals are not in a sequence, they will be, after the drag operation is
completed. While you drag with the mouse a hashed line is displayed under the
cursor, which helps you to visually determine the new position for the signal. If
the cursor passes the application borders or signals area, the program ensures
that the dashed line (target position of signals) is always visible.
To cancel the drag operation, press the ESC key.
Renaming Signals
Renaming signals can be done in the Properties window. Invoke the properties of
the signal and the 'Name' field will be automatically selected. Change the signal
name and click ‘OK’ to accept changes or ‘Cancel’ to discard changes.
If the new signal name matches the name of some other signal, program warns
you with error message “Invalid Signal Name”. You have to change the signal
name to avoid conflict with other signal.
The signals can be also renamed in the Signals dialog.
Creating Group Signals
Creating group signals
Software User's Guide winIDEA
Document Management • 61
Group signals are signals composed from channels and logical signals. The
maximum number of signals within a single group is limited to 64. Group signal
may be equaled with bus.
To define a group, you can select the signals first. In the signal names area right
click and from the pop-up menu select ‘Insert Group’, click on the
Insert
Group Signal button or press the shortcut CTRL + SHIFT + G. If signals are
selected first, its names will already be placed into the Expressions field.
Defining group signal expressions
A ‘Define Group Signal Expression’ dialog box appears with the default signal
name, in our case GROUP1.
If GROUP1 has already been defined, another default name is generated
(GROUP2).
First type the new group name, if the default one is not accepted. The Trace
automatically generates an expression from the selected signals. If the signals
form a unique expression, ‘From’ and ‘To’ fields become visible.
What is a unique expression?
This is an expression, which can be written in a form: PREFIX[FROM..TO]. Most
buses belong to this category. It is very rare to define a group signal from signals
with different PREFIX for example: SD0, SD1, AD0, AD1.
Entering expressions
It is allowed to freely type the expression in the ‘Expression’ field. While you
type PREFIX, ‘From’ and ‘To’ fields are updated automatically. If the expression
cannot be converted to a unique form, these fields become disabled. On the right
side of dialog box is a list of available signals that can be selected by double
clicking on signal names. The procedure to select multiple signals is the same as
described above. To add these signals to the expression, press the ENTER key.
Signals are added and the expression is optimized.
There are usually two reasons that prevent you to add a new group signal:
62 • Document Management
•
The signal name is not valid.
•
The expression is not valid.
Software User's Guide winIDEA
If an expanded group is selected, all the contained signals are selected as well.
Individual signals inside a group cannot be selected, only a whole group.
Software User's Guide winIDEA
Document Management • 63
Creating Logical Signals
Creating logical signals
Logical signals are signals made of channels, group signals and other logical
signals separated with logical operators.
Sometimes in the specific target device (e.g. CPLD or FPGA) a logic signal is
generated from target signals and you would like to observe its state even if it’s
not available on the target (e.g. signal exists only internally in the FPGA). In
such cases, the Trace allows you to define equivalent logic signal combined of
measured target signals.
To insert a logical signal, you have to move the mouse cursor over the signal
names area and right click. From the Edit pop-up menu, select ‘Insert Signal’ or
press the shortcut CTRL + L. A ‘Define Logical Signal Expression’ dialog
opens.
Enter the signal name, then click inside the ‘Expression’ field and start typing
the logical expression. A logical signal can be composed also by clicking the
signal names and operator buttons.
Supported operators are:
Operator
NOT
Symbol
!
OR
|
AND
EQU
NEQU
XOR
HEX
BIN
&
=
!=
^
0x
%
Symbol
String
{}
""
After selecting ‘OK’, the expression is validated. If there are errors in the
expression the message box occurs informing you about the error. For example
“CH104)” is not a valid expression and a message box will be displayed
informing you about that.
Compact form of group expressions is not allowed in logical signal expression.
For example, “CH[100..102]=2” is not a valid logical signal expression. A dialog
box will be displayed informing you that “CH” signal is not defined. Instead you
have to define group signal first e.g. “CH[100..102]” and name it as DATA. Now,
you can define logical signal as DATA = 2.
It is not permitted to enter recursive logical expressions. For example, if you
define logical expressions:
A = CH100 & CH101
B = A & CH102
The second expression is dependent on the first expression. But let’s change the
first expression to:
64 • Document Management
Software User's Guide winIDEA
A = B & CH101
The program finds an error in expression and informs you that recursive
expressions are not allowed.
Let’s take a look at the next expressions:
GROUP = CH[100..102]
LOGICAL = GROUP
This is a valid expression. It evaluates to 0 whenever GROUP equals 0 and
evaluates to 1 for all other values of GROUP signal.
To add multiple logical signals click the
toolbar or press the shortcut S.
Configure Signals button on the
The 'Signals' menu is shown. Deselect the 'All' option and only leave the
'Logical' option checked. The procedure for entering names and expressions is
the same as the procedure for entering names and expressions for group signals.
New signals can be added using the 'Insert Signal' button.
Note that signal names are case insensitive; therefore ‘MREQ’ is the same signal
as ‘mreq’. To avoid uppercase/lowercase confusion, it is recommended to use
either lowercase or uppercase characters for all signal names.
Software User's Guide winIDEA
Document Management • 65
Printing Signals
Page Setup
When preparing to print signals, options to customize the printed view can be set
in this dialog.
Print when printing the State View
Page Setup, State View setup
When printing the State View, additionally the printing of filters can be enabled
or disabled.
Header and Footer
First, the Header and the Footer of every page can be set. They can contain any
text and certain macros have been predefined which insert important
information. These macros are: File Name, Current Time, Current Date and Page
Number; the alignment of the Header and the Footer can also be set with macros.
The macros can be entered with the
insert macro button.
The Margins
The margins can be entered either in inches or in centimeters. The margins for
every side of the page can be set.
Print data
Certain parts of information can be excluded from the printout. If an information
is to be printed, it should be checked under 'Print'.
66 • Document Management
Software User's Guide winIDEA
Printing
Print dialog
Select ‘Print’ from the ‘File’ menu. The ‘Print’ dialog box appears.
Printer
Select the appropriate printer if you have access to more than one printer. The
‘Properties’ button opens the printer driver properties.
Print Range
The range to be printed can be set here. The range can be either the range
currently shown on screen, the range can be set between markers or all recorded
data can be printed.
You can then choose to print only the selected signals by checking the ‘Selected
signals only’ option, otherwise all signals will be printed.
Copies
If more than one copy of the printout is required, the desired number can be
selected here. With the ‘Collate’ option, the print order is defined.
Options
Check the ‘Use colors’ option to enable color printing.
Check the ‘Fit signals to page’ to fit all signals to one page width.
After all settings are correct, click the ‘OK’ button.
Software User's Guide winIDEA
Document Management • 67
Setting up the Environment
Global Settings
General options
All global settings are set in the ‘Trace Options’ dialog. To change settings, click
the
‘Options’ button on the Trace toolbar, select the Edit/Options in the
menu or press the shortcut E.
Trace Options, General dialog
In this dialog, general Trace settings can be modified.
The signal names and bus values in the timing view and the signals in the state
view are shown with the default font. To change the font type and size click on,
for example, ‘Signal Names’. On the right the current font will be shown. With
the Change button another font can be selected. Only monotype fonts are
available.
A different printer font can be selected for both the timing and the state view.
The defined font is used when signals are printed.
The option whether the toolbar should be visible or not is also present on this
display. If a larger viewable size is required, the toolbar can be turned off. The
toolbar can be turned on again by checking the 'Show Toolbar' option again. The
options dialog is accessible with the shortcut key 'E' or by right clicking in the
Trace window and selecting 'Options'.
68 • Document Management
Software User's Guide winIDEA
Management of recorded data
Save Recorded Data
In many cases, the samples (the recorded data) does not need to be saved. If this
option is disabled, only the Trace settings are saved into the Trace file.
Auto Save when Saving Workspace
The Trace settings can be automatically saved when the workspace is being
saved.
Colors
Trace Options, Colors dialog
All global settings are set in the ‘Trace Options’ dialog. To change settings, click
the
‘Options’ button on the Trace toolbar or press the shortcut E.
The first group of settings lets you to change markers, pointer and trigger colors.
Markers are used for measuring the distance between two samples. Each button
shows current active color.
Color selection dialog
Software User's Guide winIDEA
Document Management • 69
To change, for example, Marker 1 color, click the down arrow on the button. A
color selection pop-up appears. Move the mouse pointer over the colored
rectangles. Left click on the color you want to change to. To accept new Marker
1 color, left double-click or click outside the pop-up window. If the rectangle is
pushed the currently active color matches the color of the pushed rectangle.
Click the ‘More Colors’ button to open a standard Windows color selection
dialog, where you can select any color supported by your graphic adapter.
Color selection dialog for logical signals
The second group of settings lets you to change channels, logical and group
signals. The signal buttons show preview of wave, background and value colors.
To change the color of signals click the down arrow on the button and a color
selection pop-up appears.
In the upper frame ‘Signal’ is selected. To change the color use the same method
as described above. To change the signal’s background color, click the word
‘Background’ and select the appropriate color. To accept all changes click
outside the pop-up window.
The colors set in this window only apply for newly created signals. The signals
already defined in the Trace are not affected by this setting.
Color selection dialog for filters, grid and background
The third group of settings lets you change filter, grid and background colors for
timing and state view separately. To change the color of signals click the down
arrow on the button and a color selection pop-up appears. If 'Timing View' is
selected, the color change will apply to the Timing view, if 'State View' is
selected, the color change will apply to the State view.
The fourth group defines the colors of the content information.
Dummy Data
All bits of the data bus are recorded, but for some bus cycles not all of them are
important. For example, if an instruction generates an 8-bit write on a 16-bit bus,
only 8 bits of the data bus are valid in the corresponding data transfer cycle. If
the non-valid part of the data transfer can be determined, it is described as
'Dummy Data' and as such marked with the selected color.
Use for State Signals
If this option is checked, the colors in this dialog are used for state signals.
Presets
Two preset color schemes are available, the light and the dark scheme.
70 • Document Management
Software User's Guide winIDEA
State view options
In this window which type of data will be shown can be selected and which bus
statuses can be seen.
Relative Time
With this option, the relative and absolute timings are toggled.
Tab Size
The size of the tabs for disassembly information can be set.
Hide Empty Lines
Empty lines in the Content signal can be hidden. This is especially the case when
certain content is not shown and is not important to the user.
Software User's Guide winIDEA
Document Management • 71
Show Function Tree
If the function tree should be shown, check this option. The Function Tree is
discussed in detail later.
Thin Markers
This option toggles between two types of views when browsing the State view.
Normally the whole line, currently being browsed is marked with a black
background. If thin markers are selected, only the lines above and under the
current line are bolded.
Save as Default
All options can be saved as default that will be used the next time a new
document will be created.
Recording the Signals
Trigger Configuration
There can be any number of triggers defined. Active trigger can be set from the
main toolbar,
or from the trigger list dialog box:
72 • Document Management
Software User's Guide winIDEA
Trigger Configuration dialog
The trigger configuration is explained in detail in the Hardware User’s Guide,
‘Trace’ section.
Start Recording
Make sure all channels you use are properly connected. Before you begin, check
if the trigger is properly set. The trigger configuration is explained in detail in
the Setting up Hardware section of this document.
Begin button in the toolbar
You are now ready to start recording. Click the
or right click inside signals area and select ‘Start Trigger’ from the pop-up menu
or simply press the shortcut Ctrl+B. The Trace waits for the trigger event. When
the trigger condition is met, the Trace starts to load a buffer. At the beginning,
the signals are loaded to fill the current view frame. After that signals continue to
load around the current view. If this is the first time you start recording, signals
are loaded around the trigger. Even if you change the trigger condition, the Trace
still starts to load the buffer around the trigger.
To force an immediate trigger event press the SPACE key.
To stop loading signals press the ESC key.
Software User's Guide winIDEA
Document Management • 73
Navigating Through the Document
All Windows applications use scroll bars to navigate trough the document. The
Trace is no exception. Beside the standard scroll bars and standard icons, other
navigation shortcuts are available.
You are also welcome to use the wheel of the mouse. To scroll with a wheel,
move mouse pointer inside the Trace window and roll the wheel. Each wheel
movement scrolls signals up or down. If the main signal window is split, to
scroll trough signals in the upper window position the mouse pointer there and
then roll the wheel. Use the same method to scroll in the lower window.
If you hold CTRL key while rolling the wheel, the program scrolls the view left
or right depending on the rolling direction.
List of navigation shortcuts:
←
Scrolls view to the left for one tenth of screen size
→
Scrolls view to the right for one tenth of screen size
↑
Scrolls view one signal up
↓
Scrolls view one signal down
Home
Scrolls view to the start of buffer
End
Scrolls view to the buffer’s end
PgUp
Scrolls view one page up
PgDn
Scrolls view one page down
CTRL + →
Scrolls view to the right from 20% - 100% of screen size
CTRL + ←
Scrolls view to the left from 20% - 100% of screen size
CTRL + Home Scrolls view to the first signal
74 • Document Management
CTRL + End
Scrolls view to the last signal
J
Jump to trigger position
P
Jump to pointer position
1
Jump to Marker 1
2
Jump to Marker 2
Software User's Guide winIDEA
Using Markers and Pointers
For simple time and frequency measurements markers should be used. Each
marker can have a different color. To change markers and pointer width select
either ‘Same as sample’ or ‘Two points’ in the ‘Trace Settings’ dialog (shortcut
E).
To set marker or pointer in the main window use these shortcuts:
Left mouse click
– sets the pointer position
Ctrl + Left mouse click
– sets the Marker 1 position
Ctrl + Right mouse click – sets the Marker 2 position
Info bar holds information about pointer and marker positions and the time
difference between Marker 1 and Marker 2.
Note: All absolute marker and pointer positions are measured relative to the
trigger position.
When clicking with mouse on any sample, all signal values in the signal names
area are updated.
To drag and move a marker or a pointer, move the cursor over it, click and hold
the left mouse button and move the mouse left to drag left or right to drag to the
right. If the cursor goes out of the main application window, the program ensures
that the marker is always visible by scrolling the signals left or right depending
on the dragging direction.
Software User's Guide winIDEA
Document Management • 75
Pattern Searching
While using the Trace, you can use the Find command to search for signal
patterns.
Find button on the toolbar or within the
To find a signal pattern, click the
signals area, right click and select ‘Search’ from the menu and ‘Find’ from the
submenu or simply press the shortcut CTRL+F or ALT+F3.
Find dialog
Also, an expression can be searched for. Check the 'Logic signal expression'
option and enter the expression in the ‘Find’ tab either by typing or press the
triple dot button to create an expression via the ‘Define Logical Signal
Expression’ dialog box. Select search direction and the position from where the
search begins.
Find
Search items are added to the history list whenever the user presses the
button. When an element from the history list is selected, it is shown in the
'Expression' field and can be edited.
You can use the shortcut F3 to find the next occurrence or the shortcut Shift+F3
to find the previous occurrence of pattern. The same command is available
within the signals area, right click and select ‘Search’ from menu and select
‘Find Next’ or 'Find Previous' from the submenu.
76 • Document Management
Software User's Guide winIDEA
Setting Filters and States
Filters and states help you visually mark or find signal patterns.
Example: We have an application with TIM_INT0 interrupt routine, which
occurs periodically. Interrupt routine code is executed from 0x2420 to 0x247A.
The filter can be set in this range and then the interrupt execution can be easily
found in the Trace buffer.
Logic analysis with no filters
In general, on slow computers many defined filters slow down the signal
redrawing, therefore don’t forget to disable filters when you don’t need them any
more.
On the first picture signals without filters are displayed.
Software User's Guide winIDEA
Document Management • 77
Adding states and filters
Adding filters is a straightforward process. Click on Edit/States and Filters or
press the shortcut Ctrl+T. The ‘States and Filters’ tab appears.
To add a new state or filter, press the 'Insert New...' button.
New state or filter dialog
Type its name in the ‘Name’ field. Select the color and enter the expression
either by typing or press the triple dot button to create the expression via the
‘Define Logical Signal Expression’ dialog box. When you are satisfied with the
data entered, click the ‘OK’ button. By default all newly added filters are
enabled. To disable the adequate filter double-click the check box to clear it. To
restore the disabled filter double click the check box again.
In a certain filter or state, the visibility of signals can be set. For example, should
during the above state the A0 signal not be visible, uncheck the checkbox in
front of A0. In this case, the signal value will not be shown.
78 • Document Management
Software User's Guide winIDEA
Logic analysis with filters applied
To change the color of a filter, double-click the color rectangle and select a new
color for the filter.
If more than one filter is defined, the first filter has the highest priority. This is
important when two or more filters overlap. To change the priorities, select the
filter of which priority you want to change and press either the ‘Move Up’
button to increase the priority of the filter or the ‘Move Down’ button to
decrease the filter priority.
To delete a filter, select a filter (the filter number) you want to delete and press
the ‘Delete’ button. Multiple filters can also be deleted. Select the required filters
and press the 'Delete' button.
The procedure for changing expressions in the list in the ‘Filters’ tab is the same
as changing of logical signal expression (refer to subchapter “Creating Logical
Signals”). In practice it’s not often to set more than three filters.
Display Other Samples
Filters can also be used for hiding data. If we uncheck the option "Display other
samples" in the dialog box, then all samples not belonging to any of the filters
will be hidden.
Using the Splitter
In some cases repositioning the signals is not the best solution. For example, we
need to inspect different timings. In this case, we can use the splitter.
The splitter window is useful especially when using low-resolution PC monitors.
The splitter enables the main window to be partitioned.
Software User's Guide winIDEA
Document Management • 79
Setting the splitter
To split the main window, drag the splitter, which is, if the splitter is not active
already, located over the vertical scroll-bar as a small rectangular button. Move
the cursor over that button. The cursor changes its shape. Left click and hold the
mouse button. Move the mouse cursor down. Release the mouse button, when
you are satisfied with the splitter position. When the splitter is active dragging
the splitter line can change its position. If the main window size changes, height
of both windows is also changed, but the proportion between these two windows
stays the same.
Remove the splitter window by dragging splitter line up to the top of the main
window or down to the bottom of the main window. If you drag it up, the lower
window will be preserved and vice versa. Any changes made in one window are
also visible in the other window.
The splitter is available separately for Timing view and for State view.
80 • Document Management
Software User's Guide winIDEA
List of all Default Shortcuts
←
Scrolls view to the left for one tenth of the screen size
→
Scrolls view to the right for one tenth of the screen size
↑
Scrolls view one signal up
↓
Scrolls view one signal down
Home
Scrolls view to the start of buffer
End
Scrolls view to the buffer’s end
PgUp
Scrolls view one page up
PgDn
Scrolls view one page down
CTRL + Home Scrolls view to the first sample
CTRL + End
Scrolls view to the last sample
J
Jump to trigger position
P
Jump to pointer position
1
Jump to Marker 1
2
Jump to Marker 2
E
Shows General Settings dialog box
S
Shows Signals All dialog box
CTRL + F, ALT + F3
Shows Find dialog box
CTRL + F3
Find next pattern
SHIFT + F3
Find previous pattern
CTRL + T
Shows States and Filters dialog box
B
Begin trigger
T
Set trigger
SPACE
Trigger now
ESC
Stop loading samples
CTRL + H
Hide selected signals
Alt + Enter
Set signal properties
CTRL + Shift + G Insert group signal after the selected signal
Software User's Guide winIDEA
CTRL + L
Insert logical signal after the selected signal
CTRL + Del
Remove markers
Document Management • 81
Changing Shortcuts
Customizing shortcuts
To change the default shortcuts:
•
Open the ‘Tools/Customize’ dialog.
•
Select ‘Plugin: LA’ in the ‘Categories:’ field in the ‘Keyboard’ tab.
All the commands are displayed inside the ‘Commands’ list. Select the
command of which the shortcut you would like to change. Current key
assignment is displayed under Current keys. To add a new shortcut, click inside
the ‘Press new shortcut’ field and press the new shortcut, e.g. “+” on the
numerical pad. You have to press the ‘Assign’ button to add a newly defined
shortcut to a list of current assigned keys.
Many key combinations are already defined as shortcuts. That is why you have
to check, if the shortcut you want to assign is not currently in use by any other
command.
To remove the shortcut for the selected command, select that shortcut inside
‘Current keys’ list and press the ‘Remove’ button.
Some shortcuts are defined in categories other than the ‘Plugin: LA’, e.g. ‘Find
Next Pattern’ can be found under the ‘Edit’ category (command name is
‘EditRepeatFind’)
82 • Document Management
Software User's Guide winIDEA
Handling Multiple Trace Records
Let's assume that there is no trace session opened and active in winIDEA.
After initialising the debugger you should have following or similar window
layout (no trace window opened):
Software User's Guide winIDEA
Document Management • 83
Next, open the trace window from the ‘View/Trace’ menu, set it up and record
one program flow. The user should have below window layout.
Note that the source window is ‘MDI’ type and the trace window ‘Dock’ type.
Modify them if necessary using ‘Window Type’ option from the local menu.
84 • Document Management
Software User's Guide winIDEA
Now, make sure that the trace window is active (if not, select it) and select ‘Save
as’ from the ‘File’ menu. A trace file is saved with the .trd extension.
Now record another two program flows using trace window and save them under
different names.
Let’s assume we have three trace files now (Demo0.trd, Demo1.trd, Demo2.trd)
and we want to inspect them. Open each file by selecting ‘Open’ from the ‘File’
menu. The files are opened in the editor window probably overlapping each
other (MDI window type). You may switch among them by using Ctrl-Tab
shortcut.
Now, open the Document bar from the View menu (ALT-1). Using the
Document bar the user is able to navigate through the trace records easily.
Software User's Guide winIDEA
Document Management • 85
The other alternative to the Document bar is to use the project manager. Instead
of opening the Document bar, select ‘Project’ from the View menu (ALT-0) and
the ‘Project Workspace’ window is opened. Now add a group called ‘Trace files’
using local menu. Next, click on a newly created group, select ‘Add files’ from
the local menu and add all three trace files. Now the user is able to navigate
through the trace files by simply clicking the file of interest.
86 • Document Management
Software User's Guide winIDEA
Execution Coverage
Execution coverage records all addresses being executed and as a result displays
which code is executed or not executed. It can be used to verify a test code,
which should exercise a complete target application. It also helps finding a so
called “dead code”, the code that is never executed. Such code represents
undesired overhead when assigning code memory resources.
Depending on the implementation, execution coverage operates either in off-line
or real-time operation mode.
Off-line execution coverage features:
•
decision coverage
•
statement coverage, which should be used when real-time execution
coverage is not available
Real-time execution coverage features:
•
statement coverage running indefinitely
Off-line Execution Coverage
Execution coverage based on the emulator’s default trace operates in a so called
off-line operation mode and is available for all debuggers providing the trace
functionality. In this case, the trace hidden to the user is configured for ‘Record
everything’ operation mode and then the program execution traced. After the
trace buffer is full, the content is uploaded to the PC, execution coverage
software analysis performed and at the end the results displayed. Time of
program execution being tested directly depends on the target CPU speed and
the trace buffer size. Upload time to the PC depends on the trace buffer size and
the iC3000 unit. In case of iTRACE GT or Active GT development platform
with 1GB or more trace buffer, it is recommended to use ic3000 GT unit which
offers a high-speed trace upload to the PC. Off-line execution coverage trace
buffer size is configurable in the ‘Hardware/Analyzer Setup’ dialog (1, 10 or
100%).
Software User's Guide winIDEA
Document Management • 87
Off-line execution coverage analysis tests the following two metrics:
•
Statement Coverage identifies which executable code was executed
and which was not executed
•
Decision Coverage exercises all conditional branch instructions and
identifies if the instruction was taken, not taken, taken in both directions
or not executed at all.
Off-line execution coverage has its advantages and disadvantages. It’s available
on all development systems featuring trace and features decision coverage
metric. Decision coverage is an add-on to the statement coverage (a standard
feature on the in-circuit emulators). However, the execution time of the off-line
execution coverage test is limited by the trace buffer size and can never run
infinitely. Further, due to the off-line trace based concept, it’s impossible to
identify which parts of the code were not tested or were tested but were not
executed. Thereby, off-line execution coverage must be used with cautious to
obtain reliable and valid information for the code under the test.
A so called unit test, where the decision coverage becomes a necessity, is getting
more and more important in the test departments. It is impossible to set up a test
application and environment, which would systematically cover and test all
possible paths in the target application. However, a unit test comes very close to
this and can be run systematically. It first identifies all functions of the target
application and then each function is individually stressed with different input
parameters and the output results verified. One of the output results is also
decision coverage metrics next to the decision coverage. Executed logical paths
within the function are identified with the decision and statement coverage
(while the function is exercised with input parameters).
Real-time Execution Coverage
Real-time execution coverage is based on a hardware logic, which in real-time
registers all executed program addresses. It features statement coverage but no
decision coverage since it keeps the information on all executed program
addresses but without any history, which would tell which address was executed
when and in what order. The major advantage of the real-time execution
88 • Document Management
Software User's Guide winIDEA
coverage is that it can run indefinitely, which does not apply for the off-line
coverage.
Results
Statement and decision coverage results are displayed in the execution coverage,
the source and the disassembly window.
Source and disassembly window
Functions, which have not been executed, are marked with a red box. Fully
executed functions are marked with a blank box while partially executed
functions are marked with a red frame.
Red and green arrows in the source and disassembly window display decision
coverage results. Looking in the disassembly window, the customer can identify
a state of all conditional branches: taken, not taken, taken in both directions and
not executed.
Decision coverage works on an object level and therefore the results are exact
for the CPU instructions, which are displayed in the disassembly window.
Decision coverage results displayed in the source window cannot be exact as the
results in the disassembly window. Source lines consist of more instructions and
therefore decision coverage information of more instructions is merged into a
single source window information mark, which can no longer display the details
available in the disassembly window. Branches column in the execution
coverage window provides information on how many instructions are not
executed (ne), taken (t), not taken (nt) or taken in both directions (b) within a
source line.
Software User's Guide winIDEA
Document Management • 89
Execution coverage window
Execution coverage results can be saved in a file (XML and XML compressed
format) and can be open any time later. This allows analyzing and sharing
execution coverage results without the emulator being hooked up. Additionally,
execution coverage results can be saved in an html format for report and
presentation purposes. Next chapter describes handling and use of execution
coverage window.
HTML report
Toolbars
Toolbars are explained in order from the left to the right.
Settings
Execution coverage can be started manually on request or automatically as soon
as the program is run.
Results can be automatically updated every time the program is stopped or on
request by stopping the execution coverage.
90 • Document Management
Software User's Guide winIDEA
Display of Statement and Decision coverage
enabled/disabled. Per default both are enabled.
can
be
individually
Note: Decision coverage is available for off-line execution coverage only
Configure symbols
Program areas analyzed by the execution coverage can be configured through
‘Configure symbols’ toolbar or ‘Configure ranges’ toolbar or as a mixture of
both. As soon as a symbol or a range is added, a newly covered area can be seen
in the Symbols and Ranges tree structure in the execution coverage window.
Click on the toolbar to activate the configuration
Configuration inactive
Configuration activated
Types of displayed symbols are selected in the configuration tree on the right
side of the toolbar (see above picture).
Software User's Guide winIDEA
Document Management • 91
Selection or de-selection of a symbol is done via mouse by clicking on the
square or tick next to the symbol or by clicking on the symbol and then use
Space keyboard to toggle between selection and de-selection.
Left picture shows configuration of symbols and the picture on the right shows
final configuration after the configuration is deactivated by clicking on the
‘Configure symbols’ toolbar.
Configure ranges
Available range options can be seen on the below picture.
Add range & Remove range
Add all downloaded code
This configures execution coverage for all downloaded code. This is the most
recommended configuration and works fine as long as there are no areas to be
tested, which are not part of the download file and as long as the download file
92 • Document Management
Software User's Guide winIDEA
contains correct information. In case of any doubts, use other configuration
choices.
Add complete address range
It yields a complete CPU address space for off-line execution coverage while for
the real-time execution coverage working address space is limited by the
hardware and covers first 8MBytes (MPC5500 Nexus RTR) of the CPU address
space.
Start
Starts execution coverage session.
Continue
Continues execution coverage session. Execution coverage can be run and
results added in addition to the previous session or even to an old session being
loaded into the current workspace.
Stop
Stops execution coverage session.
Load
Loads results from saved execution coverage session.
Save
Saves results in XML format (*.ccv) or compressed XML format (*.ccvgz).
Report
Generates a report in an html format, which can be used for presentations or easy
sharing execution coverage results.
Show not executed only
When selected, it displays not executed parts of the code only.
Display source window, Go to source
It jumps to the source, when symbol is selected and toolbar pressed. The
alternative is double click on the symbol.
Software User's Guide winIDEA
Document Management • 93
Sort
Symbols and ranges can be sorted by different type and ordering. Clicking the
column name (e.g. Lines, Sizes,…) in the execution coverage window performs
sorting too.
Hexadecimal display
Displays numbers in a hexadecimal format instead of a default decimal.
Show relative paths
Displays relative paths next to the symbol names instead of absolute paths.
Absolute paths displayed
Information
The user can enter tester name, test ID, time, date, environment information and
comments as part of the execution coverage session,
Search
Search can be used to find a symbol in the results.
94 • Document Management
Software User's Guide winIDEA
Getting Started with Execution Coverage
Software User's Guide winIDEA
1.
Configure real-time or off-line execution coverage in the
‘Hardware/Analyzer Setup’.
2.
Open execution coverage window either from ‘View/Execution
Coverage’ or from ‘File/New/Execution Coverage File (.ccv)’
3.
Configure areas to be tested for the statement and/or decision coverage.
Program areas covered by the execution coverage can be configured
through ‘Configure symbols’ use or ‘Configure ranges’ use or as a
mixture of both. When areas are configured through the symbols, debug
download must be performed first.
4.
Execute debug reset, start execution coverage and run the application.
Stop the application or execution coverage to view the results.
Document Management • 95
Debug Session
Download Files
winIDEA IDE features two types of downloads:
•
'Debug' Download often called Download
•
Target Download
Download
Download loads files defined in the Download Files tab.
Target Download
Target Download loads files defined in the Download Files or Target Download
tab depending on the setting in the Target download field in the Options tab.
Additionally, a file defined in the Target Download tab can be executed on a
demand any time during the debugging. If the user wants to load a file at a
certain stage during debug session (simulation, testing,...), he should:
•
specify any file that he will be using, in the 'Target Download' list.
•
at the desired time, the file to be loaded should be selected and loaded
by clicking the 'Download' button in the 'Target Download' dialog.
The development system and target application requirements dictate, which
download type needs to be used.
Normally, beside the code a file contains a debug information, which is
generated by the compiler/assembler and allows high-level source debugging. To
be able to use a high-level source debugging, the user needs to instruct the linker
to output the debug information beside the code. WinIDEA supports most of the
existing debug formats. Of course, binary, Intel or Motorola hex files without the
debug information can be loaded as well.
Loading files on debuggers with overlay emulation
memory
On In-Circuit and Active emulation systems, Download loads files into the
overlay emulation memory, while the CPU is held in reset. The debugger loads
files directly into the memory bypassing the CPU. Thereby, only overlay
emulation memory is accessible by the Download.
Target Download is used when it’s necessary to load the files to the target
(writable) memory or into the internal CPU memory other than the internal flash
or ROM, for instance RAM or EEPROM. If some of the memory is not writable
out of the CPU reset, the user needs to add an initialization (CPU configuration)
Software User's Guide winIDEA
Debug Session • 97
sequence, which is carried out before the Target Download. The CPU being
emulated or its emulation substitute (e.g. bondout) resides on the development
system and carries out Target Download. Thereby, all CPU memory resources,
including overlay emulation memory, are accessible by the Target Download.
Loading files on on-chip debuggers (no overlay
emulation memory)
If an on-chip debugger is used, there is no need to use the Target Download
option. If it is used, this may yield downloading the code twice (depending on
settings).
Downloading from script program
If certain files must be loaded during script execution:
•
specify any file that will be used, in the 'Target Download' list.
•
use the APIDownloadFile1 script function to load the desired file.
Configuring Processes
On certain CPU families, the memory area can be split into several processes.
Process specification dialog
A new process can be added using the ‘New…’ button, a non-default process
can be removed using the ‘Remove’ button and the properties of a process can be
edited using the ‘Properties…’ button.
Note: the Process dialog is not available on all CPU families.
Use virtual access for the currently active
process
If this option is checked, virtual access is used for the currently active process.
98 • Debug Session
Software User's Guide winIDEA
Customizing processes
Process customization dialog
A custom process can be defined in this dialog. The name of the process is
specified and the processes’s PID, if needed, can be specified.
The memory area where the process is located is specified in the Address
mapping section. The start, end and the location it is mapped to are specified in
the entry boxes below. New areas are added using the ‘Add’ button, the selected
one can be changed to the one specified below using the ‘Change’ button or
removed using the ‘Remove’ button.
Software User's Guide winIDEA
Debug Session • 99
Configuring Download Files
To configure download files select the 'Download Files' command on the Debug
menu.
The Download Files dialog
In the above figure, one download file is defined. The name is 'sample.elf' and is
located in the directory of current project target (see "Directory Organization" on
page 234). Its type is ELF and is loaded without any offset.
X20H
X203H
X
X
You can add more files by clicking the ‘New…’ button, delete the selected
downlaod file by clicking the ‘Remove’ button, or edit properties of the currently
selected file using the 'Properties…' button.
For every download file the Process can be specified (when using a CPU family
with the ability to run multiple processes) and the memory area to which it is
downloaded.
If more than one file are specified, the default file for debugging should be
selected in the ‘Default file for debugging’ option.
Include project output file
If this option is selected, the file that is output by the project is automatically
added to the download files list.
100 • Debug Session
Software User's Guide winIDEA
Download Options
Download Options page
Auto download
Determines when an automatic download should be performed (see “Executable
File” on page 245). The options are:
X204H
X
X205H
X
•
Never - No automatic download is performed
•
After link - Download is performed when link process completes
•
Prompt when changed - User is prompted to confirm download when
a change to the download files is detected
•
When changed - Download is performed when a change to the
download files is detected
Before download
An action to be performed before download can be selected here.
Software User's Guide winIDEA
•
Nothing - Do nothing. Note that the emulation must already be started
(typically through Debug/CPU Reset command).
•
Initialize CPU – Initializes the CPU as defined in the
Hardware/Emulation Options/Initialization menu (default)
Debug Session • 101
After download…
An action can be performed after the download completes.
•
Nothing (Stop) - The CPU is stopped on its RESET position. No
program code is executed.
•
Run until… - The CPU is set to running until it reaches the specified
position (typically the 'main' function, but any function can be selected
with the
button).
•
Run - The CPU is set to running.
•
Go to program entry point - Presets the program execution point to
the program entry point (if one is specified in the download file). This
option is usualy used along with Before download/Reset for… option.
•
Go to… - Presets the execution point to the specified address (any
function can be selected with the
button).
Perform this action also after Debug/CPU Reset
If this option is selected, the action defined in the ‘After download…’ option is
also performed when a Debug or CPU reset occurs.
Show load map when download errors occur
When checked, a load map error will be reported if code is loaded outside
debugger range or code overlaps.
Verify
When checked, the downloaded code is verified after download finishes.
Exclusions
Multiple memory range exlusions can be defined. New areas can be specified by
pressing the
'New area' button.
Memory Exclusions definition
102 • Debug Session
Software User's Guide winIDEA
The configured areas can be edited by double-clicking on the area. An area can
be removed by pressing the
'Remove area' button.
Target Download
After the primary download a secondary download can be performed. This is
usually used to load program code to target memory that is accessible after the
debugged CPU has been released from reset.
•
None (default) - No target download is performed
•
Download files - Target download is performed with the original set
of download files
•
Target download files - Target download is performed with the set
of download files specified in the Target Download page.
Target Download Files
This page specifies download files, which are used in a secondary download if
the 'Target download files' option is specified in the Download files options
page.
Target Download Files dialog
Download
At any desired time, the file to be loaded can be selected and loaded by clicking
the 'Download' button.
Memory area
This setting lets you override the default memory area for the file. Use this when
you wish to load the code from the file to a memory area other than CPUs
program area (for example loading into XDATA memory on 8051).
Include project output file
This option automatically includes the project output file.
Software User's Guide winIDEA
Debug Session • 103
Use real-time write
Real-time writes are performed for target download if this option is selected.
104 • Debug Session
Software User's Guide winIDEA
Big and Little Endian/Thumb setup
On certain CPUs, some memory areas are used in a different memory
organization that the others, either as Big Endian vs. Little Endian and Thumb
set vs. ARM set. The memory areas which contain Big Endian code and Thumb
code can be set in the Debug Options/Big Endian and Debug Options/Thumb,
respectivelly.
Big Endian Memory Area specification
Thumb Memory Area Specification
Big Endian/Thumb Areas
The areas can be set in three ways:
•
All – all areas are Big Endian or Thumb
•
None – all areas are Little Endian or ARM
•
Custom – memory areas custom specified hold Big Endian or Thumb
code
Memory Containing Big Endian/Thumb code
Here, custom memory areas containing Big Endian or Thumb code are specified.
Multiple areas can be specified. New areas are defined by pressing the 'New…'
Software User's Guide winIDEA
Debug Session • 105
button, existing ones can be edited by pressing the 'Properties…' button or
removed by pressing the 'Remove…' button.
Specifying the memory range
The memory range can be specified with absolute address or by selecting the
area using the symbol browser by pressing either the 'From…' or the 'To…'
button. If an object is specified in the 'From…' area and 'Cover entire object
range' is checked, the entire object range of the object will be declared as either
Big Endian or Thumb.
Ignore download file Big Endian/Thumb memory
information
If this option is checked, the memory area information from the download file
about Big Endian or Thumb memory areas are ignored and only the areas
specified here are regarded.
106 • Debug Session
Software User's Guide winIDEA
Download File
In the Download File Options dialog, properties of a download file are
configured.
Download File Options dialog
File Path
Indicates the path of the download file.
If the 'Always in project target directory' option is checked, then file's directory
is ignored and the file is always searched for in the current project target's
directory (see "Directory Organization" on page 234).
X206H
X
X207H
X
By checking this option, you can quickly switch project targets (see "Targets" on
page 235) without having to redefine download files paths (remember that Build
Manager will move all generated files to target output directory, which is
different for every target).
X208H
X209H
X
X
File Format
Setting determines the file format of the download file. winIDEA will attempt to
determine the format automatically as a file is added to the download files list,
but you have to make sure that this setting is correct. Refer to your linker
documentation for information on what formats your linker can generate.
Offset
Determines the value that will be added to address of every absolute object
loaded. This includes program code and absolute symbols. Since all absolute
object files contain address information, you will always use zero offset except
for binary files. The offset can be defined for both symbols and code.
Software User's Guide winIDEA
Debug Session • 107
Load Code
Loads the code.
Load Symbols
Loads symbolic information.
Load Line Symbols
This option should always be on for files containing source debug information.
Optimize type information
Sometimes the compiler generates multiple type definition tags (typically for
every time the header file that contains them, is included by some C/C++ file).
The result are multiple entries under Browser/Typedefs, which isn’t wrong, but
file conversion time can take much longer.
If this option is checked, then types that already exist are not 'multiplied'.
If the program uses structures that have equal names, but different definitions,
then variables of the 'optimized' type will not be displayed as expected, but
rather using the first type structure with that name.
Advanced
This button opens an advanced options dialog for the selected file format.
IEEE-695 Options Dialog
IEEE-695 Options dialog
From available compiler vendors, select the one that generated the download file
and whether missing debug info should be loaded from the public section.
108 • Debug Session
Software User's Guide winIDEA
OMF-51 Options Dialog
OMF-51 Options dialog
From available compiler vendors, select the one that generated the download file
and, in case of PLM 51, whether source lines should be converted.
UBROF Options Dialog
UBROF Options dialog
From available compiler vendors, select the one that generated the download
file.
Convert to physical
When using Z180 Bank Addresses, the compiler can in some cases generate
addresses, which should not be converted to physical addresses. Uncheck this
option in this case.
Software User's Guide winIDEA
Debug Session • 109
ELF/DWARF Options Dialog
ELF/DWARF Options dialog
In this dialog you can select which ELF symbols are to be loaded, whether
zeroed segments should be loaded or not and whether debug information is
loaded.
The bit field order can be reversed for different endian applications.
The code can be loaded from the Program Header using Physical or Virtual
addresses or from sections. The default option is Program Header / Physical,
other options should be used if this option fails.
If required, the ELF header can be dumped.
Verify Download
The 'Verify Download' command performs a verification of code that was
downloaded.
The Download Verify dialog
The verification process reads all the memory ranges that were written in the
download process and compares the contents read with the code that was
actually downloaded.
You can instruct winIDEA to perform an automatic download verify after every
download (see "Download Options" on page 101).
X210H
110 • Debug Session
X
X21H
X
Software User's Guide winIDEA
Load Map
The 'Load Map…' command opens a dialog showing locations where code has
been loaded during the last download.
Load Map dialog
By clicking on the map, the view zooms into selected area.
Locations indicated as errors indicate either:
•
overlapping of download code, or
•
loading into non mapped areas
Note: the load map opens automatically after download, if errors are detected.
Software User's Guide winIDEA
Debug Session • 111
Debug Information
Although you can debug target programs without any debug information, such
debugging is reduced to setting breakpoints, running in the disassembly window
and inspecting memory in memory windows.
To take full advantage of winIDEA's debugging capabilities, make sure that your
compiler and linker include debug information in the output file.
Two additional symbol manipulation features are implemented to facilitate high
level and symbolic debugging:
Symbol name prefix handling
Some compilers change (decorate) names of global symbols (variables, functions
and code labels) by adding a prefix to the symbol name (most often an
underscore).
This 'feature' confuses the user and defeats some of winIDEA's debugging
features (like "Watch Tips" on page 45). Therefore a symbol 'de-prefix' feature
has been implemented to remove such decoration. See "Symbols" on page 126
for more information.
X21H
X
X213H
X
X214H
X
X215H
X
Selective disabling of debug information
winIDEA allows selective debug information disabling for modules and
functions which you do not wish to debug (debugged code, interrupt routines,
etc.). See "Debugging" on page 127 for more information.
X216H
112 • Debug Session
X
X217H
X
Software User's Guide winIDEA
Symbol Browser
Currently loaded symbols can be viewed in the Symbol Browser dialog (View
menu).
This dialog will also open upon browse request from a dialog, which supports
symbolic address entries. On these occasions you can click the Select button to
transfer the currently selected symbol to the dialog where the browse request was
initiated.
The dialog is resizable and its screen position is restored the next time it opens.
Symbol Browser dialog
winIDEA maintains seven different lists of symbol classes (selectable on the top
of the symbol browser window). You can display each list by selecting the
appropriate symbol class selector button.
For every selected item, its address and type are displayed. Also, the module
where the item is defined, is specified.
If more download files are selected, the ‘File’ option becomes available and
allows selection of the download file the symbols of which you would like to
browse.
You can choose to display the selected list sorted by address or by name.
By pressing the ‘Show’ button the selected Function, Module or Code Label will
be shown in the aproppriate file. Do note that this function is not ment to be used
for watching a certain varialbe, for that the Watch window should be used.
Software User's Guide winIDEA
Debug Session • 113
Variables
The Variables list holds global variables.
Symbol Browser dialog, browsing a variable
A global variable symbol associates name, address and type. By double clicking
a variable in the list, the selected variable can be browsed further.
The currently selected item’s address and type are displayed.
114 • Debug Session
Software User's Guide winIDEA
Functions
The Functions list holds C language functions.
Symbol Browser dialog, browsing a function
A function symbol associates name, type, entry address, one or more exit point
addresses, a list of local variables, nested blocks with their local variables and a
list of source lines that the function is built of. By double clicking a function in
the list, the selected function is browsed further.
•
The Leaves leaf displays all exit points from the function. Each selected
exit point's address is displayed.
•
The Locals leaf displays all local variables of the function. A selected
local variable's address and type are displayed.
•
The Source lines leaf displays all of a function's source lines for which
debug information is generated. A selected line's address and source are
displayed.
Constants
The Constants list displays all constants.
A constant associates a name and value.
Typedefs
The Typedefs list displays all typedef definitions. These include standard C type
names like 'int', 'float', etc.
Software User's Guide winIDEA
Debug Session • 115
Symbol Browser dialog, browsing a typedef
For every selected item, its type is displayed. Since a type is not bound to a
target location, no address information is displayed.
In the above figure, a union of the following declaration is displayed:
116 • Debug Session
Software User's Guide winIDEA
Modules
The Modules list displays all program modules for which debug information is
available. These will usually be modules generated from your C project files, as
well as library modules.
Symbol Browser dialog, browsing a module
By double clicking on a module, a list of all its source lines, for which debug
information is available, is displayed. For every selected line its address and
source are displayed. By clicking the 'Show' button, the module is opened in the
browser and the selected line is displayed.
Software User's Guide winIDEA
Debug Session • 117
Types
The Types list displays all structured types (struct, union, class) as well as
enums.
Symbol Browser dialog, browsing a type
By double clicking on a type, the type can be browsed further.
118 • Debug Session
Software User's Guide winIDEA
Code Labels
The Code Labels list displays all low level (assembler) symbols, which associate
only a name and target address.
Symbol Browser dialog, browsing a module
For a selected code label, its address is displayed. A code label can not be
browsed further.
Specifying Addresses and Values
Entering address for a breakpoint
Throughout winIDEA you will find yourself in situations where an address or
value must be specified. Usually a dialog looking like this will appear:
You can chose to enter values either in symbolic or hexadecimal form.
Software User's Guide winIDEA
Debug Session • 119
Decimal/Symbol
When this option is selected, you can click the button that opens the browser (in
the above figure the Address… button). You can also enter values manually
using C syntax.
If you wish to enter hexadecimal values, prefix them with '0x'.
Hexadecimal
For those of you who do not have ten fingers but rather Ah, you can select the
'Hexadecimal' option. You will not be able to use the browser, but you do not
need to prefix hex numbers with '0x' prefix.
winIDEA will memorize your preferred entry number base, so you do not need
to select the Value option the next time the dialog opens.
Quick browsing to functions
When browsing the editor, you can immediately jump to the definition of the
function you are looking at. When the cursor is positioned on the function name,
press the F12 shortcut (or the selected shortcut for BrowseGotoDefinition, if you
have changed the shortcuts), and another editor will pop up and position the
cursor to the location, at which this function is defined.
To return to the original location, press Ctrl+* on the numeric keypad (or the
shortcut defined for BrowsePopContext).
120 • Debug Session
Software User's Guide winIDEA
Debug Options
In the Debug Options dialog you can control some finer operational settings of
the debug system.
Memory Access
In the Memory Access page you can specify how winIDEA is permitted to
access target memory.
Debug Options dialog, Memory Access page
When CPU is running
You can allow winIDEA to access memory of the debugged system even when it
is running.
Software User's Guide winIDEA
•
Allow real-time access - when checked winIDEA will use real-time
access for reading and writing. This access is not available for internal
CPU memory.
Reading or writing a byte using this method will stall the CPU for one
CPU cycle only.
•
Allow monitor access - when checked winIDEA is permitted to use
monitor access. Monitor access stops the CPU, performs memory
access and sets the CPU running. Since this can take several hundred
milliseconds (depending on the speed of the PC and CPU), use this
option only if the CPU can be interrupted for such intervals.
Debug Session • 121
Cache memory read accesses
Memory read accesses can be cached. This can greatly improve IDE
performance. A memory that is read will not be read again until a write access is
performed or program execution point is advanced. Care must be taken to
exclude memory regions which can be corrupted with read access (some SFRs
on some CPUs).
•
None - no caching is performed (default)
•
None, except - no caching except in the regions specified in the Except
list
•
All, except - all memory accesses are cached, except for regions in the
Except list
•
All - all memory accesses are cached
Multiple regions can be defined in the exception dialog.
Don’t cache SFRs
If this option is selected, the SFRs will not be cached.
Entering memory areas
Memory area definiton
Specify the Address, the memory area and the size of the memory area to
include/exclude.
Memory Regions
This dialog allows specification of memory regions to which memory access
should be restricted.
122 • Debug Session
Software User's Guide winIDEA
Memory regions configuration
An individual region entry specifies the memory space, starting address and end
address/region size. The region can have restricted read or write access. If read
and write access must be restricted, define two regions with equal placement,
one with blocked read and the other with blocked write access.
Range specification
This feature can be used to specify the location of FLASH memory, which can
fail if write access is attempted to it (attemting to set a software breakpoint).
Software User's Guide winIDEA
Debug Session • 123
Update
winIDEA can periodically update information on the desktop.
Debug Options dialog, Update page
Real-time Access
On emulators with real-time access capabilities, watch expressions on real-time
panes of the Watch window can be updated periodically in real-time.
You can instruct winIDEA to update these expressions when the CPU is running
and when the CPU is stopped.
Update Period
determines the time interval in which winIDEA updates real-time watches.
124 • Debug Session
Software User's Guide winIDEA
Monitor Access
Accessing memory using debug monitor gives you access to all memory
available to the CPU, the CPU must however be stopped for this purpose.
You can instruct winIDEA to update all configured update targets when
•
The CPU is running,
•
when the CPU is stopped
•
when a conditional breakpoint's condition is evaluated to zero.
Note: when CPU stops, all debug windows are refreshed automatically. ‘Update
when stopped’ should only be used if background interrupts are serviced,
otherwise this option only degrades performance.
Update Period
determines the time interval at which the selected update targets are updated.
Update Target
defines the desktop information that is to be updated. This can be:
Software User's Guide winIDEA
•
expressions in the watch window
•
currently open memory windows
•
the register pane of the disassembly window
•
the SFR window's expanded registers
•
operating system window
Debug Session • 125
Symbols
The 'Symbols' page of the Debug Options dialog allows you to manipulate
symbolic information loaded from download files.
Debug Options dialog, Symbols page
Remove Symbol Prefix
Some compilers prepend underscores (or similar characters) to global symbols
which usually get in the way during a debug session.
You can instruct winIDEA to remove such prefixes from functions, global and
local variables and code labels.
The global variable marker in winIDEA is #. This means that if you have a
global variable called VAR, but are currently in function which also defines a
variable named VAR and you type 'VAR' in the watch window, winIDEA will
display the local variable as its visibility obscurs the global symbol. If you wish
to see the global symbol too, then type in #VAR.
Load Symbols When Opening Workspace
This option instructs winIDEA to save symbols when closing workspace and
load them again when the same workspace opens. This way you have symbolic
information available before program download is performed.
Display Markers Only In the Last Line
If this option is selected, the markers in the editor window are displayed only in
the last line, where the code is generated. With this option, the confusion of
markers in lines where no actual code is generated is no longer possible.
Scope Sensitive Browser Symbol Selection
If this option is checked, the symbols in the browser are scope sensitive, i.e.
when a static symbol is selected to be watched, it has a prefix, specifying in
126 • Debug Session
Software User's Guide winIDEA
which function it is defined. If this option is unchecked, the user will be unable
to browse static symbols outside the function, procedure or file, in which they
are defined.
Display memory area in pointer prototypes
If checked, the memory area the pointer points to is displayed in the pointer
prototype.
Dereference char* automatically
Normally, the char* is automatically dereferenced (i.e. the string pointed to is
shown). In some cases this can lead to exceptions if the pointer address is not
valid and debugging is no longer possible. If this is the case, automatic
dereferencing can be turned off with this option.
Integer Type Display
Defines preferential number base system for displaying integer values.
'char' Type Display
Defines how values of types 'char' and 'unsigned char' are displayed.
•
ASCII displays the value as a character
•
ANSI format
defines whether non-pritable characters will be shown
as ANSI characters
•
Integer displays the value as a number
•
Both
displays value in both representations
Debugging
The debugging page allows source debug information manipulation. You can
enter functions and modules in which high level debugging is disabled. This way
you can prevent the source debugger from stepping into interrupt routines or
debugged code.
Software User's Guide winIDEA
Debug Session • 127
Debug Options, Debugging page
Note: functions are indicated with parentheses so you can distinguish them from
a module with the same name.
Disable interrupts during
Checking an option disables interrupts during checked high-level step
operations.
Options
Reserve one breakpoint for high level debugging
By default, one breakpoint is reserved for high-level debugging. If software
breakpoint functionallity is not needed, the breakpoint can be released for the
user program to use. If this is the case, uncheck the 'Reserve one breakpoint for
high level debugging' option.
Disable breakpoints before download
When the option ‘Configured on literal addresses’ is selected, the software
disables breakpoints configured on literal addresses before download.
Breakpoint set in the disassembly window is understood under the term
breakpoint set on a literal addresses. Breakpoints set in the source window are
set on line symbols and thus they don’t represent any problems when re-linking
the project. When a breakpoint is set on an instruction in the disassembly
window, it’s set on a first byte of the CPU instruction. After re-linking the
project, the same instruction may be reallocated and the breakpoint is no longer
set on a first byte. The option prevents setting a breakpoint on an address not
aligned with the CPU instruction.
Also, all breakpoints can be disabled using the ‘All’ option. Use this option if the
target system is not ready for setting breakpoints after initialization. For example
– the chip selects for program code point to default FLASH memory, whereas
the debug session runs from RAM. Since FLASH memory device can get
‘confused’ if the debugger tries to write to it (by attempting to set software
128 • Debug Session
Software User's Guide winIDEA
breakpoints), this option can be used to prevent this from happening. Once the
chip selects have been configured, just click ‘Enable all’ in the Breakpoints
dialog.
If no breakpoints are to be disabled (in normal debugging operation), this option
is to be set to ‘None (default)’.
Assume
The 'Assume' page allows specification of values of register which remain
constant in course of program execution.
This feature is necessary for compilers that access global variables with a
relative addressing mode to a certain CPU register (typically the A5 on 68k
CPUs). To access a certain variable the register value must be known to establish
the address of the variable. If the CPU is running, it must be stopped to read out
the register unless the value of the register is specified in this dialog.
If the value of a certain register is required but can not be accessed (CPU
running, halted etc.), its assumed value is used.
Debug Options, Assume page
In the above figure the value 100000h is configured to be assumed for register
A5. This value will be used if the register can not be accessed due to CPU's state.
Assume non self modifying code (cache read accesses to program
regions)
If this option is checked, read accesses to program regions are cached.
Directories
In the 'Directories' page of the Debug Options dialog, you can configure
alternative search directories for project files and download files search
directories. You will want to use this feature if you are using an external make
utility, and don't wish to specify project files in the 'Project files' dialog.
Download files search direcotries are usualy specified when running in OS Run
mode debug mode.
Software User's Guide winIDEA
Debug Session • 129
Debug Options, Directories page
After program download, winIDEA will attempt to locate sources for modules
reported in the download file.
•
first it will try to match the module name to a project file listed in the
project list. If no match is found then the module name remains
unchanged.
•
if no source file exists in the established directory, winIDEA will scan
all listed directories (in order of specification) for an occurrence of this
file.
•
if no match is found for the module, no source debugging is available
for it.
If the ‘Search subdirectories’ option is checked, winIDEA will also search
subdirectories of the specified directories.
If the ‘Convert source file paths’ option is checked, winIDEA automatically
converts paths defined. The conversion is defined in the format <original path
specified in the download file>=<path as seen from the current workstation>
Multiple path conversion paths can be specified and separated by a comma (,) or
semicolon (;).
Example:
The statement d:\cygwin\demo=e:\demo
converts paths From: d:\cygwin\demo To: e:\demo.
This converts the paths starting with 'd:\cygwin\demo' to 'e:\demo':
'd:\cygwin\demo\main.c' -> 'e:\demo\main.c'
Source file priority
The option defines which source files take priority – from the path of the project
file list or the download file path.
130 • Debug Session
Software User's Guide winIDEA
History
In the history page of the Debug Options dialog, you can configure the type of
information that is stored in a history file every time the CPU stops.
Debug Options, Directories page
History File
Specifies the path to the history file.
Record
when checked, the history file is recorded.
Clear history on reset
when checked, the history file is cleared when the CPU is reset. When cleared,
history entries are appended to the existing file’s contents.
Recorded Information
specifies what information should be written to the history file.
Software User's Guide winIDEA
Debug Session • 131
MMU Options
The MMU Page allows configuration of virtual/physical address display.
Display of physical addresses can be enabled individually for addresses and
register values.
Virtual display is the default as it reflects the address seen by the CPU core.
Physical address indicates a value seen after MMU translation to external
devices, like memory etc.
Debug options, MMU page
BackTrace options
The Backtrace reconstructs the trace of the emulated program. A complete
reconstruction is a very time consuming process therefore always a compromise
between speed and quality of reconstruction is used. The user can decide the
ratio between quality of reconstruction and speed of reconstruction in three steps.
Debug options, BackTrace page
132 • Debug Session
Software User's Guide winIDEA
Operating System Support
winIDEA provides limited support for debugging operating systems. Most
commonly it will show state of operating system kernel objects.
Operating System Selection
In the Operating System page, the operating system that is used in the
application should be specified.
Operating System page
Operating system
Specifies the type of the system used.
•
None
•
<name>
OS specified in the list
•
Custom
OS awareness by custom configuration
No OS awareness (default)
Setup
Configures the selected OS.
Software User's Guide winIDEA
Debug Session • 133
Task debugging
The emulator provides hardware capabilities for task debugging. To enable it:
•
Check the Enabled option in the Debug/Operating System dialog
•
Select the task to be debugged.
•
If you wish to perform task specific Trace operations, check the Trace
functions option
Now, only breakpoints that occur in the context of task TASKCONS stop
execution.
Note: this function is hardware dependend. For more information, please consult
the Hardware User's Guide.
Note: For OS profiling the ‘Trace Functions’ option should be disabled.
134 • Debug Session
Software User's Guide winIDEA
Custom
Allows customized configuration of an operating system.
Operating system, Custom operating system setup
Task switching is supported using a custom operating system. For this
application, the information where the operating system stores the ID of the
current task must be specified under ‘Task Switch Identification Address’.
For more information see “Specifying Addresses and Values” on page 119.
X218H
X
X219H
X
Also the size of the ID must be specified under ‘Size’.
Software User's Guide winIDEA
Debug Session • 135
OSEK Operating System Support
This section describes the implementation of the OSEK operating system in
winIDEA.
It assumes that:
136 • Debug Session
•
Hardware is configured properly,
•
An OSEK builder was used to generate the application, with debug
support for at least RUNNINGTASK indication.
•
The OSEK and user sources have been compiled and linked to an
executable,
•
The executable is listed in the Debug/Files for download dialog
Software User's Guide winIDEA
Configuration
In the Debug/Operating system dialog, select the OSEK option and click the
Setup… button to configure OSEK options.
OS Setup, OSEK page
ORTI file
In the ORTI file field specify the path to the ORTI file generated by the OSEK
builder.
•
Click OK in both dialogs to confirm configuration
•
Perform Debug/Download
Note: winIDEA supports ORTI 0.9 through 2.1.
Software User's Guide winIDEA
Debug Session • 137
Profile these OS objects
Select the OS objects to profile. Objects can be added, removed or modified;
enabled or disabled.
OS Objects
The OS objects can be added, removed or edited.
OS Objects dialog
Description
Enter the description of the OS object.
Definition
The objects, defined with the TOTRACE attribute in the ORTI file will be
shown here. They can be selected as OS objects, that should be profiled.
138 • Debug Session
Software User's Guide winIDEA
Viewing OSEK objects
OSEK objects are displayed in the OS window
•
Select the View/Operating System menu item
•
The top item in the OS window displays the operating system (OSEK),
value displays the version as reported in the ORTI file.
IMPLEMENTATION
The item IMPLEMENTATION is special as it defines the layout of other
display OSEK objects. In the figure above, it defines layout of OS, STACK and
TASK objects.
The OS object layout (expanded) defines two members: RUNNINGTASK and
CURRENTSERVICE. Every member has a description identifying its
meaning, displayed in the Value column.
When an OS object member is expanded, it shows valid values (if applicable) for
this member to assume. In the above figure, the RUNNINGTASK can assume
values 0 through 4. When value 0 is contained, NO_TASK task is executing,
value 1 refers to TASKSND etc.
Note: the IMPLEMENTATION
Objects
There can be one or more objects of a type defined in the
IMPLEMENTATION part. In this example, one OS type object, 5 TASK and 9
STACK objects exist.
When an OS object is expanded it will shown current values for its members.
Software User's Guide winIDEA
Debug Session • 139
In the above figure, the os1 object (of type OS), shows current values for
RUNNINGTASK and CURRENTSERVICE. winIDEA reads out its values
and maps them to the defintion table
(IMPLEMENTATION/OS/RUNNINGTASK,
IMPLEMENTATION/OS/CURRENTSERVICE).
There are two situations where a value of an OS object member can not be
displayed.
140 • Debug Session
•
If the member contains value that can not be found in the definition
table (which should only occur before OS initialization starts). See
RUNNINGTASK in below figure.
•
If the expression, by which the value is calculated can not be evaluated.
In the bellow figure the STACK of TASKSND task is not allocated as
the task is suspended.
Software User's Guide winIDEA
OSE Operating System Support
winIDEA realizes OSE Freeze mode kernel awareness by interfacing a Kernel
Awareness Package (KAP) provided by OSE. Besides making use of the KAP
itself, winIDEA exposes the KAP interface to external applications, like OSE
Illuminator, via TCP/IP. Such external clients must connect to the PC that runs
winIDEA instead of specifying the targets IP address.
winIDEA provides memory and register access functions to the KAP, through
which the kernel objects are accessed.
For Freeze Mode debugging, a Freeze Mode Debugger (emulator) and winIDEA
OSE Freeze Mode license is required for this operation.
For Run Mode debugging, the winIDEA OSE Run Mode license is required,
which also includes the Freeze Mode license.
Freeze Mode Configuration
First, OSE Delta must be configured in the Operating System dialog.
OSE Delta Operating system configuration
Next, press the 'Setup…' button.
In the Communication page select the KAP option. This instructs winIDEA to
load the KAP and retrieve kernel object information through it.
Software User's Guide winIDEA
Debug Session • 141
OSE Communication configuration
In the OSE page specify the ports through which the KAP is exposed to external
clients.
OSE KAP configuration
142 • Debug Session
Software User's Guide winIDEA
Broadcast port
Broadcast port specifies the UDP port on which winIDEA will send out
broadcast indicating its availability. Broadcasts are sent out periodically every
30 seconds.
Server port
Server port specifies the TCP port on which winIDEA accepts connections from
external clients. Any client connecting to winIDEA must specify this port along
with machines IP address.
Note: machine IP address and Server port are a part of the Broadcast. The
Illuminator is able to decode the broadcast and resolve both the IP address and
the TCP port. The default Illuminator broadcast port is 50000.
Register saving
If enabled, OSE will preserve contents of all registers for a switched-out
processes. This ensures higher quality of restored process context.
Run Mode Configuration
First, OSE Delta must be configured in the Operating System dialog.
OSE Delta Operating system configuration
Next, press the 'Setup…' button.
In the Communication page select the TCP/IP option. This specifies winIDEA
the TCP/IP port of the target.
Software User's Guide winIDEA
Debug Session • 143
OSE TCP/IP settings
Close the window and press ‘Connect’ on the Operating system toolbar.
Now, winIDEA is connected to the target. The OSE System Browser can be
started now. The OSE System Browser is a special operating mode of winIDEA.
It resembles the OSE Iluminator strongly, but is capable of opening individual
OSE Processes for debugging.
144 • Debug Session
Software User's Guide winIDEA
OSE System Browser
Software User's Guide winIDEA
Debug Session • 145
Freeze Mode Debug Operation
RTOS window in winIDEA
146 • Debug Session
Software User's Guide winIDEA
OSE System Browser window
KAP operation is initiated automatically after the CPU emulation is started.
winIDEA, Illuminator or other clients operate as usual.
In winIDEA, open the OS window and click the Connect button.
In the Illuminator System Browser, double click on the listed target.
Restoring process context
Process context can be restored by selecting the ‘Set Context’ command from
the OS window local menu, or by double-clicking on the process. This will show
execution point of the selected process, values of local variables and the call
stack.
Inspecting memory
For some kernel objects, like process stack range, memory can viewed by
selecting the ‘View memory’ from OS window local menu, or by dragging the
object into an existing memory window.
Software User's Guide winIDEA
Debug Session • 147
OSE Run Mode Debug Session
Run mode debug session is started by double clicking a process in the System
Browser.
The newly launched winIDEA indicates the debugged process in the title bar:
<module name>:<process name>(<process ID>)
In this case:
shell.elf:TestProcess1(0x10019)
Indicates that this instance of winIDEA is debugging TestProcess1 with process
ID 0x10019 in module shell.elf.
Debugging a Single Process
The status in the bottom right corner indicates the current OSE status of the
process. Light green color indicates regular operation i.e. no interference of a
debugger.
To debug a process, click the ‘Stop’ icon in the toolbar. The status will turn dark
green, and current execution point will be indicated.
148 • Debug Session
Software User's Guide winIDEA
Use regular debug commands (Step, Step Over, set breakpoints etc.) to debug the
process.
To find/open source files used in the module quickly, expand the ‘Modules’
group in the workspace window. Similarly, expand the ‘Functions’ group to
quickly locate functions.
Debugging Multiple Processes
There is no limit on the number of concurrently debugged processes. To open
further processes for debugging, switch back to the System Browser and double
click the desired process.
In this example the TestProcess2 is exchanging signals with the TestProcess1.
To debug this inter-process communication:
Software User's Guide winIDEA
•
Open the TestProcess2 by double clicking it in the system Browser.
•
Intercept the process by clicking the ‘Stop’ button.
Debug Session • 149
As shown in the source editor and by the status, the process is blocked
(WaitReceive status) on a call to ‘receive’. This is expected behavior since the
requested signal is generated by TestProcess1, which is currently intercepted and
in no position to send it.
150 • Debug Session
•
Set a breakpoint after this line (on the free_buf call). You can do so
either by keyboard shortcut (F9), clicking the ‘Toggle breakpoint’
button or from local menu.
•
Set the process to running – click the ‘Run’ button, press F5 or select
Debug/Run.
Software User's Guide winIDEA
Status shows not intercepted (light green) but blocked (WaitReceive).
Software User's Guide winIDEA
•
Now switch to TestProcess1 and set it to running
•
Switch back to TestProcess2
Debug Session • 151
As the TestProcess1 was released, it sent a signal, which was received by the
TestProcess2.
TestProcess2 returned from the receive call (unblocked) and hit a breakpoint.
The status shows intercepted (dark green) but ready to run (Ready).
If you check back the TestProcess1, the situation is reversed – it is now waiting
for a signal from TestProcess2.
152 • Debug Session
Software User's Guide winIDEA
µC/OS-II Operating System Support
winIDEA will provide listing of the operating system object in the Operating
System window (View/Operating System). The requirement is that µC/OS-II is
built with the debug symbols switched on.
RTOS window in winIDEA
Integration is CPU independent.
By double clicking on the each task, winIDEA will set the current context to the
selected task. After preseting the context, winIDEA will use the register values
used before the selected task was preempted. Callers tree can also be shown in
the Callstack window.
Software User's Guide winIDEA
Debug Session • 153
winIDEA with variables and RTOS window
When possible, winIDEA will show symbols instead of plain numbers.
154 • Debug Session
Software User's Guide winIDEA
The µC/OS-II integtration is enabled in the Debug/Operating system dialog box
and by clicking ‘Connect’ in the Operating System window toolbar.
Software User's Guide winIDEA
Debug Session • 155
µC/OS-II settings
All file settings are optional. However the user is welcome to use them in order
to improve readability of the Operating System window.
Task ID header file
The task can be named in µC/OS-II in several ways. Naming is dependent on
µC/OS-II version and on the setting in os_cfg.h. If
OS_TASK_CREATE_EXT_EN is not enabled and OS_TASK_NAME_SIZE is
less than 1 then the only information about the task is its priority. This is also the
case when the task is created with OSTaskCreate.
If the tasks are created with OSTaskCreateExt, then the id parameter can be
used to identify this task. For example if the content of the Task ID header file is
#ifndef __task_id_h__
#define __task_id_h__
#define TASK_TEST1
1
#define TASK_TEST2
2
#endif
then the task will be shown as TASK_TEST1 when created with
OSTaskCreateExt and id parameter set to 1.
When OSTaskNameSet is used, then winIDEA will use this name. Note that
only numbers in #define can be used.
OS objects header file
The same name problem occurs with other OS objects. If OsxxxNameSet
functions are not used, then there is no way to name the OS object with a frendly
156 • Debug Session
Software User's Guide winIDEA
name. You can however enumerate all the global pointers in this file, so that they
will hold the address of the objects. For example when creating the sempahore
OS_EVENT *s_pSemaphoreTest=OSSemCreate(5);
pSemaphoreTest will hold address of the created object. If the content of the
header file is
#define s_pMutexTest MY_MUTEX
#define s_pSemaphoreTest MY_SEMAPHORE
then this semaphore event will be named MY_SEMAPHORE.
winIDEA will use this names for all OS_EVENT, OS_FLAG_GRP and
OS_MEM types.
You can also reuse this file in your source code. The usage of the same value for
the define statement as its name is suggested:
#define s_pMutexTest s_pMutexTest
This way the name of the variable will be the same as the object shown in the
Operating System window.
OS_CFG.h header file
If left empty winIDEA will try to find it in the workspace folder. It is used
internally for parsing of some µC/OS-II configuration settings.
Task stack frame information file
µC/OS-II operating system is practically completely CPU independent. One of
the things that is CPU specific is the task stack frame when the context is
switched. This information is used by winIDEA when preseting the context to
the selected task. It is defined in OSTaskStkInit in os_cpu_c.c.
winIDEA already supports a number of CPUs internally. However, when the
user changes OSTaskStkInit, the set context function can also be used by
defining this file.
For example if OSTaskStkInit is
OS_STK *stk;
Software User's Guide winIDEA
opt
= opt;
stk
= ptos;
*(stk)
= (OS_STK)task;
// Load stack pointer
// Entry Point
*(--stk) = (INT32U)0;
// LR
*(--stk) = (INT32U)0;
// R12
*(--stk) = (INT32U)0;
// R11
*(--stk) = (INT32U)0;
// R10
*(--stk) = (INT32U)0;
// R9
*(--stk) = (INT32U)0;
// R8
*(--stk) = (INT32U)0;
// R7
*(--stk) = (INT32U)0;
// R6
*(--stk) = (INT32U)0;
// R5
*(--stk) = (INT32U)0;
// R4
*(--stk) = (INT32U)0;
// R3
*(--stk) = (INT32U)0;
// R2
*(--stk) = (INT32U)0;
// R1
*(--stk) = (INT32U)pdata;
// R0
Debug Session • 157
*(--stk) = (INT32U)SVC_MODE;
// CPSR
*(--stk) = (INT32U)SVC_MODE;
// SPSR
return ((OS_STK *)stk);
Then the content of the Task stack frame information file should be
#define REG_SIZE 4
#define STACK_PTR R13
#define R13
68
#define SPSR 0
#define CPSR 4
#define R0
8
#define R1
12
#define R2
16
#define R3
20
#define R4
24
#define R5
28
#define R6
32
#define R7
36
#define R8
40
#define R9
44
#define R1
48
#define R11
52
#define R12
56
// sp not saved
#define R14
60
#define R15
64
REG_SIZE is the default size for all regsiters. STACK_PTR is the name of the
stack pointer. All other #define statements define the offset of the individual
register from the stack pointer of individual task saved in OSTCBStkPtr
member of the OS_TCB. All names used must be the same as used in winIDEA
disassembly window.
Automatic refresh
When winIDEA and the µC/OS-II Operating System are connected and this
setting is enabled, the Operating System window will be refreshed automatically
when needed (memory changed, CPU stopped). If the setting of this option
decreases performance, then uncheck this option and use the ‘Refresh’ button in
the Operating System toolbar.
158 • Debug Session
Software User's Guide winIDEA
Breakpoints
Besides reading and writing memory, debugging is all about breakpoints.
A breakpoint is a way to stop the CPU. There are various kinds of breakpoints
available:
•
Implicit execution breakpoints are transparent to users, but used
heavily for step, step over, run until and run until return operations.
•
Execution breakpoints are used to break CPU execution before it
executes the instruction on the breakpoint address. These can be either
hardware execution breakpoints or software execution breakpoints.
•
Hardware specific breakpoints depend on the capabilities of the
attached debugger. Refer to debugger manual for more information.
When a breakpoint is hit, the CPU is stopped and winIDEA updates its windows
to reflect the new situation.
Execution Breakpoints
Execution breakpoints act when the CPU attempts to execute the instruction at
the breakpoint location.
Execution breakpoint indicated in source window
This is the most commonly used breakpoint type. winIDEA makes extensive use
of them to implement functions like 'Step', 'Step Over', 'Run Until' and 'Run
Until Return'. These implicitly used breakpoints are not visible to you.
The picture shows
Software User's Guide winIDEA
•
an active breakpoint on address 0x0003, shown as a circle (program
counter indicator taking precedence),
•
an active breakpoint on address 0x0006, the entire line painted,
•
a disabled breakpoint on address 0x0008, shown as a circle of inverted
color
•
an invalid breakpoint (not set on beginning of an instruction) on address
0x000B, the entire line painted with a different color
Debug Session • 159
In situations where simple stepping through a program is not enough, you can
explicitly set an execution breakpoint. Such execution breakpoints are indicated
in both source and disassembly window.
An execution breakpoint can be set in two ways.
The quick and easy way is to:
•
use a shortcut key or,
•
select the 'Toggle breakpoint' command from editor's or disassembly
window's context menu.
This command will set an execution breakpoint at the:
•
insertion point of the editor or,
•
at the indicator position of the disassembly window
To configure advanced breakpoint options, you must open the Breakpoints
dialog (View menu).
Note: execution breakpoints are available on all emulation types (In-Circuit,
BDM, etc.)
160 • Debug Session
Software User's Guide winIDEA
Execution Breakpoints Window
In the Execution Breakpoints window, you can customize existing breakpoints
and add new execution breakpoints.
The breakpoint window is resizable and its screen position is restored the next
time it is loaded.
The window is modeless, i.e. you can keep it open while using other winIDEA
functions.
Breakpoints dialog, execution page
Every breakpoint can be enabled or disabled by checking/unchecking the box in
front of the breakpoint definition.
New Inserts a new breakpoint.
Remove Removes the highlighted breakpoint.
Remove All
Removes all breakpoints.
Software User's Guide winIDEA
Debug Session • 161
Goto Source Jumps to the breakpoint location in the source.
Reapply All
Typically this option is used in applications with software breakpoints. This
option is used, when the programming code, where the breakpoints are located,
is written over, for example when the code is self modifying. If breakpoints are
first set, then a debug download is initiated. If a code modification occurs, the
previously set breakpoints are overwritten and will not be active any more.
Therefore, the breakpoints must be applied again by pushing the 'Reapply All'
button.
Enable All
Enables all breakpoints.
Disable All
Disables all breakpoints. Especially useful when final application tests are
performed.
Position
Position shows the source file and line of selected breakpoint and its address in
the target system.
You can enable or disable a breakpoint by configuring the 'Active' option.
162 • Debug Session
Software User's Guide winIDEA
Condition
Conditional breakpoints are an advanced breakpoint feature provided by
winIDEA. When a breakpoint is hit and the condition is enabled - 'Enabled'
option checked, winIDEA performs the following checks:
•
first the conditional expression is evaluated. If no expression is
specified a non-zero result is assumed.
•
if the expression evaluates to non-zero, the breakpoint occurrence
counter is incremented.
•
if the breakpoint occurrence counter is less or equal to 'Count' specified,
CPU execution is resumed, otherwise the CPU remains stopped.
When Conditional Breakpoints Occur
You can instruct winIDEA to issue a beep and/or display a message indicating
that a conditional breakpoint has occurred.
This setting is global for all execution breakpoints.
Hardware Breakpoints
Provides a link to a dialog where hardware breakpoints, other then execution
breakpoints, can be configured.
Breakpoint report dialog
If the Display message box option in the execution breakpoints dialog is set,
a message box like this one will come up every time a conditional breakpoint is
hit or the condition can not be evaluated.
Breakpoint report dialog
Software User's Guide winIDEA
Debug Session • 163
Location
Specifies the location of the breakpoint.
Condition
Specifies the breakpoint condition. This field can also show evaluation error if
the condition was not entered properly.
Pass
Indicates the pass count for breakpoint occurrence.
164 • Debug Session
Software User's Guide winIDEA
Source Debugging
If your compiler can generate source debug information, you will probably
spend most of the time debugging in your own sources.
winIDEA provides you with quick yet powerful functions to control program
flow. All commands are available in the Debug menu as well as in the Debug
toolbar.
Note: no debugging is available until the emulator has been initialized and the
program loaded.
Reset
Reset button
Reset command will place the CPU in reset state, release it from
reset and stop it before it executes the first instruction.
For CPU's that need to perform chip initialization within specified
number of clocks after the CPU has been released from reset
(68HC11), use the Reset and Run command, which does not stop
the CPU after it is released from reset.
Run
Run button
Run command sets the CPU running.
This command is available if the CPU is currently stopped.
Stop
Stop button
Stop command stops the CPU immediately.
This command is available only if the CPU is running.
On occasions where the CPU can not be stopped without a legal (instruction
aligned) execution breakpoint and no line symbol is hit within one second after
stop has been issued, winIDEA reports:
Can not stop, use breakpoints to stop execution.
In such case set an execution breakpoint to a location in the program where you
know the CPU is executing from often.
Note: stop requires breakpoints only on REmulator and Intel's 251 family on InCircuit emulator.
Software User's Guide winIDEA
Debug Session • 165
Step
Step Into button
Step command performs a single program step. When calling a
function, the function will be stepped in.
If the CPU is running, step command causes the CPU to stop when it
reaches the next source line.
If interrupt servicing in background has been disabled, no interrupt will be
serviced during this step.
Selecting Step… command from Debug menu opens the Step dialog, where you
can specify the number of steps you wish to execute.
Step dialog
•
Number of steps set to one acts the same as a single step
•
If zero is specified, winIDEA will step until step is aborted with the
'Stop Stepping' command (Debug menu).
Step Over
Step Over button
166 • Debug Session
Step Over command performs a single program step inside the
current function. Any function(s) called by executing the current line
are not stepped in.
If interrupt servicing in background has been disabled, no interrupt
will be serviced during this step.
This command is available if the CPU is currently stopped.
Software User's Guide winIDEA
Run Until
Run Until button
Run Until command sets the CPU running until its execution reaches
the current insertion point.
Selecting Run Until… command from Debug menu opens the Run
Until dialog, where you can specify the address where you want the
CPU to stop.
Run Until dialog
Run Until Return
Run Until Return button
Software User's Guide winIDEA
Run Until Return command sets the CPU running until its
execution reaches an exit point from the current function.
If interrupt servicing in background has been disabled, no interrupt
will be serviced during this operation.
This command is available if the CPU is currently stopped.
Debug Session • 167
Go-to Address
Go to Address command presets the CPU's program counter register (PC, IP,
etc.) to the current insertion point.
Selecting Goto Address… command from Debug menu opens the Goto Address
dialog, where you can specify the address you want to preset the CPU's program
counter to.
Goto Address dialog
Note: use this command with caution. Since regular program execution is
skipped, going out of the current function without readjusting the stack will
cause the program to crash. Even jumping inside a function can skip over vital
instructions that an optimizing compiler put in locations you don't expect.
Show Execution Point
This option shows the current execution point in the source.
Snapshot
This option refreshes opened windows. It is used during running state of the
CPU.
168 • Debug Session
Software User's Guide winIDEA
Modify Expression
With this option an expression can be modified.
Modify Expression dialog
First, the expression must be entered or selected with the '...' button.
Then, the new value is entered or selected with the '...' button.
Setting Execution Breakpoints
Setting and clearing an execution breakpoint (see "Execution Breakpoints" on
page 159) in source is easy. The 'Toggle Breakpoint' command available in
Debug and editor's context menu sets an execution breakpoint at the current
insertion point. If a breakpoint is already set on this location, it is cleared.
X20H
X21H
Software User's Guide winIDEA
X
X
Debug Session • 169
Disassembly Window
Programmers will mainly use the disassembly window where no source debug
information is available. Its functions nearly duplicate source-debugging
functions.
Disassembly pane
Register pane
Indicator
Execution line
Breakpoint
Disassembly window
The Disassembly window consists of two independent scrollable panes, which
you can resize by dragging delimiters in the header.
170 • Debug Session
Software User's Guide winIDEA
Registers Pane
Lists all CPU's registers along with their values.
Double clicking a register opens the Modify Register dialog where the selected
register can be modified.
Modify Register dialog
The register can be modified by entering a hexadecimal value or bitwise.
Disassembly Pane
lists the target program in disassembled form. The program execution point and
breakpoints are indicated, as well as an arrow indicator with which you can
move up and down to view other parts of the program, set and clear breakpoints,
run until, etc.
Disassembly pane always displays disassembled instruction, but you can
additionally instruct it to display:
•
source - if a line symbol's address matches the address of the
disassembled instruction, the source line is displayed before the
instruction.
•
labels - if a code label's address matches the address of the
disassembled instruction, the name of the label is displayed before the
instruction.
•
symbols - if an absolute location is addressed by an instruction and that
address matches a global variable or a code label, the symbol's address
is displayed instead of the value.
•
Example: variable 'var' is located at address 1000h:
MOV A,(1000)
is replaced by
MOV A,(var)
•
symbol values - if symbols are enabled and you still wish to see the
absolute number, enabling this setting will display the value as well. In
the previous example this would yield:
MOV A,(var)
(1000)
All above options can be set from the context menu, or in the Options dialog.
Software User's Guide winIDEA
Debug Session • 171
Suspending and Resuming Program Execution
When the disassembly window is selected (the arrow indicator is visible),
program flow control will apply to it even if editor windows are opened. Some
of these commands perform exactly the same as if used from editor. These are:
•
•
•
Reset
X2H
X
Run
X23H
X
Stop
Step
Step Into button
Step command performs a single instruction step. When calling a
routine, it will be stepped in. Performing a Step on block execution
commands (LDIR, REP, etc.) will execute individual iterations step
by step.
If the CPU is running, step command causes the CPU to stop.
If interrupt servicing in background has been disabled, no interrupt will be
serviced during this step.
When the Step… command is selected from the Debug menu, winIDEA operates
as described in "Step" on page 166, only this time, steps are performed in the
disassembly window.
X24H
X
X25H
X
Step Over
Step Over button
Step Over command performs a single instruction step. If the
current instruction is a call to a sub routine or a block instruction, the
CPU is set running until the instruction after the current instruction is
reached.
If interrupt servicing in background has been disabled, no interrupt
will be serviced during this step.
This command is available if the CPU is currently stopped.
Run Until
Run Until button
Run Until command sets the CPU running until its execution reaches
the current indicator position.
Selecting Run Until… command from Debug menu operates as
described in "Run Until" on page 167
X26H
X
X27H
X
Go-to Address
Go to Address command presets the CPU's program counter register (PC, IP,
etc.) to the current indicator position.
Selecting Goto Address… command from Debug menu operates as described in
"Go-to Address" on page 168
X28H
X
X29H
X
Note: use this command with caution. Since regular program execution is
skipped, make sure that the stack pointer and other important registers are not
corrupted by this action. Careless usage can lead the program to crash.
Setting Execution Breakpoints
Setting and clearing an execution breakpoint (see "Execution Breakpoints" on
page 159) in the disassembly window is easy. The 'Toggle Breakpoint' command
available in the Debug and disassembly pane's context menu sets an execution
breakpoint at the current indicator point. If a breakpoint is already set on this
location, it is cleared.
X230H
X231H
172 • Debug Session
X
X
Software User's Guide winIDEA
Disassembling To Disk
The 'Disassemble to disk' command available in the disassembly pane's context
menu, opens a dialog where you can specify the range of addresses that you wish
to disassemble and store in a disk file.
Disassemble to Disk dialog
Use buttons to browse for file and addresses. When finished click the
'Disassemble' button to disassemble.
Software User's Guide winIDEA
Debug Session • 173
Disassembly options
Certain options for disassembly can be set using the Tools/Options window, the
Disassembly pane.
Disassembly options
Display information
Select the information to display in the disassembly window. If ‘SFR Registers’
option is checked, the name of the SFR register addressed by the instruction will
be shown.
Indicator
The Disassembly window indicator can be displayed as a bar or an arrow.
Hide Unused Flags
Check this option if you want unused flags to be hidden.
Cleared Flags
With this option you can select how the cleared flags will be displayed – with an
underscore or a low case letter.
174 • Debug Session
Software User's Guide winIDEA
Memory Window
Memory windows are best suited for a raw view of the CPU's memory.
winIDEA allows multiple memory windows to be opened.
Memory Window
In a memory window the following elements are visible:
•
Memory area selector - shows which of the CPU's memory areas is
currently displayed
•
List field - is used to enter either the address or the symbol or anchor
from which you wish to list the memory.
•
Address type field – used to select the type of the address specified
(either HEX for Hexadecimal memory address, Symbol or Anchor)
When ‘Anchor’ is specified, the window is repositioned to the value of the
expression, specified in ‘Address’, when the CPU stops. For example: @SP
always shows the stack.
•
Address column - displays the address of the first item in the numerical
display area at the same line
•
Numerical display area - displays memory contents in binary,
hexadecimal or signed or unsigned decimal or floating point format.
•
ASCII display area - displays memory contents in ASCII format, if
selected in the Display Mode window
The memory window will also color locations that have changed in the previous
action, and indicate the location of the stack pointer when in range.
Opening a Memory Window
Memory Window button
Software User's Guide winIDEA
A memory window is opened by selecting the Memory… command
from the View menu or by clicking the memory window button on
View toolbar.
Debug Session • 175
You can select the initial memory area and address where the memory window
should open in the Display memory dialog. You can change memory window's
area and address later, by using the memory area selector and list field in the
window.
Display Memory dialog
Memory Display Mode
A memory window can display memory contents in various ways. The Display
Mode dialog, available from memory window's context menu allows you to
configure how the window displays.
Display type
Determines the number format shown in the numerical display area.
If the 'Character Display' option is checked an ASCII display will be shown.
Display Unit Size
This setting determines how many bytes will be grouped to form a value in the
numerical display area.
For example if the display type is set to 'Signed Decimal' and display unit size to
'2 bytes' the values shown will range from -32768 to 32767.
For float display type unit sizes of 4 and 8 are available, for all other display
types sizes of 1, 2 and 4 bytes can be used.
Note: the memory window always aligns itself according to display unit size
setting. (If 4 bytes are selected, the window will align itself on a 4-byte
boundary).
176 • Debug Session
Software User's Guide winIDEA
Memory window's Display Mode dialog
Organization
When grouping several bytes, their ordering inside the group can be specified
either to 'Low Byte First' which should be used on Zilog and most Intel CPUs,
and 'High Byte First' used on Motorola CPUs.
Example:
Memory Address
Data
0
1
0xAA
0xBB
Low Byte First (little endian): WORD value is 0xBBAA
High Byte First (big endian): WORD value is 0xAABB
Character Display
This option selects whether the memory contents will be shown with characters
or not.
Real-time Access
Selects whether real-time access is used or not.
Finding Memory Contents
A very helpful function for browsing the memory is the Find option. It is
invoked using the Ctrl+F shortcut.
Software User's Guide winIDEA
Debug Session • 177
Find in Memory window
Value
With this function, a specified value can be found in the Memory window. The
value can be either hexadecimal (the checkbox ‘Hexadecimal’ is selected and the
value is entered) or a string (the checkbox ‘String’ is selected and the string to be
searched for is entered).
Search Range
The search range in which the value is to be searched for is entered here. The
search range can be either hexadecimal - the checkbox ‘Hexadecimal’ is selected
and the hexadecimal values are entered into the ‘From…’ and ‘To…’ windows,
or decimal or symbolic. If the checkbox ‘Decimal/Symbolic’ is selected, the
search range can be selected with the ‘From…’ and ‘To…’ buttons. Pressing one
of those invokes the Symbol Browser. For more information on selecting
symbols, see “Symbol Browser” on page 113.
X23H
178 • Debug Session
X
X23H
X
Software User's Guide winIDEA
Modifying Memory Contents
Memory contents can be modified directly in either the ASCII display area, or in
the numerical display area.
To modify a location:
•
make sure it is visible
•
click on it with the left mouse button - a block caret will appear
covering the selected location
•
enter the new value.
Note: If the memory does not change, the CPU might have problems with write
access to that location.
When entering value in the ASCII display area or when using binary or
hexadecimal display types, individual digits can be modified directly. In decimal
(float and integer) display mode however, entering a new value automatically
opens the Memory Fill dialog.
Memory Fill dialog
Value
Enter the new value.
Let winIDEA know what numeric format you are using.
Address
This is initially set to the address that was selected at the time the dialog opened.
You can modify this value if you wish to change some other memory location.
Size
Determines how many locations you wish to fill with the specified value.
If you wish to specify the size in hexadecimal format, make sure the
'Hexadecimal' option is checked.
Software User's Guide winIDEA
Debug Session • 179
The Bytes/Display Units setting should be set as follows:
•
if you wish to fill a certain number of consecutive bytes, select Bytes
option
•
if you wish to set values in the format that is currently displayed, select
Display Units option. (Example: if you display 4 byte floats and wish to
set ten consecutive floats to value 1.0).
Note: you can open the Memory Fill dialog in any other display mode by
pressing the 'Enter' key.
Saving To Disk
You can save a region of memory to a binary disk file by selecting the 'Save To
Disk…' command from the memory window's context menu.
Save memory to disk dialog
Address
Determines the address from which the memory will be saved.
Size
Determines how many bytes or current display units will be saved.
If you specify the size in hexadecimal format, make sure the 'Hexadecimal'
option is checked.
File
Determines the file to which the memory will be saved.
Format
Defines the format in which the file will be saved.
Click the Save button to save the memory to disk.
180 • Debug Session
Software User's Guide winIDEA
MMU Table Walk Window
The MMU Table Walk window displays virtual to physical address mapping of
individual memory pages. The window can be selected from the Debug/MMU
Table Walk menu for all CPUs with MMU.
A direct entry of a virtual address is possible.
The MMU Table Walk dialog
Software User's Guide winIDEA
Debug Session • 181
Watch Window
The watch window is best suited for watching and modifying high level
variables - symbols with associated type. You do not need to bother with their
locations; you only need to specify their name.
Simple variable
Display pane selectors
Structured variable
Modified values
Watch Window
The watch window consists of four functionally identical panes, which are easily
switched by clicking on the appropriate pane selector. This way you can
configure a larger number of watches without having to constantly scroll.
182 • Debug Session
Software User's Guide winIDEA
Adding Watch Expressions
To configure a new watch expression you can:
•
select an empty line in the watch window
•
start entering the watch expressions
•
select Add Watch… command from watch window's context menu
•
from the Browser dialog (see "Symbol Browser" on page 113) select a
symbol you want to watch
•
select the expression you wish to watch in the editor and drag it to the
watch window
or
X234H
X
X235H
X
or
Expression Conventions
A watch expression can be any legal C expression, with exception of the ternary
'?' operator. Here are some examples of legal expressions:
c
a[3]
a[c+3]*2
variable 'c'
third element of array 'a'
can you figure it out?
The expression syntax has been extended to allow usage of registers and
absolute memory locations in expressions:
•
@IX
•
use the '@' prefix to specify a register.
register IX
use the ':' prefix to access absolute memory. If the CPU has more than
one memory area, use memory area specifier before the colon:
:0x1000
XDATA:0x30
byte on address 1000h
byte on XDATA 30h
Overriding default scope
The ANSI C expression evaluator was extended to allow accessing static
variables (file or function scope) even when program execution is out of the
relevant scope. The syntax is as follows:
To access a variable that is static on a file scope:
<module name>#<var name>
Software User's Guide winIDEA
Debug Session • 183
Example:
To access gs_byCount variable in the TESTFILE module
TESTFILE#gs_byCount
To access a variable that is static on a function scope:
<function name>##<var name>
Example:
To access s_byCount variable in the main function
main##s_byCount
Expression Type Modifiers
winIDEA will display high level variable values formatted according to their
type. If you wish to override default formatting or to enforce a type to a typeless
expression, you can use type modifiers.
A type modifier is a comma followed by a set of characters after the expression:
<expression>,<type modifier>
Following type modifiers are available:
Character
I
Action
force 16 bit signed integer type
W
force 16 bit unsigned integer type
L
force 32 bit signed integer type
U
force 32 bit unsigned integer type
F
force 32 bit float type
E
force 64 bit float type
C
force 8 bit character type
M
hexadecimal dump
S
display as zero terminated string
X or H
hexadecimal formatting
D
decimal formatting
B
binary formatting
R
display member names
a
show elements of array from
<number>
repeat <number> times
If the watch window should display a number and the read information is not a
number (for example infinity), the display will show NAN (Not A Number).
184 • Debug Session
Software User's Guide winIDEA
Example 1:
:0x1000,I
->
7281
displays locations 0x1000-0x1001 as a signed 16-bit integer.
:0x1000,F2
->
(4.01,3.14)
displays locations 0x1000-0x1007 as an array of two 32-bit floats.
structure,rx
->
(a:0x3,y:0x55)
displays variable 'structure', showing member names and their values formatted
hexadecimal.
largearray,a500
displays the array 'largearray', starting from the 500th element in the array. This
enables watching arrays greater than 256 bytes.
Example 2:
If your program looks like:
void ZeroBuf(int nBufCount, char * pcBuf)
{
for (int I=0; I<nBufCount, I++)
*pcBuf++=0;
}
then watches like this will show:
nBufCount,d
the value of nBufCount in decimal
pcBuf
the address that the pcBuf points at
*pcBuf
the character at location that the
pcBuf points at
Example 3:
When trying to monitor SP content, it is very convenient to monitor it in the
watch window.
To monitor SP content, use following syntax in the watch pane:
:(@SP-8),8m
SP
:(@SP),6m
displays 8 bytes down from current
displays 6 bytes up from current SP
When using standard memory window to monitor the SP, the user has to enter
the physical address where the SP points to.
Modifying Values
winIDEA can only modify values of expressions that evaluate to a target system
address (also called Lvalues). You can not modify constant expressions or
Rvalues. Here are some expressions whose value can be modified:
c
:0x1000
variable 'c'
memory at address 1000h
and following can't:
Software User's Guide winIDEA
Debug Session • 185
1
c+1
constant
Rvalue
To modify value of an expression you can:
•
click in the value column of the expression you wish to modify
•
enter the new value. This can be any valid watch expression.
Note: If the expression does not change, the CPU might have problems with
write access to that location.
Watching Complex Expressions
Complex data types can be watched by expanding the tree box expression.
Structures, unions and classes members will also be shown. If these are complex
as well, they can be expanded further until a simple type is reached.
When expanding a pointer the value that the pointer points to is shown in the
expanded leaf. This can again be expanded until a simple type is reached.
186 • Debug Session
Software User's Guide winIDEA
Variables Window
The 'Variables' window is an automated watch window. All expressions shown
are configured automatically. In general, you will be using watch window for
global symbols or expressions and variables window for local symbols, which
change quickly, as you step in and out of functions.
Pane selector buttons
Modified value
Variable Window
The variable Window has three panes, each showing its specific variables.
All shown variables are configured automatically and can not be changed
manually.
Note: Variables window only show valid contents when the CPU is stopped, the
variables shown, and their address depend on current execution point of the
CPU.
Locals Pane
The 'Locals' pane displays local variables of the current high level function.
Auto Pane
The auto pane displays local, global and member variables that are used in
expressions in the high level statement that executed previously and in the
statement that will execute next.
‘this’ Pane
This pane shows the data member of the current C++ class object.
Entries in this pane are visible only when the CPU is stopped inside a member
function of a C++ class.
Software User's Guide winIDEA
Debug Session • 187
Modifying Values
To modify the value of a symbol you can:
•
click in the value column of the expression you wish to modify
•
enter the new value. This can be any valid watch expression.
Note: If the expression does not change, the CPU might have problems with
write access to that location.
Watching Complex Symbols
Complex data types can be watched by expanding the tree box expression.
Structures, unions and classes members will also be shown. If these are complex
as well, they can be expanded further until a simple type is reached.
When expanding a pointer the value that the pointer points to is shown in the
expanded leaf. This can again be expanded until a simple type is reached.
The Call Stack
During a debug session, the Call Stack displays the stack of function calls that
are currently active. When a function is called, it is pushed onto the stack. When
the function returns, it is popped off the stack.
The Call Stack window displays the currently executing function at the top of the
stack and older function calls below that. The window also displays parameter
types for each function call.
You can navigate to a function's source code or disassembled object code from
the Call Stack. If source code for the selected function is not available, it
displays the function's object code in the Disassembly window.
Navigating to a function's code changes the view of the program shown in the
Variables window and other debugger windows (i.e. displays local variables and
register values for the selected function context), but does not change the next
line of execution or the value stored in the program counter.
188 • Debug Session
Software User's Guide winIDEA
The Variables window displaying the call stack
When a context other than the active is selected, the program execution point is
indicated with a triangular indicator.
In the above figure, the function 'Factorial' was just called itself recursively.
Current execution point is indicated with the cyan arrow indicator and the green
triangle indicator shows the position of the program counter for the selected
context – in this case the position from where the 'Factorial' called itself
recursively.
Note: the call stack is reconstructed by analyzing the function prologue. For the
analysis to succeed, the function prologue must consist of sequential instructions
only.
Some compilers for 8 bit CPUs optimize code size by putting stack frame setup
code in separate subroutines, to which they branch immediately upon function
entry. In such cases the call stack analysis will fail.
In rare occasions, intensive optimization of code can prevent call stack
reconstruction. In such case, reduce the level of optimization during
development stage.
Software User's Guide winIDEA
Debug Session • 189
Analyzer Tools
The 'Analyzer Tools' dialog controls real-time analysis features of the debugger.
Note: the 'Analyzer Tools' dialog contains items that are under control of
winIDEA. Any debugger specific configuration like trace trigger configuration is
performed in debugger configuration dialogs.
190 • Debug Session
Software User's Guide winIDEA
Profiler
Execution profiler helps identifying performance bottlenecks. The user can find
which functions are most time consuming or time critical and need to be
optimized.
Its functionality is based on the trace recording entries and exits from profiled
functions. A profiler area can be any section of code with a single entry point
and one or more exit points. The nature of the profiler requires quality high-level
debug information on function entry and exit points, or such areas must be setup
manually. The recordings are then statistically processed and for each function
the following information is calculated:
•
total execution time
•
minimum execution time
•
maximum execution time
•
average execution time
•
number of executions/calls
Execution profiler relies on the fact that recorded instructions are also executed.
It can therefore only be used on CPUs without the execution pipeline or on
CPUs whose pipeline is reconstructed by the development tool.
Profiler Mode Operation Options
The profiler page of the Analyzer Tools dialog controls profiler operation.
Analyzer Tools dialog, Profiler page
Software User's Guide winIDEA
Debug Session • 191
Profile
The Profiler allows simultaneous profiling of Functions and Data objects
(including OS objects).
The Function profiler is realized by tracing function entries and exits. The
execution time of a function indicates the difference between these two points. In
case the function calls another function which is also included in profiling, the
time spent in that function will not be included in the original function.
Data profiler is realized by tracing write accesses to a variable. For every
profiled data object a separate statistic is maintained. Time, shown for every
value that is written to the object, indicates how long the object assumed the
respective value. The time is measured from the point the value is written up to
the next write (even with the same value).
Auto start when CPU starts
When checked, the winIDEA will start the trace whenever winIDEA starts the
CPU.
Start at
The starting point determines the program address that must be executed for the
profiler to start. You may use this option to synchronize multiple profiler
sessions on the same event.
Continuous operation
Enables continuous operation of the profiler.
Note: When continuos mode is selected in the profiler, the code execution cannot
be recorded properly, therefore nothing is displayed. The main feature and use of
profiler is actually Code Statistics.
Time stamp
The profiler time stamp can be defined here.
Keep History
When checked, full history is maintained.When using deep buffers or continuous
profiling, this option should be unchecked to prevent system resource drain.
Limit session duration
The Profiler session duration is limited to the specified number of seconds when
checked. After the specified duration, the profiler stops recording.
Load last session when opening workspace
When checked, the last session will be reloaded when the workspace is opened.
192 • Debug Session
Software User's Guide winIDEA
Allow functions without exits
When checked, winIDEA allows functions without exits (typically main on
embedded applications).
It is legal for a function to have no exit, but on some occasions the compiler
might choose an instruction sequence other then the return instruction to exit
from a function (Z80 example: RET = POP HL / JP(HL). winIDEA does not
detect such exit points and profiling such functions will cause a profiler error.
Ignore functions which exit on entry
When checked, winIDEA will ignore (instead or reporting an error) functions
whose only instruction is the return statement. Such functions defeat the concept
of the profiler, which requires separate entry and exit point(s).
Include function lines
This option specifies if for the selected functions their inbound lines should be
profiled too.
This option is not available for assembler routines and for configurations that do
not support line profiling.
Allow jumps on function
This option should be used if the starting address (entry point) of the function
can be jumped to (not as a recursive call) from within the function. This can be
the case on functions with no prolog code, where the first statement is a 'while'
or a 'do-while' statement.
If this option is checked, winIDEA will expect a single return from the function
even if it's entry was recorded multiple times.
Note: functions without prolog code are typically non-recursive functions
without any local variables or parameters.
Configuring Areas
Use the 'Remove' button to remove a profiler area and the 'New…' button to add
profiler areas. The ‘Edit’ button edits the selected area, the ‘Select All’ button
selects all configured areas.
OTM…
If the CPU supports special tracing, like OTM on Nexus based CPUs, another
option is presented by the ‘OTM…’ button. The configured option is treated like
a data object.
Software User's Guide winIDEA
Debug Session • 193
Configuring Function Profiler Areas
In the 'New Profiler Area' dialog you can specify new areas that you wish to
profile.
Note: On some compilers (HiWare), the function debug-info is generated for
functions, that aren’t really functions, especially when library functions call each
other with JMP, not with CALL instructions. Because of that, profiler errors
occur. In this case, the workaround is not to include library functions in profiler
areas.
The Profiler Area dialog
All C functions
This option adds all C functions to the profiler area list.
All C functions in module
This option adds all C functions in the module specified in the 'Name' box.
C Function
This option adds the function specified in the 'Name' box.
Assembler routine
This option adds the assembler routine specified. For every assembler routine
you must specify its SINGLE entry point and ALL its exit points.
Use the 'Add' button to add the exit point specified in the 'Exit point' field to the
exit point list.
194 • Debug Session
Software User's Guide winIDEA
Alternatively you can use the Use '<entry>_EXIT_xx' exit points option. If
you chose this option, the routine's exit points must be matched by according
code labels.
Example:
The three exit points of the 'ServiceIRQ' routine must be named
'ServiceIRQ_EXIT_0', 'ServiceIRQ_EXIT_1' and 'ServiceIRQ_EXIT_2'.
Configuring Data Profiler Areas
New Data profiler areas are defined by pressing the ‘New’ button when ‘Data’
Areas are selected.
Data Profiler Area definition dialog
Description
Description of the data object.
Address
The Address of the data object (typically a varaiable).
Size
The size of the object. The ‘Entire object’ option selects the entire variable.
Value Alias Definition
The values that the data object assumes will be shown verbatim in the profiler
window. If a definition is provided for these values, the (more descriptive) form
will be used. The definition can be either an enum type or a file with #define
directives.
Interpretation
Software User's Guide winIDEA
•
State variable (regular): profiler will show statistics for every value
that is written to the object, without further processing;
•
Area entry/Exit ident by LSB: the data object oerves as indicator
of function/service entries and exits. The LSB bit of the value indicates
that the function has entered (1) or exited (0);
Debug Session • 195
•
Area entry exit ident by Zero:
the data object serves as indicator
of function/service entries and exits. The value of zero indicates that the
function has exited.
Function Profiling via Data Objects
To do function profiling via data objects, you need to modify the program code
to perform a memory write upon function entry and exit.
Example:
File Asyst_Functions.h:
#define fn_Func1 1
#define fn_Func2 2
#define fn_main
3
extern char Asyst_OTM;
File main.c:
void Func1()
{
Asyst_OTM = fn_Func1;
...
Asyst_OTM = 0;
}
void Func2()
{
Asyst_OTM = fn_Func2;
...
Asyst_OTM = 0;
}
void main()
{
Asyst_OTM = fn_main;
...
Asyst_OTM = 0;
}
Next, set the Profiler Data Area as follows:
196 • Debug Session
Software User's Guide winIDEA
Data area configuration
If the value alias starts with ‘fn_’ then this prefix is removed and the value is
recognized as a function and can be tracked from the profiler window by double
clicking on the name.
Troubleshooting the Profiler
A profiler may yield unexpected results when profiling a function without an
exit point. Consider the following example:
void main()
{
for(;;)
{
}
ScanInputEvents();
// 1000 CALL ScanInputEvents
DisplayStatus();
// 1004 CALL DisplayStatus
// 1008 JMP
1000
}
As the loop is endless, some compilers generate no function epilogue. This way,
the JMP instruction is recognized as the last function instruction and thus
assumed to be the function exit point. As it is being recorded periodically, the
profiler will assume that the function is exiting from recursive calls - which
results in incorrect results.
To avoid such situations, remove this function from the profile list.
Software User's Guide winIDEA
Debug Session • 197
Data and OS Profiler
The OS profiler can be used to record task and service activity.
To enable OS profiler, the profiler must be configured in ‘Debug/Analyzer
Tools/Profiler’.
198 • Debug Session
•
Open the Profiler window (View/Profiler/Coverage)
•
Start the profiler
•
Select Data Statistics from the context menu to view time and
activation statistics. Individual object’s statistics can be inspected by
selecting Properties command from the context menu.
Software User's Guide winIDEA
OS Statistics and properties
•
Select OS Execution from the context menu to view execution history.
Execution History
Software User's Guide winIDEA
Debug Session • 199
Simultaneous OS Object and Data Profiler Usage
Simultaneous profiling of OS objects and data is also supported. For this, do the
following:
200 • Debug Session
•
Select the OS Objects you want to profile
•
Make sure, the Task Debugging/Analyzer Functions option is disabled
•
define additional data objects to profile
Software User's Guide winIDEA
Software User's Guide winIDEA
•
The Profiler configuration should look like this:
•
Begin profiling, the window will show OS and other variables:
Debug Session • 201
Access Coverage
Access coverage is a data access analysis method. You will typically start access
coverage immediately after download or reset. Whenever the CPU stops,
winIDEA will show which memory areas have been accessed. Two display types
are possible:
•
Graphical
•
Memory Ranges
Analyzer Tools dialog, Access Coverage page
Complete Address Range
Sets the coverage range to cover the complete address range.
All Global Symbols
Sets the coverage to cover all global symbols.
Auto start with CPU
When checked, the winIDEA will start the coverage whenever winIDEA starts
the CPU.
202 • Debug Session
Software User's Guide winIDEA
Memory Area
Specifies the memory area in which the coverage is to be run.
Include Ranges
Specifies the ranges in which the coverage should run.
Exclude Ranges
Specifies the ranges that the coverage should exclude.
Software User's Guide winIDEA
Debug Session • 203
Profiler Window
The Profiler window displays information acquired with a real-time debug tool
(see "Analyzer Tools" on page 190).
X236H
X
X237H
X
Its specialized panes show profiler and coverage results.
Profiler Pane
The Profiler pane of the Trace window displays results obtained in profiler.
Profiler pane, statistical view
Name column
Shows the name of the area.
Functions whose lines have been profiled, can be expanded, to show lineprofiling results.
Statistical View
In the statistical view, results of the entire profiler session are shown.
Time/Count column
In time display mode, the time spent in the area is shown; in count display mode,
number of entries in the area is shown.
Note: the time result of a function is cumulative i.e. times spent (and recorded)
in embedded lines are added to the total function time as well.
The count result of a function is not cumulative.
Minimum and maximum execution time are not available for source lines. If a
profiler object is a function, minimum and maximum execution times are shown.
Percentage column
Shows graphical representation of the time/count column relative to total
time/count or if Lines Relative to Function is selected in the context menu, to the
time/count spent in the function.
204 • Debug Session
Software User's Guide winIDEA
Result bar
The result bar shows the results for the currently selected area.
•
Total - shows total time for the entire profile session
•
Time - shows total time spent in the selected area
•
Average - shows average time spent in the selected area
•
Max - shows maximum time spent in the selected area
Note: Maximum time spent is not available for source lines.
•
Calls - shows number of entries (calls) to the selected area.
Context menu options
Various options can be set in the context menu, i.e. the menu invoked by right
clicking in the Profiler pane.
Profiler's context menu
Time and Count
The profiler pane can show either time or count results.
Lines relative to function
When a percentage of time spent is shown, it can be shown relative to the whole
recording time (the whole recording time represents 100%) or relative to the
function (the time spent in the function represents 100%).
Software User's Guide winIDEA
Debug Session • 205
Access Coverage Pane
The Access Coverage pane of the Coverage/Profiler window displays results
obtained in the access coverage mode.
Note: Access Coverage is not available for all architectures.
The pane is updated every time the CPU stops. This process consists of:
•
Loading the coverage data from the debugger.
•
Coverage data analysis, where the loaded information is analyzed.
Two display modes available:
Memory Areas
Memory areas display mode shows a list of memory ranges that were not
accessed yet, in hexadecimal format.
Access Coverage pane, Memory areas
206 • Debug Session
Software User's Guide winIDEA
Graphics Map
Graphics map display mode shows the same information as the memory areas
display mode, however in a graphical map format.
Access Coverage pane, Graphics map
In the above figure, accessed areas are marked red and non-accessed blue.
Software User's Guide winIDEA
Debug Session • 207
Special Function Registers Window
SFR Window button
winIDEA provides a specialized window (SFR window) to display CPU's onchip special function registers.
To open the SFR window, select the 'Special Function Registers…'
command from the View menu, or click the SFR window icon on the
view toolbar.
The SFR window organizes CPU's registers hierarchically into two levels of
groups (groups and sub groups) and two levels of registers (registers and sub
registers).
A group is a collection of registers that serve a module on the CPU. If you are
currently working on serial communication, you will see all involved registers
by expanding the 'Serial Port' group.
When there area many (nearly) identical CPU modules, a group will contain a
sub-group for every such module. In the figure below, the 'General Purpose
Registers' group contains all 4 register bank sub groups as well as the 'General
Purpose Registers' sub group, which duplicates registers of the currently active,
register bank.
Registers
Sub-register
Groups
Sub-groups
Sub-register
names and values
SFR Window showing 8031 CPU's registers
A register corresponds to a CPU's special function register. Along with the
name, its current value is displayed.
Where a special function register contains fields of bits, it can be expanded to
show these sub registers. In the above figure, the PCON register contains the
SMOD sub-register.
208 • Debug Session
Software User's Guide winIDEA
SFR Register Display mode
The value of a register can be displayed in following display modes:
•
binary
•
hexadecimal
•
decimal
•
character
You can specify the display mode by selecting the register and specifying the
display mode from the context menu.
Modifying a register
To modify register value, double click on its value. In the in-place edit field that
opens enter the new value using the same number base as the register is
displayed in.
Note: whenever possible, sub registers are modified without writing the entire
register (bit addressable registers). If a sub register can not be accessed
independently of its register, the register is first read, sub register bits are
adjusted, and the whole register is written back.
Software User's Guide winIDEA
Debug Session • 209
Customizing the SFR Window
SFR Window operation and display are controlled by choosing the 'SFR
Window' page of the Tools/Options dialog (also accessible from SFR
Windows’s context menu).
SFR Window options dialog
Update
A powerful microcontroller can have several thousand special function registers.
Getting the value for every one of them might take several seconds to complete.
It is thus recommended to update only visible registers. In this case, values of
hidden registers are retrieved when the register becomes visible.
Display
To facilitate identification of register value, a textual description can be shown
along with the value.
Note that this feature is CPU and register dependent and may not be available for
all registers.
If ‘Display Short Names’ is checked, only short names of SFRs will be shown.
Sub-Register Display
The sub-registers can be shown with values, names and values or not at all.
Note that this feature is CPU and register dependent and may not be available for
all registers.
210 • Debug Session
Software User's Guide winIDEA
Memory Access
The memory can be accessed through a monitor or real-time access can be
enabled. If you wish to monitor SFRs in the Real Time Watch window, Real
Time Access must be enabled.
Finding a Register in the SFR Window
When browsing in the SFR window, thousands of SFRs can be displayed;
therefore finding a certain one can be sometimes quite difficult. A Find option
has been implemented for this purpose, which is invoked by pressing the
‘Ctrl+F’ shortcut key and typing in the string to be found.
Find Register dialog
Custom SFR Windows
Since in modern microcontrollers also thousands of special function registers can
be available, browsing through all can be very time consuming since very rarely
monitoring of all SFRs is needed. To make the monitoring of SFRs easier, a
custom SFR window can be built. In a custom SFR window the user can specify
which SFRs are to be seen.
Creating and using a custom SFR window
Custom SFR windows are managed in the View/Custom SFR menu. To create a
new window, click on the View/Custom SFR/New… menu item. A dialog pops
up asking you to name the new SFR window.
New Custom SFR dialog
More than one SFR window can be created.
A custom SFR window pops up displaying the newly created window. Items
from the main SFR window can be added to the new window using drag & drop.
Whole groups or standalone registers can be dragged to the new window.
Software User's Guide winIDEA
Debug Session • 211
Custom SFR window
In the Category menu, the name of the currently selected SFR window is shown.
If more than one SFR window has been created, here different SFR window
displays can be selected.
Sharing SFR windows
For every SFR window you create, a configuration file is written in the project
directory with the name of <window name>.CSF. This file can be shared to
anyone who would need the new window. Only the .CSF file needs to be copied
to the project directory of the other user. Upon opening the project the next time,
the new SFR window will be available in the View/Custom SFR menu.
Deleting custom SFR windows
If a custom SFR window should be deleted, delete the <window name>.CSF file
in the project directory.
212 • Debug Session
Software User's Guide winIDEA
Terminal Window
The terminal window features VT52 and VT100 protocol emulation and can
communicate through standard COM ports and additionally through special
debugger communication port (e.g. JTAG on ARM family) or shared target
memory. This might be very useful especially since many evaluation boards
already feature a serial port and the kernel of such boards usually already
contains serial communication support, newer boards even include a VT100
terminal. Such boards become quickly operational using the terminal window.
The debugging can also become easier as the application can send messages
itself to the terminal window.
The terminal window is invoked with the View/Terminal option.
Terminal Window Setup
The terminal window is set up using the Tools/Options menu. You can invoke
the Options menu by right clicking in the terminal and selecting Options.
Alternatively, the Options menu is invoked by clicking on the
icon.
Terminal window options menu
Channel
First, a channel must be selected. The channel can be either “Debugger” or
“COM1” to “COM4”. By selecting “COM1” to “COM4”, a standard serial
communications port is used. This enables the user to set the communication
port properties by pressing the 'Configure...' button, described later.
Software User's Guide winIDEA
Debug Session • 213
Emulation
The emulation properties are defined here.
Emulation Type
First, the type of emulation is selected. The terminal window can emulate either
the VT52 or VT100 standard. The latest is especially useful since some
evaluation boards already include VT100 support on-board and therefore
communication can be established very quickly.
The Terminal window can also provide input/output communication for
Semihosting support.
Local Echo
If this option is selected, the character typed or sent to the other side will be
shown in the terminal.
Append LF on Input Stream
If this option is selected, a line feed will be sent on the end of an input stream.
Append LF on ENTER Key
When the Enter key is pressed, a line feed will be appended.
Rows and Columns
The size of the emulation screen is selected here and the size of the history
buffer. The standard emulation screen size is 24 rows high by 80 columns wide,
but if another size is desired, it should be entered here.
History Buffer
The History Buffer saves the output of the terminal and here the desired size of
the buffer can be set.
Send ASCII Files
Sending of ASCII files is simplified. If ASCII files will be needed to be sent to
the other side of the terminal, they can be selected in this menu and then sent
easilly in the Terminal window. The files are added using the
'Add file'
button, a file can be removed using the
'Remove file' button.
Timeout after CR or LF
When sending files, the terminal waits for the specified amount of time after
every Carriage Return or Line Feed symbol.
Override shortcuts
When emulating the terminal, certain combinations of keys pressed can either
control the Windows operating system, winIDEA, or can be transferred through
the communication channel. By default, all key-press combinations (shortcuts)
with the control key (Ctrl) are transferred through the communication channel. If
a shortcut should not be transferred through the communication channel but be
handled by Windows or winIDEATM, uncheck the box in front of the shortcut.
214 • Debug Session
Software User's Guide winIDEA
Override Windows shortcuts options
For example, if you wish the Ctrl+N shortcut to continue operating as “New
File” command, the checkbox in front of Ctrl+N must be unchecked.
Save to disk
When checked, the received alphanumeric and CR/LF characters are output to
the specified file.
Configuration
The serial port configuration is performed by pressing the 'Configure...' button in
the Tools/Options/Terminal dialog.
Serial Port Configuration Options
Baud Rate
Selects the baud rate the terminal is connected with.
Data Bits
Selects the number of data bits in the communication.
Parity
Selects the type of parity used.
Stop Bits
Selects the number of stop bits in the communication.
Flow Control
Selects the type of flow control used.
Software User's Guide winIDEA
Debug Session • 215
Setting the Properties of the Debugger Interface
If the terminal window should communicate through special debugger
communication port, the ‘Channel’ must be set to “Debugger”. In this case
additional communication properties are set in the ‘Hardware/Tools/Debug
Output’ tab.
Hardware Tools, Debug output
The communication type can be shared memory or special CPU channel
depending on the specific CPU. Select the supported communication type.
When ‘Shared memory’ is used, the user’s program writes information into a
pre-specified memory location from where the data is being read by winIDEA.
The user’s program can read from terminal window as well.
Some CPUs can communicate with terminal window via serial debug channel.
On such CPUs ‘CPU Channel’ must be selected. In case of ARM family, the
terminal window displays all information send from the CPU through debug
JTAG channel. Likewise the terminal window can send back to the CPU
required information via the JTAG channel.
To enable the benefits of the terminal window with shared memory, all the
necessary functions have been already prepared. Three functions allow the user
to send information to the terminal window and to receive the information from
the terminal window. To use these functions, the file AsystTrace.c delivered
with winIDEA must be compiled and linked to your application. Note that
AsystTrace.c makes use of the standard string library, which must be linked
to the target application.
216 • Debug Session
Software User's Guide winIDEA
The terminal window in winIDEA
Following functions declared in AsystTrace.h are available:
int AsystTrace(const char *pFormat,...);
This function can be used in the same way as the standard “printf” function. The
output is redirected to the terminal window. If the communication buffer is full,
the function does not return until there is enough place for the formatted string.
The formatted string must never exceed the allocated buffer (the size is defined
in AsystTrace.h).
return value
0
int AsystKbhit(void);
return value
Returns a nonzero value if there is at least one character available from the
terminal window.
char AsystGetch(void);
The function waits for the first available character from the terminal window.
return value
Returns the received character from the terminal window.
Software User's Guide winIDEA
Debug Session • 217
The Terminal Window
The Terminal Window can be invoked in the View menu by pressing the
Terminal button.
The Terminal Window
The Terminal window will appear blank, with communication properties in the
bottom. In our case, the properties would mean, that the cursor is in position 1, 1
(which means row 1, column 1), the emulation type is VT100, and the terminal
is connected through the COM1 serial port, with 9600 bps, 8 bit, Parity None, 1
stop bit.
Connect
The 'Connect' button
connects the terminal.
Disconnect
The 'Disconnect' button
disconnects the terminal.
Copy
The 'Copy' button
copies the selected text to clipboard.
Paste
The 'Paste' button
pastes the text from clipboard to the terminal.
Send ASCII
The 'Send ASCII' button
'Send' button
218 • Debug Session
sends the ASCII file through the terminal. If the
is pressed, the ASCII file selected is sent.
Software User's Guide winIDEA
The ASCII file is selected by pressing the 'Select' arrow and selecting the file,
the file selected has a bullet next to the name.
Clear History Buffer
The 'Clear History Buffer' button
clears the history.
Options
The 'Options' button
Software User's Guide winIDEA
opens the Terminal Window Configuration window.
Debug Session • 219
List of supported VT100 Commands
ESC 7
Save Cursor
ESC 8
Restore Cursor
ESC H
Horizontal tabulation set
ESC D
Index
ESC E
Next line
ESC M
Reverse Index
ESC c
Reset To Initial State
ESC [A
Cursor Up
ESC [B
Cursor Down
ESC [C
Cursor Forward
ESC [D
Cursor Backward
ESC [K
Erase from cursor to end of line
ESC [J
Erase from cursor to end of screen
ESC [g
Clear tab at current cursor position
ESC [0m
Atttributes off
ESC [1m
Bold or Increased intensity
ESC [4m
Underscore
ESC [5m
Blink
ESC [7m
Negative (reverse) image
ESC [nD
Cursor backward n chars
ESC [nB
Cursor down n lines
ESC [nC
Cursor forward n chars
ESC [m;nH
Cursor position to column m and row n
ESC [nA
ESC [nJ
Cursor up n lines
Erase in display
n = 0 - erase from cursor down
n = 1 - erase from cursor up
n = 2 - clear screen
ESC [nK
Erase In Line
n = 0 - erase from cursor to right
n = 1 - erase from cursor to left
n = 2 - erase from current line to end of screen
ESC [m;nf
row n
Set horizontal and vertical cursor position to column m and
ESC [ng
Tabulation clear
n = 0 - clear tab at cursor
n = 3 - clear all tabs
220 • Debug Session
Software User's Guide winIDEA
FLASH Programming
Introduction
If the attached hardware (see "Hardware Plug-In" on page 16) supports FLASH
device programming, winIDEA will create a FLASH menu through which
FLASH-programming capabilities of the hardware plug-in can be used.
X238H
X
X239H
X
The FLASH menu
winIDEA can support both on-chip and external FLASH programming.
Note: Internal CPU FLASH refers to the CPU currently configured by the
Hardware plug-in.
When using newer/UMI internal FLASH devices, those are handled by the
hardware plug-in and winIDEA considers these regions to be writable. For more
information on UMI FLASH programming, please see the Hardware User’s
Guide.
Software User's Guide winIDEA
FLASH Programming • 221
Programming
Make sure that the target system is properly connected to the programmer and
the target system is ready for programming.
Next configure the appropriate device.
Configuration
Software configuration consists of:
•
Target configuration – either on-chip FLASH or external FLASH
device
•
Device configuration – manufacturer and type specification
•
Scope configuration – determines whether the entire chip or only parts
of it will be used in the operation
•
Download files configuration – files the FLASH will be programmed
with.
To start the setup, select the 'Setup…' command from the FLASH menu.
Target
The Target page will be shown if on-chip FLASH programming is available.
FLASH Programming Setup dialog, Target page
222 • FLASH Programming
Software User's Guide winIDEA
Target
Specify the FLASH target. Options that are not available are disabled.
Note: If internal FLASH device programming is not supported (or not available)
and external FLASH is then this Setup tab is not shown.
Options
The 'Use Debug download files' can be used to override settings on the
'Download Files' page and use download files configured for debug system
instead.
Several options to automatically program the FLASH can be selected with the
'Auto program FLASH…' option.
The options include:
•
never – the FLASH is never programmed automatically;
•
after link – the FLASH is programmed immediatelly after link;
•
before download – the FLASH is programmed before download.
Device Organization
Device Organization determines the target device organization. This is either a
single device (8 or 16 bit) or two 8- or 16-bit devices in parallel organization
(common address bus with A1 used as device's A0, one device holds even
addresses, the other odd addresses).
•
Single device – select if you wish to program a single standing device;
•
Two devices – select if you wish to program the device in parallel
configuration;
•
Four Devices – selects if you wish to program both devices in parallel
configuration.
Hardware Setup
For information on setting up hardware, please refer to the hardware manual.
Exclusions
Up to two memory areas to exclude when programming FLASH can be defined
here.
Software User's Guide winIDEA
FLASH Programming • 223
Device
In the Device page of the 'FLASH Programming Setup' dialog, the external
FLASH device type is configured. If you are programming CPU's on-chip
FLASH, these settings are ignored.
Note: If external FLASH device programming is not available then the Device
tab is not shown.
FLASH Programming Setup dialog, Device page
Manufacturer
Select the manufacturer of the FLASH device. The device list will be updated
after the manufacturer is selected.
Ignore FLASH ID
When programming, the FLASH ID is checked. If this is not desired, please
check the ‘Ignore Flash ID’ option.
Device and Version
Select the FLASH device. If there is only a single version of the device, the
'Version' list will be disabled and will show only 'default' value. Should there be
different versions of the device (like 8 and 16 bit data bus versions), select the
one that you are using.
Address
Specify the address of the device in the target system – the address that the CPU
uses to access the device.
Little Endian Target
Check this option if the target system is a Little Endian Target, i.e. swaps the
low and high byte of a 16-bit data bus.
224 • FLASH Programming
Software User's Guide winIDEA
Data Bus Mapping
The Bus Mapping dialog is invoked by pressing 'Data Bus Mapping' in the
FLASH Programming Setup/Device menu.
Bus mapping dialog
The Bus mapping is useful when the data in the FLASH is mapped differently
than on the CPU.
Straight
The bits are mapped directly.
Byte reversed
The bytes are reversed, i.e. the first byte in the FLASH is mapped as the second
byte for the CPU, the second FLASH byte is mapped as the first CPU byte.
Bit reversed
The bits are reversed. The first FLASH bit is the last CPU bit, the last FLASH
bit is the first CPU bit.
Custom
Custom mapping can be defined here.
Software User's Guide winIDEA
FLASH Programming • 225
Scope
Settings in the Scope page determine whether the entire device will be operated
on or just certain parts of it.
FLASH Programming Setup dialog, Scope page
Entire Chip
When selected, the entire chip will subject to erase and program operations.
Only involved sectors
When selected, only sectors, where the download file's code is loaded will be
erased and/or programmed.
Only selected sectors
When selected, only sectors that are explicitly checked in the Sectors list will be
operated on.
You can use 'Select all' to select all sectors and the 'Clear all' to deselect them.
226 • FLASH Programming
Software User's Guide winIDEA
Download Files
In the 'Download Files' page the files that will be used for programming the
device are specified.
Note: Settings on this page are ignored if 'Use Debug download files' option is
selected on the 'Target' page.
FLASH Programming Setup dialog, Download Files page
See also "Download File" on page 107 for more information
X240H
X
X241H
X
Note: When using files other than those intended for EPROM burning (for
example absolute object files with debug information), make sure that they
contain all the code necessary in an EPROM system.
Special care should be taken when programming EPROM for a banked system.
The absolute object file usually holds a single instance of the common area,
although the common area must be multiplied in every bank. If you suspect that
not the entire code is loaded, use the object to hex converter supplied by the
compiler manufacturer, and specify the generated hex file as the download file.
Software User's Guide winIDEA
FLASH Programming • 227
Device Programming
After you have configured the device and prepared the target system and
programmer, select the 'Program…' command from the FLASH menu.
FLASH Program dialog
Device organization
The target device organization is specified in the Flash Programming Setup
dialog, the Target pane. This is either a single device (8 or 16 bit) or multiple 8or 16-bit devices in parallel organization (common address bus with A1 used as
device's A0, one device holds even addresses, the other odd addresses).
Program devices individually allows you to program only one device at the time.
Load Files
Click this button to load the download files to winIDEA's internal cache.
Unsecure
Select this option to unsecure the FLASH.
Erase
Click this button to erase the configured scope (see "Little Endian Target" on
page 224).
X24H
X243H
228 • FLASH Programming
X
X
Software User's Guide winIDEA
Program
Click this button to program the configured scope.
Note: this button is disabled if the download files have not been loaded.
Verify
Click this button to verify if programming was successful.
Secure
Select this option to secure the FLASH.
Start
Performs all operations checked next to the Load/Erase/Program/Verify buttons.
Abort
Aborts the current operation.
Setup
Opens the FLASH Programming Setup dialog – see "Configuration" on page
222.
X24H
X245H
X
X
Results
The Results list shows results of operations performed on the FLASH device.
Software User's Guide winIDEA
FLASH Programming • 229
230 • FLASH Programming
Software User's Guide winIDEA
Build Manager
Introduction
One of the goals in the development of winIDEA was to achieve a tight
integration of all stages of program development (edit, build and debug) by a
single application.
winIDEA provides its own editor and powerful debugging capabilities, it lacks
however an integrated compiler toolset. Instead, virtually any third party
command line driven compiler, assembler and linker can be integrated to run as a
part of winIDEA.
winIDEA provides several specialized objects that facilitate this integration. You
will manage you project hierarchy in the Project Workspace Window, run
compilers using the Project Toolbar and configure compiler options in the
Project Settings dialog.
Project configuration file carries In addition winIDEA separates project configuration settings from
the same name as the workspace workspace settings in a separate project configuration file. This file is
file. They always go hand in hand. generated automatically when the workspace file (.JRF) is generated.
It carries the same name, however with a different extension (.QRF).
This separation allows teams of developers to share the same copy of
the .QRF file while every developer can customize his individual
setting in the workspace file.
When using source code control and versioning systems (SourceSafe, PVCS,
etc.) you will want to control the project (.QRF) file as well as your source files.
Since the workspace file (.JRF) is user specific, it should not be shared.
Note: If you copy the workspace file (.JRF) to a new directory, always copy the
project configuration file (.QRF) too, otherwise you will have no project settings
when you open the workspace file in the new location.
Note: In winIDEA versions earlier than 8.5, the project configuration file had a
.PRF extension. This file is read by newer versions, but changes are saved to the
new QRF format.
Detecting Changes to the Project
When the build manager is configured properly, it will check all project files and
recompile/assemble those where:
Software User's Guide winIDEA
•
the objet file doesn't exist
•
the object file is older than the project file
•
any of the header files used by a C project file is newer than the object
file
•
compiler/assembler settings for the project file have changed
Build Manager • 231
A project will be linked (output file generated) when:
•
the output file doesn't exist
•
any of the object files is newer than existing output file
•
linker settings have changed
•
the indirection file has changed
This check is performed before the CPU operation is advanced (download, step,
etc.).
In such case the below dialog will ask you whether the project should be rebuild.
The 'Project not up to date' dialog
Yes
Choose 'Yes' to rebuild the project.
No
If you choose 'No' the project will not be rebuild and winIDEA will not prompt
you again until the project is rebuild explicitly.
Cancel
Choose 'Cancel' to abort the attempted operation. The project is not rebuilt.
232 • Build Manager
Software User's Guide winIDEA
Project Organization
winIDEA adds two hierarchical levels between the project and files that it
consists of (project files). These two levels are an abstract organizational form,
which you can use if you feel the need to, or not use at all - especially for small
projects.
Current Target (Debug)
Project root
Groups
Dependencies
(headers, etc.)
Project Files
(C files, ASM files, LIB files)
Project Workspace Window showing project hierarchy
Software User's Guide winIDEA
Build Manager • 233
Directory Organization
As strongly recommended in the "Workspaces" section on page 11, all
workspace and project related files are placed in the workspace directory or one
of its sub-directories. The figure below illustrates a small project.
X246H
Workspace directory
X
X247H
X
Workspace file
Project configuration file
'Debug' Target
output directory
'Release' Target
output directory
Project files
Typical Directory Organization
You can see the workspace file (2000_31.JRF) along with a matching project
configuration file (2000_31.qrf).
All project files (Tst1.c through Tst3.c) and some header files are located in the
same directory. For larger projects you will usually want to place project files in
sub-directories whose names resemble group names, but this is entirely your
choice.
The Debug sub-directory contains files generated by processing project files
when the 'Debug' target is selected. This includes object, listing, map, absolute
object, symbol files, etc. in short everything that can be regenerated every time.
The Release sub-directory holds the same set of files, only this time they are
generated by selecting the 'Release' target.
This separation of source and output files keeps your source directories clean and
brings additional advantages as described next.
234 • Build Manager
Software User's Guide winIDEA
Targets
A project can have one or more Targets.
A Target controls all project files by defining default command line options for
newly added project files, and by defining an Output Directory for all
intermediate files generated in compile, assemble and link process.
Targets dialog
Before inserting any project files in the project, you should review and modify
the target settings in the Project Settings dialog.
Note: Target settings are shown, and can be edited when target’s name is
selected in the tree view of the project.
Every project file that you insert in the project will assume these target settings.
Later on, if you decide to modify targets settings, open the Project Settings
dialog, select the desired Target and configure new Target settings.
Use the 'Reset…' button
To apply Target settings to all project files - by doing so, you reset settings for
every project file (including those, whose settings have been set explicitly) to
current Target settings.
Software User's Guide winIDEA
Build Manager • 235
Use the 'Set Default…' button
To discard current Target settings and return to winIDEA's hard coded default
settings - by doing so you will change Target settings - which will apply to
newly added project files and to existing project files whose settings have not
been explicitly set (see below).
Review command line settings for compiler and assembler
236 • Build Manager
Software User's Guide winIDEA
Why Would You Want to Use More than One Target
In course of development you will sometimes wish to maintain a version that is
easy to debug (debug info, no optimizations, conditionally compiled debugging
aid code), and a version that you release in the finished product (no debug info,
full optimization, no unnecessary code, etc.).
Traditionally, you would work with so called 'Debug' settings when generating
debuggable code. When you wished to create a 'Release' version, you would
change all settings and make a full build of your project. This is inconvenient
because:
•
it takes quite a while to make a full build of a large project
•
if some files need special compiler settings (disable debugging in
certain modules etc.), you must take special care in defining settings for
these files every time you change 'global' settings.
•
you then need to do this all again to return settings back to 'Debug
mode'
winIDEA's Build Manager solves this
•
by maintaining settings for all configured targets, not just the current
one - so you have to define them only once
•
by keeping intermediate files (object, listing) in a separate Output
directory - which is different for every Target. Beside keeping your
source directories clean, this assures that object files located in 'Debug'
target directory are compiled with Debug settings and object files in
'Release' target directory with Release settings.
Hence, rebuilds are not necessary. When switching Targets you only
perform a 'Make'.
Adding a Target
Note: When a new project is created, a Target named 'Debug' is generated
automatically.
•
Open the Targets dialog in the Project menu.
•
Select the 'New…' button
•
In the 'New Target' dialog specify the name for the new target and
choose whether default options should be used, or target settings copied
from an existing target.
New Target dialog
•
Software User's Guide winIDEA
Select OK button to finish
Build Manager • 237
Note: when copying settings from an existing target, only target settings are
copied - not for every individual project file. Files with explicitly set settings
assume Target options in the new target. If you need to, you must configure
them manually.
Renaming a Target
To rename a target click the Rename button in the Project/Targets dialog.
Rename Target dialog
New Target Name
Specify the new name for the target.
Groups
A Group is a collection of project files. Every Group exists in every target and
groups the same project files. Besides being a visual aid in browsing project
hierarchy, group names can be used in the link process.
What Groups don't have, are compilation and assembly settings, output
directories, etc.
Why would You Want to Use More than One Group
238 • Build Manager
•
If you wish to enforce link order of an object file or group of object
files, the easiest way to do it is to define as many groups (with
descriptive names) as necessary. For a banked system, for example,
such names could be 'Common', 'Vectors', 'Bank 1' and 'Bank 2’, but
also 'Jack's files', 'Nancy's files' etc.
•
When a hundred or more project files are used, you will find it hard to
find them in the Project Workspace window. By organizing them in
groups (again with descriptive names) you will find them much faster.
Software User's Guide winIDEA
Adding a Group
•
Open the Context menu of the Project Workspace Window
•
Select the 'Add Group…' command
•
Enter then name for the new group when prompted for it
•
Select the OK button to finish
Project Files
Project files are the meat of your project. By compiling, assembling and linking
them, your project is built.
winIDEA divides project files by their extension into four types:
Software User's Guide winIDEA
•
compiler source files (typically .C extension)
•
assembler source files (sometimes .ASM, but also .A51, .S07, …)
•
object and library files (.OBJ, but also .H11, .R03…)
•
files that do not take part in the build process - text files, graphics anything that you find handy to have available by mouse click in the
Project Workspace Window.
Build Manager • 239
Configuring Project Files
•
Select the 'Project Files…' command from the Project menu
•
In the Project Files dialog, select the files you wish to add, and the
group you wish to add them to.
•
Select the OK button to finish.
When a project file is inserted in the project, a set of settings for every existing
target is generated for it. For every target, current target settings are used.
The Project Files dialog
Alternatively, you can add a file which is open in an editor, by selecting the 'Add
to project' command from editor's local menu.
Link Order of Files and Groups
On certain occasions the project's object and library files must be linked in
specific order. The Build Manager will process groups and their project files in
alphabetical order unless specified differently in the link order dialog.
240 • Build Manager
Software User's Guide winIDEA
Link Order dialog
To open the link order dialog:
•
select the target in the project workspace window
•
right-click it to open the context menu
•
select the Link Order… command
Build Manager passes groups to the linker as they are listed in the Group list.
You can change the ordering of groups by selecting a group and moving it up
and down in the list with the arrow buttons right of the list.
Inside a group, project files are processed as they are listed in the Files list.
Software User's Guide winIDEA
Build Manager • 241
Compiler Tool-set Integration
To take maximum advantage of winIDEA's Build Manager, numerous settings
must be configured properly. winIDEA ships with ready-made example projects
for all major compilers, which you can use as template workspaces for your new
projects.
For quick starts and small projects, you can use an example workspace as a
template for your workspace, for bigger projects however you will want to have
more control over the Build Manager's settings.
You have already learned how to add targets and groups, what remains is the
Project Settings dialog, where global, target and project file specific settings can
be configured.
Scope of Settings
Project settings can have one of following scopes:
•
Global scope - always valid (example: path to assembler EXE)
•
Target scope - valid when the respective target is selected
(example: Target's output directory)
•
File scope - valid when a file is being compiled or assembled
(example: compiler command line options)
Configuring Settings for Multiple Files
Settings for multiple files can be configured simultaneously. To do so:
•
expand the project hierarchy as needed
•
select project files, groups and targets that you wish to manipulate
•
configure settings that you wish all selected files to assume
In the figure below, settings for following files are being manipulated:
•
main.c in the 'Debug' target
•
All files in the 'BANK Files' group in the 'Debug' target
•
All files in the 'Release' target
In dialog pages where target and project file specific settings can be set, you will
notice two buttons which are used to reset settings.
242 • Build Manager
Software User's Guide winIDEA
The 'Reset' button
Clicking on 'Reset' button will preset settings for currently selected files to
current target settings. In previous example this means:
•
main.c in the 'Debug' target assumes current 'Debug' target settings
•
All files in the 'BANK Files' group in the 'Debug' target assume current
'Debug' target settings
•
All files in the 'Release' target assume 'Release' target settings
In other words, selecting 'Reset' on any file or group of files, discards all settings
that were defined explicitly (for a project file after it has been inserted into
project).
Setting options for multiple files simultaneously
The 'Set Default' button
The 'Set Default' is enabled only when a target is selected. Clicking it will cause
the selected target to assume settings that are hard coded into winIDEA.
This will also affect settings of all project files in the target whose settings have
not been changed explicitly.
Software User's Guide winIDEA
Build Manager • 243
General page
Project Settings dialog, General page
244 • Build Manager
Software User's Guide winIDEA
External Make File
When this option is checked the Build Manager will not attempt to build the
project by itself but will rather call an external batch file - which you must
specify. This batch file is now in charge of creating the absolute object file.
This option effectively disables the Build Manager. All make and build requests
are routed to the external make file. It will however still detect modifications to
either project or include files and invoke the external make file when necessary.
This setting has global scope.
Parameters
The string specified here will be passed to the external make file.
This setting has global scope.
Compiler toolset path
Compiler toolset path defines the directory where compiler, assembler, linker
and companion files have been installed. Although you will see absolute paths to
compiler, assembler and linker or to library files included in the project files list,
all these paths are internally kept as relative to this directory. If you have
different version of your compiler installed in different directories, you can
easily switch amongst them just by changing this path.
This setting has global scope.
This option also accepts entries with environment variables enclosed in % signs.
Example:
The environment variable C_BASE is set to 'X:\C51'.
The entry in the 'compiler toolset path' option set to '%C_BASE%\BIN' would
yield 'X:\C51\BIN'.
Executable Directory
Defines the directory where executable files are stored when the selected target
is active.
This setting has target scope.
Intermediate files directory
Intermediate files directory option controls placement of temporary files
generated during compile and assembler runs. If the option is checked, these will
be put in the specified subdirectory of the Root directory.
If this option is not checked, the intermediate files will be placed into the
Executable directory.
This setting has target scope.
Executable File
Defines the name of the file, which is generated at the end of the build process.
This will usually be the final executable (absolute object file) generated by
linker. This file must be known by the Build Manager to tell a successful build
from an unsuccessful one.
Although you must specify only the name of the file (without any path
specification), the file is always searched for in the current target's output
directory.
Software User's Guide winIDEA
Build Manager • 245
This setting has global scope.
Root Directory
Specifies a root directory for project files location. Using a root directory,
winIDEA can store paths to project files in relative from, thus assuring
workspace moveability.
If this field is left blank the workspace directory (see "Workspaces" on page 11)
is used as the root directory.
X248H
X
X249H
X
This setting has global scope.
This option also accepts entries with environment variables enclosed in % signs.
Example:
The environment variable C_BASE is set to 'X:\C51'.
The entry in the 'root directory' option set to '%C_BASE%\BIN' would yield
'X:\C51\BIN'.
Error Filter
Defines the method by which output emitted by translation tools (compiler,
assembler and linker) is filtered to extract errors and warnings.
If your compiler is not supported, you can still view unfiltered output in the
'tools' pane of the output window.
This setting has global scope.
Advanced
Clicking this button configures advanced filter options.
The default settings in the advanced dialog are hard coded in the winIDEA for
the currently selected filter.
Advanced filter options
You may change this options if no filter is available for you version of compiler.
246 • Build Manager
Software User's Guide winIDEA
Use default error file
If this option is checked, the default error file for the generated tool is used. This
file can be either captured STDOUT or STDERR stream or a file with a standard
named or extension.
This standard file is hard coded in winIDEA for the current filter.
Use Custom error file
Check this option to override the default error file. You can use macro names
available by clicking the '>' button.
Exclude File from Make
When this option is checked the selected file will not be processed by any of the
translation tools, no matter what type it is.
This setting has file scope.
Includes
Project Settings, Includes page
Include Search Paths
The Include File Directories list holds a record of all directories that should be
searched for include files. The include files are searched in directories in order of
their appearance in ‘Includes search paths’ dialog. The order can be changed by
pressing the ‘up’ or ‘down’ arrow.
If ‘Search subdirectories’ at a selected path is selected, also the subdirectories of
this path are searched.
Note: these directories are used by the Build Manager to search for include files
used by project files to determine whether an include file has changed, in which
case the project file needs to be recompiled.
If the compiler itself requires include files path specification, you must provide
Software User's Guide winIDEA
Build Manager • 247
this separately in the form that your compiler expects (environment variables,
command line options, configuration files, etc.)
This setting has global scope.
Warn if include file is not found
This option toggles whether a warning is issued when an include file is found or
not.
Check Assembler Includes
Since there is no standard (like ANSI for C/C++) to define an include file for an
assembler, the include syntax must be described manually.
If ‘Check assembler Includes ‘ is checked, assembler project files will be
searched for includes
Require leading blanks
Check if the include directive must not start in the first column.
Allow leading blanks
Check if the include directive can start in any column, including the first.
Include Keyword
Specify the include directive keyword.
Path start char
Specify the character that immediately preceeds the include file name.
Path end char
Specify the character that immediately follows the include file name.
The dialog will show an example of the current configuration in the ‘Example’
field.
248 • Build Manager
Software User's Guide winIDEA
File Extensions page
The File Extensions page defines file extensions by which files handled by the
Build Manager are identified.
Project Settings dialog, File Extensions page
All settings on this page have global scope.
For every build step the extra extensions indicate other types of files that can be
generated in the process. A file that carries the same name and one of the
extensions specified here is moved to the output directory along with the object
file.
These types can be specified when the "Don't use time based build manager"
option on the Customize page is selected.
Compiler extensions
These are the types of files that a standard C compiler deals with:
•
C files - winIDEA's project files (usually .C or .CPP). If more than one
extension is possible, separate them with commas or semicolons.
•
Header files - included by project files
(usually .H)
•
Output files generated by compiling a C file (usually .OBJ). If your
compiler generates assembler source, specify the extension of generated
assembler source files.
Assembler extensions
For assembler the following extensions must be defined:
Software User's Guide winIDEA
•
Assembler source files - winIDEA's project files. If more than one
extension is possible, separate them with commas or semicolons.
•
Object files generated by compiling an assembler file (usually .OBJ)
Build Manager • 249
Linker extensions
•
For the linker, only input extensions must be specified. These include
object file extensions and library file extensions.
Customize page
Customize page contains additional options for running translators.
All settings on this page have global scope.
Project Settings dialog, Customize page
Run After Linker
After link process successfully terminates, sometimes additional tools (object
file converters, etc.) must be ran. If you need to run a tool or a batch file, specify
its path and command line arguments here.
Run translators with relative path
When checked, the translator is passed a relative path of the file(s) it requires for
translation.
Otherwise absolute paths are used.
Copy output files to target directory
When checked, all files generated in process of translation (object, listing, etc.)
are moved to current target's output directory.
Otherwise no files are moved.
Beep when done
By default, winIDEA beeps after the build is done. With this option, the beep
can be turned off.
250 • Build Manager
Software User's Guide winIDEA
Change working directory
When checked, the current (working) directory is changed to the directory of the
file being processed.
This is required by some compilers.
Display tool parameters
Displays parameters passed to the tool.
Show tool window
Under certain conditions a compiler/assembler/linker or a custom tool, which is
spawned by winIDEA, can create it's own subprocesses, which run
independently of it and winIDEA has no knowledge of them. If such a process
hangs, or awaits user input, winIDEA can not abort it.
The bad thing about this is that users don't see the spawned process screen, as
winIDEA launches the initial process in a hidden window.
If this option is checked, the spawned process will be shown in a normal
window. Since compiling multiple files will cause windows to pop-up and close
for every file, this option is off by default. It should only be used if 'hang'
situations occur.
Environment Settings
Some compilers require special environment variables that tell them where to
search for include files, library files, etc. Traditionally you had to set these
options with SET command in the AUTOEXEC.BAT file. You can still do it the
old way, but you can also specify them in this field.
To set a variable X to value A, write
X=A
Note: you must not use the SET keyword when defining the variable.
You can use existing environment variables in new definitions. Following
definition extends the PATH variable to include new path:
PATH=%PATH%;c:\C51
Software User's Guide winIDEA
Build Manager • 251
Run Before/After
Actions preceding make/build or following compile or assembly execution can
be configured. In this case, select the 'Run Before/After' button.
Run Before/After dialog
Translator Execution
Clicking the 'Translator Execution…' will open the Advanced Translator
Execution dialog, where you can define how individual tools are spawned and
their output captured.
Run with command interpreter
When checked the tool is not spawned directly, but rather with a command
interpreter.
If the tool fails to start or it's output can not be captured with default settings,
you may try changing this option.
In general the option should be checked when running under Windows NT and
unchecked when running under Windows 9x.
If the compiler is installed in a path with blanks, this option must be cleared. If
the compiler doesn’t operate in this case, the path must be renamed so it doesn’t
contain blanks.
Capture translator output
When checked the STDOUT and STDERR streams are indirected to a disk file
which winIDEA later uses to filter out the error messages.
In general this option should be checked. The only case are tools that expect
input on the STDIN stream or send file output to the STDOUT stream. In such
case this option should be unchecked (for such tools the error output is usually
generated in a separate error file).
252 • Build Manager
Software User's Guide winIDEA
Advanced Translator execution options
Compiler page
The compiler page contains options specific to the C compiler. If you are using
only assembler, you do not need to set any options on this page.
Project Settings dialog, Compiler page
Compiler Path
Specifies the path to the compiler's EXE file.
This setting has global scope.
If you wish to call up a batch file, you can not specify its path directly, but must
create an intermediate batch file that calls up your batch file.
Software User's Guide winIDEA
Build Manager • 253
If the compiler path is left blank, then the first argument in the 'Options' setting
should be the translator path. This allows per file configuration of the used
compiler (since, for example, some older ARM compilers provide a separate
compiler for ARM and Thumb mode).
Example:
Files are compiled with COMPILE.BAT. To call it from winIDEA, create a new
batch file COMPILE1.BAT containing:
CALL COMPILE.BAT %1
Specify COMPILE1.BAT as the path to the compiler. winIDEA will replace
occurrences of %1 in the batch file with options configured on the page.
Compiler Command Line Options
In this edit field you must enter command line options you wish the compiler to
be called with when the selected file is compiled. These will usually be code
generation options, conditional defines, etc.
Additionally macro entries are supported, available from the button on the right
of the Options edit field. The simplest command line option will usually contain
the macro for the file name being compiled:
$(EDNAME)
This macro will expand to the full file name at the time when the compiler is
invoked.
This setting has file scope.
Run Assembler
When this option is checked, the Build Manager will run the assembler on the
output file generated by compiler.
This setting has file scope.
Command Line Defines
In this option all command line defines, needed for the compiler to operate, can
be specified.
Prefix/Postfix
The Prefix and Postfix are used when the $(DEFINES) macro is used. Every
command line define specified is completed with the value specified in the
Prefix and Postfix options.
254 • Build Manager
Software User's Guide winIDEA
Assembler page
The assembler page contains options specific to the assembler. If you are using
only compiler, you do not need to set any options on this page.
Project Settings dialog, Assembler page
Assembler Path
Specifies the path to the assembler's EXE file.
This setting has global scope.
If you wish to call up a batch file, you can not specify its path directly, but must
create an intermediate batch file that calls up your batch file.
If the assembler path is left blank, then the first argument in the 'Options' setting
should be the translator path. This allows per file configuration of the used
assembler (since, for example, some older ARM assemblers provide a separate
assembler for ARM and Thumb mode).
Software User's Guide winIDEA
Build Manager • 255
Example:
Files are compiled with ASSM.BAT. To call it from winIDEA, create a new
batch file ASSM1.BAT containing:
CALL ASSM.BAT %1
Specify the ASSM1.BAT as the path to assembler. winIDEA will replace
occurrences of %1 in the batch file with options configured on the page.
Assembler Command Line Options
In this edit field you must enter command line options you wish the assembler to
be called with when the selected file is assembled. These will usually be code
generation options, conditional defines, etc.
Additionally macro entries are support, available from the button on the right of
the Options edit field. The simplest command line option will usually contain the
macro for the file name being assembled:
$(EDNAME)
This macro will expand to the full file name at the time that the assembler is
invoked.
This setting has file scope.
256 • Build Manager
Software User's Guide winIDEA
Linker page
The linker page contains options specific to the linker.
All settings on this page have global scope.
Project Settings dialog, Linker Page
Linker Path
Specifies the path to the linker's EXE file.
If the linker path is left blank, then the first argument in the 'Options' setting
should be the translator path. This allows per file configuration of the used linker
(since, for example, some older ARM linkers provide a separate linker for ARM
and Thumb mode).
Linker Command Line Options
In this field you must enter command line options you wish the linker to be
called with. These will usually be only a path to the Indirection File with perhaps
some additional options.
Link Order
Click this button to change the order in which object files are passed to the
linker. See "Link Order of Files and Groups" on page 240.
X250H
X
X251H
X
Skip object file existence check
If this option is checked, winIDEA will not check whether all linker input files
(object, library) exist. By default, this option is off.
Software User's Guide winIDEA
Build Manager • 257
Linker Indirection File options
Due to large number of options that a linker must handle, most linkers can
retrieve linkage options from an indirection file (also called command file,
link file etc.).
Build Manager uses the indirection file to tell the linker which object and library
files should be linked. It will search the indirection file for occurrence of
translation characters, and replace them with a list of object files generated
from the project files list.
The following features and rules apply to creating indirection files that can be
used by winIDEA:
•
All occurrences of %1 are replaced with options specified in the Linker
Command Line Options field
•
All occurrences of %2 are replaced with the name of the final output
file (see “Executable File” on page 245).
X25H
•
X
X253H
X
Occurrences of translate characters are replaced with the names of
object files.
All these conversions do not have any influence on the original indirection file.
From it a new file is generated and the linker is given this file as the indirection
file. When the linker finishes, this file is erased. The location, where this file is
generated, is specified in the ‘Generate Replacement in’ option.
Generate replacement in
The replacement file for the Linker Indirection file will be generated in the
location, specified here. The available locations are:
•
the same directory : creates the replacement indirection file in the same
directory as the original indirection file. This option is the default and
recommended as it allows the indirection file to contain references to
other files in relative form.
•
Project Root directory : creates the replacement indirection file in the
Project Root directory
•
Target Exec directory : creates the replacement indirection file in the
current target's Exec directory. Note: this was default location in
winIDEA 2005 and earlier.
Translation Character
When the translation character ('&' default) is encountered in the indirection file
the Build Manager replaces it with the names of object files derived from the
project files list.
There must always be at least two translation characters. The string of characters
that they embed is used as the delimiter between object files:
Example:
if project files are TST1.C, TST2.C, TST3.C and LIBRARY.LIB, then
&,&
expands to
TST1.OBJ,TST2.OBJ,TST3.OBJ,LIBRARY.LIB
If you check the 'CR-LF After File Name' option, then every object/library file
name will be written in a new line:
For the previous example:
258 • Build Manager
Software User's Guide winIDEA
TST1.OBJ,
TST2.OBJ,
TST3.OBJ,
LIBRARY.LIB
If more than two translation characters occur, the following syntax applies:
&<prefix>&<delimiter>&<postfix>&<group>&
For each project file <prefix> will be put before the file name, and <postfix>
behind the name. Project files will be delimited with <delimiter>.
If a group (see "Groups" on page 238) is specified, then only project files that
belong to the specified group are inserted at that position.
X254H
X
X25H
X
If in the previous example LIBRARY.LIB and TST1.C belong to group
'COMMON' and TST2 and TST3 to group 'BANK1' then following code:
BASE 0
&load &&&COMMON&
BASE 8192
&load &&&BANK1&
generates:
BASE
load
load
BASE
load
load
0
LIBRARY.LIB
TST1.OBJ
8192
TST2.OBJ
TST3.OBJ
The Build Manager will keep a record of which groups have already been
written, so if a translation character sequence without group specification is
found, the object files of all remaining groups are written in that place.
Here is a summary of how fields between translation characters will be
interpreted for different numbers of translation characters:
&<delimiter>&
&<prefix>&<delimiter>&
&<prefix>&<delimiter>&<postfix>&
&<prefix>&<delimiter>&<postfix>&<group>&
Note: The placement of tags in the indirection file takes precedence over link
order settings.
Path separator
This character is used in the indirection file to construct a full path to an object
file. Most linkers understand the backslash '\', but others expect a forward slash
'/'.
Software User's Guide winIDEA
Build Manager • 259
Build Page
The build page contains options related to build operations.
All settings on this page have global scope.
Project Settings dialog, Build page
Settings on this page allow you to specify how Project/Make and
Project/Rebuild operations are performed.
•
Internal (default) - uses winIDEA’s integrated make utility. In case of
Make command, all project files that are out of date are recompiled and
finally linked. In case of Rebuild, all project files are recompiled and
linked.
•
External – the specified executable is invoked. It is the responsibility of
this executable to perform the requested operation.
Note: Unlike General/Use External Make which invokes the external make
utility after winIDEA identified one or more files being outdated, these tools are
ran unconditionally.
260 • Build Manager
Software User's Guide winIDEA
Build Manager Macros
Whenever defining command line options, build manager macros can be used.
The macro list is invoked by pressing the
button. The macros that are
normally used for the option you are defining command line for are shown.
Build Manager Macros selection
The selected macro is translated to a simple note in the command line, which
will be translated to the selected option. For example, the macro selected above,
'Compiler output extension' would translate to $(COUTEXT), which would
translate when generating the command line option to, for example, OUT, which
is the compiler output file extension.
Available Build Manager Macros and their descriptions
The macros listed here are marked by the macro name, its verbose name as it
appears when pressint the
button, and their description.
$(CMPDIR)/Compiler directory
Path specified in the 'Project/Settings/General/Compiler toolset path'
$(IRFDIR)/Workspace directory
The Project root directory
$(EXEDIR)/winIDEA directory
The directory where winIDEA.exe is located
$(EDNAME)/Full file name
The file name of the file currently compiled/assembled
$(DIR)/Directory of file
The directory of the file currently compiled/assembled
$(NOEXT)/File name
The file name of the file currently compiled/assembled, without file extension
$(OUTPUTFILE)/Output file name
The name specified in 'Project/Settings/General/Output file name'
Software User's Guide winIDEA
Build Manager • 261
$(OUTPUTDIR)/Target output directory
Current target output directory as specified in 'Project/Settings/General/Output
directory'
$(OUTPUTPATH)/Full Target output directory
Current target output directory as specified in 'Project/Settings/General/Output
directory' in full path form.
$(OUTPUTNOEXT)/Output file path without extension
The name with path specified in 'Project/Settings/General/Output file name',
without file extension
$(OUTPUTNAME)/Output file name without extension
The file name specified in 'Project/Settings/General/Output file name', without
file extension
$(CEXT)
File extension specified in 'Project/Settings/File Extensions/Compiler/Input
Ext'.
$(COUTEXT)/Compiler Output Extension
File extension specified in 'Project/Settings/File Extensions/Compiler/Output
Ext'.
$(AEXT)
File extension specified in 'Project/Settings/File Extensions/Assembler/Input
Ext'.
$(AOUTEXT)/Assembler Output Extension
File extension specified in 'Project/Settings/File Extensions/Assembler/Output
Ext'.
$(FILEGROUP)/File Group Name
The name of the Group to which the currently compiled/assembled file belongs.
$(INDPATH)/Indirection File Path
Expands the full path of the indirection file name.
$(DEFINES)/List of C preprocessor defines
The list of defines parsed to the C preprocessor.
262 • Build Manager
Software User's Guide winIDEA
Using an Example Workspace as a Template
You can make a quick start by modifying one of the example projects for the
compiler that you use as follows:
Software User's Guide winIDEA
•
Use Windows Explorer to create a new directory for the new workspace
•
Copy workspace (.JRF) and project configuration (.QRF) files from the
example project directory. You can rename them if you wish, just make
sure that .JRF and .QRF extensions remain and that the names are the
same.
•
Copy any project files you wish to include in your project from the
example directory. This could be startup files, interrupt function
examples, etc.
•
Open the newly copied workspace in winIDEA.
•
Remove unused example project files from the project files list
•
Add your project files to the project files list
•
Select the Build command to rebuild the entire project
Build Manager • 263
Build Session
When the Build Manager processes a project file or links the project it creates a
child process with redirected standard handles (STDOUT and STDERR). The
child process runs in a hidden window, so you do not get to see it while it runs.
Any captured output is displayed in the Output window after the process ends.
Output Window
The Output Window is a scrollable, terminal style window that shows raw or
filtered output emitted by external tools spawned by winIDEA.
Build Pane
The Build pane displays build progress and compiler, assembler and linker
output filtered by respective filter programs. If no filters have been configured,
only build progress and unsuccessful generation of expected output file is
displayed.
Output Window, Build Pane
In above figure the highlighted line is a filtered error message. By double
clicking on it, the source file of the error is opened and positioned to the location
of the error.
If no filter was configured for the compiler all lines but this one would have been
displayed.
Tools Pane
The 'Tools' pane displays all output emitted to standard output (STDOUT) and
standard error (STDERR) by any external tool, including build tools. No filtering
occurs.
264 • Build Manager
Software User's Guide winIDEA
Output Window, Tools pane
In above figure, error messages were emitted to STDOUT, you can review them
but no automatic error source tracking is available.
Note: tools output is captured only when the 'Capture Translators Output'
("Customize page" on page 250) option is checked.
X256H
Software User's Guide winIDEA
X
X257H
X
Build Manager • 265
Building
winIDEA's Build Manager can build on demand (compile or assemble) a single
project file, all modified project files (make) or all project files (rebuild).
Building a Single Project File
Compile button
•
Open the project file that you wish to build
•
Write any desired changes to the source
•
Select 'Compile/Assemble' command from the context menu,
from the Project menu or click the Compile button on the
Project toolbar.
alternatively you can:
•
Select a file in the Project Workspace window
•
Select the 'Compile/Assemble' command from the context menu
Building All Modified Project Files
This is probably the build command you will be using most, since Build
Manager automatically detects which files need to be built and performs all
necessary actions to get the project up to date.
To build all modified project files
•
Select the 'Make' command from the Project menu
•
Click the Make button on the Project toolbar
or
Make button
Building All Project Files
On certain occasions, such as when you upgrade your compiler or suspect that
the 'Make' didn't get the project built OK, you can instruct the Build Manager to
build all project files unconditionally.
To build all project files
•
Select the 'Rebuild' command from the Project menu
•
Click the Rebuild button on the Project toolbar
or
Rebuild button
Breaking the Build
winIDEA's Build Manager performs all actions in background, so you are free to
continue with your work while build is in progress. If for some reason you wish
to abort building
•
Select the 'Stop Build' command from the Project menu
•
Click the Stop Build button on the Project toolbar.
or
Stop Build button
266 • Build Manager
Software User's Guide winIDEA
Workgroup Support
winIDEA's file access is designed to allow multiple developers to work on a
project.
When two or more developers share project code, simultaneous write access to
shared files must be avoided. This is usually achieved through use of a
source/revision control system like RCS, PVCS or SourceSafe.
Currently winIDEA integrates to Microsoft's Visual Source Safe and Intersolv
PVCS. When integrated support is enabled, following operations are available
from winIDEA:
•
Add to source control
•
Remove from source control
•
Get latest version
•
Check-in
•
Check-out
•
Undo check-out
•
Refresh status
If a different source control system is used, all these operations must be
performed manually in the source control application.
Configuring the source control system
To enable integration to a source control system, select the 'Settings…' command
from the Project/Source Control menu.
Source Control System
Determines the source control system, which winIDEA can integrate.
To perform vendor specific configuration, click the 'Configure…' button.
Get files when opening the workspace
Executes a 'Get' command immediately after workspace is loaded.
Check out source files when edited
When a file marked read-only is under source control, winIDEA checks it out
automatically.
Software User's Guide winIDEA
Build Manager • 267
Check in files when closing the workspace
Checks-in all checked-out files when a workspace is closed.
Prompt to add files when inserted
When a file is inserted in the project, winIDEA will prompt you whether you
wish to put the file under source control.
The Source Control Settings dialog
Perform background status updates
Source control status is checked periodically in the background.
Use dialog for checkout
Before file(s) are checked out, the operation is confirmed in a dialog.
Include only selected files in dialogs
Only files selected (in the workspace window or the active file) are shown in a
confirmation dialog.
268 • Build Manager
Software User's Guide winIDEA
Microsoft Visual Source Safe
Note: Microsoft Visual Source Safe must be properly installed and running
before attempting to use it with winIDEA. Please refer to the user's manual of
the software for more information.
Source Safe settings dialog
Database Path
Specifies the path to the Source Safe database.
Select 'Use Default' option, to use the database path stored in the system registry.
Username and Password
Specifies the user name and password to use when connecting to the source safe
server.
Select the 'Use Default Username & Password' option to use the default.
The username and password can be read from the environment variables. To do
this, the variable must be enclosed in the ‘%’ sign, for example to use the
username from the environment variable called ‘USERNAME’, enter the text
‘%USERNAME%’ into the appropriate window.
Project
Specify the source safe path to the project to which the workspace's project is
mapped in.
Working Folder
Specify the working directory – typically a folder on the local disk.
Select the 'Use Project Root directory' to use the setting specified in the
Project/Settings/General dialog.
Software User's Guide winIDEA
Build Manager • 269
Merant Version Manager
Note: Merant Version Manager must be properly installed and running before
attempting to use it with winIDEA. Please refer to the user's manual of the
software for more information.
Merant Version Manager settings dialog
Merant Version Manager Path
Specifies the path to the Merant executable.
Use Configuration File
Indicates that the specified configuration file should be used.
Use Username & Password
Specifies the username and password to use for the Merant database.
Project (Relative to database)
Enter the project name, relative to the database here. In the upper example, the
project 'Project1' would be used.
270 • Build Manager
Software User's Guide winIDEA
Merant Version Manager configuration
Working Folder
Specify the working directory – typically a folder on the local disk.
Select the 'Use Project Root directory' to use the setting specified in the
Project/Settings/General dialog.
Source Code Control Interface (SCCI) Systems
Note: The SCCI software must be properly installed and running before
attempting to use it with winIDEA. Please refer to the user's manual of the
software for more information.
The Source Code Control (SCC) Interface is a common protocol for source code
control providing software. To configure the integration, select 'SCCI Providers'
in the Source Control System and press the 'Configure' button.
SCCI settings dialog
Active control provider
Select the source control provider. All SCC providers will be listed here.
Software User's Guide winIDEA
Build Manager • 271
Note: the interface was tested only with ComponentSoftware RCS Source
Control and ClearCase.
Username
If the SCCI software uses the same username with which the user is logged in to
Windows, keep the 'Use default Username' checkbox checked. Is an other
username needed, uncheck the checkbox and enter the correct username.
Project name
Enter the project name, recorded to the master database of the SCCI software
(the Repository, if CS-RCS is used).
Local Project Path
Enter the path of the project on the local disk here. The path should not end with
a backslash (\), or the software will not be able to save the project to the
database.
User interface to a source control system
winIDEA will use different icon colors in the workspace window to indicate file
status:
•
White background is used for files which are not controlled
•
Gray background is used for files that were found in a source control
system
Files, which are source controlled, are furthermore colored:
•
Black icon text indicates that the file is checked-in (is available for
check-out)
•
Red icon text indicates that the file is checked-out (is available for
editing)
•
Blue icon text indicates that the file is checked-out by another user, or
to a different directory
To view detailed source control information:
•
Select the file in the workspace window
•
Select the 'Properties…' command from the context menu.
Beside file system information, the source control status is displayed in the
bottom line. You will find this very useful, when you wish to identify the
developer who has a file checked-out that you wish to edit.
272 • Build Manager
Software User's Guide winIDEA
Workspace window appearance in a source control enabled project.
If an attempt is made to alter contents of file, winIDEA will check if read-write
access to the file can be gained through check-out operation. If so, it will prompt
for confirmation.
The check-out prompt
Software User's Guide winIDEA
Build Manager • 273
Source Control File Selection
Before a source control operation is performed, a file selection dialog pops up.
Depending on the selection mode, different files are shown in the dialog.
•
If the source control operation is requested with an editor being active,
then only that file is listed in the dialog.
•
If some files or groups of files are selected in the workspace window,
then only selected files are shown
•
Otherwise all controlled files for which the requested operation is
available are listed.
Check-out selection dialog
Which files to put under source control
The following files should be stored in a source control system database:
•
program source files. These include C compiler source and include
files, assembler source and include files.
•
project configuration file (.QRF). See Build Manager "Introduction" on
page 231
X258H
X259H
•
X
X
any other shared files
The following files are private to user/workstation:
274 • Build Manager
•
workspace file (.JRF). See "Workspaces" on page 11.
•
intermediate files generated in build process (object files, listing files,
assembler files generated by compiling C source, etc.)
•
download files
X260H
X
X261H
X
Software User's Guide winIDEA
Software User's Guide winIDEA
Build Manager • 275
Script Language
winIDEA Script Language
winIDEA provides a simple C-like script language that can be used to facilitate
common task like testing. The script files are identified by the ISL extension.
ISL Syntax
The syntax of ISL resembles that of the C programming language. If you are
familiar with C it will be easy to write programs in ISL.
The strings in ISL follow C syntax. The backslash character '\' is treated as start
of an escape sequence. Here's a list of supported escape sequences:
Character
ASCII
Representation
ASCII
Value
Escape
Sequence
Newline
NL (LF)
10 or 0x0a
\n
Horizontal tab
HT
9
\t
Vertical tab
VT
11 or 0x0b
\v
Backspace
BS
8
\b
Carriage return
CR
13 or 0x0d
\r
Formfeed
FF
12 or 0x0c
\f
Alert
BEL
7
\a
Backslash
\
92 or 0x5c
\\
Question mark
?
63 or 0x3f
\?
Single quotation mark
'
39 or 0x27
\'
Double quotation mark
"
34 or 0x22
\"
Software User's Guide winIDEA
Script Language • 277
An ISL program is based on a single non-document text file.
ISL constitutes of different tokens. These tokens are:
•
ISL-keywords
•
ISL-operators
•
ISL-identifiers
•
ISL-string literal
•
ISL-numbers
ISL-keywords
•
declare
•
do
•
else
•
for
•
function
•
if
•
int
•
loop
•
return
•
var
•
void
•
while
ISL operators
Operator
278 • Script Language
Description Example
=
assign
a=2
+
plus
a=2+3
-
minus
a=a-1
/
divide
a=a/2
*
multiply
a=a*2
&&
logic AND
a&&b
||
logic OR
a||b
!
logic not
!a
==
equal
a==b
!=
not equal
a!=b
<
less
a<b
>
great
a>b
<=
less or equal
a<=b
>=
great or equal
a>=b
()
parenthesis
(((a-2)*3)+1)/2
Software User's Guide winIDEA
ISL identifiers
ISL identifiers are used to name variables and functions. All identifiers are case
sensitive and may contain the following characters:
•
underscore ‘_’
•
letters (‘A’-‘Z’ and ‘a’ to ‘z’)
•
digits (‘0’ to ‘9’).
A digit must not be the first character of an identifier.
String literals
Have the form:
“character-list”
Where character-list is a list of ANSI characters.
Currently ISL does not support string variables, but you can use a string literal as
a parameter to winIDEA's built in functions (All these function have prefix
API).
Example:
ISL_APIPrintString( “Hello”);
ISL numbers
All ISL numbers are signed 4 byte integers.
Your first ISL program
Here is the listing of your first ISL program.
function void main()
{
APIPrintString("Hello!");
}
To create and run it proceed as follows:
•
run winIDEA
•
create a new file
•
write the above ISL program
•
save this file, giving it “.ISL” extension. (for example “Hello.isl”).
•
select "Run ISL" command from Tools menu or editor's local menu.
Output generated by an ISL program is displayed in the Output window.
If winIDEA can not interpret the ISL program, errors are written to the Build
pane of the Output window.
Software User's Guide winIDEA
Script Language • 279
Running a script program
To run a script program, select the 'Run Script…' command from the Tools
menu.
The 'Run Script' dialog
In the dialog specify the script file to execute.
Alternatively, you can start a script program if the script file is open in the editor
and you select the 'Run Script' command from the context menu.
Another alternative is to run the script as a keyboard shortcut.
Running a script program as a keyboard shortcut
Four different script programs can be defined to be run as a keyboard shortcut.
There are two prerequisites for this:
280 • Script Language
•
the script program must be named ‘SCRIPT1.ISL’ through
‘SCRIPT4.ISL’, and
•
the appropriate keyboard shortcut must be defined in the
‘Tools/Customize/Keyboard’ menu in the ‘Tools’ category for running
>Run ‘SCRIPT1.ISL’< through >Run ‘SCRIPT4.ISL’<.
Software User's Guide winIDEA
ISL from beginning
ISL program is divided into two parts:
•
global declaration block
•
functions part, where global declaration block can be omitted. Every
function or scope can also have its own local declaration block.
Every ISL program must have one function named 'main'. This function does not
accept any parameters, returns no value and must not be declared in the global
declaration block. Execution of an ISL program will begin with this function.
Global declaration block
If you will not use any global variable and there will only be the function main
in your ISL program there is no need for the global declaration block. The main
purpose of this block is to declare global variables and functions for later use.
Remember that you don’t have to declare function the main and all others API
functions.
The syntax of the declaration block has the following form:
_declaration_block_ =
declare
{
_function_declaration_;
_variable_declaration_;
}
Function declaration
_function_declaration_=
function _return_type_ <Name> (var _variable_type_,…);
Software User's Guide winIDEA
Script Language • 281
_return_type_ =
void or int
_variable_type_ =
int
Function declaration example:
function int Max (var int ,var int );
function void Test ();
Variable declaration
_variable_declaration_;
var _variable_type_ <Name>;
Variable declaration example:
var int a;
In the following example we will write a program which prints the numbers from
0 to 10 in the output window.
declare
{
var int a;
}
function void main()
{
for (a=0; a<10; a=a+1)
{
APIPrintF1("%d",a);
}
}
For printing numbers we used APIPrintF1 which is a simplified version of C
function printf. The format specifier recognizes only %d, thus the APIPrintF1
("%d", a) replaces %d with the value of variable formatted decimally.
In the next example we will show how to use a user defined function. Here is the
listing of this example.
declare
{
function int Max(var int, var int);
}
function void main()
{
declare
{
var int a;
}
a=Max(2,7);
APIPrintF1("Max of 2,7 is %d.",a);
}
function int Max(var int a, var int b)
{
if (a>b)
{
return a;
}
return b;
}
282 • Script Language
Software User's Guide winIDEA
The function 'Max' was first declared in the global declaration block as explained
before. The definition of a function is similar to declaration, only this time you
must provide variables names as well. Here is the syntax.
_function_definition_=
function _return_type_ <Name> (var _variable_type_
<Name>, ...)
{
_function_body_;
}
In this example we also use the local declaration block for declaring-defining
variable a. The Local declaration has the same syntax as the global declaration
block. Function declarations are not supported in the local declaration block.
Software User's Guide winIDEA
Script Language • 283
Expressions
Expressions consist of operators, numbers and variables and are very similar to
C expressions. The precedence and associativity is the same as in C language.
Example:
a=2*5/7;
a=b+c;
Statements
ISL supports five different types of statements. These are:
•
if-else
•
loop
•
for
•
while
•
do-while
All statements are very similarly to C statements, except for the 'loop' which is
not found in C language. Here is the syntax for all ISL statements.
284 • Script Language
Software User's Guide winIDEA
if-else statement
if =
if (_expression_)
{
_block_body_
}
Example:
if (a>3)
{
a=a+1;
}
or
if - else =
if (_expression_)
{
_block_body_
}
else
{
_block_body_
}
Example:
if (a<3)
{
a=a+1;
}
else
{
if (a==4)
{
a=0;
}
else
{
a=a-1;
}
}
Software User's Guide winIDEA
Script Language • 285
loop statement
loop =
loop ( _number_)
{
_block_body_
}
Example:
loop(10)
{
APIPrintString(“ten times”);
}
The loop statement repeats the _block_body_ _number_ times. Loop is very
simple to use when you need some action only to repeat _number_ times.
for statement
for =
for(expression1;expression2;expression3)
{
_block_body_
}
Example:
for (a=3;a<6;a=a+1)
{
APIPrintF1(“%d”,a);
}
or
for (;;)
{
APIPrintString(“Forever.”);
}
286 • Script Language
Software User's Guide winIDEA
while statement
while =
while(expression1)
{
_block_body_
}
Example:
a=0;
while (a<10)
{
a=a+1;
APIPrintF1(“%d”,a);
}
or
while (1)
{
APIPrintString(“Forever.”);
}
do-while statement
do -while =
do
{
block_body
} while (expression1);
Example:
a=0;
do
{
a=a+1;
APIPrintF1(“%d”,a);
} while (a<10);
or
do
{
APIPrintString(“Forever.”);
} while(1);
Software User's Guide winIDEA
Script Language • 287
Software API Functions
Summary of all supported software API
functions
The API funcitons are sorted in alphabetical order.
int APIAppendOutput(string strFileName, int bOutput);
void APIBeep();
int APIBeginTrace();
int APIClearBreakpoint(int iType, int iHandle);
int APIClearBreakpoints();
void APIClearDisplay();
int APICompareFiles(string pszFile1, string pszFile2, bool bDumpDifLines);
int APICopyMemory(int iFromMemArea, int iFromAddress, int iSize, int
iToMemArea, int iToAddress);
int APICreateProcess(string strApplicationName, string strCmdLine, BOOL
bSync);
int APIDownload();
int APIDownloadFile(int iFileIndex);
int APIDownloadFile1(string strFileName, int nReserved);
int APIEvaluate(string strExpression);
int APIEvaluate1(int iAccessMethod, string strExpression);
int APIEvaluate2(int nAccessMode, string strExpression);
void APIExit(int iExitCode);
int APIFillMemory(int iAccessMethod, int iMemArea, int iAddress, int iValue,
int iSize);
int APIFLASHProgramFile(string strFileName);
void APIGoto(LONG lAddress);
void APIGoto1(string strAddress);
void APIGotoLC(int iLine, int iColumn);
int APIInputNumber(string pszMessage);
int APILoadProject(string strFileName);
int APILoadProject1(string strFileName, int bSaveOld);
void APIMessageBox(string strMessage);
int APIMessageBoxYesNo(string strMessage);
int APIModify(string strLValue, string strExpression);
int APIModify1(string strLValue, int nValue);
int APIOpenMemoryDumpFile(string strFileName, int iForWrite);
int APIPassParameter(string strClass, string strTitle, int iParameter);
void APIPrintB(int iValue, int iNumBits, int iNumBlanks);
void APIPrintF1(string strText,int iV0);
288 • Script Language
Software User's Guide winIDEA
void APIPrintF1LC(int iLine, int iColumn, string strText,int iV0);
void APIPrintF2(string strText,int iV1,int iV2);
void APIPrintF3(string strText,int iV1,int iV2,int iV3);
void APIPrintInteger(int iValue);
void APIPrintIntegerLC(int iLine, int iColumn, int iValue);
void APIPrintString(string strText);
void APIPrintStringLC(int iLine, int iColumn, string strText);
int APIProjectImport(string strImportFileName, int iReserved);
int APIProjectIsUpToDate(int iReserved);
int APIProjectMake(int iLinkMakeBuild);
int APIProjectSetTarget(string strTargetName);
int APIReadInt(int nAccessMode, int nMemArea, int nAddress, int nSize, int
nBigEndian);
int APIReadMemory(int iMemArea, int iAddress, int iSize);
int APIReadMemory1(int iAccessMethod, int iMemArea, int iAddress, int
iSize);
int APIReadMemory2(int iAccessMethod, str strLocation, int iSize);
int APIReadMemoryDump(int iAccessMode, int iMemArea, int iAddress, int
iSize, int iReserved)
int APIReset(int bAndRun);
int APIRun();
int APISaveAccessCoverage(string strFileName, int nFlags);
int APISaveExecutionCoverage(string strFileName, int nFlags);
int APISaveProfiler(string strFileName, int nFlags);
int APISaveProject(string strFileName);
int APISaveTrace
int APISetBreakpoint(int iType, string strBP);
int APISetOutput(string strFileName, int bOutput);
int APISetOutput1(string strFileName, int bOutput, int bNoDefaultCRLF);
void APISetRegisterDump(int bDump);
void APISleep(int nMiliseconds);
int APIStepInto(int bHighLevel, int iNumSteps);
int APIStepOver(int iHighLevel, int iNumSteps);
int APIStop();
int APIVerifyDownload();
int APIWaitStatus(int nStatus);
int APIWaitStatus1(int nStatus, int iTimeout);
int APIWriteInt(int nAccessMode, int nMemArea, int nAddress, int nSize, int
nBigEndian, int nValue);
int APIWriteMemory(int iMemArea, int iAddress, int iValue, int iSize);
int APIWriteMemory1(int iAccessMethod, int iMemArea, int iAddress, int
iValue, int iSize);
Software User's Guide winIDEA
Script Language • 289
int APIWriteMemory2(int iAccessMethod, str strLocation, int iValue, int iSize);
int APIWriteMemoryDump(int iAccessMode, int iMemArea, int iAddress, int
iSize, int iReserved);
int APIWriteTrace(str strFileName, int nFrom, int nTo);
Please note that all string values use the same sting literals as the ISL language
and follow the ANSI C convention for escape sequences:
Character
ASCII
Representation
ASCII
Value
Escape
Sequence
Newline
NL (LF)
10 or 0x0a
\n
Horizontal tab
HT
9
\t
Vertical tab
VT
11 or 0x0b
\v
Backspace
BS
8
\b
Carriage return
CR
13 or 0x0d
\r
Formfeed
FF
12 or 0x0c
\f
Alert
BEL
7
\a
Backslash
\
92 or 0x5c
\\
Question mark
?
63 or 0x3f
\?
Single quotation mark
'
39 or 0x27
\'
Double quotation mark
"
34 or 0x22
\"
Also, please note that the integer values in the ISL language can store 32-bit
values.
Please note that there is also a connection of hardware API functions. For more
information on Hardware API Functions, please consult the Hardware User’s
Guide.
290 • Script Language
Software User's Guide winIDEA
int APIAppendOutput(string strFileName, int bOutput);
Configures file and screen output.
return value
Returns 1 on success, 0 on failure
strFileName
Defines the name of the file that is to receive output. If the file already exists, the
output will be appended to it.
If this parameter is blank, output is not written to any file.
bOutput
When set to 1 output is written to the output window, if set to 0, output is not
written to the output window.
void APIBeep();
Beeps the system tweeter.
Example
APIBeep();
Beeps the tweeter
int APIBeginTrace();
Begins trace
return value
Returns 1 on success, 0 on failure
Example
APIBeginTrace();
Begins the trace
int APIClearBreakpoint(int iType, int iHandle);
Clears a breakpoint
return value
Returns 1 on success, 0 on failure
Software User's Guide winIDEA
Script Language • 291
iType
Defines breakpoint type (see APISetBreakpoint)
iHandle
Specifies the handle of the breakpoint (see APISetBreakpoint)
Example
A=APISetBreakpoint(0,"0x1234")
...
APIClearBreakpoint(0, A);
Clears the execution breakpoint you have previously set with APISetBreakpoint
and its handle has been stored to the variable 'A'.
int APIClearBreakpoints();
Clears all execution breakpoints
return value
Returns 1 on success, 0 on failure
Example
APIClearBreakpoints();
Clears all breakpoints
void APIClearDisplay();
Clears the output window.
Example
APIClearDisplay();
Clears the output window.
int APICompareFiles(string pszFile1, string pszFile2,
bool bDumpDifLines)
Compares two files
return value
Returns 1 if files compare OK, 0 if files are different
pszFile1 and pszFile2
Files that should be compared
292 • Script Language
Software User's Guide winIDEA
bDumpDifLines
When set to 1 lines in which there are differences are listed.
Example
APICompareFiles("C:\\File1.txt", "C:\\File2.txt", 1);
Compares files C:\File1.txt and C:\File2.txt and lists the differences between
them.
int APICopyMemory(int iFromMemArea, int
iFromAddress, int iSize, int iToMemArea, int
iToAddress);
Copies a range of memory to another location
return value
Returns 1 on success, 0 on failure
iFromMemArea
Specifies CPUs memory area where the memory is to be copied from
iFromAddress
Address to copy from
iSize
Number of bytes to be copied
iToMemArea
Specifies CPUs memory area where the memory is to be copied to
iToAddress
Address to copy to
Software User's Guide winIDEA
Script Language • 293
int APICreateProcess(string strApplicationName, string
strCmdLine, BOOL bSync);
This function creates a new process on the host.
return value
If process is successfully created the return value is 0 if bSync is 0; otherwise it
is the exit code of the child process.
In case of failure, the return value is –1.
strApplicationName
The path to the application.
strCmdLine
Command line parameters for the application.
bSync
If 0, the APICreateProcess will return immediately, otherwise, it will wait for the
child process to terminate.
Note: use this function to spawn a child process that can perform any further
processing of output obtained by script execution.
Example
APICreateProcess("c:\\test\\test.exe", "/demo /run", 0);
Runs the program c:\test\test.exe with the command line parameters '/demo /run'
and doesn't wait for it to finish.
int APIDownload();
Performs program download.
return value
Returns 1 on success, 0 on failure
Example
APIDownload();
Perform the program download.
294 • Script Language
Software User's Guide winIDEA
int APIDownloadFile(int iFileIndex);
Performs program download of a file specified in the ‘Debug/Files For
Download…/Target Download Files’ tab.
iFileIndex
The index of the download file from the ‘Debug/Files For Download…/Target
Download Files’ tab. Index 0 corresponds to the first file specified in the ‘Target
Download Files’ tab.
return value
Returns 1 on success, 0 on failure
Example
APIDownloadFile(1)
Downloads second file from the file list in the 'Debug/Files for
download/Target download' tab
int APIDownloadFile1(string strFileName, int
nReserved);
Performs program download of a file matching the strFileName string specified
in the ‘Debug/Files For Download…/Target Download Files’ tab.
strFileName
The name of the download file from the ‘Debug/Files For Download…/Target
Download Files’ tab.
nReserved
Reserved for future use.
return value
Returns 1 on success, 0 on failure
Example
APIDownloadFile1("Sample.bin", 0)
Downloads Sample.bin file from the file list in the 'Debug/Files for
download/Target download' tab
int APIEvaluate(string strExpression);
Evaluates the expression and outputs the result. The output must be first defined
with the function APISetOutput or APISetOutput1.
Software User's Guide winIDEA
Script Language • 295
return value
Returns 1 on success, 0 on failure
strExpression
A valid C expression to evaluate
int APIEvaluate1(int iAccessMethod, string
strExpression);
Evaluates the expression and returns the result
return value
The value of the evaluated expression. If the expression can not be evaluated, 0
is returned.
iAccessMethod
Defines the access method to be used. Currently following values are defined:
•
0 – regular monitor access. If the CPU is running, it is stopped, memory
is read and CPU set running again
•
1 – real-time access. For the function to succeed with this access mode,
the debugger must support real-time access
strExpression
A valid C expression to evaluate
int APIEvaluate2(int nAccessMode, string
strExpression);
Evaluates the expression and outputs the result. The output must be first defined
with the function APISetOutput or APISetOutput1.
return value
Returns 1 on success, 0 on failure
nAccessMode
Defines the access method to be used. Currently following values are defined:
•
0 – regular monitor access. If the CPU is running, it is stopped, memory
is read and CPU set running again
•
1 – real-time access. For the function to succeed with this access mode,
the debugger must support real-time access
strExpression
A valid C expression to evaluate
296 • Script Language
Software User's Guide winIDEA
void APIExit(int iExitCode);
Exits winIDEA.
iExitCode
This value is returned to the calling process.
Example
APIExit(99)
Exits winIDEA with exit code 99.
Software User's Guide winIDEA
Script Language • 297
int APIFillMemory(int iAccessMethod, int iMemArea, int
iAddress, int iValue, int iSize);
Used to fill a memory range. The LSB of iValue is used to fill iSize bytes.
return value
Returns 1 on success, 0 on failure
iAccessMethod
Defines the access method to be used. Currently following values are defined:
•
0 – regular monitor access. If the CPU is running, it is stopped, memory
is read and CPU set running again
•
1 – real-time access. For the function to succeed with this access mode,
the debugger must support real-time access
iMemArea
Specifies CPUs memory area - zero based index of memory area as seen in the
Open Memory Window dialog.
iAddress
Address to write to
iValue
The value to be written (only the LSB is used)
iSize
Number of bytes to fill
298 • Script Language
Software User's Guide winIDEA
int APIFLASHProgramFile(string strFileName);
Writes the file to the FLASH using current FLASH settings
return value
Returns 1 on success, 0 on failure
strFileName
File that should be written to the FLASH memory. When file path is given, the
download files list is searched for a matching entry. If found, the settings from
the download file are used, otherwise the file settings are auto detected.
If the strFileName is empty, all the files configured in the FLASH setup are
used.
void APIGoto(LONG iAddress)
Presets execution point.
return value
Returns 1 on success, 0 on failure
iAddress
The address to preset the execution point to
void APIGoto1(string strAddress)
Presets execution point.
return value
Returns 1 on success, 0 on failure
strAddress
The address to preset the execution point to
void APIGotoLC(int iLine, int iColumn);
Positions the print point of the output window.
iLine, iColumn
The line and column of the new print position. A subsequent print operation will
be printed on that position.
Software User's Guide winIDEA
Script Language • 299
int APIInputNumber(string pszMessage);
Opens a dialog asking you to enter a number.
pszMessage
The message which the dialog shows.
return value
Returns the number entered, returns 0 if Cancel is pressed.
Example:
function void main()
{
declare
{
var int a;
}
a=APIInputNumber("Enter number:");
}
int APILoadProject(string strFileName);
Opens workspace file defined by strFileName
strFileName
Path of the project workspace to open.
return value
Returns 1 on success, 0 on failure
300 • Script Language
Software User's Guide winIDEA
int APILoadProject1(string strFileName, int bSaveOld);
Opens workspace file defined by strFileName
strFileName
Path of the project workspace to open.
bSaveOld
Specify 1 to save changes to the existing workspace, or 0 to discard them.
Exits winIDEA.
iExitCode
The return code passed to the calling process.
void APIMessageBox(string strMessage);
Displays a message box.
strMessage
The text of the message to be displayed.
int APIMessageBoxYesNo(string strMessage);
Displays a message box, giving 'Yes' and 'No' buttons as choice.
return value
If user selects 'Yes' function returns 1, otherwise 0.
strMessage
The text of the message to be displayed.
Software User's Guide winIDEA
Script Language • 301
int APIModify(string strLValue, string strExpression);
Modifies a location
return value
Returns 1 on success, 0 on failure
strLValue
The expression to be modified - this expression must evaluate to a target location
strExpression
The new value that strLValue should assume
Example:
APIModify("#iCounter", ":0x1200")
Modifies the global variable iCounter with the value from the address 0x1200.
int APIModify1(string strLValue, int nValue);
Writes ‘nValue’ into ‘strLValue’
return value
Returns 1 on success, 0 on failure
strLValue
The expression to be modified - this expression must evaluate to a target location
nValue
The new value that strLValue should assume - this could be either a number
literal or an integer script variable.
int APIOpenMemoryDumpFile(string strFileName, int
iForWrite);
Opens or closes a dump file for memory write source or memory read
destination.
return value
Returns 1 on success, 0 on failure
strFileName
Specifies the path to the dump file. if this string is empty the file that was last
open is closed
302 • Script Language
Software User's Guide winIDEA
iForWrite
0 for read destination, 1 for write destination
Note: one 'for write' file and one 'for read' file can be open simultaneously.
int APIPassParameter(string strClass, string strTitle, int
iParameter);
Passes parameter iParameter to the desktop window specified by
strClass/strTitle.
The parameter is passed using the Windows WM_COPYDATA message.
strClass
The name of the class of the desktop window. If this parameter is empty,
winIDEA will pass NULL in the FindWindow call to obtain the receiver window
handle.
strTitle
The name of the desktop window. If this parameter is empty, winIDEA will pass
NULL in the FindWindow call to obtain the receiver window handle.
iParameter
The iParameter is packed into the dwData field of the COPYDATASTRUCT
whose address is passed in the LPARAM field of the message. Other fields are
set to zero.
return value
Returns 1 if the window could be found, 0 if not.
Software User's Guide winIDEA
Script Language • 303
void APIPrintB(int iValue, int iNumBits, int iNumBlanks);
Binary print value.
iValue
The value to be printed.
iNumBits
Number of bits to print.
iNumBlanks
Number of blanks to insert between individual bits.
void APIPrintF1(string strText,int iV0);
Formatted print of one value.
strText
The format string to be used for formatting. Should contain only one formatting
(%) character.
The standard sptrinf function is used to format the string.
iV0
The value to be printed.
304 • Script Language
Software User's Guide winIDEA
void APIPrintF1LC(int iLine, int iColumn, string
strText,int iV0);
Formatted print of one value.
iLine, iColumn
The line and column of the print position.
strText
The format string to be used for formatting. Should contain only one formatting
(%) character.
The standard sptrinf function is used to format the string.
iV0
The value to be printed.
void APIPrintF2(string strText,int iV1,int iV2);
Formatted print of two values.
strText
The format string to be used for formatting. Should contain only two formatting
(%) characters.
The standard sptrinf function is used to format the string.
iV0, iV1
Values to be printed.
Software User's Guide winIDEA
Script Language • 305
void APIPrintF3(string strText,int iV1,int iV2,int iV3);
Formatted print of three values.
strText
The format string to be used for formatting. Should contain only three formatting
(%) characters.
The standard sptrinf function is used to format the string.
iV0, iV1, iV2
Values to be printed.
void APIPrintInteger(int iValue);
Prints decimally formatted iValue.
iValue
The value to be printed.
void APIPrintIntegerLC(int iLine, int iColumn, int iValue);
Prints decimally formatted iValue on position specified by iLine and iColumn.
iLine, iColumn
The line and column of the print position.
iValue
The value to be printed.
void APIPrintString(string strText);
Prints strText.
strText
The text to be printed.
306 • Script Language
Software User's Guide winIDEA
void APIPrintStringLC(int iLine, int iColumn, string
strText);
Prints strText on position specified by iLine and iColumn.
iLine, iColumn
The line and column of the print position.
strText
The text to be printed.
int APIProjectImport(string strImportFileName, int
iReserved);
This function imports project configuration for an XML file.
return value
1 in case of success, 0 in case of failure.
strImportFileName
Path to the XML file containing project information.
iReserved
Reserved, must be 0.
int APIProjectMake(int iLinkMakeBuild);
Makes the current project.
return value
Returns 1 on success, 0 on failure
iLinkMakeBuild
Specifies the make operation to perform:
•
0 - Link
•
1 - Make
•
2 – Rebuild
int APIProjectIsUpToDate(int iReserved);
Checks whether the current project is up to date.
Software User's Guide winIDEA
Script Language • 307
return value
Returns 0 is not up to date, otherwise non-zero
iReserved
Reserved for future use.
int APIProjectSetTarget(string strTargetName);
Sets the current project target.
return value
Returns 1 on success, 0 on failure
strTargetName
Name of the new target.
int APIReadInt(int nAccessMode, int nMemArea, int
nAddress, int nSize, int nBigEndian);
Reads an integer from memory
return value
The function returns the integer read, 0 if access fails
nAccessMode
Defines the access method to be used. Currently following values are defined:
•
0regular monitor access. If the CPU is running, it is stopped,
memory is read and CPU set running again
•
1 – real-time access. For the function to succeed with this access mode,
the debugger must support real-time access
nMemArea
Specifies CPUs memory area - zero based index of memory area as seen in the
Open Memory Window dialog.
nAddress
Start address
nSize
The size of the integer in bytes
nBigEndian
0 if the memory is to be interpreted as low byte first
308 • Script Language
Software User's Guide winIDEA
organization, 1 if high byte first organization
int APIReadMemory(int iMemArea, int iAddress, int
iSize);
Reads memory and dumps it to output. The output must be first defined with the
function APISetOutput or APISetOutput1.
return value
Returns 1 on success, 0 on failure
iMemArea
Specifies CPUs memory area - zero based index of memory area as seen in the
Open Memory Window dialog.
iAddress
Start address
iSize
Number of bytes to read
Software User's Guide winIDEA
Script Language • 309
int APIReadMemory1(int iAccessMethod, int iMemArea,
int iAddress, int iSize);
Reads memory and dumps it to output. The output must be first defined with the
function APISetOutput or APISetOutput1.
return value
Returns 1 on success, 0 on failure
iAccessMethod
Defines the access method to be used. Currently following values are defined:
•
0regular monitor access. If the CPU is running, it is stopped,
memory is read and CPU set running again
•
1 – real-time access. For the function to succeed with this access mode,
the debugger must support real-time access
iMemArea
Specifies CPUs memory area - zero based index of memory area as seen in the
Open Memory Window dialog.
iAddress
Start address
iSize
Number of bytes to read
int APIReadMemory2(int iAccessMethod, string
strLocation, int iSize);
Reads memory and dumps it to output. The output must be first defined with the
function APISetOutput or APISetOutput1.
return value
Returns 1 on success, 0 on failure
iAccessMethod
Defines the access method to be used. Currently following values are defined:
•
0 – regular monitor access. If the CPU is running, it is stopped, memory
is read and CPU set running again
•
1 – real-time access. For the function to succeed with this access mode,
the debugger must support real-time access
strLocation
A name of variable, label or an expression evaluating to a memory location.
Typically a name of a variable.
310 • Script Language
Software User's Guide winIDEA
iSize
Number of bytes to read
int APIReadMemoryDump(int iAccessMode, int
iMemArea, int iAddress, int iSize, int iReserved);
Reads iSize bytes from memory and writes in the dump file
return value
Returns 1 on success, 0 on failure
iAccessMode
Defines the access method to be used. Currently following values are defined:
•
0 – regular monitor access. If the CPU is running, it is stopped, memory
is read and CPU set running again
•
1 – real-time access. For the function to succeed with this access mode,
the debugger must support real-time access
iMemArea
Specifies CPUs memory area - zero based index of memory area as seen in the
Open Memory Window dialog.
iAddress
Start address
iSize
Number of bytes to read
iReserved
Reserved, must be zero
Example:
the bellow program reads 0x1000 bytes from address 0 in the dump file. It then
opens the dump file for MemoryWrite access and writes the same bytes to
address 0x2000 - hence copying 0x1000 bytes from 0x0000 to 0x2000.
function void main()
{
APIOpenMemoryDumpFile("DUMP.DMP", 0);
APIReadMemoryDump(0, 0, 0, 0x1000, 0);
APIOpenMemoryDumpFile("", 0);
APIOpenMemoryDumpFile("DUMP.DMP", 1);
Software User's Guide winIDEA
Script Language • 311
APIWriteMemoryDump(0, 0, 0x2000, 0x1000, 0);
APIOpenMemoryDumpFile("", 1);
}
int APIReset(int bAndRun);
Resets the CPU
return value
Returns 1 on success, 0 on failure
bAndRun
Set to 1 if you wish the CPU to resume running immediately after being released
from RESET state.
If this parameter is set to 0, the CPU will enter STOP mode after released.
int APIRun();
Sets the CPU in running.
return value
Returns 1 on success, 0 on failure
int APISaveAccessCoverage(string strFileName, int
nFlags);
Saves access coverage data to a text file.
return value
Returns 1 on success, 0 on failure
strFileName
Specifies the path of the file where the data should be saved to.
nFlags
A value mask, whose bits specify:
•
0x01 - use hexadecimal numbers
•
0x02 - write only not accessed areas
int APISaveExecutionCoverage(string strFileName, int
nFlags);
Saves execution coverage data to a text file.
312 • Script Language
Software User's Guide winIDEA
return value
Returns 1 on success, 0 on failure
strFileName
Specifies the path of the file where the data should be saved to.
nFlags
A value mask, whose bits specify:
•
0x01 - use hexadecimal numbers
•
0x02 - write only not executed areas
int APISaveProfiler(string strFileName, int nFlags);
Saves profiler data to a text file.
return value
Returns 1 on success, 0 on failure
strFileName
Specifies the path of the file where the data should be saved to.
nFlags
Reserved, must be zero.
int APISaveProject(string strFileName);
Saves the workspace
strFileName
Path of the workspace file to which the configuration is saved.
return value
Returns 1 on success, 0 on failure
int APISaveTrace(string strFileName, int nFlags);
Saves profiler data to a text file.
return value
Returns 1 on success, 0 on failure
strFileName
Specifies the path of the file where the data should be saved to.
Software User's Guide winIDEA
Script Language • 313
nFlags
Reserved, must be zero.
int APISetBreakpoint(int iType, string strBP);
Sets a breakpoint
return value
On success returns a breakpoint handle - used by APIClearBreakpoint to clear
the breakpoint, on failure -1 is returned
iType
Defines the type of breakpoint to be set
•
0 - for execution breakpoints
•
1 - for memory access breakpoints
•
2 - for IO access breakpoints (Z80 family only)
strBP
Defines the breakpoint address
•
numerical
"0x1234"
•
symbolic
"main"
•
range (type 1 and 2)
"0x1000-0x1FFF"
int APISetOutput(string strFileName, int bOutput);
Configures file and screen output.
return value
Returns 1 on success, 0 on failure
strFileName
Defines the name of the file that is to receive output.
If this parameter is blank, output is not written to any file.
bOutput
When set to 1 output is written to the output window, if set to 0, output is not
written to the output window.
int APISetOutput1(string strFileName, int bOutput, int
bNoDefaultCRLF);
Configures file and screen output.
314 • Script Language
Software User's Guide winIDEA
return value
Returns 1 on success, 0 on failure
strFileName
Defines the name of the file that is to receive output.
If this parameter is blank, output is not written to any file.
bOutput
When set to 1 output is written to the output window, if set to 0, output is not
written to the output window.
Software User's Guide winIDEA
Script Language • 315
bNoDefaultCRLF
When set to 1 a default CR-LF (new line) will not be generated automatically
after every screen print. To enforce positioning in a new line, append the '\n'
character to the string printed.
void APISetRegisterDump(int iDump);
Controls register printing.
iDump
Set to 2 if all registers should be dumped every time program execution stops.
Set to 1 if only the PC (Program Counter) register is to be dumped.
Set to 0 if no registers should be dumped.
void APISleep(int nMiliseconds);
Suspends winIDEA for the specified amount of time.
nMilliseconds
the number of milliseconds to wait.
316 • Script Language
Software User's Guide winIDEA
int APIStepInto(int bHighLevel, int iNumSteps);
Executes single program steps.
return value
Returns 1 on success, 0 on failure
bHighLevel
Set to 1 if you wish to perform single high level (source level) program steps, set
to 0 to execute single instruction steps.
iNumSteps
Specifies the number of steps to be executed
int APIStepOver(int iHighLevel, int iNumSteps);
Executes single program steps, without stepping into function and subroutine
calls.
return value
Returns 1 on success, 0 on failure
bHighLevel
Set to 1 if you wish to perform single high level (source level) program steps, set
to 0 to execute single instruction steps.
iNumSteps
Specifies the number of steps to be executed
int APIStop();
Stops the code execution.
return value
Returns 1 on success, 0 on failure
int APITerminalConnect(int nOn);
This function opens and connects the terminal window. Set 0 to disconnect, set 1
to open and connect, set 2 to disconnect and close.
return value
Returns 1 on success, 0 on failure
Software User's Guide winIDEA
Script Language • 317
318 • Script Language
Software User's Guide winIDEA
int APIVerifyDownload();
Verifies the downloaded code.
return value
Returns 1 on success, 0 if verify fails
int APIWaitStatus(int nStatus);
Pauses ISL execution until the specified status is reached
return value
Returns 1 on success, 0 on failure
nStatus
Specifies the status to wait for
•
0 - CPU STOP
•
1 - CPU RUN
•
2 - TRACE WAITING
•
3 - TRACE SAMPLING
•
4 - TRACE LOADING
•
5 - TRACE IDLE
•
6 - PROJECT BUILD FINISHED
Notes on using APIWaitStatus
When using APIWaitStatus in combination with APIReset, certain problems can
occur.
APISetBreakpoint(iBPType, "0x948D");
/* Reset and run */
APIReset(1);
/* Wait till CPU runs */
APIWaitStatus( 1 );
first you set a breakpoint,
next you reset and run the CPU,
you wait until the CPU state is running.
This script is interpreted on the PC and runs asynchronously of the target
execution program that is started in step 2 (CPU is set into running before
APIReset(1) returns. If a breakpoint is hit before APIWaitStatus(1) is called, the
CPU will already be stopped and the APIWaitStatus will wait forever.
The solution is not to use the APIWaitStatus(1) at all, unless you want to wait
for external resets or IRQs that can independently of the winIDEA set CPU to
running. The script functions like APIReset(1) and APIRun, always set CPU to
running, and there is no need to wait for it.
Software User's Guide winIDEA
Script Language • 319
int APIWaitStatus1(int nStatus, int iTimeout);
Pauses ISL execution until the specified status is reached or until the timeout is
reached
return value
Returns 0 on timeout, 1 on success, 2 on success but the waited operation failed
for other reasons, i.e. waiting for build to finish succeeded, but the building itself
had errors.
nStatus
Specifies the status to wait for
•
0 - CPU STOP
•
1 - CPU RUN
•
2 - TRACE WAITING
•
3 - TRACE SAMPLING
•
4 - TRACE LOADING
•
5 - TRACE IDLE
•
6 - PROJECT BUILD FINISHED
iTimeout
Specifies the maximum time in milliseconds to wait for the specified status. If
the timeout is reached before the status is reached, the function returns 0.
320 • Script Language
Software User's Guide winIDEA
int APIWriteInt(int nAccessMode, int nMemArea, int
nAddress, int nSize, int nBigEndian, int nValue);
Writes an integer (nValue) to memory
return value
Returns 1 on success, 0 on failure
nAccessMode
Defines the access method to be used. Currently following values are defined:
•
0 – regular monitor access. If the CPU is running, it is stopped, memory
is read and CPU set running again
•
1 – real-time access. For the function to succeed with this access mode,
the debugger must support real-time access
nMemArea
Specifies CPUs memory area - zero based index of memory area as seen in the
Open Memory Window dialog.
nAddress
Start address
nSize
The size of the integer in bytes
nBigEndian
0 if the memory is to be interpreted as low byte first
organization, 1 if high byte first organization
nValue
The value to be written
Software User's Guide winIDEA
Script Language • 321
int APIWriteMemory(int iMemArea, int iAddress, int
iValue, int iSize);
Writes a value to memory
return value
Returns 1 on success, 0 on failure
iMemArea
Specifies CPUs memory area - zero based index of memory area as seen in the
Open Memory Window dialog.
iAddress
Address to write to
iValue
The value to be written
iSize
Number of bytes used in iValue to write (1-4)
Example:
to write 0x1234 to address 0x1000, area 0
APIWriteMemory(0, 0x1000, 0x1234, 2)
size is 2 because 0x1234 takes 2 bytes
to write 0x00001234 to address 0x1000, area 0
APIWriteMemory(0, 0x1000, 0x1234, 4)
size is 4 because 0x00001234 takes 4 bytes
322 • Script Language
Software User's Guide winIDEA
int APIWriteMemory1(int iAccessMethod, int iMemArea,
int iAddress, int iValue, int iSize);
Writes a value to memory
return value
Returns 1 on success, 0 on failure
iAccessMethod
Defines the access method to be used. Currently following values are defined:
•
0 – regular monitor access. If the CPU is running, it is stopped, memory
is read and CPU set running again
•
1 – real-time access. For the function to succeed with this access mode,
the debugger must support real-time access
iMemArea
Specifies CPUs memory area - zero based index of memory area as seen in the
Open Memory Window dialog.
iAddress
Address to write to
iValue
The value to be written
iSize
Number of bytes used in iValue to write (1-4)
Software User's Guide winIDEA
Script Language • 323
int APIWriteMemory2(int iAccessMethod, str strLocation,
int iValue, int iSize);
Writes a value to memory
return value
Returns 1 on success, 0 on failure
iAccessMethod
Defines the access method to be used. Currently following values are defined:
•
0 – regular monitor access. If the CPU is running, it is stopped, memory
is read and CPU set running again
•
1 – real-time access. For the function to succeed with this access mode,
the debugger must support real-time access
strLocation
Expression evaluating to a memory location. Typically a name of a variable.
iValue
The value to be written
iSize
Number of bytes used in iValue to write (1-4)
324 • Script Language
Software User's Guide winIDEA
int APIWriteMemoryDump(int iAccessMode, int
iMemArea, int iAddress, int iSize, int iReserved);
Reads iSize bytes from the dump file and writes them into memory.
return value
Returns 1 on success, 0 on failure
iAccessMode
Defines the access method to be used. Currently following values are defined:
•
0 – regular monitor access. If the CPU is running, it is stopped, memory
is read and CPU set running again
•
1 – real-time access. For the function to succeed with this access mode,
the debugger must support real-time access
iMemArea
Specifies CPUs memory area - zero based index of memory area as seen in the
Open Memory Window dialog.
iAddress
Address to write to
iSize
Number of bytes used in iValue to write (1-4)
iReserved
Reserved, must be zero
Software User's Guide winIDEA
Script Language • 325
int APIWriteTrace(string strFileName, int nFrom, int
nTo);
Outputs trace buffer to the file specified.
return value
Returns 1 on success, 0 on failure
strFileName
Specifies the filename of the trace buffer output file.
nFrom
Specifies the starting frame. Frame numbers are relative to trigger position.
nTo
Specifies the last frame.
326 • Script Language
Software User's Guide winIDEA
Examples for working with API functions
Example 1
For a particular test function the 7th bit of the accumulator is to be read.
Accumulator is bit addressable but how to do that using ISL APIs?
ANSWER
You can use APIReadMemory or APIEvaluate instead. To read only one bit use
the following syntax:
Read bit 7 from address 0x82
(:0x82>>6) & 0x1
Read bit 4 from R13 register
(@R13>>3) & 0x1
Example 2
We are using an Emulator and winIDEA and an HC05PV8 POD. How can we
access and modify CPU registers?
ANSWER
The syntax to access SFRs is the same as in the watch window: To access
register XYZ, you must write @XYZ
The script provides following functions:
int APIEvaluate1(int nAccessMode, string
strExpression);
and
int APIModify(string strLValue, string strExpression);
so write:
APIEvaluate1(0, "@XYZ");
APIModify("@XYZ", "0");
Example 3
The APIDownloadFile is defined as:
Software User's Guide winIDEA
Script Language • 327
Int APIDownloadFile(int iFileIndex)
What does the file index exactly mean? I understand that it is some number
pertaining to the files listed for downloading so that they may be downloaded
independently. But in the download file list table no such number is mentioned.
If I assume the number according to the order of files, the download process fails
for second file onwards.
ANSWER
Index 0 in the API functions means first file in the 'Download Files' menu.
Index 2 therefore means 3rd file in the 'Download Files' menu.
function void main()
{
if(!APIDownloadFile(2))
{
APIMessageBox("Code wasn't loaded succesfully");
}
else
{
APIMessageBox("Code was loaded succesfully");
}
APIStepInto(0,2);
}
328 • Script Language
Software User's Guide winIDEA
Example 4
The output is dumped to the target result file using APISetOutput. This result file
created using the APISetOutput is to be compared with the reference file. But
once APISetOutput starts dumping the output to the file, it does not stop and
sends subsequent messages also from the output window. So the
APICompareFiles function is unable to open the result file and the comparison
does not take place. Is there any method by which we can stop the APISetOutput
function before initiating the process of comparison?
ANSWER
You have to close the connection - output to file.
You can do this with APISetOutput with its parameter strFileName - if this
parameter is blank, output is not written to any file.
Example 5 – a full ISL example file
The example file below can be used for testing of API functions.
declare
{
function void step();
function void step1();
function void trace();
function void dl();
var int a;
var int b;
var int c;
}
function void main()
{
if(APIMessageBoxYesNo(" Do you want to test a POD in TARGET? "))
{
//HASYSTSetClock(1,16000);
HASYSTSetMapping(0,0x0,0xFFFF,1);
HASYSTSetMapping(1,0x0,0xFFFF,0);
dl();
APICopyMemory(0,0x0,0xFFFE,4,0x0);
HASYSTSetMapping(0,0x0,0xFFFF,0);
dl();
}
else
{
HASYSTSetMapping(0,0x0,0xFFFF,1);
HASYSTSetMapping(1,0x0,0xFFFF,2);
Software User's Guide winIDEA
Script Language • 329
if(APIMessageBoxYesNo(" Do you want to test 24MHz clock?
"))
{
HASYSTSetClock(1,24000);
}
}
dl();
if(APIStepInto(1,1)==0)
{
return;
}
a=HASYSTSetAccessBP(0, "c");
if (a<0)
{
return;
}
APIRun();
APIWaitStatus(0);
HASYSTClearAccessBP(0, a);
APISetOutput("trace.hys",0);
trace();
APISetOutput("test1.hys",1);
b=APISetBreakpoint(0, "testFunction");
if (b<0)
{
return;
}
APIWaitStatus(0);
APIClearBreakpoint(0, b);
c=APISetBreakpoint(0, "_test");
if (c<0)
{
return;
}
APIRun();
APIWaitStatus(0);
APIModify("i","0");
APIModify("j","0");
APIModify("c","0");
step();
APIClearBreakpoint(0, c);
b=APISetBreakpoint(0, "_delay");
if (b<0)
{
return;
}
APIRun();
330 • Script Language
Software User's Guide winIDEA
APIWaitStatus(0);
APIModify("f","0");
APIModify("st","0");
step1();
APIClearBreakpoint(0, b);
a=HASYSTSetAccessBP(0, "c");
if (a<0)
{
return;
}
APIRun();
APIWaitStatus(0);
HASYSTClearAccessBP(0, a);
APIEvaluate("c");
APIEvaluate("f");
APIEvaluate("st");
APISetOutput("trcstop.hys",1);
APIBeep();
APIBeep();
}
function void step()
{
if(APIStepInto(1,1)==0)
{
return;
}
loop(10)
{
if(APIStepInto(1,1)==0)
{
return;
}
else
{
APIEvaluate("i");
APIEvaluate("j");
APIEvaluate("n");
APIEvaluate("c");
}
}
loop(10)
{
if(APIStepInto(0,1)==0)
{
return;
}
else
Software User's Guide winIDEA
Script Language • 331
{
APIEvaluate("i");
APIEvaluate("j");
APIEvaluate("n");
APIEvaluate("c");
}
}
}
function void step1()
{
loop(10)
{
if(APIStepInto(1,1)==0)
{
return;
}
else
{
APIEvaluate("c");
APIEvaluate("f");
APIEvaluate("st");
}
}
loop(10)
{
if(APIStepInto(0,1)==0)
{
return;
}
else
{
APIEvaluate("c");
APIEvaluate("f");
APIEvaluate("st");
}
}
}
function void trace()
{
HASYSTSetTraceOperation(0);
HASYSTSetTraceTrigger("test");
APIBeginTrace();
APIRun();
APIWaitStatus(5);
332 • Script Language
Software User's Guide winIDEA
APIWriteTrace(-20,500);
}
function void dl()
{
if (APIDownload()==0)
{
return;
}
}
Software User's Guide winIDEA
Script Language • 333
Frequently Asked Questions on API Functions
Q: How can I stop the code execution via the script. APIExit and return
terminate winIDEA and the script respectively.
A: Use the new APIStop function, introduced in winIDEA 9.1. If you use an
older version, use APIStepInto(0, 1). It executes a single instruction step effectively stopping the CPU prior to that.
Q: I tried APIModify1 to change the register values but it only works if the CPU
is not running.
A: That's how it's supposed to work. Makes no sense modifying a register while
the CPU is running.
Q: How can you dump a register value into a variable?
A: Use APIModify("variable name", "@register name"). For example to store
the value of register R0 to variable 'xyz' write: APIModify("xyz", "@R0").
See also "Expression Conventions" on page 183 for help on legal expressions.
X26H
X
X263H
X
Q: How can I dump an address segment content into a variable? The
APIReadMemory only fetches the value to the output window.
A: Use APIModify("variable name", ":address"). For example to load a byte
from address 0x1000 into variable 'xyz' write: APIModify("xyz", ":0x1000").
See also "Expression Conventions" on page 183 for help on legal expressions.
X264H
X
X265H
X
Q: When it says strExpression for APIEvaluate or elsewhere, what is this? Any
C expression or statement? What if I include a conditional statement, the
function return is the satisfaction of the condition? It seems it accepts any string
when only returning False for the erroneous ones.
A: See also help on legal expressions in winIDEA help/Debug Session/Watch
window/Adding Watch expressions/Expression conventions. All C expressions
except for the '?' operator are supported. An expression like: '3*(2>=1)' yields 3
as the result.
Q: How the APIEvaluate could be used to read a register content, as expressed
by the example?
A: Append the @ sign before the name of the register - can also be a SFR
register.
APIEvaluate("@DDRA");
334 • Script Language
Software User's Guide winIDEA
Customizing the Environment
Environment Options
The environment appearance is controlled in two dialogs, the Options dialog and
the Customize dialog, both available in the Tools menu.
winIDEA Environment
Options Dialog, Environment page
Workspace file format
Defines the default file format used by winIDEA. This is either the legacy binary
format (.jrf and .qrf extensions), or XML format (.xjrf / .xqrf) extensions. Note
that winIDEA always saves in both file formats. This setting affects only the
files shown when selecting a new workspace to open.
Software User's Guide winIDEA
Customizing the Environment • 335
Auto save workspace when exiting winIDEA
When checked, the workspace is automatically saved. Otherwise you are
prompted whether you wish to save it or not.
Reload last workspace at startup
When checked, the last workspace that was open when winIDEA most recently
terminated is reloaded.
Auto save when running tools
When an external tool is ran, the files will be automatically saved if this option is
selected.
Save only editor documents on auto save
Only editor files will be saved automatically, not the analyzer documents.
Create backup files
If this option is checked, winIDEA will create backup files of every file saved.
Whenever a file is saved, winIDEA will also save the old file and add the
extension '.bak' to it. For example, when saving 'main.c', the old file will be
saved under the name 'main.c.bak'.
Reload externally modified files automatically
If a file is modified outside winIDEA (for example in an other editor), it will be
reloaded automatically if this option is checked.
Disable breakpoints when reloaded
When a loaded file is reloaded, breakpoints are disabled if this option is checked.
Start File/Open from workspace directory
If this option is checked, the File/Open will always start up in the workspace
directory, otherwise the last location where files have been opened is used.
Use build manager
If this option is unchecked, the build manager will not be used. See "Build
Manager" on page 231 for more information.
X26H
X
X267H
X
Close progress window when finished
When checked, a progress window is closed when the process has finished.
Cache network files
If this option is checked accesses to files located on the network are 'cached', i.e.
a temporary copy of the accessed file is created in the TEMP directory.
Checking this option improves performance on Novell networks. If you are
using TCP/IP or Microsoft's NetBEUI, clear this option, since the operating
system itself caches network accesses.
336 • Customizing the Environment
Software User's Guide winIDEA
CASE Tool Integration
winIDEA supports integration of different CASE tools. The CASE tools are
integrated by inserting the appropriate data into the Tools/Options/CASE Tool
window.
CASE Tool setup window
CASE Tool
The CASE Tool to be integrated is defined here. If no CASE Tool should be
integrated, this setting should be set to “None”. When a tool is selected, its
properties can be selected using the “Settings…” button.
Settings
Invokes the settings regarding the selected CASE Tool.
Run when winIDEA starts
Starts the CASE Tool when winIDEA starts. When winIDEA exits, the CASE
Tool is closed as well.
Start now
Starts the CASE Tool.
Software User's Guide winIDEA
Customizing the Environment • 337
EasyCASE/EasyCode Integration
winIDEA provides an interface to the Easy Case/Easy Code application.
Integration includes:
•
Source debugging/tracking in either winIDEA or EasyCASE
•
Setting execution breakpoints in either winIDEA or EasyCASE.
Settings
First, the CASE Tool should be selected.
CASE Tool setup window
If EasyCase is used, the path to the EasyCASE executable is specified by
pressing the Settings button.
EasyCASE Settings page
The executable can be searched using the “…” button, which opens a file
browser.
If EasyCode is used, no additional settings are necesarry, since all necesarry
information is automatically copied from the EasyCode installation.
338 • Customizing the Environment
Software User's Guide winIDEA
Rhapsody in MicroC Integration
WinIDEA provides an interface to Rhapsody in MicroC application.
The link between winIDEA and Rhapsody in MicroC enables the graphical
representation of the various states of the application to be shown directly in
Rhapsody in MicroC. This animation takes place in the graphical back animation
(GBA) server, a component of Rhapsody in MicroC. If the application stops, the
GBA server also displays the current state, which gives the user quick feedback
where the application has stopped.
Settings
First, the CASE Tool should be selected.
CASE Tool setup window
By clicking Settings, the installation path to the Rhapsody dll is specified. The
installation path should be set to the location where amc_communication_dll.dll
is located. If Rhapsody will be running on a remote computer, this dll must be
copied to the local computer (computer where winIDEA is running).
Software User's Guide winIDEA
Customizing the Environment • 339
Rhapsody in MicroC Settings page
The dll can be searched using the “…” button, which opens a file browser.
Host Name and Port ID
The Host Name can be the name of the remote or local computer. Port ID should
be set to the same value as in the Rhapsody GBA Server.
winIDEA communicates with Rhapsody in MicroC through the TCP/IP protocol
which must also be installed.
Set Default
If Rhapsody is installed on a local computer, the Set Default button can be
clicked and winIDEA will try to fill in all settings automatically.
340 • Customizing the Environment
Software User's Guide winIDEA
Use real-time access
When “Use real-time access” is checked winIDEA will access target memory
when the program is running. Whenever possible, check this option.
Software User's Guide winIDEA
Customizing the Environment • 341
Keyboard Shortcuts
Despite being a graphical Windows application, the nature of work that you
perform inside winIDEA keeps your fingers on the keyboard, and reaching for
the mouse to perform frequent actions like step, wastes your time and health.
winIDEA therefore provides fully customizable keyboard shortcuts for all
commands available on the menu and toolbars. You can configure these on the
Keyboard page of the Customize dialog.
Customize dialog, Keyboard shortcut configuration
342 • Customizing the Environment
Software User's Guide winIDEA
To configure a shortcut for a command:
•
Select the command category in the Categories list
•
In the Commands list select the command for which you wish to
configure a shortcut
•
Select the 'Press new shortcut' field
•
Press the desired shortcut combination
•
Click the Assign button
You can reset the keyboard shortcuts by selecting the 'Reset to…' button and
selecting the desired set.
Preset keyboard schemes
The reset keyboard dialog
winIDEA comes with three predefined sets of shortcuts:
Software User's Guide winIDEA
•
iCE DOS version
•
Microsoft Developer Studio
•
Borland C++ IDE
Customizing the Environment • 343
Window Colors
Colors and fonts can be configured individually for virtually all winIDEA's
workspace visual elements in the Format page of the Options dialog.
Options dialog, Format page
To configure appearance of a window:
344 • Customizing the Environment
•
In the Window list select the window for which you wish to configure
colors and font,
•
Select the font to be used and its size in the window,
•
In the Item list select individual items and configure text and
background color for each item.
Software User's Guide winIDEA
isystem.connect
isystem.connect is a gateway protocol that allows third party applications to
access some of winIDEA's functionallity, like accessing memory, controling the
CPU etc.
Please note that when isystem.connect is enabled, winIDEA generates a small
amount of network traffic scanning the UDP discovery port and opens and
listens to the TCP connection ports. A warning from your firewall may be seen
regarding these actions.
If network access is not desired and the extended funcionality of isystem.connect
is not needed, please disable isystem.connect.
Options dialog, isystem.connect page
Enable isystem.connect
Check this option to allow third party applications to access winIDEA via
isystem.connect.
TCP Connection Port Range
Specify on which TCP ports should winIDEA establish the isystem.connect
service. When winIDEA starts (or the isystem.connect is enabled), it will scan
these prots to find the first free port and start listening on it for incomming
connections.
Software User's Guide winIDEA
Customizing the Environment • 345
UDP Discovery port
This port is used for broadcast discoveries initiated by the isystem.connect client
application. When the client requests connection to winIDEA, an UDP broadcast
on a UDP port is issued. All winIDEAs listening on that port will respond and
the client can then choose to which instance it will connect.
Limit number of clients
This option allows limitation of simultaneous isystem.connect connections to
one winIDEA instance.
Note: If you are unsure about TCP and UDP port settings, contact your network
administrator.
Run External Client Diagnostics
winIDEA supports detailed isystem.connect diagnostics, which should be
performed when an isystem.connect client application is having problems
connecting to winIDEA. Such problems are typically caused by:
- third party antivirus software blocking UDP/TCP ports. winIDEA disables the
Windows firewall but is not aware of Norton, Avast, NOD32, etc.
- different versions of winIDEA running (intalled is OK, just not active at the
same time) simultaneously on the PC
The 'Run external diagnostic' button launches iConnectDiag.exe which is using
our standard isystem.connect utility classes to enumerate all running instances of
winIDEA and attempts to connect to each of them.
The above screenshot shows diagnostics when two different winIDEA build
instances are active.
346 • Customizing the Environment
Software User's Guide winIDEA
This sceenshot shows firewall blocking UDP discovery but a direct TCP connect
is still working.
This sceenshot was taken with two instances running, with no UDP or TCP
blocking.
For more information on isystem.connect, please refer to a standalone document,
describing isystem.connect functions. For the latest information, please contact
your local distributor.
Software User's Guide winIDEA
Customizing the Environment • 347
XCP Slave Plug-In
Introduction
A target under winIDEA control can be accessed with XCP over TCP or UDP.
winIDEA is shipped with a software plug-in that implements XCP slave
functionality.
348 • Customizing the Environment
Software User's Guide winIDEA
Usage
The plug-in is shipped with winIDEA. It is by default configured to be loaded
and started automatically with winIDEA. The default protocol is TCP and the
default port is 5555.
In order to access the XCP slave plug-in configuration open the winIDEA
software plug-in dialog (winIDEA “Tools” menu, “Software plug-ins…” menu
item), select the XCP plug-in from the plug-in list and click the
“Configuration…” button.
The following dialog shows:
You can change the protocol opening the drop-down list; available protocols are
TCP and UDP.
The port can be configured on this dialog. Type the required port name in the
“Port” edit control.
To apply the new settings press the “OK” button, the settings are applied, the
plug-in is restarted.
To discard the changes press the “Cancel” button.
For more information about winIDEA software plug-ins refer to the related user
or development documentation.
Software User's Guide winIDEA
Customizing the Environment • 349
Configuring Vector CANape
Inside CANape go to open the “Tools” menu, select the “Driver
configuration…” menu item. The following dialog displays:
In the transport layer control group, in the interface drop-down list select TCP/IP
or UPD/IP depending on the settings you have chosen for winIDEA’s XCP slave
plug-in.
If you press the “Interface” “Configuration” button the following dialog
displays:
350 • Customizing the Environment
Software User's Guide winIDEA
Here you can setup the port used and the hostname or IP address of the computer
running the winIDEA instance controlling the target you want to calibrate.
You may experience problems when running the XCP slave on a different host
from CANape. To work around this issue make sure the host name configuration
was loaded properly at every startup and test several times for connection. This
is a known CANape issue. For more information please consult the CANape
support page or contact Vector.
Configuring other XCP masters
The XCP protocol implementation of the winIDEA XCP slave complies with the
XCP standard. Any XCP master should be able to communicate with the
winIDEA XCP slave plug-in. Make sure that the protocol and port settings on
the master and the slave match. For information on how to configure the
transport protocol on your XCP master consult your application’s
documentation.
Software User's Guide winIDEA
Customizing the Environment • 351
Custom Tools
winIDEA allows integration of external third party tools, which can be ran from
the tools menu.
Tools are configured in the Tools and Local Tools pages of the Customize
dialog.
The Tools defined in the 'Tools' page are common to all winIDEA workspaces,
whereas tools defined in the 'Local Tools' page are available only to the current
workspace.
Customize dialog, Tool configuration page
To add a new tool:
•
click the 'Add' button,
•
configure the text that should appear in the menu (Menu text)
•
specify the path to the tool (executable)
•
configure any command line arguments that should be passed to the
tool when invoked (Arguments). You can use special file macros when
the tool is to operate on a currently open source file.
•
specify the initial directory for the tool.
Prompt for Arguments
When checked the 'Tool Arguments' dialog will open prior to every tool
invocation.
352 • Customizing the Environment
Software User's Guide winIDEA
Save documents before running tool
When checked all documents will be saved before the tool is ran.
Tool Arguments
Tool Arguments dialog
This dialog opens upon invocation of a tool with 'Prompt for Arguments' option
selected.
The string that you specify here will be passed to the toll in the command line.
Software User's Guide winIDEA
Customizing the Environment • 353
Entering License Information
What is a License
Operating systems support and interoperability with CASE tools can be licensed
for you using the Tools/Feature License menu option.
How to Obtain a License
A license comes as an encrypted initialization string, which you request from
your local distributor and, which he can send you via mail, e-mail, FAX or over
the phone.
Programming the License
The software licenses are programmed in the Tools/Feature License dialog.
The Tools/Feature License menu
The current license status can be seen in the license information pane.
The IDENT value is the identification code of your software.
The four INIT fields are the place where you must enter the initialization string.
The INIT string is requested with pressing the 'Request INIT...' button.
When finished, select the Program button to license the Emulator with the new
license.
Computer based vs. User based
The licenses are normally computer based, this means that the licensed tools will
be available to everyone that works on that computer with no limitation; the
tools, on the other hand, will not work on a different computer.
The licenses can also be user based. This means that the licensed tools are
available on every computer, where the user is logged in with the specified user
name.
354 • Customizing the Environment
Software User's Guide winIDEA
Request INIT
To request an INIT string, press the 'Request INIT...' button.
First step: Specify the License or Feature to be Enabled
License serial number request
The licensing wizard requires you to insert the license serial number. To obtain
the license serial number, contact your iSYSTEM distributor first, you can
purchase a license from him and you will also receive a serial number.
There are two types of licenses: Standard and Professional. The Standard license
enables the usage of one software tool, while the Professional license enables
you to use all tools from the selected family (for example, the professional
RTOS license will enable the usage of all operating systems; the professional
CASE license will enable all CASE Tools).
If you have purchased a standard license, you will need to enter the tool you will
be using.
Once you have entered the serial number, press the Next button.
Software User's Guide winIDEA
Customizing the Environment • 355
Second step: User Information
User information dialog
Now, please enter your user information. The information is needed by
iSYSTEM to confirm your license. When you have entered the information,
please press the Next button.
Third step: Send the Initialization Request
The program will now show the system's IDENT that will be sent to the
distributor. There are options, which define the sending and receiving method for
the request.
'Send the request via e-mail' will generate an e-mail message with your default email handler and try to send it. If the mail handler is not running, it will send the
message immediately after it is started. If the e-mail generation is unsuccessful,
the program will issue a warning and ask you to manually send the request file to
iSYSTEM.
Send the Initialization Request dialog
356 • Customizing the Environment
Software User's Guide winIDEA
'Send the request through FAX' will generate a text file, which you will be asked
to print out and fax to iSYSTEM.
If the option 'The Initialization String should be returned via e-mail' is selected,
the initialization string will be returned to the e-mail address defined in the User
information dialog. If the information was not entered, the e-mail based request
will be replied to.
If the option 'The Initialization String should be returned by FAX' is selected, the
initialization string will be faxed to you to the fax number, defined in the User
information dialog.
Entering the Initialization String
When you have received the initialization string, enter it in the Tools/Feature
License dialog. If you have received the initialization string through e-mail, copy
the string to clipboard. In the License page, press the Paste INIT button. With
this, the string will be automatically entered. Now, press the Program button to
program the new license. Now, the requested features are available immediately.
Software User's Guide winIDEA
Customizing the Environment • 357
Technical Support
winIDEA provides a packing utility, which puts the files of your choice into a
single file, which you can send to your technical support engineer.
Preparing Files for Technical Support
•
Select Support/Technical Support… command from the Help menu
Technical Support dialog
On selecting the OK button, the attached emulator is diagnosed. (Diagnostic
information is written to file 'CONFIG.TXT' in the workspace directory.)
It is recommended that the support file is generated at the moment where the
error or incorrect behaviour is observed. winIDEA will pack the current register
content and stack in the report file, making it easier for support personel to
reproduce the problem.
Note: make sure that hardware is properly configured.
winIDEA can pack following files:
•
workspace configuration files. These are the workspace file (.JRF and
.XJRF) and project configuration files (.QRF and .XQRF). See
"Workspaces" on page 11.
X268H
•
X
X269H
X
download files. These are files specified in download files dialog for
debug and PROM systems. See "Download Files" on page 97.
These files should be sent when you experience any kind of problem
with the debugger.
X270H
•
X
X
X273H
X
project output files. These are files located in the current target's output
directory (see "Root Directory" on page 246).
Usually these files are not required. Since sending them usually
X274H
358 • Customizing the Environment
X
project source files. These are your .C and .H source files specified in
the project files dialog. See "Project Files" on page 239.
Send these files if there are problems with building, source debugging
or the debugger problem can not be made visible without source files.
X27H
•
X271H
X
X275H
X
Software User's Guide winIDEA
generates a very large file, send them only when requested by support
engineer.
•
default Analyzer files. These are your .trd and .lad files (see "The
Trace" on page 46), that bear the same name as the workspace file.
X276H
X
X27H
X
Note: winIDEA can only pack files that are located in or bellow the workspace
directory. See "Path Specifications" on page 11.
X278H
X
X279H
X
winIDEA does not save the linker indirection files or any other files used by the
build indirectly. A workaround is to add these files to the project. Their
extension will prevent them from being compiled/linked, but they will be seen in
the project window and will be included in the backup/support file.
The resulting file is named 'SUPPORT.WSB' and is stored in the workspace
directory.
The Support File can be sent via e-mail to support personel automatically. Please
specify your country, if it is listed in the menu, otherwise select ‘Other…’ and
specify the e-mail address as provided to you by the support personel.
Software User's Guide winIDEA
Customizing the Environment • 359
360 • Customizing the Environment
Software User's Guide winIDEA
Appendix
Build Manager Temporary Build Files
Following files are generated by Build Manager before or during build process.
File name
___STOUT.RDR
Description
contains captured output emitted by translator to standard
output device
___FSOUT.RDR
contains filtered output from translator
___STERR.RDR
contains captured output emitted by translator to standard
error device
___CMP.<ext>
compiler options - when compiler can retrieve them from a
file. Extension of this file is equal to extension supported by
compiler for these purposes.
___CMP.BAT
batch file used to run compiler or assembler.
___ASM.<ext>
assembler options - when assembler can retrieve them from
a file. Extension of this file is equal to extension supported
by assembler for these purposes.
___LNK.<ext>
linker indirection file. Extension of this file is equal to
extension supported by linker for these purposes.
___LNK.BAT
batch file used to run.
Note: the files above are generated only when necessary.
Software User's Guide winIDEA
Appendix • 361
Menu Reference
File Menu
Contains source document management commands.
New
Creates a new unnamed document. The new document is fully editable. When
closing or saving unnamed documents, the save as dialog will prompt you for the
name of the file where the document should be saved.
Open
Opens an existing file.
Close
Closes the active editor.
Save
Saves the contents of the active editor to its file. If the editor contains a new
unnamed document, the Save As dialog will prompt you for the name of the file
where the document should be saved.
Save As...
Opens the Save As dialog where you can enter the name of the file where the
document should be saved.
Save All
Saves all editors, which have been modified.
Page Setup
Opens the Print Setup dialog, where page layout is configured.
Print
Opens the Print dialog, where the printer and its settings are configured, and printing
can be started.
362 • Appendix
Software User's Guide winIDEA
Find in Files
Searches for a string occurrence across multiple files.
See "Find in Files Utility" on page 44.
X280H
X
X281H
X
Workspace
Opens workspace management options:
New workspace...
Creates a new workspace.
See "Creating a New Workspace" on page 13.
X28H
X
X283H
X
Open Workspace...
Opens an existing workspace.
See "Opening an Existing Workspace" on page 11.
X284H
X
X285H
X
Save Workspace...
Saves the current workspace.
See "Saving Workspace" on page 13.
X286H
X
X287H
X
Available if a workspace is open.
Backup Workspace...
Saves a backup (.wsb) file of your workspace.
See "Backup a Workspace" on page 14.
X28H
X
X289H
X
Restore Workspace...
Restores the workspace from a backup (.wsb) file.
See "Restore a Workspace" on page 15.
X290H
X
X291H
X
Workspace Pick List
Opens the workspace selected from the pick list.
winIDEA maintains a list of four most recently used workspaces. These are
displayed on the File menu's pick list.
To open a workspace from the pick list
•
Software User's Guide winIDEA
select the workspace file on the pick list.
Appendix • 363
File Pick List
Opens the file selected from the pick list.
winIDEA maintains a list of four most recently used files. These are displayed on the
File menu's pick list.
To open a file from the pick list
•
select the file on the pick list.
Exit
Exists winIDEA.
Edit Menu
Contains source document management commands.
See "Document Management" on page 25.
X29H
X
X293H
X
Find...
Searches for text occurrence in the active editor window.
See "Finding Text" on page 35.
X294H
X
X295H
X
Replace...
Replaces text in the active editor window.
See "Replacing Text" on page 35.
X296H
X
X297H
X
Find Next
Repeats the last find command.
Go To...
Lists the active editor window from a specified line.
Undo
Undoes the last editor modification.
Redo
Undoes the last Undo operation.
364 • Appendix
Software User's Guide winIDEA
Cut
Removes the currently selected text from the editor window and puts it on the
clipboard.
See "Cutting Text to Clipboard" on page 36.
X298H
X
X29H
X
Copy
Copies the currently selected text to the clipboard.
See "Copying Text to Clipboard" on page 36.
X30H
X
X301H
X
Paste
Inserts the text from the clipboard into the current editor window.
See "Pasting Text from Clipboard" on page 37.
X302H
X
X30H
X
Delete
Removes the currently selected text from the editor window.
Select All
Selects the whole text of the edited file.
Toggle Bookmark
Toggles a bookmark on the edited line.
Next Bookmark
Jumps to the next bookmark.
Bookmarks...
Displays a list of all bookmarks in the current editor window.
Options...
Opens the editor options dialog.
See "Configuring Editor Options" on page 41.
X304H
X
X305H
X
View Menu
Contains dockable windows management commands.
See "Window Management" on page 17.
X306H
Software User's Guide winIDEA
X
X307H
X
Appendix • 365
Preset Desktop
Contains commands, which set the desktop layout to a predefined template.
Edit/Build
Sets the desktop layout to a predefined Edit/Build template.
Debug - High Level
Sets the desktop layout to a predefined high level debugging template.
Debug - Low Level
Sets the desktop layout to a predefined Low level debugging template.
Full
Sets the desktop layout to a predefined full desktop template.
Full Screen
Expands winIDEA through the full screen.
See "Full screen operation" on page 19.
X308H
X
X309H
X
Toolbars
Contains toolbar show/hide commands.
See "Toolbars" on page 20.
X310H
X
X31H
X
File
Shows or hides the File toolbar.
See "File Toolbar" on page 21.
X312H
X
X31H
X
View
Shows or hides the View toolbar.
See "View Toolbar" on page 22.
X314H
X
X315H
X
Project
Shows or hides the Project toolbar.
See "Project Toolbar" on page 23.
X316H
X
X317H
X
Debug
Shows or hides the Debug toolbar.
See "Debug Toolbar" on page 24.
X318H
366 • Appendix
X
X319H
X
Software User's Guide winIDEA
Document Bar
Shows or hides the Document selector bar.
See "Document Selector Bar" on page 29.
X320H
X
X321H
X
Project
Shows or hides the Project workspace window.
Output
Shows or hides the Output window.
See "Output Window" on page 264.
X32H
X
X32H
X
Watch
Shows or hides the Watch window.
See "Watch Window" on page 182.
X324H
X
X325H
X
Variables
Shows or hides the Variables window.
See "Variables Window" on page 187.
X326H
X
X327H
X
Special Function Registers
Shows or hides the SFR window.
See "Special Function Registers Window" on page 208.
X328H
X
X329H
X
Custom SFR
Shows the custom SFR window.
See "Custom SFR Windows" on page 211.
X30H
X
X31H
X
New
Generates a new SFR window.
Custom SFR Pick List
Opens the custom SFR window selected from the pick list.
The custom SFR windows you have generated are listed in the pick list.
To open a custom SFR window from the pick list
•
Software User's Guide winIDEA
select the custom SFR window from the pick list.
Appendix • 367
Memory...
Opens a new memory window.
See "Opening a Memory Window" on page 175.
X32H
X
X3H
X
Disassembly
Shows or hides the Disassembly window.
See "Disassembly Window" on page 170.
X34H
X
X35H
X
Profiler
Shows or hides the Profiler window.
See "Profiler Window" on page 204.
X36H
X
X37H
X
Execution Coverage
Shows or hides the Execution Coverage window.
See “Execution Coverage” on page 87.
X38H
X
X39H
X
Trace
Shows or hides the Trace window.
See "The Trace" on page 46.
X340H
X
X341H
X
Operating System
Shows or hides the Operating System window.
See "Operating System Support" on page 133.
X342H
X
X34H
X
Terminal
Shows or hides the Terminal window.
See "Terminal Window" on page 213.
X34H
X
X345H
X
Symbols...
Opens the browser dialog.
See "Symbol Browser" on page 113.
X346H
368 • Appendix
X
X347H
X
Software User's Guide winIDEA
Project Menu
Contains Build Manager commands.
Compile/Assemble
Compiles the file in the active editor.
See "Building a Single Project File" on page 266.
X348H
X
X349H
X
Link
Links the project.
Make
Builds all modified files and links the project.
See "Building All Modified Project Files" on page 266.
X350H
X
X351H
X
Rebuild
Builds all files and links the project.
See "Building All Project Files" on page 266.
X352H
X
X35H
X
Stop Build
Terminates the current Build Manager operation.
See "Breaking the Build" on page 266.
X354H
X
X35H
X
Source Control
Shows the Source Control options.
See "Workgroup Support" on page 267.
X356H
X
X357H
X
Settings...
Configures the Source Control.
See "Configuring the source control system" on page 267.
X358H
X
X359H
X
Get Latest Version...
Gets the latest version of the file.
Check Out...
Checks out the file.
Software User's Guide winIDEA
Appendix • 369
Check In...
Checks in the file.
Undo Checkout...
Undoes the checkout (invalidates changes and reverts to the file in source control).
Add to Source Control...
Adds the file to source control.
Remove from Source Control...
Removes the file from source control.
Refresh Status
Refreshes the status of files under source control.
Project Files...
Opens the project files dialog where you can manage files that constitute a project.
See "Project Files" on page 239.
X360H
X
X361H
X
Settings...
Opens the Project Settings dialog.
See "Compiler Tool-set Integration" on page 242.
X362H
X
X36H
X
Targets...
Opens the Targets dialog.
See "Targets" on page 235.
X364H
X
X365H
X
Update All Dependencies
Updates all project dependencies. The dependency list is used when a Make is
executed to determine which files need to be built.
Add to Templates...
Adds the current file to templates. Enables you to be able to open a file based on the
selected one.
370 • Appendix
Software User's Guide winIDEA
Debug Menu
Contains debug system management commands.
Download
Initializes the hardware and loads download files to the emulator.
See "Download Files" on page 97.
X36H
X
X367H
X
Files for Download...
Opens a dialog where download files can be configured.
See "Download Files" on page 97.
X368H
X
X369H
X
Verify Download
Verifies the download by comparing the downloaded code with the core read back
from the debugger.
See "Verify Download" on page 110.
X370H
X
X371H
X
Show Load Map...
Displays the load map.
See "Load Map" on page 111.
X372H
X
X37H
X
Operating System
Opens the Operating System configuration dialog.
See "Operating System Support" on page 133.
X374H
X
X375H
X
Run
Sets the CPU running.
See "Run" on page 165.
X376H
X
X37H
X
Reset and Run
Resets the CPU and sets it in running.
Stop
Stops the CPU.
See "Stop" on page 165.
X378H
X
X379H
X
CPU Reset
Resets the CPU.
See "Reset" on page 165.
X380H
X
X381H
X
Step
Executes a single step.
Software User's Guide winIDEA
Appendix • 371
Step...
When selected from the menu a dialog opens where the number of steps to be
executed is configured.
When selected with a keyboard shortcut or toolbar button, a single step is executed.
See "Step" on page 166.
X382H
X
X38H
X
Step Over
Performs a single step inside current function.
See "Step Over" on page 166.
X384H
X
X385H
X
Run Until
Runs until current caret position.
Run Until...
When selected from the menu a dialog opens where the address to run to can be
specified.
When selected with a keyboard shortcut or toolbar button the CPU is set running
until it reaches the current caret position.
See "Run Until" on page 167.
X386H
X
X387H
X
Go-to Address...
When selected from the menu a dialog opens where the address to set the program
execution point to can be specified.
When selected with a keyboard shortcut or toolbar button the CPU's execution point
is preset to current position.
See "Go-to Address" on page 168.
X38H
X
X389H
X
Run until Return
Sets the CPU running until its execution reaches the exit of the current function.
See "Run Until Return" on page 167.
X390H
X
X391H
X
Show Execution Point
Shows the current execution point.
Snapshot
Refreshes opened windows.
Modify Expression
Modifies an expression.
See "Modify Expression" on page 169.
X392H
X
X39H
X
Breakpoints...
Opens the breakpoint configuration dialog.
See "Breakpoints" on page 159.
X394H
372 • Appendix
X
X395H
X
Software User's Guide winIDEA
Hardware Breakpoints...
Opens the hardware breakpoint configuration dialog.
See "Hardware Breakpoints" on page 163.
X396H
X
X397H
X
Toggle Execution Breakpoint
Sets or clears an execution breakpoint on the current caret position.
See "Setting Execution Breakpoints" on page 169.
X398H
X
X39H
X
Analyzer Tools
Opens the Analyzer Tools dialog.
See "Analyzer Tools" on page 190.
X40H
X
X401H
X
Start Profiler
Activates the Profiler module.
See "Profiler" on page 191.
X402H
X
X403H
X
Start Access Coverage
Activates the access coverage module.
See "Access Coverage" on page 202.
X40H
X
X405H
X
Start Execution Coverage
Activates the execution coverage module.
See “Execution Coverage” on page 87.
X406H
X
X407H
X
Debug Options...
Opens the Debug Options dialog, where debug system operation options are
configured.
See "Debug Options" on page 121.
X408H
Software User's Guide winIDEA
X
X409H
X
Appendix • 373
Tools Menu
Contains commands that control winIDEA environment and custom tools.
Hardware Plug-In...
Selects the hardware plug-in.
See "Hardware Plug-In" on page 16.
X410H
X
X41H
X
Disconnect
Disconnects winIDEA from the Emulator.
Normally, winIDEA locks the Emulator for exclusive use from the first download
and until the workplace closes. Is the Emulator shared and somebody else would like
to be using it, you can release it by pressing the Disconnect button, without having to
close the workplace.
Options...
Opens the Options dialog.
Customize…
Opens the Customize dialog where keyboard shortcuts and custom tools can be
configured.
See "Keyboard Shortcuts" on page 342 and "Custom Tools" on page 352.
X412H
X
X413H
X
X41H
X
X415H
X
Feature License
Opens the dialog to license additional features.
See "Entering License Information" on page 354.
X416H
X
X417H
X
Run Script…
Runs a script program. See "Script Language" on page 277.
X418H
X
X419H
X
Stop Script...
Stops the script program. See "Script Language" on page 277.
X420H
X
X421H
X
Custom Tool
For every configured custom tool a menu item is generated. By selecting them the
tools is run.
374 • Appendix
Software User's Guide winIDEA
Window Menu
Contains window management commands.
Cascade
Cascades all open editors windows.
Tile
Tiles all open editor windows.
Close All
Closes all open editor windows.
Windows
Displays a dialog where currently open editor windows are listed.
Help Menu
Contains help commands.
winIDEA Contents
Opens winIDEA help file.
Technical Support
Opens a dialog where you can select the files that you wish to pack and send to your
technical support engineer.
About
Displays winIDEA version and copyright information.
Hardware User's Guide
Opens the Hardware User's Guide.
Software User's Guide winIDEA
Appendix • 375
SLO Text Format Specification
This is a specification of a text type symbol table that can be read in by winIDEA.
You can use an additional download file of SIT format to define custom symbols that
are otherwise not available in the main download files, or you can write a SIT format
converter to load symbols from a file of an unsupported type.
File Extension
The file must carry a '.SIT' extension.
File Header
The first line must contain the following string to allow type recognition:
260691SLO
File Tags
MODULE tag
Defines a program module generated from a source file or a precompiled object
module or library.
MODULE <module name> [,module source]
•
<module name> is a mandatory field, up to 8 characters
•
[module source] is an optional field specifying the path to the source file
from which the module was generated.
LINE tag
Defines a high level or assembler statement association between a line in source code
of the preceding MODULE definition and a target location.
LINE <address>,<line> {,column {,last ln. {,last col.}}}
376 • Appendix
•
<address> is the address of the code associated with the line symbol
•
<number> defines the position of the line in the source file
•
{column} is optional, defining the column in which the line starts
•
{last ln.} is optional, defining the last line of the line symbol
•
{last col.} is optional, defining the last column of the line symbol
Software User's Guide winIDEA
GLOBAL tag
Defines a global variable, defined in the preceding MODULE definition. If there was
no preceding MODULE definition it is associated to a predefined global module
with blank name.
GLOBAL <name>,<address> {,type}
•
<name> is name of the variable
•
<address> is the address of the variable
•
{type} is optional, defining the type of variable
LABEL tag
Defines a code label (usually generated by assembler), defined in the preceding
MODULE definition. If there was no preceding MODULE definition it is associated
to a predefined global module with blank name.
LABEL <name>,<address>
•
<name> is name of the label
•
<address> is address of the label
CONSTANT tag
Defines an association between a name and a value, typically defined by an EQU
statement or a C const definition.
CONSTANT <name>,<value>
•
<name> is name of the constant
•
<value> is a decimal (if not explicitly specified hex with the 0x prefix)
value of the constant
FUNCTION tag
Defines a high level procedure or a nested block. A function will have a non-blank
name and is assumed to be defined in the preceding MODULE definition. A nested
block caries a blank name. Its scope definition does not necessary refer to the
preceding FUNCTION declaration, but is calculated from its address. Blocks that
can not be fitted in a function are not allowed.
FUNCTION <name>,<address>,<exit address 1>,…<exit
address n>
Software User's Guide winIDEA
•
<name> is name of the function. If blank, than this is a block definition
•
<address> is the first address of the function/block.
•
<exit address 1>,..,<exit address n> are exit addresses from the
function/block. At least one exit (higher most) must be specified.
Appendix • 377
LOCAL tag
Defines a local variable. It is assumed to be defined in the preceding FUNCTION
definition (true function or a block)
LOCAL <name>,<address> {,type}
•
<variable name> is name of the variable
•
<address> is address of the variable
•
{type} is optional, defining the type of variable
FORMULA tag
Defines a way to calculate a physical location. A formula must be defined prior to its
usage in any address definition.
FORMULA <number>,<definition>
•
<number> is the index number of the formula by which it will be referred to
in address definitions (1-255)
•
<definition> is a string, defining the way a physical address is calculated.
See CPU appendix for information on defined formulas.
Address Specification
<address> of an object is a decimal value, or hexadecimal if prefixed with a '0x'
prefix.
10
address 10 (0Ah)
0x10
address 16 (10h)
Optionally the address value can be preceded by a number and a colon sign, thus
overriding the default physical linear address mapping.
2:10
value 10 applied on formula 2.
If formula 2 was defined as '(SP+ADDRESS)' then the 10 specifies a 10-byte offset
from the SP register.
Example:
FORMULA 1 (IO)(ADDRESS)
GLOBAL
378 • Appendix
port 1:0x40
Software User's Guide winIDEA
Type Specification
<type> of a variable can be one of the types below
type
type description
void
void type
bit
a single bit
s8
signed 8 bit entity (char)
u8
unsigned 8 bit entity (unsigned char)
s16
signed 16 bit entity (short)
u16
unsigned 16 bit entity (unsigned short)
s32
signed 32 bit entity (long)
u32
unsigned 32 bit entity (unsigned long)
f32
32 bit float number (float)
f64
64 bit float number (double)
f80
80 bit float number (long double)
Pointer Specification
A type can be prefixed by a 'p' thus specifying a pointer to the type:
ps8
pointer to s8
*char
Size of a pointer can be specified by a decimal digit following the 'p'. If no size is
specified a value 2 is assumed.
p2s8
2 byte pointer to s8
*char
The memory area to which the pointer is pointing can be specified by a decimal
number following the 'p<size>' where <size> is a mandatory single digit pointer size
specifier. The number that follows specifies the index of a linear formula that points
to the memory area. If no number is specified the default formula (ADDRESS) is
assumed (CODE area on 8031 CPU family).
p24s8 2 byte pointer to s8, the object pointed to, is
accessed by 4-th formula
If the 4-th formula was defined (XDATA)(ADDRESS), then this is a pointer to a
char variable located in XDATA memory area.
* xdata char
Array Specification
A type can be prefixed by an 'a' followed by a number, thus specifying an array of
the type:
a40s8 array of 40 s8 elements
char[40]
a10pu16 array of 10 pointers to u16 elements
unsigned int *[40]
Software User's Guide winIDEA
Appendix • 379
Examples
A SIT file can contain just simple user extensions to the symbol table, thus defining
additional symbols:
260691SLO
GLOBAL HeapOrigin,0x4000
LABEL
start,0
The above file defines an untyped global symbol 'HeapOrigin', located on address
4000h and program label 'start' on address 0h.
If you write your own translator from your linker output or listing file the SIT file
might look something like this:
260691SLO
FORMULA
1,(IX+ADDRESS)
MODULE
STARTUP,C:\LUKNA\STARTUP.ASM
LABEL
start,0
GLOBAL
StackTop,0xFFFF
CONSTANT
StackSize,0x1000
MODULE
MAIN,C:\LUKNA\MAIN.C
LINE
0x1000,10
LINE
0x1008,12
LINE
0x1010,13
LINE
0x103C,17
LINE
0x106A,18
LINE
0x1070,20
GLOBAL
c,0x4000,s8
FUNCTION
main,0x1000,0x1080
LOCAL
i,1:-2,s16
FUNCTION
,0x1010,0x106A
LOCAL
i,1:-6,f32
If you decide to write your own translator, this is the order in which to do it:
380 • Appendix
•
write the 260691SLO header
•
write all required formulas
•
write global variables and labels that are not defined in any of modules
•
write module by module with its lines, globals, labels and functions
Software User's Guide winIDEA
Accepted Formulas
The list below shows formulas that are accepted:
Formula string
Description
(ADDRESS)
default linear addressing mode
<register>
variable stored in a CPU register.
Example: R0
(<register>+ADDRESS)
offset from a CPU register.
Example: (SP+ADDRESS)
((<variable>)+ADDRESS)
offset from a variable.
'<variable>' is a simple type variable.
Example: ((?C_XBP)+ADDRESS).
All above formulas can be preceded by a memory area specifier, thus defining the
CPU memory area. If none is specified the default program area is assumed.
(<memory area>)<formula>
Example:
(XDATA)(ADDRESS)
linear addressing in the XDATA area
Software User's Guide winIDEA
Appendix • 381
Color Syntax Files Definition
Special Keyword Definition
Keyword coloring has proven itself many times for developers, since information is
organised also in colors. The colors for standard keywords for C/C++ can be
specified in the Editor Options/Colors dialog. Also, special keywords can be defined,
for example special typedefs can be defined as keywords for both C/C++ files and
Assembler files. The keywords are defined in two special files called ‘C.CCS’ for
C/C++ keywords and ‘ASM.CCS’ for Assembler keywords. The coloring of
keywords is defined also in the Editor Options/Colors dialog, under ‘C/CPP Custom’
and ‘ASM Custom’, respectivelly.
The ‘C.CCS’ and ‘ASM.CCS’ are expected by winIDEA to be located in the 'CCS'
subdirectory of winIDEA's installation directory.
C.CCS and ASM.CCS File Syntax
‘C.CCS’ and ‘ASM.CCS’ syntax is simple. Text of every line in the file is
considered a keyword, and the file is a plain text file.
Example (c.ccs):
UINT
DWORD
BYTE
Example (asm.ccs)
SECTION
MODULE
DB
DS
382 • Appendix
Software User's Guide winIDEA
Assembler Color Syntax File Definition
This is a specification of the Assembler Color Syntax file. Since there is no syntax
standard for assemblers, the syntax must be configured in a definition file specified
in the Edit/Options/Customize dialog (see “Further Customization” on page 43).
X42H
X
X423H
X
The dialog will list all syntax definition files located in the 'CCS' subdirectory of
winIDEA's installation directory.
CCS File Syntax
The definition file is a plain text file and must have the extension '.CCS'.
IDENTIFIER_CHAR_FIRST: <list of characters that can start
an identifier>
IDENTIFIER_CHAR: <list of characters that can be used in an
identifier after the first character>
KEYWORDS:
<keyword 1>
<keyword 2>
...
<keyword N>
KEYWORDS1:
<keyword1 1>
<keyword1 2>
...
<keyword1 N>
COMMENT_EOLN: <string that starts a comment valid until the
end of the line>
COMMENT_OPEN: <string that starts a multi line comment>
COMMENT_CLOSE: <string that ends a multi line comment>
STRING_CHAR: <character that starts and ends a string>
CHAR_CHAR: <character that starts a character definition>
CASE_SENSITIVE: yes | no <selects case sensitivity>
The order of tags in the definition file is not important. If a certain tag is ommited,
the following default is assumed:
IDENTIFIER_CHAR_FIRST:
abcdefghijklmnopqrstuvwxyzABCDEFGHIJKLMNOPQRSTUVWXYZ_
IDENTIFIER_CHAR:
abcdefghijklmnopqrstuvwxyzABCDEFGHIJKLMNOPQRSTUVWXYZ0123
456789_
No keywords, comments and strings are recognized.
Software User's Guide winIDEA
Appendix • 383
Example (Keil A51 assembler):
IDENTIFIER_CHAR_FIRST:
abcdefghijklmnopqrstuvwxyzABCDEFGHIJKLMNOPQRSTUVWXYZ_?$
IDENTIFIER_CHAR:
abcdefghijklmnopqrstuvwxyzABCDEFGHIJKLMNOPQRSTUVWXYZ0123
456789_?
KEYWORDS:
ADC
ADD
...
XRL
KEYWORDS1:
BIT
CODE
...
SEGMENT
COMMENT_EOLN: ;
STRING_CHAR: '
384 • Appendix
Software User's Guide winIDEA
Glossary of Terms
AUX
Auxiliary signals recorded by trace board
Bank-switching
Memory range expansion technique used mainly on 8 bit CPUs
BDM
Background Debug Mode - special debug aid module found on some Motorola CPUs
Breakpoint
Real-time condition that stops the CPU.
Browser
Symbol table navigation tool.
Build Manager
Program module, which interfaces third party compilers
Code Coverage
Execution analysis method which finds non-executed program code
Context Menu
A local menu holding commands that are specific to a window. Activated with right
mouse button.
Debug Areas
Emulated CPU's memory ranges covered by emulation memory. Full debugging is
not available outside these areas.
Software User's Guide winIDEA
Glossary of Terms • 385
Debug monitor
Program code residing in the target system’s memory, which communicates with
emulator and handles debug requests.
Download
Operation that initializes hardware, loads the program and starts emulation.
Download file
File holding symbolic and/or program information, loaded by winIDEA upon
download request.
Emulation memory
Memory provided by in-circuit emulator. Used instead of target's memory.
Evaluation period
A one-month period, where no license limits apply.
Group
Build Manager's organization structure. Groups project files.
In-Circuit emulation
CPU emulation technique, using target CPU replacement
Indirection file
Configuration file used by linker.
JTAG
Special on-chip debug aid module found on some CPUs
Link Order
Order in which object modules are passed to linker.
Memory mapping
In-circuit emulation memory configuration. Determines which memory requests are
serviced by emulator and which are passed to target.
386 • Glossary of Terms
Software User's Guide winIDEA
ONCE
ON-Chip Emulation
Output Directory
The directory where all files created in a build session are moved to.
Pattern generator
Programmable signal generator found on in-circuit emulation units
Performance analysis
Execution analysis method, which determines CPU time, spent in program functions
POD
In-circuit emulation adapter which plugs into the target's CPU socket.
Profiler
Performance analysis method, based on recording function entries and exits
Project configuration file
File which holds compiler interface configurations as well as a list of user source
files that participate in the build.
Project file
User's source file used in the build process.
PROM simulation
ROM, RAM, FLASH simulation
PROM system
Hardware and software that control ROM/RAM simulator operation
Pseudo device
A logical grouping of physical PROM devices and configurations. Facilitates
handling multi-device simulation.
Qualifier
Trace condition specifying what type of information is recorded.
Software User's Guide winIDEA
Glossary of Terms • 387
Real-time access
In-circuit emulation memory access method. Allows reading and writing of memory
without stopping the CPU.
REmulation
CPU emulation technique, using a combination of memory device replacement and
simulation
SFR
Special Function Register
Single chip
CPU without external memory.
Target
Build Manager's set of configuration options.
Target system
User hardware whose program is being debugged
Trace
Optional debug module, used for real-time program execution analysis
Trigger
Complex real-time trace condition which controls trace board activation.
Watchdog
A hardware timer, which resets the CPU, if not serviced periodically by the target
program.
Workspace
The full set of configuration, project and other files involved in one project.
Workspace file
The central file which holds all workspace configuration information, except for
Build Manager configuration.
388 • Glossary of Terms
Software User's Guide winIDEA
J
JTAG 386
Index
L
Link Order 386
M
Memory mapping 386
O
ONCE 387
Output Directory 387
A
AUX 385
B
Bank-switching 385
BDM 385
Breakpoint 385
Browser 385
Build Manager 385
C
Code Coverage 385
Context Menu 385
P
Pattern generator 387
Performance analysis 387
POD 387
Profiler 387
Project configuration file 387
Project file 387
PROM Simulation 387
PROM system 387
Pseudo device 387
Q
Qualifier 387
D
R
Debug Areas 385
Debug monitor 386
Download 386
Download File 386
Real-time access 388
REmulation 388
E
SFR 388
Single chip 388
Emulation memory 386
Evaluation period 386
S
T
Glossary of Terms 385
Group 386
Target 388
Target system 388
Trace 388
Trigger 388
I
W
In-Circuit emulation 386
Indirection file 386
Watchdog 388
Workspace 388
Workspace file 388
G
Software User's Guide winIDEA
Index • 389
390 • Index
Software User's Guide winIDEA