1
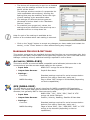
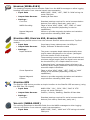
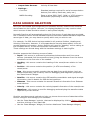
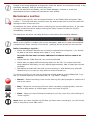
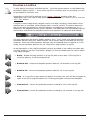
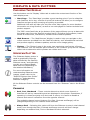
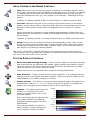
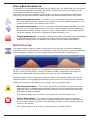
SCANLINE SOFTWARE USER GUIDE (VERSION 2.1) CONTENTS Contents............................................................................................................ 2 Important Safety Instructions .......................................................................... 3 Technical Support ............................................................................................. 3 Installing Scanline ............................................................................................ 4 Uninstalling Scanline......................................................................................... 4 Understanding scanline..................................................................................... 5 The User Interface ............................................................................................ 5 How Scanline Works .......................................................................................... 6 Operating Mode ............................................................................................. 6 Hardware Devices .......................................................................................... 6 Data Sources ................................................................................................ 6 Display Plotters ............................................................................................. 6 Widgets ........................................................................................................ 7 Using Scanline For The First Time ..................................................................... 7 Configuration Wizard ......................................................................................... 7 Start Page & Quick Links.................................................................................... 7 Hardware Management ..................................................................................... 8 Adding a new Hardware Device........................................................................... 8 Removing a Hardware Device ............................................................................. 9 Changing Hardware Settings .............................................................................. 9 Hardware Devices & Settings............................................................................ 10 Altimeter (NMEA-0183) ................................................................................ 10 GPS (NMEA-0183) ....................................................................................... 10 Heading (NMEA-0183) .................................................................................. 11 Starfish 450, Starfish 452, Starfish 990 .......................................................... 11 Starfish GPS................................................................................................ 11 Velocity (NMEA-0183) .................................................................................. 11 Data Source Selection ..................................................................................... 12 Data Compilation ......................................................................................... 13 Data Logging and Playback ............................................................................. 13 Viewing Live Data ........................................................................................... 13 Recording a LogFile ......................................................................................... 14 Playing a LogFile ............................................................................................. 15 Displays & Data Plotters ................................................................................. 16 Choosing The Display ...................................................................................... 16 Sidescan Plotter .............................................................................................. 16 Channels .................................................................................................... 16 Gain, Contrast and Range Controls................................................................. 17 Plotter Display Controls ................................................................................ 17 Status Bar Information ................................................................................. 18 Depth Plotter.................................................................................................. 18 Widget Bars .................................................................................................... 19 Configuring .................................................................................................... 19 Widgets ......................................................................................................... 19 Data Console Widget .................................................................................... 19 Data Manager Widget ................................................................................... 19 GPS Satellites Widget ................................................................................... 20 Hardware Manager Widget ............................................................................ 20 Log Details Widget ....................................................................................... 20 Log Player Widget ........................................................................................ 20 Vessel Details Widget ................................................................................... 21 Environment & Display Options....................................................................... 21 Units .......................................................................................................... 21 2 Velocity Of Sound ........................................................................................ 22 Exporting Data ................................................................................................ 22 Snapshotting Displays ..................................................................................... 22 Numerical Data............................................................................................... 23 IMPORTANT SAFETY INSTRUCTIONS Before using your StarFish 'Seabed Imaging System', please read and follow the safety instructions highlighted at the start of the “StarFish System User Guide”. Throughout this document the following symbols are used to indicate special precautions or procedures you should take note of… WARNING! This symbol indicates a warning you should take special note of to avoid bodily injury and damage to your equipment. CAUTION This symbol denotes precautions and procedures you should take note of to avoid damage to your equipment. NOTE This symbol denotes special instructions or tips that should help you get the best performance from your StarFish system. TECHNICAL SUPPORT For technical support enquiries, please email [email protected], and for other support contact details (including website, telephone etc.), please refer to the “Product Support” section of the accompanying Starfish System User Guide. If you think you have found a bug or have any other operational issue, please report it to us at the technical support email address above, and we will endeavour to fix it as quickly as possible in the next software release. Where possible and appropriate, please include as much detail as you can about the issue, including… The current software version you’re using (displayed on the software splash screen during loading), The hardware details of the system you are running Scanline on The circumstances under which the error occurs, And the text of any messages displayed on screen. 3 INSTALLING SCANLINE Note: Do not connect the sonar USB electronics to the PC until the ‘Scanline’ software and drivers have been installed – this will simplify the install procedure. (If you connect the hardware first, the drivers may not be present when required, and you will have to manually install them.) To install Scanline onto your compute, please follow these steps… 1. Insert the “Scanline” software CD into your computer. 2. The installation menu automatically de displayed (if auto-play is enabled on the operating system), but if not, run the “ScanlineMenu.exe” program located in the root directory of the software CD. 3. From the menu, as well as installing the Scanline application, you may also choose to view product documentation or install individual components for additional hardware devices. Select “Install Scanline” to start the main installation wizard. 4. If required, the wizard will install any required components such as the Microsoft “.NET” framework and Data Access Components before it continues. This process may take several minutes. 5. Follow the remaining instructions in the wizard to install the Scanline software. You will be prompted to choose the type of StarFish system you are using, this allows the correct documentation and start-menu links to be setup. 6. Once the installation wizard completes, the ‘Adobe Reader’ installer may run if you have selected this option from the customised setup. The ‘Adobe Reader’ is required to view the product manuals and other ‘PDF’ documentation provided on the Scanline CD. 7. Finally, once you have successfully installed the software, you should connect and configure the hardware as described in the accompanying “StarFish System User Guide” booklet or “Quick Start” sheet. 8. Access to the product documentation (if installed), links to the Starfish website, and the software uninstaller are also available from the ‘Start menu’ program folder you specified as Scanline installed. Check the StarFish product support website (at “www.starfishsonar.com/support/ support.htm”) regularly to download the latest software versions and enhancements, as they become available. UNINSTALLING SCANLINE Should you wish to uninstall the software you may use one of the following methods… Select the “Uninstall Starfish Scanline” icon from the program folder in the Start Menu. Alternatively, double click the “Add/Remove Programs” icon (Windows XP) or “Programs and Features” icon (Windows Vista, Windows 7) the Windows control panel, and select “Starfish Scanline” from the list of installed programs. Click “Remove” and follow the on-screen instructions. UNDERSTANDING SCANLINE THE USER INTERFACE When you run the Scanline application, you will be presented with a user interface that will look similar to the figure below… Ribbon Bar Display Area Status Bar Widget Bar The actual contents and layout of the application may differ slightly between your current set-up and the figure above, but in general the user interface contains the following parts … The Ribbon Bar and System Button, located along the top of the display, provide quick access to functionally-related groups of commands and controls. Clicking the round red system button will display a menu containing commands relating to files (creating, opening, exporting etc.), while clicking on the tab headings will change the groups of command buttons below then. For simplicity in the rest of this guide, function buttons on ribbon tabs will be documented in the format ‘<TabName> : <ButtonName>’. The Display Area occupies the central section of the Scanline window, and is used to display the data plotters for connected hardware devices, as well as web-browser windows and the application’s Start Page. Widget Bars are located on either side of the display area and contain a collection of Widgets that provide additional information and functions to help you interpret the logged data collected with your StarFish. Options on the “Setup” Ribbon Bar tab allow you to choose which widgets you want in each bar, and these areas can be hidden or resized by the dragging or clicking in the vertical ‘splitter’ zones at their edge. The Status Bar is located along the bottom of the display, and shows information and data relating to the control or plotter currently located beneath the mouse pointer. To the right of the status bar are a set ‘quick controls’ that can be used to help record and playback LogFiles. 5 HOW SCANLINE WORKS OPERATING MODE The main aim of Scanline is to provide you with a simple means to survey underwater environments where you collect, review and analyse the data from your StarFish and other supporting hardware devices (such as GPS receivers). To achieve this, Scanline always operates in one of three modes… Live Data Mode, where data from the sonar and other hardware is presented in real-time on the various display plotters, but is not stored. Record Mode, where the live data is shown (as in Live Data Mode), but also stored into a LogFile on your computers hard disk. Playback Mode, where data recorded from a previous session in a LogFile may be reviewed, analysed and exported into formats that can be used in other 3rd party applications. By default Scanline operates in ‘Live Data Mode’, unless you instruct it to record or playback a LogFile. Closing a LogFile that is open, will return Scanline to ‘live’ mode. The current operational mode of Scanline is shown in the title bar of the application, along with the filename of any open LogFile. HARDWARE DEVICES Before data can be viewed or recorded into a LogFile, Scanline must first be configured to communicate with the attached external hardware devices (such as the Sonar, GPS etc.). Scanline provides several methods to help you manage your hardware, and these are discussed further in the “Hardware Management” section of this guide. Note: The configuration of Scanline devices is separate from and in addition to the driver installation procedure required by the operating system for each device, which should be performed first. DATA SOURCES As hardware is added or removed, Scanline maintains a list (or index) of ‘Data Sources’, that describe which type of data can be produced by each connected device. While all sensor data is recorded in a LogFile, when it is shown on screen each plotter display needs to know which source of data it should use, especially as two devices might be connected that produce the same kind of data (i.e. the Sonar and Altimeter devices may both produce depth data, or a GPS device may produce heading information, but it may be desirable to use a more accurate source such as the vessels electronic compass.) Each plotter display responds to a different type of data (sidescan, heading, position, velocity, depth etc.), and normally Scanline will try to automatically select the best data source available. However, occasionally you may want to override this and so Scanline provides several methods to help you choose the preferred hardware device that will be used. These are discussed further in the “Data Source Selection” section of this guide. DISPLAY PLOTTERS When viewing live or replayed data, the main display area of the application switches into “Plotter Mode” to show the information graphically. The “Display” tab in the Ribbon Bar provides a selection of controls that can be used to control the overall function of the display area, and choose which plotters are available. Different plotters will show data from one or more sources (such as depth and sonar information on the ‘Sidescan’ plotter), so understanding the above concept of Data 6 Sources and configuring these correctly is important. Plotters in the main display area can have a static ‘Snapshot’ of their contents taken and saved into an image file on the hard-disk. For further details of this, please refer to the “Snapshotting Displays” section of this guide. WIDGETS Widgets provide additional controls or information displays relating to the currently open LogFile in Scanline. A variety of Widgets is available and can be displayed in either of the widget-bars that sit on both sides of the main display area. To save screen space, Widgets can also be rolled up by clicking on their title bar, and some widgets can be resized vertically to enlarge their display area (these Widgets have thicker bars along their bottom edge). For further details on configuring the display Widgets, see the “Widget” section of this guide. USING SCANLINE FOR THE FIRST TIME CONFIGURATION WIZARD When you run Scanline for the first time following its installation, the ‘Configuration Wizard’ will automatically start. It is recommended, on first use that, you complete this wizard to fully configure Scanline, although you can re-run the wizard at any time, by clicking ‘Setup : Config Wizard’. The wizard will take you through a series of steps that allow you to easily change the operating parameters and setup of Scanline to your needs, and get you up-andscanning as quickly as possible. It is split into the following sections, each with its own on-screen instructions… Hardware & Data Sources – check boxes allow you to quickly add commonly used hardware, or go into additional hardware configuration pages, and then choose the required data sources if your setup is more complex. Display Setup – a series of checkboxes and controls let you configure the display plotters, and choose which widgets you want to use and where they will appear. Units and Format – on these pages you can choose the units to use for measurement & velocity, and the format to use for bearings and positional values. Velocity of Sound – where you can enter the properties of the water you’re surveying in (temperature, salinity, depth) and calculate the sound velocity to ensure sonar measurements are displayed accurately. Logging Setup – you can choose the behaviour of the log recorder and player when opening and creating new LogFiles. START PAGE & QUICK LINKS Having completed the Configuration Wizard, the ‘Start Page’ provides the ideal starting point if you’re unfamiliar with Scanline. At its top, a series of quick link buttons will allow you to configure Scanline and get up and surveying as quickly as possible. Additional links also will take you into the online help system for more detailed information on using Scanline, as well as our web-pages for further technical and product support. The start page can be viewed at any time choosing ‘Display : Start Page’. 7 HARDWARE MANAGEMENT Before data can be viewed or recorded into a LogFile, Scanline must first be configured to communicate with the attached external hardware devices (such as the Sonar, GPS , Compass etc.). The first time you run Scanline, the ‘Configuration Wizard’ will take you through setting up your basic hardware requirements. However, Scanline provides several methods to help you further configure and manage your hardware… Use the ‘Hardware Manager’ controls, that can be displayed by clicking ‘Setup : Options’ and then clicking on the ‘Hardware’ tab. Use the ‘Hardware Manager’ Widget, for further details see “Hardware Manager Widget”. Run the ‘Hardware Wizard’ by clicking ‘Setup : Hardware Wizard’ and then follow the on-screen instructions to complete the task you require. When a new LogFile is created, the current hardware configuration is stored and cannot be further modified (devices added or removed). Therefore, all hardware configuration should be performed before a new LogFile is recorded. ADDING A NEW HARDWARE DEVICE Note: The configuration of Scanline devices is separate from and in addition to the driver installation procedure required by the operating system for each device, which should be performed first according to the manufacturers instructions. To add hardware devices, click ‘Setup : Hardware Wizard’ to start the Hardware Wizard. Click ‘Next’, and on the ‘Choose a task’ page, select ‘Add a hardware device’. You will be presented with a list of recognised hardware devices that may be added. Choose a device from the list, and click the “Next” button to continue. The wizard will prompt you to configure the newly added device. Click “Yes” if you wish to immediately modify the device settings (i.e. COM port), upgrade firmware etc., or otherwise click “No” to continue and use the default settings. This completes the ‘Add Hardware’ wizard. Click “Finish” to close the window. Your new device should appear in the ‘Hardware Manager’ device lists. If connected it should start producing data immediately, however if an error has occurred, you may need to change its settings – see the “Changing Hardware Settings” section. 8 REMOVING A HARDWARE DEVICE To remove a hardware device, click ‘Setup : Hardware Wizard’ to start the Hardware Wizard. Click ‘Next’, and on the ‘Choose a task’ page, select ‘Remove an installed device’. The wizard will show you a list of installed hardware devices. Select the device to remove by clicking it, then click ‘Next’ to proceed. When asked to confirm the removal of the device, click “Yes” to continue. Once a device has been removed, the ‘Add Hardware’ wizard must be run to reinstall it, and any settings must be reconfigured. Click “Finish” to complete the wizard. The originally selected device will now have been removed from the Device Manager. CHANGING HARDWARE SETTINGS Note: Each hardware device has settings that can be modified to control its behaviour and performance. However, care should be taken before modifying some of these settings as they may produce unexpected and undesirable results. To configure a hardware device, click ‘Setup : Hardware Wizard’ to start the Hardware Wizard. Click ‘Next’, and on the ‘Choose a task’ page, select ‘Configure and manage installed devices’. The wizard will show you a list of the installed devices and their current status. Select the device you wish to configure from the list and click ‘Next’ to continue. The wizard will show you several management options for the device… o Change Settings – chose this to view and modify the individual device settings o Default Settings – choose this to restore the device back to the state it was originally installed with. o Disable & Start – choose these to prevent the device from producing data, or re-enable the device if you had previously disabled it. o Update Firmware – choose this to start the firmware upgrade wizard. This option is only visible on devices that Scanline supports the firmware for. Click on “Change Settings” to continue. 9 The device will temporarily be put into a disabled state, and the settings window for the selected device will be shown. The settings window consists of a properties list (with expandable sub-sections), showing the settings that may be modified, and to the right of each heading is the associated value. The settings for different device types are discussed in further detail in the “Hardware Devices” section. For enabled (non-greyed out) values, the settings may be modified in the same way as a standard text box or drop-down list. Help for each of the settings is available at the bottom of the window when each setting is selected. Click on the “Apply” button to accept any changes you have made (and restart the device), or the “Close” button to close without saving any changes. HARDWARE DEVICES & SETTINGS This section summarises the available devices that Scanline can communicate with, their supported input data, output data source types they support (for use in the Data Source Manager controls) and any additional settings required to control them… ALTIMETER (NMEA-0183) This device allows an external NMEA compatible serial altimeter/echosounder to be connected and provide accurate depth data into the system. NMEA ‘DPT’ strings via serial COM port. Input Data Output Data Sources Settings… Com Port NMEA Decoding Depth & Raw data. Standard settings required for serial communication devices (Port name, baud rate, parity etc.) Flag to allow ‘DBT’ strings to be decoded (depending on device capabilities). GPS (NMEA-0183) The GPS device provides a generic interface for NMEA compatible GPS navigation systems. The output data types produced will vary depending on the NMEA sentence decoded, but generally RMC is most commonly used. NMEA ‘GGA’, ‘GLL’, ‘GSA’, ‘GSV’, ‘RMC’ & ‘VTG’ Input Data strings via serial COM port. Position, Velocity, Heading, Satellite & Raw data. Output Data Sources Settings… Com Port NMEA Decoding 10 Standard settings required for serial communication devices (Port name, baud rate, parity etc.) Flags to allow ‘GGA’, ‘GLL’, ‘GSA/GSV’, ‘RMC’ or ‘VTG’ strings to be decoded (depending on device capabilities). HEADING (NMEA-0183) The heading/compass device decodes fields from the NMEA messages to allow logging heading information from external vessel instrumentation. NMEA ‘HDG’, ‘HDM’, ‘HDT’, ‘RMC’ & ‘VHW’ string via Input Data serial COM port. Heading & Raw data. Output Data Sources Settings… Com Port Standard settings required for serial communication devices (Port name, baud rate, parity etc.) NMEA Decoding Flags to allow ‘HDG, ‘HDM’, ‘HDT’, ‘RMC’ or ‘VHW’ strings to be decoded (depending on device capabilities). Manual Magnetic Offsets Values to provide magnetic deviation and variation required when decoding ‘HDM’ data. STARFISH 450, STARFISH 452, STARFISH 990 These devices provide control over the relevant StarFish series electronics ‘Top Box’ module. Proprietary binary data stream via USB port. Input Data Output Data Sources Settings… Depth Detector Depth, Sidescan & Waveform data The sonar computes depth data dynamically when LogFile data is displayed on the screen (averaged from the results of both channels). These settings control the signal-level threshold and minimum target length (that the signal must exceed the threshold for) for a depth-detect to occur. A ‘damping factor’ parameter allows glitches to be reduced, where larger parameter values will produce smoother depth transitions. Sonar Operation Flags to allow ‘HDG, ‘HDM’, ‘HDT’, ‘RMC’ or ‘VHW’ strings to be decoded (depending on device capabilities). Manual Magnetic Offsets Values to provide magnetic deviation and variation required when decoding ‘HDM’ data. STARFISH GPS The Starfish GPS device provides a simple interface to the Starfish GPS accessory (using the SiRF Star-III chipset). NMEA ‘GGA’, ‘GLL’, ‘GSA’, ‘GSV’, ‘RMC’ & ‘VTG’ Input Data strings via serial COM port. Position, Velocity, Heading, Satellite & Raw data. Output Data Sources Settings… Com Port Standard settings required for serial communication devices (Port name, baud rate, parity etc.) VELOCITY (NMEA-0183) The velocity/speed device decodes fields from the NMEA messages to allow logging velocity information from external vessel instrumentation. NMEA ‘OSD’, ‘RMC’, ‘VHW’ and ‘VTG’ strings via serial Input Data COM port. 11 Output Data Sources Settings… Com Port NMEA Decoding Velocity & Raw data. Standard settings required for serial communication devices (Port name, baud rate, parity etc.) Flags to allow ‘OSD, ‘RMC, ‘VHW, or ‘VTG’ strings to be decoded (depending on device capabilities). DATA SOURCE SELECTION Once you have added and configured your hardware devices, Scanline will record all device data into its LogFiles. However, for display/playback you may need to select which sources of data should be shown in each plotter display. Normally Scanline will automatically select the first source of each data type provided, but in situations where several hardware devices have been added that each output the same type of data, you may have to specify which one you wish to use. For example, if a GPS device has been added it will produce Position, Heading and Velocity information. However, if a Compass device has also been added, it too will provide Heading information, and so Scanline will need its “Heading” source setting to the Compass device, so the more accurate information is used. These settings are stored along with the hardware settings in each LogFile. Scanline supports the following sources of data… Depth - this source is produced by altimeters/echosounders and from sonar devices (extracted from the acoustic echoes) giving the distance from the device transducer to the first echo of the seabed. Heading - this source contains the heading of the vessel/sonar relative to ‘true north’ Position - this source contains the position (in UTM coordinates) of the vessel/sonar. Raw - this source normally contains the raw data from serial devices (such as NMEA instruments) and is mainly used for debugging and diagnostic purposes in the ‘Data Console’ Widget. Satellite - this source contains the GPS satellite constellation and signal strength information, plus fix details for GPS derived positions. Sidescan - this source contains the acoustic Scanline information from Sidescan sonar devices. Velocity - this source contains the velocity/speed information of the vessel/sonar. Waveform - this source is used for debugging and analysing the waveform data captured by sonar devices. Scanline provides several methods to help you choose the sources of data that will be further configure and manage your hardware… Use the ‘Data Manager’ controls, that can be displayed by clicking ‘Setup : Options’ and then clicking on the ‘Data’ tab. 12 Use the ‘Data Manager’ Widget, for further details see “Data Manager Widget”. The figure opposite shows the typical layout of the data manager controls. Clicking on each heading will display a list of available installed hardware devices that produce the associated type of data. The indicator graphics to the left of each heading will rotate as data of that type is received or retrieved from a LogFile and passed into the display plotters. Clicking ‘None’ in a data source selection menu will prevent any data being passed into display plotters. This can be used to turn off features such as the depth overlay on the Sidescan plotter. DATA COMPILATION When data messages are received, either from the hardware or during log playback, they need to be collated together such that Sidescan sonar information can be related to the relevant position, heading and velocity of the vessel and sonar. To achieve this, Scanline uses a ‘Data Compiler’ that collects and temporarily stores the last received Position, Heading, Velocity and Depth sensor-messages. Only when a Sidescan message is received are the other collected messages then passed as a single message to the relevant display plotters. However, for this reason, if a Sidescan sonar isn’t connected (or no source is specified for the Sidescan type), you may observe data being received (in the ‘Data Manager’ displays), but not see any data appear on the display plotters (i.e. Depth display). DATA LOGGING AND PLAYBACK As previously discussed, Scanline always operates in one of three modes… Live Data Mode, where data from the sonar and other hardware is presented in real-time on the various display plotters, but is not stored. Record Mode, where the live data is shown (as in Live Data Mode), but also stored into a LogFile on your computers hard disk. Playback Mode, where data recorded from a previous session in a LogFile may be reviewed, analysed and exported into formats that can be used in other 3rd party applications. VIEWING LIVE DATA By default Scanline operates in ‘Live Data Mode’, unless you instruct it to record or playback a LogFile. Closing a LogFile that is open, will return Scanline to ‘live’ mode. The current operational mode of Scanline is shown in the title bar of the application, along with the filename of any open LogFile. The icon at the bottom right of the statusbar will turn yellow and rotate to indicate the reception of data… 13 If data is not being displayed as expected, check the device is connected correctly in the Hardware Manager, and not showing any error. Should the data still not display, use the ‘Data Manager’ controls to check the appropriate sources of data are selected for each plotter. RECORDING A LOGFILE To record a new log-file, click the system button on the Ribbon Bar and select “New LogFile…”. This will close any currently open log and prompt you for the file name and storage location of the new one. By default a file name will be chosen containing the current date and time. If you wish you may modify the name, before clicking the “Save” button to start the log-file immediately recording. The status bar will show recording activity in the bottom left red data indicator… When a new LogFile is created, the current hardware, data-source and environmental (measurement units, velocity-of-sound etc.) settings will be stored into the new file. Before recording a log-file… Check the hardware devices are correctly connected and configured – you should be able to see them display their data in “Live” mode. Once the file has been created, additional hardware devices cannot be added. Check that the “Data Sources” are correctly selected. Check that you have sufficient storage space for the file. For normal side-scan sonar data and GPS data, you will require approximately 1Mb of space per minute recorded. Familiarise yourself with the area you are working in, and identify any potential hazards to you, or that you may pose to others around you. To record a log-file you can use the following toolbar buttons on the Ribbon Bar “Log” tab (or shortcut buttons on the status bar, of “Log Player” widget) … Record – Starts recording in the current new log-file (and prompts to create one if one is not open). Stop – Stops the current log-file from either recording or playing back, until the record or play button is clicked again. Does not close a log-file. Close – When you have finished recording to your file, close it by click clicking on “Close LogFile”. Note: Once you have closed a log-file that you have been recording to, you will not be able to record any more data into it. PLAYING A LOGFILE To play back a previously recorded log-file, , click the system button on the Ribbon Bar and select “Open LogFile…”. If any other log-file is currently open or recording, you will be prompted to close this first. Depending on the LogFile settings in the ‘Setup : Options’ window under the ‘Application’ tab, your LogFile may start playing immediately or wait for you to click the ‘Log : Play’ button. A LogFile is best imagined as a digital version of a tape recording, where data is timestamped as it is recorded. When playing back, a virtual ‘pointer’ is used to determine the current play time/position, and this position is displayed in the status bar, so in addition to the playback activity green indicator, the status bar will also display several extra sliders that allow the playback position and speed to be observed and altered… You may open and use sensor display plotters, as in “Live” mode, and switch between hardware devices using the “Data Sources” as all sensor data is recorded into the log. However, some real-time hardware settings may be disabled when compared to “Live” mode, as the hardware devices are not required for playing back a log-file. As an alternative to the LogFile playback controls provided in the ribbon and staus bar, you may prefer to use the “Log Player” Widget, for further details see the section titled “Log Player Widget”. Reset - Resets the play position in a log-file back to the start. If the log-file is currently playing, it will be stopped first. Rewind 10s - Jumps the playback position back by 10 seconds in the log-file. Rewind 1% - Moves the playback position back by 1% in the log-file. Play - If no log-file is open when this button is clicked, the user will be prompted to open a new file to play the data from. Clicking play again will stop the playback. Forward 1% - Moves the playback position forward by 1% in the log-file. Forward 10s - Moves the playback position forward by 10 seconds in the log-file. 15 DISPLAYS & DATA PLOTTERS CHOOSING THE DISPLAY Use the buttons on the ‘Display’ ribbon tab to select the content and function of the main display area… Start Page – The ‘Start Page’ provides a good starting point if you’re unfamiliar with Scanline. At its top, a series of quick link buttons will allow you to configure Scanline and get up and surveying as quickly as possible. Additional links also will take you into the online help system for more detailed information on using Scanline, as well as our web-pages for further technical and product support. The ‘RSS’ news-feed links at the bottom of the page will keep you up to date with the latest news from the StarFish product family, including new products, trade shows & conferences, distributors, software and firmware updates. Web Browser – The ‘Web Browser’ display is used to help you navigate to the online resources provided from the StarFish website, such as additional technical and product support, software updates, and the online image gallery. Plotters – The ‘Plotters’ page is the main view used when performing a Survey with Scanline. You can use the option buttons in the ‘Plotters’ group on the ‘Display’ ribbon tab to determine which plotters are visible and in use. SIDESCAN PLOTTER The Sidescan display plotter is used to graphically view the data collected by the StarFish Sidescan sonar, and optionally overlay any collected depth data onto this (depending on the attached hardware). For more information on understanding Sidescan sonar images, please refer to the “StarFish System User Guide” section on “Understanding Sidescan Imagery”. All the Sidescan Plotter controls can be accessed from the “Sidescan” tab on the Ribbon Bar. CHANNELS Dual, Port, Starboard – These controls determine which sonar channel or channels are active, transmitting and are displayed in the plotter. Sometimes, if operating in closed proximity to a dock wall or shore, it is useful to disable a channel and remove reflections from the opposite channel. The available channel control buttons (for Gain, Contrast and Range) will be changed depending on the channel mode selected. 16 Always Dual – Selecting this option will force the Sidescan to stay in dual channel mode, even though the Gain, Contrast and Range controls will then change depending on weather Dual, Port or Starboard mode is selected. GAIN, CONTRAST AND RANGE CONTROLS Gain determines how the incoming signal is mapped to the display palette, where more intense received echoes will display as a brighter colour. Therefore, increasing (or adding) gain to the sonar will make the image appear brighter, but may also make the background noise (or ‘hiss’) appear on the display – especially at larger ranges. Typically, for getting started, a Gain of around 30% (or -28dB) should be used. Contrast represents the span of the incoming signal when shown on the display palette. Larger values mean it requires a larger signal for the brightest colour to be displayed, while smaller values mean the brightest colour is shown for smaller signals Hence, decrease the contrast to make potential targets appear brighter than the background, and increase the contrast if the background levels on the sonar image are too bright. Typically, for getting started, a Contrast of around 30% (or 38dB) should be used. Range controls how much data is collected and displayed for each “ping” of the sonar. As sound travels through water at approximately 1500 metres-per-second, increasing the range will slow the data collection down, as the sonar will need to wait longer for echoes from distant targets. The units in which Gain, Contrast and Range are expressed can be chosen from the “Environment” options window tab. However, the toolbar text boxes will accept values in any units if the unit suffix is also entered. PLOTTER DISPLAY CONTROLS Show Recorded Settings & Range – These controls toggle how the gain/contrast and range settings are applied to the display. When checked, the display is drawn using the values of the controls that were specified when the data was recorded, otherwise the current control values are used. These controls are only available when a log-file is being played back. Scan Direction – These controls determine the orientation of the display drawing, and which side of the display new data is added. These are useful for aiding in the interpretation of the display relating to the boat. Display Stretch – The stretch controls allow the displayed data to be magnified or stretched by a factor or 1, 2 or 3. These functions are useful for changing the aspect ratio of targets on the display and aid in their identification. Palettes – The palette drop-down list allows you to choose which set of colours you would like to use on the Sidescan display. Some users find that the high contrast (non-linear) palettes are better at highlighting targets against the seabed textures. The inverted palettes are useful in direct sunlight, as light background colour improves viewing contrast. Standard Grey Blue Green Brown High Contrast Bronze Ocean Inverted Negative Solar 17 STATUS BAR INFORMATION In addition to the commands available on the Ribbon Bar, the Status Bar (at the bottom of the Scanline application window) will display vessel and target information for the sonar data beneath the mouse pointer. Depending on the date available to the plotter, the type of information it will display may vary, but the icons below indicate what mode and calculations are being used… Vessel Only Measurement – If position, but no heading information is available, the sonar data cannot be related to the vessel, so only the details available for the vessel (at the origin of the display) are shown. Acoustic Measurement - If there is position and heading data available (i.e. from a GPS), but no depth data, then the ‘acoustic’ range is display, and an estimated target position based on this. However, as the range is NOT a direct measurement along the seabed, the position reading is an approximation only. Target Measurement – If position, heading and depth information are all available to the Sidescan plotter, it will perform a ‘slant range correction’ calculation to display the range along the seabed to the target, and its real-world position. DEPTH PLOTTER The Depth display plotter is used to graphically view the data collected by attached altimeter/echo-sounder devices, or computed in-real time by sonar’s (see the individual sonar settings for details on how to adjust detection thresholds, smoothing etc.) As data is collected or played, the new depths are added to the right of the plotter, whose Y-Axis will auto-scale to ensure all data is visible. Dragging the dividing line between the depth and Sidescan plotter will allow its size to be adjusted. While the depth plotter shows all the data currently in the display buffer used by the Sidescan plotter, the highlighted area shows which section is currently being viewed. Additional controls are available in the “Depth” tab on the Ribbon Bar… Warning Depth Alarm – This control (and edit-box) allows a warning proximity depth alarm to be enabled and adjusted. When the current depth goes shallower than this value, the depth plotter will flash yellow, and the user should be aware that water is getting shallow. The warning depth level is shown on the plotter by a dotted yellow line. Critical Depth Alarm – The critical proximity depth alarm works in a similar fashion to the above warning alarm, except the plotter will flash red and the user should either remove the sonar from the water, or take correcting action with the course of the vessel. The critical depth level is shown on the plotter by a dotted red line. 18 WIDGET BARS CONFIGURING Widgets are small display panels that are used to provide extra functionality or datadisplays in additional to the main display area in the Scanline application. Scanline supports two ‘widget-bars’ down either side of the main display area, where each bar can hold a variety of widgets that are chosen by the user depending on their preference and requirements of the current survey job. The widget bars can be shown or hidden by clicking on the appropriate button in the “Display” tab on the Ribbon Bar (‘Display : Left Widgets’ and ‘Display : Right Widgets’) Clicking the bottom part of either button will display a menu of widgets that can be quickly added. Widgets that are already visible on another bar will be greyed out, as a widget cannot appear in both bars at the same time. The order of the widgets in each bar can be modified using the “Configure Bar” option at the bottom of the appropriate pop-up menu. Widgets are displayed vertically in the widget bars. Clicking the title of a widget will either collapse or expand its panel below. This is useful to save display space when certain widgets are not required. If the height of the visible widgets exceeds the display height, a scroll bar appears allowing the appropriate widgets to be scrolled into view. For convenience, you may use the ‘Configuration Wizard’ (‘Setup : Config Wizard’) to restore the widget bars back to either an empty or default state. It is recommended that one widget bar (i.e. the left) be used for management or configuration functions (such as the Hardware Manager, Data Manager, Data Console etc.) while the other bar be used for information display (such as the Log Player, GPS Satellites, Vessel Details etc.). This way, when configuration is completed, the entire widget bar can be quickly hidden, maximising the available display space. WIDGETS DATA CONSOLE WIDGET The ‘Data Console’ widget helps diagnosing problems with connected hardware. The console display shows a text representation of all recorded sensor-messages as they are received into or played back from a log file. The “NMEA Data” button displays only NMEA raw data messages, to aid in determining the correct operation of an attached GPS or other NMEA device. DATA MANAGER WIDGET The ‘Data Manager’ widget allows the user to choose the source of sensor-messages to be used in the display plotters. Click each heading to display a menu of available data sources for that category. When data from the specified source is received, the icon to the left of the heading will animate to show the frequency of received data. For further details on data sources, see the “Data Source Selection” section. 19 GPS SATELLITES WIDGET The ‘GPS Satellites’ widget is only used when a GPS device is attached that produces satellite constellation sensor-messages. The identification, position, availability and signal strengths of the satellites is shown in the widget, and further details of the fix type and time are displayed at the bottom. A red colour indicates the signal strength is too low for that satellite to be used. A dark blue colour indicated the data is present, but not being used in the computed GPS solution. A light blue colour indicates the satellite is being used in the GPS solution. HARDWARE MANAGER WIDGET The ‘Hardware Manager’ widget provides a quick and easy method to view the state of the attached hardware devices, and add additional devices or removed existing ones (by means of the ‘tool’ button at its top-right). To permanently disable a device from producing data, select the device in the list and click the ‘Stop’ button. To adjust the hardware settings of a device (such as serial-port settings, sonar performance etc.), select the device and click the ‘Settings’ button – the device will be disabled while the settings are adjusted. LOG DETAILS WIDGET The ‘Log Details’ widget allows extra information about the LogFile to be collected and stored for future reference. LOG PLAYER WIDGET The ‘Log Player’ widget provides the same functionality as that given by the “Log” tab on the Ribbon Bar, and the quick Status Bar controls. When playing back a recorded LogFile, the speed of playback and position in the file can be adjusted by means of the slider controls. For further details on reviewing LogFiles, see the “Playing a LogFile” section. 20 VESSEL DETAILS WIDGET The ‘Vessel Details’ widget is used to display the position, heading and velocity of the vessel, using data recorded from a connected GPS device (other devices such as Compasses or Velocimeters will only also display their results under the relevant heading). The format and units of measurement used for the readings can be adjusted using the controls under the “Setup” Ribbon Bar tab. ENVIRONMENT & DISPLAY OPTIONS Most environmental and display options can be quickly viewed and changed by selecting the “Setup” tab on the Ribbon Bar, or more comprehensive options are available by clicking ‘Setup : Options’. UNITS The ‘Units’ group on the “Setup” Ribbon Bar tab allows you to quickly select between metric or imperial measurement units and numerical formatting styles for data to be displayed in. The available categories of measurement units/format are… Depth & Range – These settings control how depth and sonar range data is displayed (select from metres, feet or yards). The measurement units used for Velocity-of-Sound reads are determined from this selection. Distance – These settings control how navigational distances are displayed (select from metres, kilometres, feet, yards or miles). Heading – These settings determine how heading bearings are displayed (select from decimal degrees only, degrees & minutes or degrees, minutes and seconds). Position – These settings determine how the sonar/vessel position is displayed. o Universal Transverse Mercator (UTM) – Position is given as a Northing & Easting in a grid zone, using the ‘Distance’ measurement units specified. o Latitude/Longitude – Shows positions as latitudes and longitudes based around the WGS-84 spheroid. Select from signed (±N and ±E) or unsigned (N, S, E & W) decimal degrees, degrees & minutes, or degrees, minutes and seconds. Signal Level – These settings determine if the sonar control values (for Gain and Contrast) should be sonar as a Percentage of the control limits, or in the absolute Decibel levels of the control. Temperature – These settings determine how values such as water temperatures are displayed (select from Celsius or Fahrenheit). Velocity – These settings determine how the speed of the vessel/sonar is displayed (select from metres-per-second, kilometres-per-hour, feet-per-second, miles-perhour or knots). NB: This does not affect the Velocity-of-Sound readings – see ‘Depth & Range’ above. 21 VELOCITY OF SOUND The velocity of sound setting is important for ensuring the accuracy of displayed ranges on the sonar plotters. By default, a general value of 1475 metres-persecond can be used, but environmental factors, such as temperature, salinity of the water and operating depth will alter this value. To help compute this value, Scanline provides a “Velocity of sound Wizard” which can be run by clicking “Setup : VOS Wizard” button on the Ribbon Bar. Note: When you finish the wizard, this new value will be stored by Scanline and used in either the current LogFile (if in ‘Playback’ mode), or new LogFiles (if in ‘Live’ mode). EXPORTING DATA SNAPSHOTTING DISPLAYS When recording or playing back a log file, it may be desirable to capture an image of the current display (or displays), so by default the “F12” shortcut key has been assigned to perform a screen capture, or “snapshot”. Before you use this feature for the first time you may wish to configure its behaviour, by clicking ‘Log : Snapshot Setup’ on the Ribbon Bar, under the system button ‘Export’ menu. From the “Image Format” drop-down list you can select image file type that will be created … BMP – a standard windows uncompressed bitmap image. Excellent quality but large file size. PNG – a ‘portable network graphics’ file that has the same quality as a BMP file, but inbuilt compression giving smaller file sizes. This is the recommended format for quality versus file size. TIFF – a ‘tagged image file format’ image that contains compression while maintaining good quality. JPEG – a ‘joint photographic export group’ image, giving the smallest file size. However, the compression will reduce the quality and clarity of fine details on the image. Click the “Choose Folder…” button to select the destination directory where you want all the images to be saved to. In the “Folder chooser” window, click the “Make Folder” button if you want to create a new folder at the current location. Use the “Name Format” drop down list to choose which naming convention you wish the files to use… None – All snapshot files are written to the filename specified in the “Base Filename” text box. If the file already exists, it will be overwritten. 22 Next Sequential Number – A number will be appended to the base filename, and will be automatically incremented on each snapshot started from that specified in the “Number From” box. Date and Number – The current system date (in the format YYYYMMDD) will be appended to the base filename, followed by an automatically incrementing number. The format of the date is chosen such that when sorted alpha-numerically (in a program such as Windows Explorer), the date codes will sort in the correct ascending order. Date and Time – The current system date and time (in the format YYYYMMDD_HHMMSS) will be appended to the base filename. Should two snapshots be taken in the same second, an increasing number will be appended to the end of the name to ensure no files are overwritten. Note: The snapshot settings will be stored by Scanline, and used when the application is next run (with numbering continuing sequentially). NUMERICAL DATA When you have recorded a log-file, you can use one of the Scanline export converters to output the data in different formats, suitable for use in third party analysis software. Start the “Data Export Wizard” by clicking ‘Log : Export Numerical Data’ or using the System button ‘Export’ menu. When the Wizard starts, click “Next” to proceed to the format selection page. Choose the type of file you want to export to from… o CSV – Comma Separated Values. An ASCII text file that can be easily imported into spreadsheets, or custom software data processing. See the online help files for further details on the CSV format. o XTF – Extended Triton Format. A binary file commonly used for topographic analysis. Click “Next” to proceed after making your selection. Choose the source log-file (if one isn’t already open), and the file to export the data into, by clicking on the appropriate “Change…” buttons. Click “Next” to proceed and if required, adjust the sources of data that will be exported. Click “Next” again to review your choices. If you need to make any changes before starting the export, use the “Back” button to go back through the Wizard – otherwise click “Next” to start the export. The progress bar will show the state of the export. Depending on the size of the source log file and the format you are exporting to, this process may take several minutes. If you wish to abort click the “Cancel” button, otherwise wait for the wizards “Complete” page to be displayed. Click the “Finish” button to close the wizard. 23 Copyright Notice Copyright © 2010 Tritech International Limited & Blueprint Design Engineering Limited, all rights reserved. No part of this publication may be reproduced, stored in a retrieval system, or transmitted in any form or by means (electronic, mechanical, photocopying, recording or otherwise), without the prior written permission of Blueprint Design Engineering Ltd. The information contained herein should be applied to this product only, and no responsibility is taken for the use of this information when applied to other products. Neither Tritech International Ltd. or Blueprint Design Engineering Ltd., or their affiliates shall be liable to the purchaser of this product, or third parties, for losses, costs, damages or expenses incurred by the purchaser or third parties as a result of accident, misuse, abuse, modification of this product or a failure to strictly comply with the operating and maintenance instructions. Trademarks Microsoft® and Windows® are registered trademarks of the Microsoft Corporation. Other product and brand names used within this document are for identification purposes only. Tritech International Limited & Blueprint Design Engineering Limited disclaims any and all rights in those marks. Specifications and information contained in this document is subject to change without notice, and does not represent a commitment on the part of Tritech International Limited or Blueprint Design Engineering Limited. P/N: BP00057.4 UM-125-P00057-04 For Scanline Version 2.1 – August 2010