1
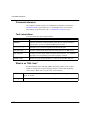
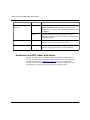
Interpreting the data
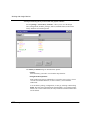
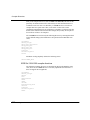
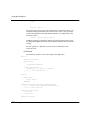
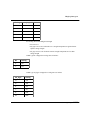
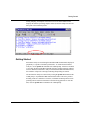
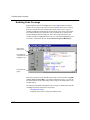
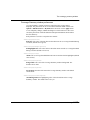
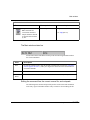
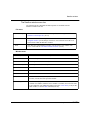
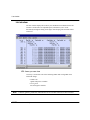
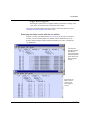
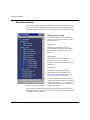
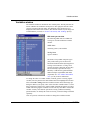
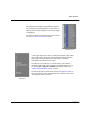
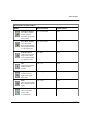
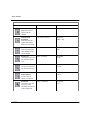
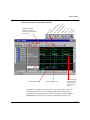
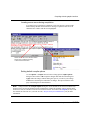
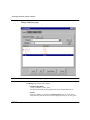
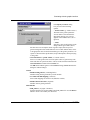
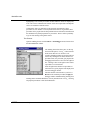
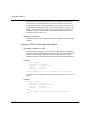
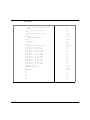
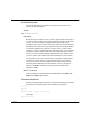
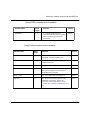
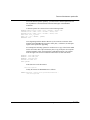
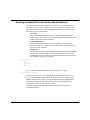
The modules and code lines are ranked in order of the amount of simulation time
used. The two lines that are taking up most of the simulation time –
retrieve.vhd:35 and store.vhd:43 – appear at the top of the list under the VHDL
module that contains them.
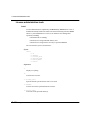
Interpreting the Name Field
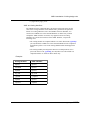
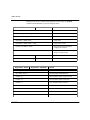
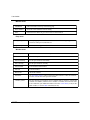
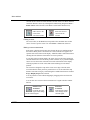
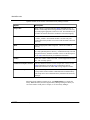
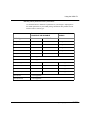
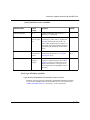
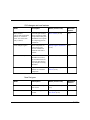
The Name, %Under and %In fields appear in both the ranked and hierarchical
views. These fields are interpreted identically in both views. Typically a Name
consist of a VHDL file and line number pair. Most useful names consist of a line
of VHDL (or Verilog) source code. If you use a PLI or FLI routine, then the name
of the C function that implements that routine can also appear in the name field.
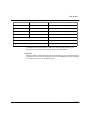
Note: VSIM is a stripped executable file, so that any functions inside of it will be credited to the line of
VHDL code that uses the function.
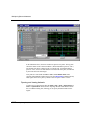
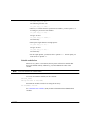
The hierarchical view opens with all levels displayed. You can collapse the
hierarchical view by clicking the boxes next to the high level names.
Note: At this time, the hierarchical view will not remember which levels are opened or closed when data
is reloaded. By default, hierarchical levels are opened every time data is reloaded.
Interpreting the %Under and %In Fields
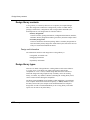
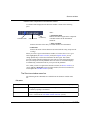
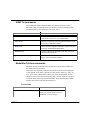
The %In and %Under columns describe the percentage of the total simulation time
spent in and under a function listed in the Name field.
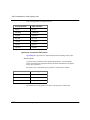
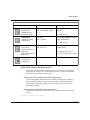
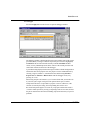
The distinction between %In and %Under is subtle but important. For the
retrieve.vhd:35 entry in the hierarchical and ranked views above, %Under is 45
and %In is 11. "%Under" means that this particular line and all support routines it
needed took 45% of total simulation time. "%In" means that 11% of the total
simulation time was actually spent executing this line of VHDL code.
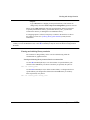
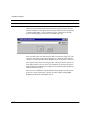
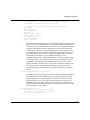
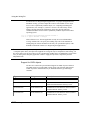
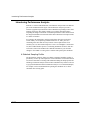
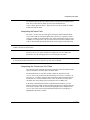
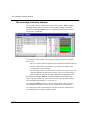
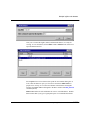
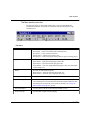
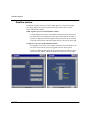
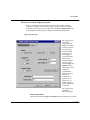
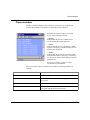
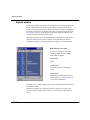
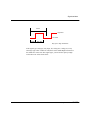
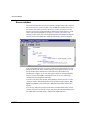
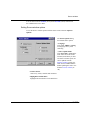
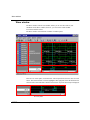
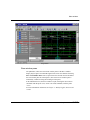
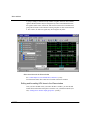
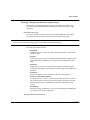
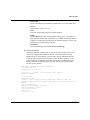
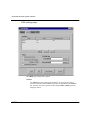
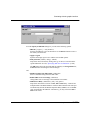
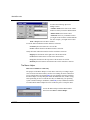
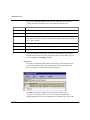
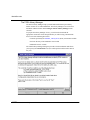
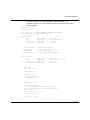
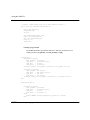
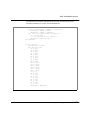
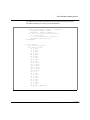
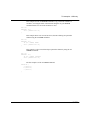
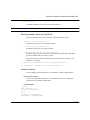
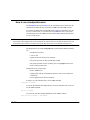
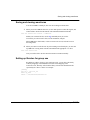
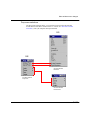
In the body of the Hierarchical Profile or Ranked Profile windows, you can
double-click on any VHDL/Verilog file and line-number pair to bring up that file
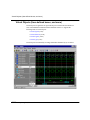
in the Source Window with the selected line highlighted. In the diagram below,
retrieve.vhd:35 was selected in the Heirarchical Profile and, consequently, is
highlighted in the Source window.
ModelSim EE/SE User’s Manual
ModelSim SE Performance Analyzer
7-125