1
GWSDAT User Manual v2.1
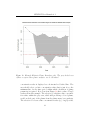
The spatiotemporal solute concentration smoother is a function which
simultaneously estimates both the spatial and time series trend in site
solute concentrations. By smoothing the data in both space and time
it provides a clearer interpretation of site solute concentration dynamics than would otherwise be gleaned from the raw data. However, it
is important to note that it is a smoother function and as such, the
predictions do not necessarily lie on the observed data points. In the
event that a sampled concentration value is significantly larger than the
predictions of the spatiotemporal smoother, the well label is coloured red
and surrounded by braces, e.g. ‘<MW-1>’. This serves as a very useful
method for outlier detection. In addition, the analysis may be skewed
if data are input from monitoring wells with disparate construction or
screened in different aquifer systems.
Another important point to consider is that the quality of the spatiotemporal smoother is directly influenced by quality of the underlying data.
In general, data originating from sites with many evenly spatially distributed wells with a long time history leads to better quality smoother
predictions. The converse of a small number of wells or poor well location network design (e.g. wells located in almost a straight line), or
short monitoring history, will lead to less reliable smoother predictions,
particularly at the edges.
In summary, the ‘spatiotemporal solute concentration smoother’ plot is
provided to help the user visualise the distribution of solutes and as an
aid to risk-based decision-making. However, for the reasons stated above,
the predictions should be interpreted with care and a more detailed evaluation may be necessary to understand observed trends and outliers.
Further methods for assessing the goodness of fit of the spatiotemporal
smoother can be found in Section 7.6. For more details on the spatiotemporal smoothing algorithm, please see Appendix A.2.1.
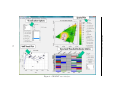
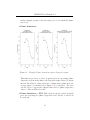
The following sections describe the various spatial plotting options (see Figure 5).
16