1
PGI Profiler User Guide
Version 2014
PGI Compilers and Tools
TABLE OF CONTENTS
Preface.................................................................................................................................................................................. vii
Intended Audience.............................................................................................................................................................vii
Supplementary Documentation......................................................................................................................................... vii
Compatibility and Conformance to Standards.................................................................................................................. vii
Organization...................................................................................................................................................................... viii
Conventions........................................................................................................................................................................ ix
Terminology......................................................................................................................................................................... x
Related Publications............................................................................................................................................................x
System Requirements......................................................................................................................................................... x
Chapter 1. Getting Started....................................................................................................................................................1
1.1. Basic Profiling..............................................................................................................................................................1
1.2. Methods of Collecting Performance Data................................................................................................................... 2
1.2.1. Instrumentation-based Profiling........................................................................................................................... 2
1.2.2. Sample-based Profiling........................................................................................................................................3
1.3. Choose Profile Method................................................................................................................................................4
1.4. Collect Performance Data........................................................................................................................................... 4
1.4.1. Profiling Output File............................................................................................................................................. 4
1.4.2. Using System Environment Variables................................................................................................................. 5
1.4.3. Profiling with Hardware Event Counters..............................................................................................................5
1.5. Profiler Invocation and Initialization.............................................................................................................................5
1.6. Application Tuning....................................................................................................................................................... 5
1.7. Troubleshooting........................................................................................................................................................... 6
1.7.1. Prerequisite: Java Virtual Machine...................................................................................................................... 6
1.7.2. Slow Network....................................................................................................................................................... 6
Chapter 2. Using PGPROF................................................................................................................................................... 7
2.1. PGPROF Tabs and Icons Overview........................................................................................................................... 8
2.2. Profile Navigation.........................................................................................................................................................9
2.3. HotSpot Navigation....................................................................................................................................................13
2.4. Sorting Profile Data................................................................................................................................................... 13
2.5. Compiler Feedback....................................................................................................................................................14
2.5.1. Special Feedback Messages.............................................................................................................................15
2.6. Profiling Parallel Programs........................................................................................................................................15
2.6.1. Profiling Multi-threaded Programs..................................................................................................................... 16
2.6.2. Profiling MPI Programs......................................................................................................................................17
2.7. Scalability Comparison.............................................................................................................................................. 19
2.8. Profiling Resource Utilization with Hardware Event Counters.................................................................................. 20
2.8.1. Profiling with Hardware Event Counters (Linux Only)....................................................................................... 21
2.8.2. Analyzing Event Counter Profiles......................................................................................................................21
2.9. Profiling GPU Programs............................................................................................................................................ 22
2.9.1. Profiling OpenACC Programs............................................................................................................................22
PGI Profiler User Guide
ii
2.9.2. Profiling CUDA Fortran Programs..................................................................................................................... 26
Chapter 3. Compiler Options for Profiling........................................................................................................................29
3.1. -Mprof Syntax............................................................................................................................................................ 29
3.2. Profiling Compilation Options.................................................................................................................................... 29
Chapter 4. Command Line Options...................................................................................................................................31
4.1. Command Line Option Descriptions......................................................................................................................... 31
4.2. Profiler Invocation and Startup..................................................................................................................................32
Chapter 5. Environment Variables.....................................................................................................................................34
5.1. System Environment Variables..................................................................................................................................34
Chapter 6. Data and Precision...........................................................................................................................................35
6.1. Measuring Time......................................................................................................................................................... 35
6.2. Profile Data................................................................................................................................................................35
6.3. Caveats (Precision of Profiling Results)....................................................................................................................36
6.3.1. Accuracy of Performance Data......................................................................................................................... 36
6.3.2. Clock Granularity............................................................................................................................................... 36
6.3.3. Source Code Correlation................................................................................................................................... 37
Chapter 7. PGPROF Reference.......................................................................................................................................... 38
7.1. PGPROF User Interface Overview........................................................................................................................... 38
7.2. PGPROF Menus........................................................................................................................................................39
7.2.1. File Menu........................................................................................................................................................... 39
7.2.2. Edit Menu...........................................................................................................................................................40
7.2.3. View Menu......................................................................................................................................................... 41
7.2.4. Sort Menu.......................................................................................................................................................... 42
7.2.5. Help Menu..........................................................................................................................................................42
7.3. PGPROF Toolbar.......................................................................................................................................................43
7.4. PGPROF Statistics Table.......................................................................................................................................... 44
7.4.1. Performance Data Views................................................................................................................................... 44
7.4.2. Source Code Line Numbering........................................................................................................................... 45
7.5. PGPROF Focus Panel.............................................................................................................................................. 45
7.5.1. Parallelism tab................................................................................................................................................... 46
7.5.2. Histogram tab.....................................................................................................................................................46
7.5.3. Compiler Feedback tab..................................................................................................................................... 46
7.5.4. System Configuration tab.................................................................................................................................. 47
7.5.5. Accelerator Performance tab............................................................................................................................. 47
Chapter 8. Command Line Interface................................................................................................................................. 51
8.1. Command Description Syntax...................................................................................................................................51
8.2. PGPROF Command Summary................................................................................................................................. 51
8.3. Command Reference.................................................................................................................................................52
Chapter 9. pgcollect Reference......................................................................................................................................... 56
9.1. pgcollect Overview.....................................................................................................................................................56
9.2. Invoke pgcollect.........................................................................................................................................................57
9.3. Build for pgcollect......................................................................................................................................................57
9.4. General Options........................................................................................................................................................ 57
PGI Profiler User Guide
iii
9.5. Time-Based Profiling................................................................................................................................................. 57
9.5.1. Time-Based Profiling Options............................................................................................................................ 58
9.6. Event-Based Profiling................................................................................................................................................ 58
9.6.1. Root Privileges Requirement............................................................................................................................. 58
9.6.2. Interrupted Profile Runs.....................................................................................................................................59
9.6.3. Event-based Profiling Options........................................................................................................................... 59
9.6.4. Defining Custom Event Specifications...............................................................................................................60
9.7. OpenACC and CUDA Fortran Profiling.....................................................................................................................60
9.7.1. OpenACC Profiling.............................................................................................................................................61
9.7.2. CUDA Fortran Program Profiling.......................................................................................................................61
9.7.3. Performance Tip................................................................................................................................................ 61
PGI Profiler User Guide
iv
LIST OF FIGURES
Figure 1 PGPROF Overview ................................................................................................................................................ 8
Figure 2 PGPROF Initial View ............................................................................................................................................10
Figure 3 Source Code View ............................................................................................................................................... 11
Figure 4 Assembly Level View ........................................................................................................................................... 12
Figure 5 View Navigation Buttons ...................................................................................................................................... 12
Figure 6 HotSpot Navigation Controls ................................................................................................................................13
Figure 7 Sort Example ........................................................................................................................................................14
Figure 8 Multi-Threaded Program Example ....................................................................................................................... 17
Figure 9 Sample MPI Profile .............................................................................................................................................. 19
Figure 10 Sample Scalability Comparison ......................................................................................................................... 20
Figure 11 Profile with Hardware Event Counter .................................................................................................................22
Figure 12 Accelerator Performance Data for Routine-Level Profiling Example ................................................................. 24
Figure 13 Source-Level Profiling for an Accelerator Region ..............................................................................................25
Figure 14 Source-Level Profiling for an Accelerator Kernel ...............................................................................................26
Figure 15 CUDA Program Profile .......................................................................................................................................28
Figure 16 PGPROF User Interface .................................................................................................................................... 39
Figure 17 PGPROF Toolbar ............................................................................................................................................... 43
Figure 18 Focus Panel Tabs .............................................................................................................................................. 46
Figure 19 Accelerator Performance tab of Focus Panel ....................................................................................................48
Figure 20 CUDA Program Profile .......................................................................................................................................50
PGI Profiler User Guide
v
LIST OF TABLES
Table 1 PGPROF Icon Summary ......................................................................................................................................... 9
Table 2 MPI Profiling Options .............................................................................................................................................18
Table 3 PGPROF Commands ............................................................................................................................................ 51
PGI Profiler User Guide
vi
PREFACE
This guide describes how to use the PGPROF profiler to tune serial and parallel applications built
with The Portland Group (PGI) Fortran, C, and C++ compilers for X86, AMD64 and Intel 64
processor–based systems. It contains information about how to use the PGI profiling tools, as
well as detailed reference information on commands and graphical interfaces.
Intended Audience
This guide is intended for application programmers, scientists and engineers proficient in
programming with the Fortran, C, and/or C++ languages. The PGI tools are available on a variety
of operating systems for the X86, AMD64, and Intel 64 hardware platforms. This guide assumes
familiarity with basic operating system usage.
Supplementary Documentation
See http://www.pgroup.com/docs.htm for the PGPROF documentation updates. Documentation
delivered with PGPROF should be accessible on an installed system by accessing docs/index.htm
in the PGI installation directory. Typically the value of the environment variable PGI is set to
the PGI installation directory. See http://www.pgroup.com/faq/index.htm for frequently asked
PGPROF questions and answers.
Compatibility and Conformance to Standards
The PGI compilers and tools run on a variety of systems. They produce and/or process code
that conforms to the ANSI standards for FORTRAN 77, Fortran 95, C, and C++ and includes
extensions from MIL-STD-1753, VAX/VMS Fortran, IBM/VS Fortran, SGI Fortran, Cray
Fortran, and K&R C. PGF77, PGF90, PGCC ANSI C, and PGCPP support parallelization
extensions based on the OpenMP defacto standard. PGHPF supports data parallel extensions
based on the High Performance Fortran (HPF) defacto standard. The PGI Fortran Reference
Manual describes Fortran statements and extensions as implemented in the PGI Fortran
compilers.
PGPROF permits profiling of serial and parallel (multi-threaded, OpenMP and/or MPI) programs
compiled with PGI compilers.
PGI Profiler User Guide
vii
Preface
For further information, refer to the following:
‣
‣
‣
‣
‣
‣
‣
‣
‣
‣
‣
‣
‣
American National Standard Programming Language FORTRAN, ANSI X3. -1978 (1978).
ISO/IEC 1539:1991, Information technology – Programming Languages – Fortran, Geneva,
1991 (Fortran 90).
ISO/IEC 1539:1997, Information technology – Programming Languages – Fortran, Geneva,
1997 (Fortran 95).
High Performance Fortran Language Specification, Revision 1.0, Rice University, Houston,
Texas (1993), http://www.crpc.rice.edu/HPFF.
High Performance Fortran Language Specification, Revision 2.0, Rice University, Houston,
Texas (1997), http://www.crpc.rice.edu/HPFF.
OpenMP Application Program Interface, Version 2.5, May 2005, http://www.openmp.org.
Programming in VAX Fortran, Version 4.0, Digital Equipment Corporation (September,
1984).
IBM VS Fortran, IBM Corporation, Rev. GC26-4119.
Military Standard, Fortran, DOD Supplement to American National Standard Programming
Language Fortran, ANSI x.3-1978, MIL-STD-1753 (November 9, 1978).
American National Standard Programming Language C, ANSI X3.159-1989.
ISO/IEC 9899:1999, Information technology – Programming Languages – C, Geneva, 1999
(C99).
HPDF Standard (High Performance Debugging Forum) http://www.ptools.org/hpdf/draft/
intro.html
Fortran 2003 Standard
(High Performance Debugging Forum) http://http://www.ptools.org/hpdf/draft/intro.html
Organization
The PGPROF Profiler User’s Guide contains ten sections that describe the PGPROF Profiler, a
tool for analyzing the performance characteristics of C, C++, F77, and F95 programs.
Getting Started
contains information on how to start using the profiler, including a description of the profiling
process, information specific to certain how to profile MPI and OpenMP programs and how to
profile with hardware event counters.
Using PGPROF
describes how to use the PGPROF graphical user interface (GUI).
Compiler Options for Profiling
describes the compiler options available for profiling and how they are interpreted.
Command Line Options
describes the PGPROF command-line options used for profiling and provides sample
invocations and startup commands.
Environment Variables
contains information on environment variables that you can set to control the way profiling is
performed in PGPROF.
PGI Profiler User Guide
viii
Preface
Data and Precision
contains descriptions of the profiling mechanisms that measure time, how statistics are
collected, and the precision of the profiling results.
PGPROF Reference
provides reference information about the PGPROF graphical user interface, including
information about the menus, the toolbars, and the subwindows.
Command Line Interface
provides information about the PGPROF profiler command line interface language, providing
both a summary table and details about the commands. The table includes the command name,
the arguments for the command, and a brief description of the command - all separated by area
of use.
pgcollect Reference
provides reference information about the pgcollect command. It describes the PGPROF
command line options and how to use them to configure and control collection of application
performance data.
Conventions
This guide uses the following conventions:
italic
is used for emphasis.
Constant Width
is used for filenames, directories, arguments, options, examples, and for language statements
in the text, including assembly language statements.
Bold
is used for commands.
[ item1 ]
in general, square brackets indicate optional items. In this case item1 is optional. In the
context of p/t-sets, square brackets are required to specify a p/t-set.
{ item2 | item 3 }
braces indicate that a selection is required. In this case, you must select either item2 or item3.
filename ...
ellipsis indicate a repetition. Zero or more of the preceding item may occur. In this example,
multiple filenames are allowed.
FORTRAN
Fortran language statements are shown in the text of this guide using a reduced fixed point
size.
C/C++
C/C++ language statements are shown in the test of this guide using a reduced fixed point
size.
The PGI compilers and tools are supported on both 32-bit and 64-bit variants of the Linux, OS
X, and Windows operating systems on a variety of x86-compatible processors. There are a wide
variety of releases and distributions of each of these types of operating systems.
PGI Profiler User Guide
ix
Preface
Terminology
If there are terms in this guide with which you are unfamiliar, PGI provides a glossary of terms
which you can access at http://www.pgroup.com/support/definitions.htm
Related Publications
The following documents contain additional information related to the X86 architecture and the
compilers and tools available from The Portland Group.
‣
‣
‣
‣
‣
‣
‣
‣
‣
‣
‣
PGI Fortran Reference Manual describes the FORTRAN 77, Fortran 90/95, and HPF
statements, data types, input/output format specifiers, and additional reference material
related to the use of PGI Fortran compilers.
System V Application Binary Interface Processor Supplement by AT#T UNIX System
Laboratories, Inc. (Prentice Hall, Inc.).
FORTRAN 95 HANDBOOK, Complete ANSI/ISO Reference (The MIT Press, 1997).
Programming in VAX Fortran, Version 4.0, Digital Equipment Corporation (September,
1984).
IBM VS Fortran, IBM Corporation, Rev. GC26-4119.
The C Programming Language by Kernighan and Ritchie (Prentice Hall).
C: A Reference Manual by Samuel P. Harbison and Guy L. Steele Jr. (Prentice Hall, 1987).
The Annotated C++ Reference Manual by Margaret Ellis and Bjarne Stroustrup, AT#T Bell
Laboratories, Inc. (Addison-Wesley Publishing Co., 1990)
PGI User’s Guide, PGI Release Notes, FAQ, Tutorials, http://www.pgroup.com/
MPI-CH: http://www.unix.mcs.anl.gov/MPI/mpich/
OpenMP http://www.openmp.org/
System Requirements
‣
‣
Linux or Windows: For supported releases refer to http://www.pgroup.com/faq/install.htm.
Intel x86 (and compatible), AMD Athlon or AMD64, or Intel 64 or Core2 processor
PGI Profiler User Guide
x
Chapter 1.
GETTING STARTED
This section describes the PGPROF profiler. PGPROF provides a way to visualize and diagnose
the performance of the components of your program. Using tables and graphs, PGPROF
associates execution time with the source code and instructions of your program, allowing you to
see where and how execution time is spent. Through resource utilization data (processor counters)
and compiler feedback information, PGPROF also provides features to help you understand why
certain parts of your program have high execution times.
You can also use the PGPROF profiler to profile parallel programs, including multiprocess
MPI programs, multi-threaded programs such as OpenMP programs, or a combination of
both. PGPROF provides views of the performance data for analysis of MPI communication,
multiprocess and multi-thread load balancing, and scalability.
Using the Common Compiler Feedback Format (CCFF), PGI compilers save information about
how your program was optimized, or why a particular optimization was not made. PGPROF can
extract this information and associate it with source code and other performance data, allowing
you to view all of this information simultaneously.
Each performance profile depends on the resources of the system where it is run. PGPROF
provides a summary of the processor(s) and operating system(s) used by the application during
any given performance experiment.
1.1. Basic Profiling
Performance profiling can be considered a two-stage process.
‣
‣
In the first stage, you collect performance data when your application runs using typical
input.
In the second stage, you analyze the performance data using PGPROF.
There are a variety of ways to collect performance data from your application. For basic
execution-time profiling, we recommend that you use the pgcollect tool, which has several
attributes that make it a good choice:
‣
‣
‣
You don't have to recompile or relink your application.
Data collection overhead is low.
It is simple to use.
PGI Profiler User Guide
1
Getting Started
‣
‣
It supports multi-threaded programs.
It supports shared objects, DLLs, and dynamic libraries.
To profile your application named myprog, you execute the following commands:
$ pgcollect myprog
$ pgprof -exe myprog
The information available to you when you analyze your application's performance can be
significantly enhanced if you compile and link your program using the –Minfo=ccff option.
This option saves information about the compilation of your program, compiler feedback, for use
by PGPROF. For more information on compiler feedback, refer to
For a more complete analysis, our command execution might look similar to this:
$ pgfortran -fast -Minfo=ccff -o myprog myprog.90
$ pgcollect myprog
$ pgprof -exe myprog
1.2. Methods of Collecting Performance Data
PGI provides a number of methods for collecting performance data in addition to the basic
pgcollect method described in the previous section. Some of these have advantages or
capabilities not found in the basic pgcollect method. We divide these methods into two
categories: instrumentation-based profiling and sample-based profiling.
1.2.1. Instrumentation-based Profiling
Instrumentation-based profiling is one way to measure time spent executing the functions or
source lines of your program. The compiler inserts timer calls at key points in your program and
does the bookkeeping necessary to track the execution time and execution counts for routines and
source lines. This method is available on all platforms on which PGI compilers are supported.
Instrumentation-based profiling:
‣
‣
‣
‣
Provides exact call counts.
Provides exact line/block execution counts.
Reports time attributable to only the code in a routine.
Reports time attributable to the code in a routine and all the routines it called.
This method requires that you recompile and relink your program using one of these compiler
options:
‣
Use -Mprof=func for routine-level profiling.
‣
Routine-level profiling can be useful in identifying which portions of code to analyze with
line-level profiling.
Use -Mprof=lines for source line-level profiling.
The overhead of using line-level profiling can be high, so it is more suited for fine-grained
analysis of small pieces of code, rather than for analysis of large, long-running applications.
PGI Profiler User Guide
2
Getting Started
1.2.2. Sample-based Profiling
Sample-based profiling uses statistical methods to determine the execution time and resource
utilization of the routines, source lines, and assembly instructions of the program. Sample-based
profiling is less intrusive than instrumentation-based profiling, so profiling runs take much less
time. Further, in some cases it is not necessary to rebuild the program.
The basic pgcollect method described earlier in Basic Profiling is a time-based sampling method.
pgcollect also supports event-based profiling on linux86-64.
The following sections describe both time-based and event-based sampling. For information
on the differences in how instrumentation- and sample- based profiling measure time, refer to
Measuring Time.
Time-based Sampling
With time-based sampling the program's current instruction address (program counter) is read,
and tracked, at statistically significant intervals. Instruction addresses where a lot of time is spent
during execution are read numerous times. The profiler can map these addresses to source lines
and/or functions in your program, providing an easy way to navigate from the function where the
most time is spent, to the line or to the assembly instruction.
You can build your program using the -Mprof=time compiler option for time-based sampling
of single-threaded Linux programs. When using -Mprof=time, you are required only to re-link
your program. However, unless you compile with -Minfo=ccff, compiler feedback will not be
available.
As described previously in Basic Profiling, we recommend using pgcollect for time-based
profiling.
Event-based Sampling
As well as reading the program's instruction address, event-based sampling uses various methods
to read and track the values of selected hardware counters. These counters track processor events
such as data cache misses and floating point operations. You can use this information to help
determine not just that time is being spent in a particular block of code, but why so much time
is spent there. If there is a bottleneck related to a particular resource, such as the level two data
cache, these counters can help you discover where the bottleneck is occurring.
Event-based sampling requires that a performance tool named OProfile be co-installed with the
PGI software on the Linux system.
OProfile is a performance profiling utility for Linux systems. It runs in the background collecting
information at a low overhead and providing profiles of code based on processor hardware
events. When installed, pgcollect collects this type of performance data for analysis with
PGPROF. For more information on OProfile, refer to http://oprofile.sourceforge.net/.
PGI Profiler User Guide
3
Getting Started
Run your program using the pgcollect command for event-based sampling with OProfile.
MPI profiling is not available with pgcollect profiling.
1.3. Choose Profile Method
Use the following guidelines to decide which performance data collection method to use:
‣
‣
‣
‣
‣
A good starting point for any performance analysis is to use time-based sampling with
pgcollect, as described in Basic Profiling.
If you want exact execution counts, build with —Mprof=func or —Mprof=lines.
If you are profiling an MPI application on Linux, build your application using Mprof=time,<mpi>, where <mpi> is a supported MPI distribution, for example, MPICH.
You can also use an MPI wrapper such as mpicc or mpif90 with —Mprof and one of the
func, lines, or time suboptions. If you use a wrapper from one of the PGI-provided builds of
MPI, you do not need to modify the wrappers or config files to use them with —Mprof.
If your MPI application also uses OpenMP or multiple threads per process and you want to
determine where the majority of time is spent, build with —Mprof=func,<mpi>. Then
build that portion of the program with —Mprof=lines,<mpi> to isolate the performance
problem.
On Linux86-64 platforms on which OProfile is installed, once you have collected a timebased profile using either instrumentation- or sample-based profiling, consider further
examining the resource utilization of those portions of code where the most time is spent.
You do this with event-based sampling, using the pgcollect command with event-based
sampling options as described in pgcollect Reference.
1.4. Collect Performance Data
To obtain the performance data required for PGPROF, you must run your program.
‣
‣
If you use any method other than the pgcollect command to collect data, run your
program normally using a representative input data set.
If you use the pgcollect command to collect data, refer to Basic Profiling for information
on how to execute a profiling run of your program. For specific details on pgcollect, refer
to pgcollect Reference.
1.4.1. Profiling Output File
In all profiling methods, once the program's profiling run is complete, a file named
pgprof.out is written to the program's working directory. This file contains the performance
data used by PGPROF to analyze the program's performance.
PGI Profiler User Guide
4
Getting Started
1.4.2. Using System Environment Variables
You can use system environment variables to change the way profiling is performed. For more
information on these variables, refer to Environment Variables.
1.4.3. Profiling with Hardware Event Counters
You can also profile using hardware event counters. For more specific information on this type of
profiling, refer to Profiling Resource Utilization with Hardware Event Counters.
1.5. Profiler Invocation and Initialization
PGPROF is invoked as follows:
% pgprof.exe [options] [datafile]
If invoked without any options or arguments, PGPROF attempts to open a data file named
pgprof.out, and assumes that application source files are in the current directory. The
program executable name, specified when the program was run, is usually stored in the profile
data file. If all program-related activity occurs in a single directory, PGPROF needs no options.
Probably the most common way to invoke the profiler is this:
% pgprof -exe <execname>
When you use this command to launch PGPROF:
‣
‣
If a pgprof.out file exists in the current directory, PGPROF opens it and uses
<execname> to display the profile data.
If no pgprof.out file exists in the current directory, no profile data is displayed.
However, when the user selects the menu File | Open Profile..., the Text Field
for Executable is set with <execname> in the dialog.
For information on all available profiler options and how they are interpreted, refer to Compiler
Options for Profiling. For information on the command line options for the Profiler, refer to
Command Line Options. For sample launch commands; refer to Profiler Invocation and Startup.
1.6. Application Tuning
So how do you make your program run faster? The process of tuning your program ranges from
simple to complex.
‣
‣
In the simple case, you may be able to easily tune the application and improve performance
dramatically simply by adding a compiler option when you build. The Compiler Feedback
and System Configuration tabs in the PGPROF user interface contain information that can
help identify these situations.
In a slightly more challenging scenario, you may need to restructure part of your code to
allow the compiler to optimize it more effectively. For instance, the Compiler Feedback for a
given loop may provide a hint to remove a call from the loop. If the call can be moved out of
the loop or inlined, the loop might be vectorized by the next compile.
PGI Profiler User Guide
5
Getting Started
‣
More difficult cases involve memory alignment and algorithm restructuring. These issues are
beyond the scope of this manual.
1.7. Troubleshooting
If you are having trouble during invocation or the initialization process, use the following
sections for tips on what might be causing your problem.
1.7.1. Prerequisite: Java Virtual Machine
PGPROF depends on the Java Virtual Machine (JVM) which is part of the Java Runtime
Environment (JRE). PGPROF requires that the JRE be version 1.6 or above.
Linux os OS X
When PGI software is installed on Linux or OS X, the version of Java required by the profiler
is also installed. PGPROF uses this version of Java by default. You can override this behavior
in two ways: set your PATH to include a different version of Java; or, set the PGI_JAVA
environment variable to the full path of the Java executable. The following example uses a bash
command to set PGI_JAVA:
$ export PGI_JAVA=/home/myuser/myjava/bin/java
Windows
If an appropriately-versioned JRE is not already on your system, the PGI software installation
process installs it for you. The PGI command shell and Start menu links are automatically
configured to use the JRE. If you choose to skip the JRE-installation step or want to use a
different version of Java to run the profiler, then set your PATH to include the Java bin directory
or use the PGI_JAVA environment variable to specify the full path to the java executable.
1.7.2. Slow Network
If you are viewing a profile across a slow network connection, or a connection that does not
support remote display of Java GUIs, consider using the PGPROF command-line interface,
described in Command Line Interface.
PGI Profiler User Guide
6
Chapter 2.
USING PGPROF
In Getting Started you learned how to choose a profiling method, build your program, and
execute it to collect profile data. This section provides a more detailed description of how to use
the features of PGPROF, in particular:
‣
‣
‣
‣
‣
‣
‣
‣
Profile navigation
HotSpot navigation
Sorting profile data
Compiler Feedback
Profiling parallel programs, including multi-threaded and MPI programs
Scalability comparison
Profiling resource utilization with hardware event counters
Profiling accelerator programs
PGI Profiler User Guide
7
Using PGPROF
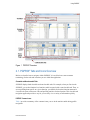
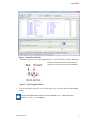
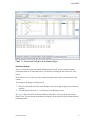
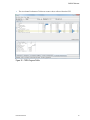
Figure 1 PGPROF Overview
2.1. PGPROF Tabs and Icons Overview
Before we describe how to navigate within PGPROF, it is useful to have some common
terminology for the tabs and icons that you see within the application.
Closeable and Non-closeable Tabs
PGPROF displays both closeable and non-closeable tabs. For example, when you first invoke
PGPROF, you see the function-level statistics table in a panel with a non-closeable tab. Then, to
access profiling data specific to a given function, you double-click on the function name and a
closeable tab opens with source code and profiling statistics for that function. This closeable tab
navigation approach provides a way for you to easily view a variety of information quickly.
PGPROF Common Icons
Table 1 provides a summary of the common icons you see in the statistics table during profile
navigation.
PGI Profiler User Guide
8
Using PGPROF
Table 1 PGPROF Icon Summary
Click this icon...
to...
Display the corresponding assembly code for this line.
Hide the corresponding assembly code for this line.
Close the tab on which it is displayed.
Display the compiler feedback for this line.
Click to expand Focus Panel item.
Click to hide Focus Panel item.
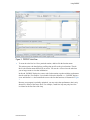
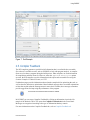
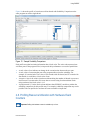
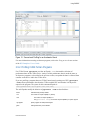
2.2. Profile Navigation
When you first invoke PGPROF, it displays top-level profiling information in a non-closeable
tab, as illustrated in Figure 2.
This tab shows the Statistics Table containing a routine list in the Function column and
performance data associated with each routine in the Seconds column. This list is sorted by the
Seconds value, assuming there is such a value in the profile data.
By default, PGI compilers include enough symbol information in executables to allow PGPROF
to display performance data at the source line level as well as at the routine level. However, if you
compiled with the option –Mnodwarf or –Mprof=func or if you built your program using another
compiler, you may only be able to access the routine-level view.
PGI Profiler User Guide
9
Using PGPROF
Figure 2 PGPROF Initial View
‣
To zoom in to the line level for a particular routine, double-click the function name.
This action opens a tab that displays profiling data specific to the given function. The tab
label is the function name followed by an x icon. You use the x icon to close the tab when
you no longer want to view that information.
In this tab, PGPROF displays the source code for that routine, together with the performance
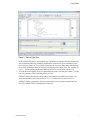
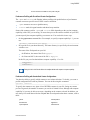
data for each line. For example, if you double-click on the function fft, PGPROF displays
a new tab labelled fft that contains the source code for that function, as illustrated in Figure
3.
Because your program is probably optimized, you may notice that performance data is only
shown for a subset of the source lines. For example, a multi-line loop may only have linelevel data for the first line of the loop.
PGI Profiler User Guide
10
Using PGPROF
Figure 3 Source Code View
‣
In the optimization process, the compiler may significantly reorder the assembly instructions
used to implement the loop, making it impractical to associate any given instruction with a
line in the loop. However, it is possible to associate all of a loop's instructions with that loop,
so all of the performance data for the loop is associated with a single "line". For example, in
Figure 3, the information for the entire do loop at line 516 is associated with line 516.
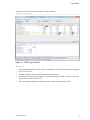
To zoom in to the assembly level for a particular source line, click the plus symbol (+) in the
row of the Statistics Table containing that source line.
PGPROF displays the routine with assembly code interspersed with the source lines with
which that assembly code is associated, as Figure 4 illustrates the for loop at line 510.
PGPROF displays performance data associated with a specific assembly instruction in the
row of the Statistics Table containing that instruction.
PGI Profiler User Guide
11
Using PGPROF
‣
Figure 4 Assembly Level View
To return to a previous view, use the Back button ("<") in the Toolbar, just below the Menus.
The Back and Forward buttons work much like those found in
web browsers, moving to previous and next views, respectively.
Figure 5 View Navigation Buttons
‣
To select and jump to a specific view, use the down arrow on each of the Forward and Back
buttons.
You can have multiple function views open at a time, as illustrated in Figure 4, where tabs for both
functions fft and cfft3 are displayed.
PGI Profiler User Guide
12
Using PGPROF
2.3. HotSpot Navigation
The HotSpot navigation controls in the Toolbar are usually the quickest way to locate a hot
spot. By hot spot we mean a program location that has a high value for some performance
measurement such as Time, Count, and so on.
To locate the hot spot, select the desired performance measurement in the HotSpot drop-down
menu in the Toolbar, then click on the "Hottest" button ("<<+"), illustrated in Figure 6, to select
the highest value for that measurement in the current view.
Figure 6 HotSpot Navigation Controls
In addition to the HotSpot navigation controls on the toolbar, illustrated in Figure 6, you can find
the performance-critical parts of your program using the Histogram tab which shows clickable
bar graphs of the performance data plotted against the address range of the program.
To find a HotSpot using the Histogram, click on the Histogram tab. In the histogram for the
measurement you are interested in, click on the tallest bar. The corresponding row in the Statistics
Table will be selected.
2.4. Sorting Profile Data
PGPROF maintains a consistent sort order for the Statistics Table and the Histogram tab.
Changing the sort order for either of these changes it for both of them. The sort order can be
changed by using the Sort Menu, as described in Sort Menu or by clicking the column header in
the Statistics Table or the row header in the Histogram tab.
The current sort order, such as sorting by the CPU Clock time, is displayed at the bottom
of the Statistics Table. For example, Sort Example shows the message Sort By
CPU_CLK_UNHALTED at the bottom of the Statistics Table and the Histogram.
PGI Profiler User Guide
13
Using PGPROF
Figure 7 Sort Example
2.5. Compiler Feedback
The PGI compilers generate a special kind of information that is saved inside the executable
file so that it is available to tools, such as PGPROF, to help with program analysis. A compiler
discovers a lot about a program during the build process. Most compilers use such information
for compilation, and then discard it. However, when the –Mprof or –Minfo=ccff options
are used, the PGI compilers save this information in the object and executable files using the
Common Compiler Feedback Format, or CCFF.
Feedback messages provide information about what the compiler did in optimizing the code, as
well as describe obstacles to optimization. Most feedback messages have associated explanations
or hints that explain what the message means in more detail. Further, these messages sometimes
provide suggestions for improving the performance of the program.
The information icon indicates that CCFF information is available.
In PGPROF you can access Compiler Feedback by clicking an information icon in the left
margin of the Statistics Table. This opens the Compiler Feedback tab in the Focus Panel.
Messages are categorized according to the type of information that they contain.
For more information on the Compiler Feedback tab, refer to Compiler Feedback tab.
PGI Profiler User Guide
14
Using PGPROF
For more information on the Common Compiler Feedback Format (CCFF), refer to the website:
http://www.pgroup.com/ccff/.
2.5.1. Special Feedback Messages
There are some Compiler Feedback messages that deserve some explanation, specifically,
intensity messages and messages for inlined routines.
Intensity Messages
Computational intensity has been defined as the number of arithmetic operations performed
per memory transfer. (R.W. Hockney and C. R. Jesshope, Parallel Computers 2: Architecture,
Programming and Algorithms 1988) The key idea is this: a high compute intensity value means
that the time spent on data transfer is low compared to the time spent on arithmetic; a low
compute intensity value suggests that memory traffic involving data transfer may dominate the
overall time used by the computer.
The PGI Compiler emphasizes floating point operations, if they are present, to calculate the
compute intensity ratio within a particular loop. If floating point operations are not present, the
PGI compiler uses integer operations.
In some cases it is necessary to build programs using profile-guided optimization by building
with –Mpfi or with –Mpfo, as described in the section Profile-Feedback Optimization using
—Mpfi/Mpfo in the ‘;Optimizing and Parallelizing’ section of the PGI Compiler User’s Guide.
Profile-guided optimization can often determine loop counts and other information needed to
calculate the Compute Intensity for a given statement or loop.
Messages for Inlined Routines
Inlined functions are identified by CCFF messages. These Compiler Feedback messages for
routines that have been inlined are associated with the source line where the routine is called.
Further, these messages are prefixed with the routine and line number, and are indented to show
the level of inlining. Currently there is not a way to view the source code of that inlined instance
of the routine.
2.6. Profiling Parallel Programs
You can use PGPROF to analyze the performance of parallel programs, including multi-threaded
and OpenMP programs, multi-process MPI programs, and programs that are a combination of
the two. PGPROF also provides a Scalability Analysis feature that allows you to compare two
profiling runs, and thus determine how well different parts of your program scale as the number
of threads or processes changes.
PGI Profiler User Guide
15
Using PGPROF
2.6.1. Profiling Multi-threaded Programs
Multi-threaded programs that you can profile using PGPROF include OpenMP programs built
with –mp, auto-parallelized programs built with –Mconcur, and programs that use native thread
libraries such as pthreads.
Collecting Data from Multi-Threaded Programs
Some methods of performance data collection work better with multi-threaded programs than
others. As always, the recommended approach is to use pgcollect, initially with time-based
sampling, optionally followed by event-based sampling. Building with –Minfo=ccff is always
a good idea when using pgcollect.
Alternatively, building with the compiler option –Mprof=lines creates a program that collects
accurate multi-threaded performance profiles.
The –Mprof=func option works with multi-threaded programs. Routines that contain one or
more parallel regions appear in a profile as if they were run on a single thread because the data
collection is at the entry and exit of the routine when the parallelism is not active.
The –Mprof=time and –pg options generate programs that only collect data on a single thread.
To collect data for programs built using –Mprof, run your program normally. Upon successful
termination, a pgprof.out file is created.
Analyzing the Performance of Multi-Threaded Programs
The display of profile data for a multi-threaded program differs from that of a single-threaded
program in a couple of ways:
‣
‣
In the Statistics Table, the data shown is the maximum value for any single thread in the
process.
The Parallelism tab shows the thread-specific performance data for the row selected in the
Statistics Table, whether the Statistics Table is in the routine-level, line-level, or assemblylevel view. Click the arrow icon to the left of the P to expand the view to show all threads.
PGI Profiler User Guide
16
Using PGPROF
Figure 8 Multi-Threaded Program Example
You can use thread-specific data to determine how well-balanced the application is. Ideally, each
thread would spend exactly the same amount of time on a given part of the program. If there
are large disparities in the time spent by the various threads, this points to a load imbalance,
where some threads are left idle while other threads are working. In this case, the resources of the
system are not being used with 100% efficiency.
For example, in the program illustrated in Figure 8, we can see that thread 0 spent 30% of the
time in the routine, while thread 3 spent only 13% of the time there. Performance might improve
if the work could be distributed more evenly.
2.6.2. Profiling MPI Programs
To create and view a performance profile of your MPI application, you must first build an
instrumented version of the application using the -Mprof option. Some MPI distributions are
supported directly in the compilers via -Mprof sub-options. In these cases, the MPI profiling
options cannot be used alone. They must be used in concert with another sub-option of -Mprof,
such as lines, func, or time. Other MPI distributions require compilation with MPI compiler
wrappers. The following table summarizes the options required for profiling with different MPI
distributions.
PGI Profiler User Guide
17
Using PGPROF
Table 2 MPI Profiling Options
This MPI distribution...
Requires compiling and linking with these options ...
MPICH1
Deprecated. -Mprof
MPICH2
MPICH v3
Deprecated. -Mprof
=mpich1,{func|lines|time}
=mpich2,{func|lines|time}
-Mprof =mpich,{func|lines|time}
MVAPICH1
Deprecated. -Mprof
=mvapich1,{func|lines|time}
MVAPICH2
Use MVAPICH2 compiler wrappers:
-profile={profcc|proffer}
-Mprof ={func|lines|time}
MS-MPI
-Mprof =msmpi,{func|lines}
Open MPI
Use Open MPI compiler wrappers:
-Mprof ={func|lines|time}
SGI MPI
-Mprof =sgimpi,{func|lines|time}
For more details about how to compile an MPI program for profiling, refer to the ‘Using MPI’
section of the PGI Compiler User‘s Guide.
Once you have built an instrumented version of your MPI application, running it as you normally
would produces the MPI profile data.
On successful program termination, one profile data file is created for each MPI process.
The master profile data file is named pgprof.out. The other files have names similar to
pgprof.out, but they are numbered.
PGPROF MPI profiling collects counts of the number of messages and bytes sent and received.
You can then use this information to analyze a program's message passing behavior.
Analyzing the Performance of MPI Programs
Figure 9 illustrates an MPI profile.
This sample shows an example MPI profile with maximum times and counts in the Statistics
Table, and per-process measurements in the Parallelism tab. The Parallelism tab for MPI
programs is used in the same way that it is used for multi-threaded programs, as described in
Analyzing the Performance of Multi-Threaded Programs.
You can use the send and receive counts for messages, the byte counts to identify potential
communication bottlenecks, and the process-specific data to find load imbalances.
PGI Profiler User Guide
18
Using PGPROF
Figure 9 Sample MPI Profile
2.7. Scalability Comparison
PGPROF provides a Scalability Comparison feature that measures changes in the program's
performance between multiple executions of an application. Generally this information is used
to measure the performance of the program when it is run with a varying number of processes or
threads. To use scalability comparison, first generate two or more profiles for a given application.
For best results, compare profiles from the same application using the same input data with a
different number of threads or processes.
Scalability is computed using the maximum time spent in each thread/process. Depending on
how you profiled your program, this measurement may be displayed in the Statistics Table in a
column with one of these heading titles:
Time
CPU_CLK_UNHALTED
if you used -Mprof=func, -Mprof=lines, or -Mprof=time
if you used pgcollect
Important Profiling multi-process MPI programs with the pgcollect command is not supported.
The number of processes and/or threads used in each execution can be different. After generating
two or more profiles, load one of them into PGPROF. Select the Scalability Comparison item
under the File menu, described in File Menu, or click the Scalability Analysis button in the
Toolbar. Choose a second profile for comparison. A new instance of PGPROF appears, with a
column named Scale in the Statistics Table.
PGI Profiler User Guide
19
Using PGPROF
Figure 10 shows the profile of a run that used four threads with Scalability Comparison to the
same program run with a single thread.
Figure 10 Sample Scalability Comparison
Each profile entry that has timing information has a Scale value. The scale value measures how
well these parts of the program scaled, or improved their performance as a result of parallelism.
‣
‣
‣
‣
A scale value of zero indicates no change in the execution time between the two runs.
A scale value of one means that part of the program achieved perfect scalability. For
example, if a routine had a Time value of 100 seconds with one thread, and 25 seconds with
four threads, it would have a Scale value of one.
A negative value is the relative slowdown without taking the number of threads or processes
into account. If a routine takes 20% more time to execute using four threads than it took
using one thread, the Scale value is -0.2.
A question mark ('?') in the Scale column indicates that PGPROF is unable to perform the
scalability comparison for this profile entry. For example, scalability comparison may not be
possible if the two profiles do not share the same executable or input data.
2.8. Profiling Resource Utilization with Hardware Event
Counters
Important Profiling with hardware counters is available only on Linux.
PGI Profiler User Guide
20
Using PGPROF
Modern x86 and x64 processors provide low-level hardware counters that can be used to track
the resource utilization of a program. Tracking this information can be useful in tuning program
performance because it allows you to go beyond just knowing where the program is spending the
most time and examine why it is spending time there.
Linux systems do not provide hardware counter support by default. These systems must have the
OProfile package installed.
2.8.1. Profiling with Hardware Event Counters (Linux Only)
PGPROF supports hardware counter data collection through the execution of the program under
the control of the pgcollect command.
Collection of profile data using pgcollect may be done on any linux86 or linux86-64 system
where Oprofile is installed. OProfile is included as an install-time option with most Linux
distributions; it may also be downloaded from http://oprofile.sourceforge.net/.
No special build options are required to enable event-based profiling with pgcollect, although
building with the option –Minfo=ccff may provide useful compiler feedback.
For specific information on using PGPROF with hardware event counters, refer to pgcollect
Reference.
2.8.2. Analyzing Event Counter Profiles
If you executed your program under the control of pgcollect, then you can profile up to four
event counters and view them in PGPROF. For brief descriptions of what each hardware counter
measures, use
pgcollect --list-events
For more detailed information, see the processor vendor’s documentation.
Figure 11 shows a profile of four event counters: CPU_CLK_UNHALTED,
DATA_CACHE_MISSES, DATA_CACHE_REFILLS _FROM_L2, DATA_CACHE_REFILLS
_FROM_SYSTEM.
In this example, the routine using the most time is also getting many cache misses. Investigating
the memory access behavior in that routine, and looking at the Compiler Feedback, may offer
some clues for improving its performance.
PGI Profiler User Guide
21
Using PGPROF
Figure 11 Profile with Hardware Event Counter
2.9. Profiling GPU Programs
You can use PGPROF to analyze the performance of GPU programs. GPU performance data
is included in the profile, pgprof.out, when a GPU program is run using pgcollect. PGI
provides two methods of programming GPUs: OpenACC, which uses programs and directives to
tell the compiler how to generate GPU code, and CUDA Fortran, which is used to program the
GPU more directly.
The next section describes how to use pgcollect with OpenACC programs, and the subsequent
section describes using it with CUDA Fortran programs.
2.9.1. Profiling OpenACC Programs
For OpenACC the profiling procedure is the same as for host-only programs, except that
PGPROF provides an Accelerator Performance tab that allows you to review profiling
information provided by the accelerator. You do not need to build or run with any special options
to collect accelerator performance data.
PGI Profiler User Guide
22
Using PGPROF
Here is an example of the commands you might use in a simple accelerator profiling session:
$ pgfortran -ta=nvidia -o myprog myprog.f90
$ pgcollect -time ./myprog
$ pgprof -exe ./myprog
You can build your program to print GPU performance data to standard output by using the time
suboption to the target accelerator option -ta. For example, you can use this command:
$
pgfortran -ta=nvidia,time myprog.f90
The time suboption has no effect on pgcollect or PGPROF profiling.
For more information on using PGI compilers to build programs for accelerators and on related
terminology, refer to Section 7, ‘Using an Accelerator,’ of the PGI Compiler User‘s Guide.
For more information on pgcollect, refer to pgcollect Reference.
Analyzing Accelerator Performance Data
This section provides a basic description of how to examine accelerator performance data using
PGPROF, including function-level analysis, region-level analysis and kernel-level analysis. A
comprehensive guide to tuning accelerator programs is beyond the scope of this manual.
Function-Level Analysis
When you invoke PGPROF on the profile of an accelerator program, the initial view displays a
function list showing host times in the Seconds column and accelerator times in the Accelerator
Region Time column and Accelerator Kernel Time column. Figure 12 illustrates a routine-level
view with the routine jacobi selected and the Accelerator Performance tab chosen in the Focus
Panel.
One of the first things to look at in tuning an accelerator program is whether the Data Transfer
Time is large relative to the Accelerator Kernels Time. In the example illustrated in Figure 12,
the Accelerator Kernels Time of 4.134521 seconds is much larger than the Data Transfer Time of
0.132602 seconds, so we have efficient use of the accelerator.
If data transfer time is taking a significant portion of the total time, you would want to
investigate if transfer time could be reduced using data regions, described in Section 7, Using an
Accelerator, of the PGI User’s Guide.
If data transfer time is relatively high and you have already considered data regions, you might
want to examine the Compiler Feedback. You must compile with–Minfo=ccff to be able to do
this. Check if the compiler is generating copyin/copyout operations that use slices of your
arrays. If so, you may want to override the compiler to copyin/copyout the entire array.
PGI Profiler User Guide
23
Using PGPROF
Figure 12 Accelerator Performance Data for Routine-Level Profiling Example
For more information on compiler feedback, refer to Compiler Feedback.
Region-Level Analysis
As with host-only profiles, you can drill down to the source code level by double-clicking on
the routine name in the Function column. For an accelerator program, the display centers on the
accelerator region directive for the longest-executing region. The Accelerator Performance tab
shows a breakdown of timing statistics for the region and the accelerator kernels it contains.
A routine can contain more than one accelerator region.
Figure 13 shows an example of a source-level view with an accelerator region directive selected.
In this illustration, if you want to see the Seconds column, you could scroll to the right in the Statistics
Table.
PGI Profiler User Guide
24
Using PGPROF
Figure 13 Source-Level Profiling for an Accelerator Region
Kernel-Level Analysis
Since an accelerator region can contain multiple distinct kernels, you may want to examine
performance data for an individual kernel. You do this by selecting the first source line of the
kernel.
In the source-level view, the first line of a kernel has data listed in the Accelerator Kernel Time
column.
To navigate to the longest-executing kernel:
1. Select Accelerator Kernel Time in the HotSpot selector in the upper-right portion of the user
interface.
2. Click the double left arrow (<<+) located next to the HotSpot selector.
In Figure 14 the selected line in the main Statistics Table has a value only in the Accelerator
Kernel Time. The Accelerator Performance tab displays all the details for the Accelerator Kernel
performance data.
PGI Profiler User Guide
25
Using PGPROF
Figure 14 Source-Level Profiling for an Accelerator Kernel
For more information on tuning accelerator programs, refer to the Using an Accelerator section
of the PGI Compiler‘s User‘s Guide.
2.9.2. Profiling CUDA Fortran Programs
For CUDA Fortran, pgcollect provides an filepath –cuda that enables collection of
performance data on the CUDA device. Analysis of this performance data is much the same as
for OpenAcc programs, as described in the previous section, except that the data is collected from
counters on the device and in the CUDA driver.
If you are profiling a program that uses CUDA Fortran kernels running on a GPU, pgcollect
-cuda collects performance data from the CUDA-enabled GPU and includes it in the profile
output for the program. The syntax for this command filepath is:
-cuda[=gmem|branch|cfg:<cfgpath>|cc13|cc20|list]
The sub-filepaths modify the behavior of pgcollect -cuda as described here:
branch
Collect branching and warp statistics.
cc13
Use counters for compute capability 1.3. [default]
ccnm
Use counters for compute capability n.m.
Use pgcollect -help to see which compute capabilities your system supports.
cfg:<cfgpath>
Specify <cfgpath> as CUDA profile config file.
gmem
Collect global memory access statistics.
PGI Profiler User Guide
26
Using PGPROF
list
List cuda event names available for use in profile config file.
Performance Profiling with Pre-defined Counter Configurations
The –gmem and –branch sub-filepaths initiate profiling with predefined sets of performance
counters to measure specific areas of GPU resource utilization.
‣
‣
–gmem measures accesses to global memory.
–branch tracks divergent branches and thread warp statistics.
Some of the counters used for –gmem and –branch differ depending on the version (compute
capability) of the GPU you are using. To ensure that you use the counters available on your GPU,
you must specify the compute capability you want to use. You can do this in two ways:
‣
‣
On the pgcollect command line. For example, to specify compute capability 1.3, you can
use:
pgcollect -cuda=branch,cc13 myprog
In a special file in your home directory. The home directory is specified by the environment
variable HOME.
The name of the file depends on your OS:
‣
‣
On Windows, the name of the file is mypgirc.
On Linux and OS X, the name of the file is .mypgirc.
In this file you put a line that indicates compute capability 1.3 or 2.0:
COMPUTECAP=13
or
COMPUTECAP=20
Placing this line in this file also affects the compiler defaults with respect to compute capability.
Performance Profiling with User-defined Counter Configurations
You have the ability to specify which counters to use in data collection. To do this, you create a
profile configuration file with any filename. You can do this using this command:
pgcollect -cuda=list
To specify the counters to use, place a list of NVIDIA counters in your file, listing one counter
per line. In general, the number of counters you can list is limited to four, although with compute
capability 2.0 you may be able to use more, depending on the counters selected. In addition, you
may always list certain data collection filepaths that do not depend on hardware counters, such as
these:
gridsize
stasmemperblock
threadblocksize
regperthread
dynsmemperblock
memtransfersize
PGI Profiler User Guide
27
Using PGPROF
To get a full list of the counters available, use this command:
pgcollect -cuda=list
Figure 15 CUDA Program Profile
In Figure 15:
‣
‣
‣
‣
The columns labeled Max CUDA GPU Secs and Max CUDA CPU Secs show times captured
by the CUDA driver.
The Max Seconds column contains timings for host-only code.
Pseudo-function names [Data_Transfer_To_Host] and [Data_Transfer_To_Device] show the
transfer times to and from the GPU.
The Accelerator Performance Tab shows counter values collected from the GPU.
PGI Profiler User Guide
28
Chapter 3.
COMPILER OPTIONS FOR PROFILING
This section describes the PGI compiler options that are used to control profiling and how they
are interpreted.
3.1. -Mprof Syntax
You can use the following compiler options to control data collection. Most of these options are
related to —Mprof, for which the syntax is:
-Mprof{=option[,option, ...]}
You use —Mprof to set performance profiling options. Use of these options causes the resulting
executable to create a performance profile that can be viewed and analyzed with the PGPROF
performance profiler.
If you use pgcollect to gather performance data, you do not need to compile or link with —Mprof.
3.2. Profiling Compilation Options
In the descriptions that follow, instrumentation-based profiling implies compiler-generated source
instrumentation. profiling implies the use of instrumented wrappers for MPI library routines.
–Minfo=ccff
Generate compiler feedback information and store it in object and executable files for later
access by performance tools. Use –Minfo=ccff when collecting performance data using
pgcollect. All –Mprof options except –Mprof=dwarf imply –Minfo=ccff.
–Mprof=dwarf
Generate a subset of DWARF symbol information adequate for viewing source line
information with most performance profilers.
In the PGI compilers –Mprof=dwarf is on by default. You can use the –Mnodwarf option
to disable it. Source-level information is not available if you profile a program built with–
Mnodwarf.
PGI Profiler User Guide
29
Compiler Options for Profiling
–Mprof=func
Perform routine-level instrumentation-based profiling.
–Mprof=lines
Perform instrumentation-based line-level profiling.
–Mprof=mpich
Use the default MPICH v3 libraries on Linux and OS X for profiling. Implies –
Mmpi=mpich.
–Mprof=mpich1
This option has been deprecated. It continues to direct the compiler to perform MPI profiling
for MPICH1, but only if you set the environment variable MPIDIR to the root of an MPICH1
installation. Implies –Mmpi=mpich1.
–Mprof=mpich2
This option has been deprecated. It continues to direct the compiler to perform MPI profiling
for MPICH2, but only if you set the environment variable MPIDIR to the root of an MPICH2
installation. Implies –Mmpi=mpich2.
–Mprof=msmpi
Perform profiling for Microsoft MSMPI on Windows systems. Implies option –
Mmpi=msmpi.
–Mprof=mvapich1
This option has been deprecated. It continues to direct the compiler to perform MPI profiling
for MVAPICH1, but only if you set the environment variable MPIDIR to the root of an
MVAPICH1 installation. Implies –Mmpi=mvapich1.
–Mprof=sgimpi
Perform profiling for SGI MPI. Implies option –Mmpi=sgimpi.
This option is required even if you compile and link using the SGI MPI mpicc or mpif90 compiler
wrappers.
–Mprof=time
[Linux] Generate a profile using time–based assembly-level statistical sampling. This is
equivalent to using the –pg option, except the profile is saved in a file named pgprof.out
rather than in gmon.out.
–pg
[Linux] Enable gprof-style (sample-based) profiling. Running an executable compiled with
this option produces a gmon.out profile file which contains routine, line, and assembly-level
profiling data.
PGI Profiler User Guide
30
Chapter 4.
COMMAND LINE OPTIONS
This section describes the PGPROF command-line options and how they are interpreted. As
we stated in Getting Started, PGPROF can interpret command-line options when present on the
command line.
4.1. Command Line Option Descriptions
The following list describes the options and how PGPROF interprets them.
datafile
A single datafile name may be specified on the command line. For profiled MPI applications,
the specified datafile should be that of the initial MPI process. Access to the profile data for all
MPI processes is available in that case, and data may be filtered to allow inspection of the data
from a subset of the processes.
The default datafile name is pgprof.out. If no datafile argument is used, PGPROF
attempts to use pgprof.out in the current directory.
–exe <filename>
Set the executable to filename. The default filename is a.out.
–feedbackonly (Linux only)
Only browse source code and Compiler Feedback information. Do not load any performance
data from profile runs.
–help
Prints a list of available command-line arguments.
–I <srcpath>
Specify the source file search path.
PGPROF always looks for a program source file in the current directory first. If it does not
find the source file in the current directory, it consults the search path specified in srcpath.
The srcpath argument is a string containing one or more directories separated by a path
separator. The path separator is platform dependent: on Linux and Mac OS, it is a colon ( : ),
and on Windows it is a semicolon ( ; ). Directories in the path are then searched in order
from left-to-right. When a directory with a filename that matches a source file is found, that
directory is used.
PGI Profiler User Guide
31
Command Line Options
Here is an example for Linux and Mac OS. In this example, the profiler first looks for source
files in the current directory, then in the ../src directory, followed by the STEPS directory.
–I ../src:STEPS
Here is the same example for Windows:
–I ../;src;STEPS
For more information, see the Open Profile... item in the description of the File Menu.
–jarg, arg1[, arg2,..., argn]
Pass specified arguments, separated by commas, to java. For example, the following option
passes the argument -Xmx256m to java.
-jarg, -Xmx256m
This option is provided for troubleshooting purposes and is expected to rarely be used. If
you do use this option, be certain not to forget the comma between the option and the first
argument.
–scale ‘file(s)’
Compare scalability of datafile with one or more files. A list of files may be specified by
enclosing the list within quotes and separating each filename with a space. For example:
–scale one.out two.out
This example compares the profiles one.out and two.out with datafile (or pgprof.out by
default). If only one file is specified quotes are not required.
For sample based profiles (e.g., gmon.out) specified with this option, PGPROF assumes
that all profile data was generated by the same executable. For information on how to
specify multiple executables in a sample-based scalability comparison, see the Scalability
Comparison... item in the description of the File Menu.
–text
Use the PGPROF Command-Line Interface (CLI).
–V
Print version information.
4.2. Profiler Invocation and Startup
Let’s take a look at some common ways to invoke the profiler, describing what each launch
command means.
% pgprof
‣
If a pgprof.out file exists in the current directory, PGPROF tries to open it.
‣
‣
If an executable name can be determined from the pgprof.out file, the GUI is
populated according to profile data, if valid.
If an executable name can NOT be determined from the pgprof.out file, then a
dialog is opened on top of the main window with the following message:
Can't determine executable for file 'pgprof.out'
‣
Please use 'File | Open Profile...' menu to specify one
If no pgprof.out file exists in the current directory, the GUI is not populated and no
dialog appears.
PGI Profiler User Guide
32
Command Line Options
% pgprof -exe <execname>
‣
‣
If a pgprof.out file exists in the current directory, PGPROF tries to open it and use
<execname>. Further, the GUI is populated according to profile data, if valid.
If no pgprof.out file exists in the current directory, the GUI is not populated and no
dialog appears. Further, when the user selects the menu File | Open Profile...,
then the Text Field for Executable is set with <execname> in the dialog.
% pgprof -exe <execname> <profilename>
PGPROF tries to open the profile <profilename> using <execname> for the executable name.
Further, the GUI is populated according to profile data, if valid.
PGI Profiler User Guide
33
Chapter 5.
ENVIRONMENT VARIABLES
This section describes the system environment variables that you can set to change the way
profiling is performed.
5.1. System Environment Variables
As you learned in Basic Profiling, a profiled program collects call counts and/or time data. When
the program terminates, a profile data file is generated. Depending on the profiling method used,
this data file is called pgprof.out or gmon.out.
You can set the following system environment variables to change the way profiling is
performed:
‣
‣
‣
‣
GMON_ARCS – Use this environment variable to set the maximum number of arcs (caller/
callee pairs).
The default is 4096. This option only applies to gprof style profiling, that is, programs
compiled with the –pg option.
PGPROF_DEPTH – Use this environment variable to change the maximum routine call
depth for PGPROF profiled programs.
The default is 4096 and is applied to programs compiled with any of the following options: –
Mprof=func, –Mprof=lines, or –Mprof=time.
PGPROF_EVENTS – Use this environment variable to specify hardware (event) counters
from which to collect data.
This variable is applied to programs executed with the pgcollect command using one
of the event-based profiling options. The use of hardware (event) counters is discussed in
further detail in Profiling Resource Utilization with Hardware Event Counters.
PGPROF_NAME – Use this environment variable to change the name of the output file
intended for PGPROF.
The default is pgprof.out. This option is only applied to programs compiled with any of
the following options: –Mprof=[func | lines | MPI | time]. If a program is
compiled with the –pg option, then the output file is always called gmon.out.
PGI Profiler User Guide
34
Chapter 6.
DATA AND PRECISION
This section contains descriptions of the profiling mechanism that measures time, how statistics
are collected, and the precision of the profiling results.
6.1. Measuring Time
The sample-based profiling mechanism collects total CPU time for programs that are compiled
with the options –pg and –Mprof=time, or executed with pgcollect –time, as described
in Sample-based Profiling. The profiling mechanism collects cycle counts for programs run
under the control of pgcollect or executed with pgcollect event-based sampling. PGPROF
automatically converts CPU cycles into CPU time.
Programs compiled for instrumentation-based profiling with –Mprof=lines or –
Mprof=func employ a virtual timer for measuring the elapsed time of each running process/
thread. This data collection method employs a single timer that starts at zero (0) and is
incremented at a fixed rate while the active program is being profiled. For multiprocessor
programs, there is a timer on each processor, and the profiler’s summary data (minimum,
maximum and per processor) is based on each processor’s time executing in a function. How the
timer is incremented and at what frequency depends on the target machine. The timer is read from
within the data collection functions and is used to accumulate COST and TIME values for each
line, function, and the total execution time. The line level data is based on source lines; however,
in some cases, there may be multiple statements on a line and the profiler shows data for each
statement.
For instrumentation-based profiling, information provided for longer running functions are more accurate
than for functions that only execute for a short time relative to the overhead of the individual timer calls.
Refer to Caveats (Precision of Profiling Results) for more information about profiler accuracy.
6.2. Profile Data
The following statistics are collected and may be displayed by the PGPROF profiler.
BYTES
For MPI profiles only. This is the number of message bytes sent and received.
PGI Profiler User Guide
35
Data and Precision
BYTES RECEIVED
For MPI profiles only. This is the number of bytes received in a data transfer.
BYTES SENT
For MPI profiles only. This is the number of bytes sent.
CALLS
The number of times a function is called.
COST
The sum of the differences between the timer value entering and exiting a function. This
includes time spent on behalf of the current function in all children whether profiled or not.
PGPROF can provide cost information when you compile your program with either the –
Mprof=cost or the –Mprof=lines option. For more information, refer to Basic Profiling.
COUNT
The number of times a line or function is executed.
LINE NUMBER
For line mode, this is the line number for that line. For function mode, this is the line number
of the first line of the function. PGPROF sometimes generates multiple statements for a single
source line; thus multiple profiling entries might appear for a single source line. To distinguish
them, PGPROF uses the notation: lineNo.statementNo
MESSAGES
For MPI profiles only. This is the number of messages sent and received by the function or
line.
RECEIVES
For MPI profiles only. This is the number of messages received by the function or line.
SENDS
For MPI profiles only. This is the number of messages sent by the function or line.
TIME
The time spent only within the function or executing the line. The TIME does not include time
spent in functions called from this function or line. TIME may be displayed in seconds or as a
percent of the total time.
6.3. Caveats (Precision of Profiling Results)
6.3.1. Accuracy of Performance Data
The collection of performance data always introduces some overhead, or intrusion, that can affect
the behavior of the application being monitored. How this overhead affects the accuracy of the
performance data depends on the performance monitoring method chosen, system software and
hardware attributes, the load on the system during data collection, and the idiosyncrasies of the
profiled application. Although the PGPROF implementation attempts to minimize intrusion and
maximize accuracy, it would be unwise to assume the data is beyond question.
6.3.2. Clock Granularity
Many target machines provide a clock resolution of only 20 to 100 ticks per second. Under
these circumstances, a routine must consume at least a few seconds of CPU time to generate
meaningful line level times.
PGI Profiler User Guide
36
Data and Precision
6.3.3. Source Code Correlation
At higher optimization levels, and especially with highly vectorized code, significant code
reorganization may occur within functions. The PGPROF profiler allows line profiling at any
optimization level. In some cases, the correlation between source and data may at times appear
inconsistent. Compiling at a lower optimization level or examining the assembly language source
may help you interpret the data in these cases.
PGI Profiler User Guide
37
Chapter 7.
PGPROF REFERENCE
This section provides a reference guide to the features of the PGPROF performance profiler.
For information about how to invoke PGPROF, refer to Profiler Invocation and Initialization.
For information about using the PGPROF text-based command-line interface, refer to Compiler
Options for Profiling.
For information about how to choose a profiling method, build your program, and execute it to
collect profile data, refer to Getting Started.
7.1. PGPROF User Interface Overview
On startup, PGPROF attempts to load the profile datafile specified on the command line or
the default, pgprof.out. If no file is found, a file chooser dialog box is displayed. Choose a
profile datafile from the list or select Cancel.
When a profile datafile is opened, PGPROF populates the user interface, as illustrated and
labeled in Figure 16.
Menu Bar
Contains these menus: File, Edit, View, Sort, and Help.
Toolbar
Provides navigation shortcuts and controls for frequently performed operations.
Statistics Table
Displays profile summary information for each profile entry. Information can be displayed at
up to three levels - routine, line, or assembly - depending on the type of profile data collected,
how the program was built, and whether the PGPROF source file search path has been set to
include the program source directories. The initial view is the routine level view.
Focus Panel
Consists of tabbed panes labeled Parallelism, Histogram, Compiler Feedback, System
Configuration, and Accelerator Performance.
Information Bar
Displays the profile summary information such as the name of the executable, the time and
date of the profile run, execution time, number of processes, if more than one, and the datafile
name.
PGI Profiler User Guide
38
PGPROF Reference
The following sections describe each of these components in more detail.
Figure 16 PGPROF User Interface
7.2. PGPROF Menus
PGPROF had the following menus: File, Edit, View, Sort, and Help. This section describes each
menu in detail. Keyboard shortcuts, when available, are listed next to menu items.
7.2.1. File Menu
The File menu contains the following items:
‣
‣
New Window (control N) – Select this option to create a copy of the current profiler window
on your screen.
Open Profile... – Select this option to begin analyzing a different profile. When you see the
dialog box, fill in or browse to the information requested about the profile data file (default
pgprof.out), the executable file, and the location of the source files. When you click OK,
a new profile session is started using the information specified in the dialog box.
If the Source Path is the only parameter that is changed from current session parameters, then
the current session uses the new Source Path to search for sources.
PGI Profiler User Guide
39
PGPROF Reference
‣
‣
Set Source Directory... – Select this option to add or remove a directory in the source file
search path.
Scalability Comparison... – Select this option to open another profile for scalability
comparison. As you did for the Open Profile... option described above, provide
information about the profile data file, the executable file, and the location of the source files.
Notice that the new profile contains a Scale column in its Statistics table.
Another method to open profiles for scalability comparison is by using the –scale command-line
option explained in Profiler Invocation and Initialization.
‣
‣
‣
‣
For more information on scalability, refer to Scalability Comparison.
Print... – Select this option to make a hard copy of the current profile data. The profiler
processes data from the Statistics table and sends the output to a printer. A printer dialog box
appears.
You can select a printer using the Name drop-down list under Print Service. Alternately,
click the Print To File check box to send the output to a file. Other print options may
be available; however, they are dependent on the specific printer and the Java Runtime
Environment (JRE).
Print to File... – Option, output is not sent to printer, but is formatted as an editable text file.
After selecting this menu item, a Save File dialog box appears. Enter or choose an output file
in the dialog box. Click Cancel to abort the print operation.
Close... – Select this option to close the current profiling session. This option is enabled only
when more than one profile is open.
Exit... – Select this option to end the profiling session and exit the profiler.
7.2.2. Edit Menu
Use the Edit menu to launch a text search in the Statistics Table, and to restore, revert or save
user preference settings. This menu contains the following items:
‣
‣
‣
‣
‣
‣
Search Forward... – Displays a dialog box that prompts for the text to be located. Once the
text is entered and the OK button selected, PGPROF searches forward to the next occurrence
of the text in the function list, source code, or assembly code displayed in the Statistics
Table. Matching text is displayed in red. A search can also be invoked using the Find text
box on the main toolbar.
Search Backward... – Displays a dialog box that prompts for the text to be located. Once
the text is entered and the OK button selected, PGPROF searches backward to the previous
occurrence of the text in the function list, source code, or assembly code displayed in the
Statistics Table. Matching text is displayed in red.
Search Again – Use this option to repeat the last search.
Clear Search – Use this option to clear the search and turn the color of all matching text
back to black.
Restore Default Settings... – Use this option to restore the configuration of the user
interface to the original default settings.
Revert to Saved Settings... – Use this option to restore the configuration of the GUI to the
previously saved settings.For more information, refer to the See the Save Settings on Exit
option.
PGI Profiler User Guide
40
PGPROF Reference
‣
Save Settings on Exit... – When this check box is selected, PGPROF saves the current GUI
configuration settings on exit. These settings include the size of the main window, position
of the horizontal dividers, the bar chart colors, the selected font, the tool tips preference, and
the options selected in the View menu. When PGPROF is started again, these saved settings
are used. To prevent saving these settings on exit, clear this check box. On Linux and Mac
OS, settings are saved on a per-user basis. On Windows, settings are saved on a per-user persystem basis.
You can also use the Find: box in the toolbar to invoke the PGPROF search facility.
7.2.3. View Menu
Use the View menu to change the configuration of the PGPROF user interface. This menu
contains the following items:
‣
‣
Select Columns... - Invokes a dialog box that allows you to select which columns of the
Statistics Table are to be displayed, and how to display the data in the columns.
The choices for how to display the data are: Value, Percent, Bar, or All, though not all of
these choices are available for all columns.
Select Graph Colors... – This menu option opens a color chooser dialog box and a bar chart
preview panel.
The preview panel contains the bar chart bar colors, and the three bar chart attributes.
‣
‣
‣
‣
‣
‣
The bar chart bars can be 'gradient filled', meaning that the color of the bar gradually
transitions from the Bar Start Color to the Bar End Color. To have solid colored bars
without gradient fill, which is the default, simply set both of these colors to the same
color.
The Filled Text Color attribute represents the text color inside the filled portion of the
bar chart.
The Unfilled Text Color attribute represents the text color outside the filled portion of
the bar chart.
The Background Color attribute represents the color of the unfilled portion of the bar
chart.
The Reset button allows you to reset the selected bar chart or attribute to its previously
selected color.
The OK button accepts your changes and closes the dialog box.
Closing the dialog box is the same as choosing OK.
To modify a bar chart or attribute color:
1. Click the radio button.
2. Choose a color from the Swatches, HSB, or RGB pane.
3. Click the OK button to accept the changes and close the dialog box.
PGI Profiler User Guide
41
PGPROF Reference
‣
PGPROF saves color selections for subsequent runs unless the Save Settings on Exit box is
unchecked, as described later in this section.
Font... – This menu option opens the Fonts dialog box.
You can change the font and/or font size using this dialog's drop-down lists. As you change
the font, you can preview the changes in the Sample Text pane.
To change the font you must click the OK button.
Tip Click Cancel or close the dialog box to abort any changes.
‣
Show Tool Tips - Select this check box to enable tool tips. Tool tips are small temporary
messages that pop-up when the mouse pointer is positioned over a component, such as a
button, in the user interface. Tool tips provide a summary or hint about what a particular
component does. Clear this check box to turn tool tips off.
7.2.4. Sort Menu
Use the Sort menu to change the metric used to sort profile entries. The current sort order is
displayed at the bottom of the Statistics Table and the Histogram tab.
The default sorting metric is time for function-level profiling and source line number for linelevel profiling. The sort is performed in descending order, from highest to lowest value, except
when sorting by filename, function name, or line number. Filename, function name, and line
number sorting is performed in ascending order; lowest to highest value. Sorting is explained in
greater detail in Sorting Profile Data.
7.2.5. Help Menu
The Help menu contains the following items:
‣
PGPROF Help... – This option invokes PGPROF’s integrated help utility. The help utility
includes an HTML version of this manual. To find a help topic, use one of the tabs in the left
panel:
‣
‣
‣
The book tab presents a table of contents.
The index tab presents an index of commands.
The magnifying glass tab presents a search engine.
Each help page, displayed on the right, may contain hyperlinks, denoted in underlined blue,
to terms referenced elsewhere in the help engine.
Use the arrow buttons to navigate between visited pages.
‣
Use the printer buttons to print the current help page.
About PGPROF... – This option opens a dialog box with version and contact information for
PGPROF.
PGI Profiler User Guide
42
PGPROF Reference
7.3. PGPROF Toolbar
As illustrated in the following figure, the PGPROF toolbar provides navigation shortcuts and
controls for frequently performed operations.
Figure 17 PGPROF Toolbar
The toolbar includes these buttons and controls:
‣
‣
‣
‣
Open Profile button – clicking this button is the same as selecting File | Open Profile... from
the menu bar.
Print button – clicking this button is the same as selecting File | Print... from the menu bar.
Scalability Analysis button – clicking this button is the same as selecting File | Scalability
Comparison... from the menu bar.
Forward and Back buttons – click these buttons to navigate forward and back to previous
and subsequent views, respectively.
Use the down-arrow to display the full list of views, and to select a view to jump to. These
lists use a notation to describe the profile views as follows:
profile_data_file@source_file@routine@line@address
The address field is omitted for line-level views, and both the line and address fields are
omitted for routine-level views. For example, the following item in a list would describe
a view that uses profile data from pgprof.out, and is displaying line 370 in the routine
named solver in source file main.f.
‣
[email protected]@solver@370
Search controls – use these to locate information. The controls include:
‣
‣
A text box labeled Find:. Entering a search string here and hitting Enter is the same as
using the dialog box invoked from the Edit | Search Forward... menu bar item.
‣ Two buttons labeled with down and up arrows, respectively. These buttons provide
Search Next and Search Previous operations, similar to Edit | Search Again. Search Next
searches for the next occurrence of the last search string below the current location, and
Search Previous searches for the next occurrence above.
HotSpot Navigation controls – use these to navigate to the most significant measurements
taken in the profiling run. The controls include:
PGI Profiler User Guide
43
PGPROF Reference
‣
‣
A drop-down menu labeled HotSpot:, which you use to select the specific performance
measurement of interest.
Three navigation buttons, containing Forward and Back icons with associated plus (+)
and minus (-) signs.
When the profile is first displayed, the Statistics Table selects the row for the routine
with the highest measured Time as though you had clicked on that row. To navigate to
the row with the next-highest Time, you click on the button labeled with the Forward
icon and the minus (-) sign, denoting the next Time HotSpot lower than the current
one. Once you have navigated to this second HotSpot, the Back HotSpot buttons are
activated, allowing you to navigate to the hottest HotSpot using the "<<" button, or to
the next higher Time, using the "<" button.
You can use the HotSpot drop-down menu to change the measurement used to identify
the HotSpots. The default selection in the HotSpot menu is Time, assuming that Time is
one of the available measurements. You can click on the down-arrow in the drop-down
menu to select any other metric listed in the menu, then click the "Hottest" button to
navigate to the row showing the routine with the highest measured value for that metric.
7.4. PGPROF Statistics Table
This section describes the PGPROF Statistics Table. The Statistics Table displays an overview of
the performance data, and correlates it with the associated source code or assembly instructions.
This is where you should start when analyzing performance data with PGPROF.
The Statistics Table displays information at up to three levels, depending on the type of profile
data collected, how the program was built, and whether the PGPROF source file search path has
been set to include the program source directories.
7.4.1. Performance Data Views
The Statistics Table allows you to zoom in and out on the components of your program by
providing several views: the routine-level view, the line-level view, and the assembly-level view.
‣
‣
‣
The initial view when you invoke PGPROF is the routine-level view.
To navigate to the line level from the routine level, double- click on the Statistics Table row
corresponding to the function of interest. If the program was built so thatit does not contain
line location information, then this action results in an assembly-level display.
To navigate to the assembly code level from the line level, click the assembly code icon, the
plus (+) symbol, on the Statistics Table row that corresponds to the source line of interest.
You can use the View | Select Columns... menu option to select the data shown in the Statistics Table.
Routine-level view
The routine-level view shows a list of the functions or subprograms in your application, with the
performance data for that routine in the same row of the table. In addition, if there is any compiler
PGI Profiler User Guide
44
PGPROF Reference
feedback information for the routine, a round button containing the letter 'i' is at the far left of
the row. Clicking that button populates the Compiler Feedback tab with the compiler feedback
relating to that routine.
Line-level View
You access the line-level view of a routine by clicking that routine's row in the routine-level
view. PGPROF opens a new tab showing the line-level information for the routine. The tab label
is the routine name and the tab contains an x which allows you to close the tab when you are
done viewing the source code. The Statistics Table in the new tab shows the source code for the
selected function, with performance data and Compiler Feedback buttons as with the routine-level
view.
Assembly-level View
You access the assembly-level view of a source line or routine by clicking the assembly code
icon, the plus (+) symbol, on the Statistics Table row that corresponds to the row of interest in the
line-level view. The table changes to show the assembly code, interspersed with the source lines
that were compiled to generate the code.
7.4.2. Source Code Line Numbering
In the optimization process, the compiler may reorder the assembly instructions such that they
can no longer be associated with a single line. Therefore, for optimized code, a source line may
actually be a code block consisting of multiple source lines. This occurrence is common, and
expected, and should not interfere with the tuning process when using PGPROF.
PGPROF sometimes shows multiple rows in the Statistics Table for a single source line. The line
numbers for such lines are shown in the Statistics Table using the notation
line.statement
There are several situations where this line numbering can occur:
‣
‣
‣
When there is more than one statement in a source line, as in a C/C++ program where one
line contains multiple statements, separated by semicolons (;).
When the compiler generates multiple alternative implementations of a loop. The compiler
may create alternate versions to handle differences in the data and how it is stored in
memory.
When there is a complicated or conditional loop setup.
For these cases, it is generally safe to sum the times and counts of all the lines. However, take
care, particularly with call counts, not to double-count measurements.
7.5. PGPROF Focus Panel
The Focus Panel consists of a number of tabs that allow you to select more detailed views of your
profile data.
PGI Profiler User Guide
45
PGPROF Reference
Figure 18 Focus Panel Tabs
7.5.1. Parallelism tab
This tab displays a table with detailed profile information organized by processes and threads.
Profile information for the entire application is labeled 'Profile' while information for the
currently-selected routine is labeled 'Routine.' Information is listed by process. Each process can
be expanded to reveal profiling information by each thread in that process. To expand a process
into its threads, click on the '>' icon on the left of the 'P' icon.
7.5.2. Histogram tab
This tab displays a histogram of one or more profiled data items.
‣
‣
‣
‣
‣
‣
Each bar graph corresponds to one of the performance measurements.
Each vertical bar corresponds to a profile entry, that is, performance data associated with a
program location.
The bars are sorted in the order specified in the Sort menu, described in Sort Menu, and the
current sorting metric is labeled in the lower-right hand corner of the table itself.
Clicking on a bar displays information for the corresponding profile item in the Statistics
Table.
Double-clicking on a bar drills down into the profile for the portion of the program
corresponding to the bar.
Selected bars are highlighted in yellow.
7.5.3. Compiler Feedback tab
This tab displays information provided by the compiler regarding the characteristics of a selected
piece of the program, including optimization and parallelization information, obstacles to
optimization or parallelization, and hints about how to improve the performance of that portion of
the code. Such information is available at the line level and the routine level.
If Compiler Feedback information is available, round, blue buttons, containing a lower-case 'i',
are displayed on the left side of the Statistics Table. To access the information, click on one of
these info buttons.
The information is separated into categories of information about these items:
‣
‣
A source line
Routines referenced inside another routine
‣
‣
Variables referenced inside a routine
How a file was compiled
Each category is represented by a wide bar that functions like a button. Clicking the bar expands
the display to show the information in that category. If no information is available in a given
category, that category is not listed.
This information is only available if the program was compiled and also linked using either
the –Mprof or the –Minfo=ccff option. In some cases it is necessary to build programs
PGI Profiler User Guide
46
PGPROF Reference
using profile-guided optimization by building with –Mpfi or–Mpfo, as described in the section
Profile-Feedback Optimization using –Mpfi/Mpfo in the Optimizing and Parallelizing section of
the PGI Compiler User‘s Guide. Profile-guided optimization can often determine loop counts and
other information needed to calculate the Compute Intensity for a given statement or loop.
7.5.4. System Configuration tab
This tab displays System and Accelerator tabs containing information about the system on which
the profile run was executed.
System Tab
Can include information such as process(es), process manufacturer, processor model, processor,
the program’s OS target, cores per socket, total cores, processor frequency, CUDA driver version,
and NVRM version.
The Program’s OS Target is the operating system platform that the executable was built for. Although the
processor may be a 64-bit processor, the executable may target a 32-bit platform.
Tip If you need further explanations for any of these items, refer to vendor processor documentation.
Accelerator tab
Contains information about the GPU(s) that are on the system on which the profile was run.
If there is no GPU on this system, the Accelerator tab is empty.
For each GPU, also known as a device, the Accelerator tab can include information such as the
device name, device revision number, global memory set, number of multiprocessors, number
of cores, concurrent copy and execution, total constant memory, total shared memory per
block, registers per block, warp size, maximum threads per block, maximum block dimensions,
maximum grid dimensions, maximum memory pitch, texture alignment, and clock rate.
Tip If you need further explanations for any of these items, refer to vendor GPU documentation.
7.5.5. Accelerator Performance tab
This tab displays profiling information collected by pgcollect on for programs built using
CUDA Fortran or the PGI Accelerator Model. For more information on pgcollect, refer to
pgcollect Reference.
OpenACC Profiles
The profiling information is relative either to an Accelerator Region or to an Accelerator Kernel.
PGI Profiler User Guide
47
PGPROF Reference
Accelerator Region
An accelerator region is a region of code that has been executed on the accelerator device. An
accelerator region might transfer data between the host and the accelerator device. Further, an
accelerator region can be split into several accelerator kernels.
Accelerator Kernel
An accelerator kernel is a compute intensive, highly parallel portion of code executed on an
accelerator device. Each compiler-generated kernel is code executed by a block of threads
mapped into a grid of blocks.
Figure 19 illustrates one possible display for the Accelerator Performance tab, one that is relative
to the Accelerator Kernel:
Figure 19 Accelerator Performance tab of Focus Panel
PGPROF displays two Accelerator events in the Statistic table:
‣
‣
Accelerator Region Time – the time, in seconds, spent in the Accelerator region
Accelerator Kernel Time – the time, in seconds, spent in the Accelerator kernel.
When a user selects a line for which one of these events is non-zero, the table in the Accelerator
Performance tab contains details about that event. The information displayed depends on the
selection.
If a user selects a line in which both events are non-zero, then the Accelerator Performance tab
displays only Accelerator Initialization Time, Accelerator Region Time, and Accelerator Kernel
Time.
Accelerator Region Timing Information
Time is reported in seconds. When you select a non-zero Accelerator Region Timing item,
you see the following information in the Accelerator Performance tab:
‣
‣
‣
‣
‣
Accelerator Initialization Time – time spent in accelerator initialization for the selected
region.
Accelerator Kernel Time– time spent in compute kernel(s) for the selected region.
Data Transfer Time– time spent in data transfer between host and accelerator memory.
Accelerator Execution Count– execution count for the selected region.
Maximum time spent in accelerator region (w/o init)– the maximum time spent in a single
execution of selected region.
PGI Profiler User Guide
48
PGPROF Reference
‣
‣
Minimum time spent in accelerator region (w/o init)– the minimum time spent in a single
execution of selected region.
Average time spent in accelerator region (w/o init)– the average time spent per execution
of selected region.
The table does not contain values that are not relevant, such as zero values or values that cannot be
computed. For example, in a routine-level profile, a routine can execute multiple accelerator regions.
In this instance, only time spent in Initialization, in the Region, and in the Kernel can be accurately
computed so other values are not displayed in the Accelerator Performance tab.
Accelerator Kernel Timing Information
Time is reported in seconds. When you select a non-zero Accelerator Kernel Timing item, you
see the following information in the Accelerator Performance tab:
‣
‣
‣
‣
‣
‣
Kernel Execution Count – execution count for the selected kernel.
Grid Size – the size, in 1D [X] or 2D [XxY], of the grid used to execute blocks of threads
for the selected kernel.
Block Size – the size, in 1D [X], 2D [XxY] or 3D [XxYxZ], of the thread blocks for the
selected kernel.
Maximum time spent in accelerator kernel – the maximum time spent in a single
execution of selected kernel.
Minimum time spent in accelerator kernel – the minimum time spent in a single execution
of selected kernel.
Average time spent in accelerator kernel – the average time spent per execution of
selected kernel.
When there are multiple invocations of the same kernel in which the grid-size and/or block-size
changes, the size information displayed in the Accelerator Performance tab is expressed as a range.
For example, if the same kernel could be executed with a 2D-block of size [2,64] and a 2D-block of size
[4,32], then the size displayed in Accelerator Performance tab is the range: [2-4, 32-64].
CUDA Fortran Profiles
Profiles generated by pgcollect for CUDA Fortran programs capture data from GPU
performance counters. The specific counters available for a given GPU depend on the GPU’s
compute capability.
In Figure 20:
‣
‣
‣
The columns labeled Max CUDA GPU Secs and Max CUDA CPU Secs show times captured
by the CUDA driver.
The Max Seconds column contains timings for host-only code.
Pseudo-function names [Data_Transfer_To_Host] and [Data_Transfer_To_Device] show the
transfer times to and from the GPU.
PGI Profiler User Guide
49
PGPROF Reference
‣
The Accelerator Performance Tab shows counter values collected from the GPU.
Figure 20 CUDA Program Profile
PGI Profiler User Guide
50
Chapter 8.
COMMAND LINE INTERFACE
The command line interface (CLI) for non-GUI versions of the PGPROF profiler is a simple
command language. This command language is available in the profiler through the –text
option. The language is composed of commands and arguments separated by white space. A
pgprof> prompt is issued unless input is being redirected.
This section describes PGPROF’s command line interface, providing both a summary and then
more details about the commands.
8.1. Command Description Syntax
This section describes the profiler’s command set.
‣
‣
‣
‣
‣
Command names are printed in bold and may be abbreviated as indicated.
Arguments enclosed by brackets (‘[’‘]’) are optional.
Separating two or more arguments by ‘|’ indicates that any one is acceptable.
Argument names in italics are chosen to indicate what kind of argument is expected.
Argument names that are not in italics are keywords and should be entered as they appear.
8.2. PGPROF Command Summary
The Table 3 summarizes the commands for use in the CLI version of PGPROF, providing the
applicable arguments and a brief description of the use of each command. The section that
follows the table provides more details about each command.
Table 3 PGPROF Commands
Name
Arguments
Usage
a[sm]
routine [[>] filename]
Display the instruction and line level data together with the
source and assembly for the specified routine.
c[cff]
file[@function] [line_numb
Display compiler feedback for the specified file, function, or
source line
d[isplay]
[display options] | all | none
Specify display information.
PGI Profiler User Guide
51
Command Line Interface
Name
Arguments
Usage
he[lp]
[command]
Provide brief command synopsis.
h[istory]
[size]
Display the history list, which stores previous commands in a
manner similar to that available with csh or dbx.
l[ines]
function [[>] filename]
Display the line level data together with the source for the
specified function.
lo[ad]
[datafile]
Load a new dataset. With no arguments reloads the current
dataset.
m[erge]
datafile
Merge the profile data from the named datafile into the
current loaded dataset.
pro[cess]
processor_num
For multi-process profiles, specify the processor number of
the data to display.
p[rint]
[[>] filename]
Display the currently selected function data.
q[uit]
Exit the profiler.
sel[ect]
calls | timecall | time | cost | cover | all [[>]
cutoff]
Display data for a selected subset of the functions.
so[rt]
[by] [max | avg | min | proc | thread] calls |
Function level data is displayed as a sorted list.
cover | timecall | time | cost | name | msgs |
msgs_sent | msgs_recv | bytes | bytes_sent |
bytes_recv | visits | file]
src[dir]
directory
Set the source file search path.
s[tat]
[no]min|[no]avg|[no]max|[no]proc|[no]thread|
[no]all]
Set which process fields to display (or not to display when
using the arguments beginning with “no”)
th[read]
thread_num
Specify a thread for a multi-threaded process profile.
t[imes]
raw | pct
Specify whether time-related values should be displayed as
raw numbers or as percentages. The default is pct.
! (history)
! | num | -num | string
Repeat recent commands
8.3. Command Reference
This section provides more details about the commands in the previous Command Summary
Table.
asm
a[sm] routine [[>] filename]
Display the instruction and line level data together with the source and assembly for the specified
routine. If the filename argument is present, the output is placed in the named file. The '>' means
redirect output, and is optional. This command is only available on platforms that support
assembly-level profiling.
ccff
c[cff] file[@function] [line_number]
PGI Profiler User Guide
52
Command Line Interface
Display compiler feedback for the specified file, function, or source line. PGI compilers can
produce information in the Common Compiler Feedback Format (CCFF) that provides details
about the compiler's analysis and optimization of your program. Often this information can
illuminate ways in which to further optimize a program.
The CCFF information is produced by default when using the –Mprof' compiler option, but
if you are profiling with the pgcollect command, you must build your program with the '–
Minfo=ccff' compiler option to produce this information.
display
d[isplay] [display options] | all | none
Specify display information. This includes information on minimum values, maximum values,
average values, or per processor/thread data. Below is a list of possible display options:
[no]calls [no]cover [no]time [no]timecall [no]cost [no]proc [no]thread [no]msgs [no]msgs_sent
[no]msgs_recv [no]bytes [no]bytes_sent [no]name [no]file [no]line [no]lineno [no]visits [no]scale
[no]stmtno
help
he[lp] [command]
Provide brief command synopsis. If the command argument is present, only information for that
command is displayed. The character "?" may be used as an alias for help.
history
h[istory] [size]
Display the history list, which stores previous commands in a manner similar to that available
with csh or dbx. The optional size argument specifies the number of lines to store in the history
list.
lines
l[ines] function [[>] filename]
Display the line level data together with the source for the specified function. If the filename
argument is present, the output is placed in the named file. The '>' means redirect output, and is
optional.
load
lo[ad] [datafile]
Load a new dataset. With no arguments reloads the current dataset. A single argument is
interpreted as a new data file. With two arguments, the first is interpreted as the program and the
second as the data file.
merge
m[erge] datafile
PGI Profiler User Guide
53
Command Line Interface
Merge the profile data from the named datafile into the current loaded dataset. The datafile must
be in standard pgprof.out format, and must have been generated by the same executable file as the
original dataset (no datafiles are modified.)
process
pro[cess] processor_num
For multi-process profiles, specify the processor number of the data to display.
print
p[rint] [[>] filename]
Display the currently selected function data. If the filename argument is present, the output is
placed in the named file. The '>' means redirect output, and is optional.
quit
q[uit]
Exit the profiler.
select
sel[ect] calls | timecall | time | cost | cover | all [[>] cutoff]
Display data for a selected subset of the functions. This command is used to set the selection key
and establish a cutoff percentage or value. The cutoff value must be a positive integer, and for
time related fields is interpreted as a percentage. The '>' means greater than, and is optional. The
default is all.
sort
so[rt] [by] [max | avg | min | proc | thread] calls | cover | timecall | time |
cost | name | msgs | msgs_sent | msgs_recv | bytes | bytes_sent | bytes_recv |
visits | file]
Function level data is displayed as a sorted list. This command establishes the basis for sorting.
The default is max time.
srcdir
src[dir] directory
Set the source file search path.
stat
s[tat] [no]min|[no]avg|[no]max|[no]proc|[no]thread|[no]all]
Set which process fields to display (or not to display when using the arguments beginning with
‘no’).
PGI Profiler User Guide
54
Command Line Interface
thread
th[read] thread_num
Specify a thread for a multi-threaded process profile.
times
t[imes] raw | pct
Specify whether time-related values should be displayed as raw numbers or as percentages. The
default is pct.
! (history)
!!
Repeat previous command.
! num
Repeat previous command numbered num in the history list.
!-num
Repeat the num-th previous command numbered num in the history list.
! string
Repeat most recent command starting with string from the history list.
PGI Profiler User Guide
55
Chapter 9.
PGCOLLECT REFERENCE
The pgcollect command is a development tool used to collect performance data for analysis using
the pgprof performance profiler. This section describes how to use pgcollect.
9.1. pgcollect Overview
pgcollect runs the specified program with the supplied arguments. While the program runs,
pgcollect gathers performance statistics. When the program exits, the data that is gathered is
written to a file. You can then use this file in the PGPROF performance profiler to analyze and
tune the performance of the program.
The pgcollect command supports two distinct methods of performance data collection:
Time-based sampling
Creates a time-based profile that correlates execution time to code, showing the amount of
time spent in each routine, each source line, and each assembly instruction in the program. For
more information on time-based profiling, refer to Time-Based Profiling.
Event-based sampling
Supported only on linux86-64 systems, creates an event-based profile that correlates hardware
events to program source code. In this method, pgcollect uses hardware event counters
supported by the processor to gather resource utilization data, such as cache misses.
This method requires co-installation of the open source performance tool OProfile.
For more information on event-based profiles, refer to Event-Based Profiling.
Both forms of the pgcollect command gather performance data that can be correlated to
individual threads, including OpenMP threads, as well as to shared objects, dynamic libraries, and
DLLs.
For current availability of pgcollect and pgcollect features on a given platform, refer to the
PGI Release Notes.
PGI Profiler User Guide
56
pgcollect Reference
9.2. Invoke pgcollect
The command you use to invoke pgcollect depends on the type of profile you wish to create.
Use the following command to invoke pgcollect for time-based sampling:
pgcollect [-time] program [program_args]
Use the following command to invoke pgcollect for event-based sampling available on
Linux86-64:
pgcollect [<event_options>] program_or_script [program_or_script_args]
program or program_or_script are either the filename of the program to be profiled, or
the name of a script that invokes the program. When applicable, you can provide arguments for
the specified program or script: program_args or program_or_script_args.
The following sections describe the pgcollect command-line options in more detail.
9.3. Build for pgcollect
If your program was built with PGI compilers, you do not need to use any special options to
use pgcollect. However, if your programs are built using the -Minfo=ccff option, then
PGPROF can correlate compiler feedback and optimization hints with the source code and
performance data.
If you built your program using a non-PGI compiler, consider building with debugging
information so you can view source-level performance data. Be aware, however, that building
with debugging information may change the performance of your program.
9.4. General Options
This section describes options that apply to all forms of the pgcollect command. For options
specific to controlling time-based or event-based profiling, refer to Time-Based Profiling and
Event-Based Profiling respectively.
-V
Display the version of pgcollect being run.
-help
Show pgcollect usage and switches.
9.5. Time-Based Profiling
Time-based profiling runs the program using time-based sampling. This form of pgcollect
uses operating system facilities for sampling the program counter at 10-millisecond intervals.
PGI Profiler User Guide
57
pgcollect Reference
9.5.1. Time-Based Profiling Options
-time
Provide time-based sampling only. The sampling interval is 10 milliseconds. This option is the
default.
When using pgcollect for time-based sampling, you can have multiple instances of
pgcollect running simultaneously, but doing so is not recommended, since this will probably
skew your performance results.
9.6. Event-Based Profiling
You can use the pgcollect command on linux86-64 to drive an OProfile session. Event-based
profiling provides several predefined data collection options that gather data from commonly
used counters.
For event-based sampling, the only required argument is the program_or_script, which is
either the filename of the program to be profiled, or the name of a script that invokes the program.
Using a script can be useful if you want to produce an aggregated profile of several invocations
of the program using different data sets. In this situation, use the -exe option, which allows the
data collection phase to determine which program is being profiled.
When applicable, you can provide arguments for the specified program or script.
Since OProfile provides only system-wide profiling, when you invoke pgcollect it provides a
locking mechanism that allows only one invocation to be active at a time.
The pgcollect locking mechanism is external to OProfile and does not prevent other profile runs from
invoking opcontrol through other mechanisms.
9.6.1. Root Privileges Requirement
When using pgcollect for event-based profiling, you control the OProfile kernel driver and
the sample collection daemon via the OProfile command opcontrol. This control requires
root privileges for management operations. Thus, invocations to opcontrol performed by
pgcollect are executed via the sudo command.
When using pgcollect, you control the OProfile kernel driver and the sample collection
daemon via the OProfile command opcontrol. This control requires root privileges for
management operations. Thus, invocations to opcontrol, which are performed when pgcollect
is used, are executed via the sudo command.
One technique that requires minimal updates to the /etc/sudoers files is to assume that all
users in a group are allowed to execute opcontrol with group privileges. For example, you
could make the following changes to /etc/sudoers to permit all members of the group 'sw' to
run opcontrol with root privileges.
# User alias specification
User_Alias SW = %sw
...
SW ALL=NOPASSWD: /usr/bin/opcontrol
PGI Profiler User Guide
58
pgcollect Reference
9.6.2. Interrupted Profile Runs
pgcollect shuts down the OProfile daemon when interrupted. However, if the script is
terminated with SIGKILL, you must execute the following:
pgcollect -shutdown
Executing this command is important because if the OProfile daemon is left running, disk space
on the root file system eventually is exhausted.
9.6.3. Event-based Profiling Options
-check-events
Do not execute a profiling run, just check the event settings specified on the command line.
-exe <exename>
Specify the program to be profiled. You only need to use -exe when the program argument is
a script that invokes the program.
-list-events
List profiling events supported by the system.
-shutdown
Shut down the profiling interface. You only need to use this option in rare cases when a
profiling run was interrupted and OProfile was not shut down properly.
Predefined Performance Data Collection Options
-allcache
Profile instruction, data, and branch cache misses
-dcache
Profile various sources of data cache misses
-imisses
Profile instruction cache-related misses.
-hwtime <millisecs>
Provide time-based sampling only. Specify the sampling interval in milliseconds.
User-Defined Performance Data Collection Options
-es-function <name>
Set profile events via a shell function.
-event <spec>
Manually add an event profile specification. An event profile specification is an opcontrol
'--event' argument; that is, the event profile specification provided on the command line is
appended to '--event=' and passed as an argument to opcontrol.
-post-function <name>
Execute a shell function after profiling is complete.
PGI Profiler User Guide
59
pgcollect Reference
9.6.4. Defining Custom Event Specifications
The pgcollect '-event=EVENTSPEC' options are accumulated and used to specify
events to be measured. For more information about these events, refer to the opcontrol man
page.
x64 processors provide numerous event counters that measure the usage of a variety of processor
resources. Not all processors support the same set of counters. To see which counters are
supported on a given system, use the following command:
pgcollect -list-events
The output of this command also provides information on event masks (the hex value in the event
specification) and minimum overflow values.
Here are two examples of shell functions providing event specifications to pgcollect. These
functions would be implemented in a .pgoprun file:
Custom Event Example 1
This function specifies the events needed to calculate cycles per instruction
(CPU_CLK_UNHALTED / RETIRED_INSTRUCTIONS). The fewer cycles used per
instruction, the more efficient a program is.
cpi_data () {
event[${#event[@]}]=--event=CPU_CLK_UNHALTED:500000:0x00:0:1
event[${#event[@]}]=--event=RETIRED_INSTRUCTIONS:500000:0x00:0:1
}
To use these events, invoke pgcollect with the following arguments:
-es-function cpi_data
Custom Event Example 2
This function specifies events needed to determine memory bandwidth:
mem_bw_data () {
event[${#event[@]}]=--event=CPU_CLK_UNHALTED:500000:0x00:0:1
event[${#event[@]}]=--event=SYSTEM_READ_RESPONSES:500000:0x07:0:1
event[${#event[@]}]=--event=QUADWORD_WRITE_TRANSFERS:500000:0x00:0:1
event[${#event[@]}]=--event=DRAM_ACCESSES:500000:0x07}:0:1
}
To use these events, invoke pgcollect with the following arguments:
-es-function mem_bw_data
9.7. OpenACC and CUDA Fortran Profiling
If you are profiling a program that uses the PGI Accelerator model or CUDA Fortran,
pgcollect automatically collects information for you.
PGI Profiler User Guide
60
pgcollect Reference
9.7.1. OpenACC Profiling
pgcollect automatically collects and includes performance information for the PGI
Accelerator model programs in the profile output for the program.
Inclusion of the accelerator performance information in the program’s profile output occurs for both timebased sampling and, on Linux, for event-based sampling.
9.7.2. CUDA Fortran Program Profiling
If you are profiling a program that uses CUDA Fortran kernels running on a GPU, pgcollect
-cuda collects performance data from CUDA-enabled GPUs and includes it in the profile output
for the program. The syntax for this command option is:
-cuda[=gmem|branch|cfg:<cfgpath>|cc13|cc20|list]
The sub-options modify the behavior of pgcollect -cuda as described here:
branch
Collect branching and warp statistics.
cc13
Use counters for compute capability 1.3. [default]
ccnm
Use counters for compute capability n.m.
Tip Use pgcollect -help to see which compute capabilities your system supports.
cfg:<cfgpath>
Specify <cfgpath> as CUDA profile config file.
gmem
Collect global memory access statistics.
list
List CUDA event names available for use in profile config file.
9.7.3. Performance Tip
On some Linux systems, initialization of the CUDA driver for accelerator hardware that is in a
power-save state can take a significant amount of time. You can avoid this delay in one of these
ways:
‣
Run the pgcudainit program in the background, which keeps the GPU powered on and
significantly reduces initialization time for subsequent programs. For more information on
this approach, refer to the Using an Accelerator section of the PGI Compiler User‘s Guide.
PGI Profiler User Guide
61
pgcollect Reference
‣
Use the pgcollect option –cudainit to eliminate much of the initialization overhead and to
provide a more accurate profile.
pgcollect -time -cudainit myaccelprog
In release 10.5, the option –cudainit was called –accinit. These two options have
exactly the same functionality.
PGI Profiler User Guide
62
Notice
ALL NVIDIA DESIGN SPECIFICATIONS, REFERENCE BOARDS, FILES, DRAWINGS,
DIAGNOSTICS, LISTS, AND OTHER DOCUMENTS (TOGETHER AND SEPARATELY,
"MATERIALS") ARE BEING PROVIDED "AS IS." NVIDIA MAKES NO WARRANTIES,
EXPRESSED, IMPLIED, STATUTORY, OR OTHERWISE WITH RESPECT TO THE MATERIALS,
AND EXPRESSLY DISCLAIMS ALL IMPLIED WARRANTIES OF NONINFRINGEMENT,
MERCHANTABILITY, AND FITNESS FOR A PARTICULAR PURPOSE.
Information furnished is believed to be accurate and reliable. However, NVIDIA Corporation assumes
no responsibility for the consequences of use of such information or for any infringement of patents
or other rights of third parties that may result from its use. No license is granted by implication of
otherwise under any patent rights of NVIDIA Corporation. Specifications mentioned in this publication
are subject to change without notice. This publication supersedes and replaces all other information
previously supplied. NVIDIA Corporation products are not authorized as critical components in life
support devices or systems without express written approval of NVIDIA Corporation.
Trademarks
PGI Workstation, PGI Server, PGI Accelerator, PGF95, PGF90, PGFORTRAN, and PGI Unified
Binary are trademarks; and PGI, PGHPF, PGF77, PGCC, PGC++, PGI Visual Fortran, PVF, PGI CDK,
Cluster Development Kit, PGPROF, PGDBG, and The Portland Group are registered trademarks of
NVIDIA Corporation in the U.S. and other countries. Other company and product names may be
trademarks of the respective companies with which they are associated.
Copyright
© 2013-2014 NVIDIA Corporation. All rights reserved.