1
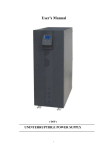
GeneQuant pro
User Manual
English
Deutsch
Français
Español
Italiano
Biochrom Ltd
Certificate No. 890333
Declaration of Conformity
This is to certify that the
GeneQuant pro UV/Vis Spectrophotometer
Part number 80-2114-98 / 99 and 80-2115-04 / 05
Serial number 79000 onwards
manufactured by Biochrom Ltd. conform to the requirements of the following
Directives-:
73/23/EEC & 89/336/EEC
Standards to which conformity is declared
EN 61 010-1: 2001
Safety requirements for electrical equipment for measurement, control and
laboratory use.
EN 61326: 1998
Electrical equipment for measurement, control and laboratory use – EMC
requirements
Dated: 23nd October 2002
Signed:
David Parr
Managing Director
Biochrom Ltd
Postal address
Telephone
Telefax
Biochrom Ltd
22 Cambridge Science Park
Milton Road
Cambridge CB4 0FJ
England
+44 1223 423723
+44 1223 420164
e mail: [email protected]
website: http://www.biochrom.co.uk
Registered in England No: 974213
Registered Office: 22 Cambridge Science Park, Milton Road, Cambridge CB4 4FJ, England.
___________________________________________________________________
Issue 06 - 12/2003
GeneQuant pro, English
1
CONTENTS
Unpacking, Positioning and Installation
Essential Safety Notes
Rear panel
OPERATION
Introduction
Instrument Description
Utility keys
Reading keys
4
5
5
6
6
7
7
8
TECHNIQUES
DNA, RNA and oligonucleotide characterisation
Nucleic Acid Quantification (NAQ)
Nucleic Acid Purity Checks
Use of Background Correction
Protein Determination
Protein Determination at 595, 546 and 562 nm
Protein Determination at 280 nm
Bacterial Cell Culture Measurement
9
9
9
10
11
12
12
12
13
SET UP AND SAMPLE MEASUREMENT
Set up
Sample measurement
DNA, RNA and oligo
Base Sequence
Tm
Protein 595 Assay
Protein 280 Measurement
Bacterial Cell Culture
14
14
14
16
18
19
20
22
22
MESSAGES
23
OUTPUT OF RESULTS
Use with parallel printer
Use with PC
24
24
24
CELLS
Selecting the appropriate cell
Comparison of instrument with other spectrophotometers
Filling cells
Taking measurements
Cleaning cells
Reproducibility using reduced aperture ultramicrovolume and capillary cells
25
25
26
26
26
27
27
___________________________________________________________________
Issue 06 - 12/2003
GeneQuant pro, English
2
ACCESSORIES
27
MAINTENANCE
After Sales Support
Performance Verification Check (Cal Check Utility Key)
Cleaning and General Care of the Instrument
Fuse Replacement
Deuterium Lamp Warranty
Deuterium Lamp Replacement
28
28
28
29
29
29
30
SPECIFICATION
31
___________________________________________________________________
Issue 06 - 12/2003
GeneQuant pro, English
3
Unpacking, Positioning and Installation
•
Inspect the instrument for any signs of damage caused in transit. If any
damage is discovered, inform your supplier immediately.
•
Ensure your proposed installation site conforms to the environmental
conditions for safe operation:
•
•
•
Indoor use only
Temperature 10°C to 40°C
Maximum relative humidity of 80 % up to 31°C decreasing linearly to
50 % at 40°C
•
The instrument must be placed on a hard, flat bench or table that can take its
weight (4 kg) such that air is allowed to circulate freely around the instrument.
•
Ensure that the cooling fan inlets and outlets are not obstructed; position at
least 5 cm from the wall.
•
This equipment must be connected to the power supply with the power cord
supplied and MUST BE EARTHED (GROUNDED). It can be used on 100 240V supplies.
•
Switch on the instrument at the rear panel; the instrument initialises for a few
seconds and then goes through a calibration procedure for a minute or so, until
the display shows “Instrument Ready” together with information relating to
serial number, software version, date and sample number.
•
If this equipment is used in a manner not specified or in environmental
conditions not appropriate for safe operation, the protection provided by the
equipment may be impaired and instrument warranty withdrawn.
___________________________________________________________________
Issue 06 - 12/2003
GeneQuant pro, English
4
Essential Safety Notes
There are a number of warning labels and symbols on your instrument. These are
there to inform you where potential danger exists or particular caution is required.
Before commencing installation, please take time to familiarise yourself with these
symbols and their meaning.
Caution (refer to accompanying documents).
Background colour is yellow, symbol and outline are black.
Rear panel
1
1.
2.
3.
2
3
Multi purpose interface socket
Power supply switch (1 = on, 0 = off)
Power supply socket
___________________________________________________________________
Issue 06 - 12/2003
GeneQuant pro, English
5
OPERATION
Introduction
Your GeneQuant pro RNA/DNA Calculator is a unique, yet simple to use
spectrophotometer designed specifically for molecular biologists working in the life
sciences, including biotechnology and drug discovery research. It has a pulsed
deuterium borosilicate glass lamp for long life. It measures absorbance at 230, 260,
280, 320, 546, 562, 595 and 600 nm, and various relevant parameters are
calculated automatically, and displayed at the touch of a button. The instrument is
ideal for many routine molecular biologist activities:
• it can determine the concentration (in µg/ml, ng/µl, µg/µl, pmol/µl or pmol
phosphate) and purity of nucleic acids (DNA, RNA and oligonucleotides) after
PCR amplification, for hybridisation studies and for quantitating minipreps.
The wavelength at 260 nm is used to calculate quantification, and, together
with those at 230 and 280 nm, for purity checking calculations (via 260/230
and 260/280 ratios). The wavelength at 320 nm is used for background
compensation. A variety of cells, including UV transparent disposable cells, is
now available for convenient sampling, depending on sample concentration,
dilution factor and available sample volume. A nucleic acid survey scan
facility is available so that the spectrum of samples can be viewed.
• it can calculate annealing temperatures for primers prior to PCR upon entry of
the oligonucleotide sequence and concentration together with the total buffer
molarity; this is done using the nearest neighbour thermodynamic data for each
base in the nucleotide chain in relation to its neighbour (Breslauer et al, Proc.
Natl, Acad. Sci. USA, 83, 3746, 1986).
• it can be used for protein determination using the Bradford, Biuret and BCA
protein assays at 595, 546 and 562 nm, respectively; samples are measured
against a stored standard curve and the linear regression results of the straight
line are printed out.
• it can measure OD 600 for bacterial cell culture solutions in order to optimise
induction and harvest times.
To facilitate electronic project archiving of experimental results, all data can be
downloaded directly to Excel using the appropriate interface adapter lead. Results
can also be printed to a standard Centronics parallel printer.
A calibration check filter set is available for periodic testing of the instrument for
GLP purposes (wavelength accuracy, absorbance accuracy and stray light); results
of tests and status of instrument can only be viewed by downloading to PC or
printing as an aid to record keeping.
The user friendly measurement system offers ease of use and ensures a long lamp
lifetime, minimising the cost of ownership of the product.
___________________________________________________________________
Issue 06 - 12/2003
GeneQuant pro, English
6
Instrument Description
The display is a 128 x 64 pixel back lit graphics liquid crystal and the keypad has
28 keys organised into 3 areas; numeric keypad, utility keys and reading keys,
including set up (see inner front cover for diagram). After switch on, initialisation
and the calibration process, the instrument is ready for use (“Instrument Ready”).
Note the following points •
•
•
it may be necessary to set up the instrument for your measurement, particularly
for nucleic acid quantification, where low volume and reduced aperture cells
are used, and for doing a Bradford protein determination
set reference is always required at the start of each measurement type; insert
reference and sample cells so that the light path direction is in the back to front
axis of the instrument
press the appropriate reading or enter key after the sample has been inserted
(length of measurement time is dependent on the number of wavelengths being
read, all wavelengths are read in absorbance mode over a period of approx. 12
seconds)
Utility keys
set up
cal check
select
print
base seq.
Tm
stop
set ref
enter
Enables configuration for the various instrument functions (see Set
up). Pressing set up after the appropriate reading key will activate
the set up process for that mode, with the first option being
highlighted.
Enables instrument to be tested for absorbance accuracy, wavelength
accuracy and stray light with special filters (see Performance
Verification Check)
Enables review of options in the set up parameters and viewing
results for base sequence and nucleic acid modes (if scan option is on)
Outputs data to printer or PC via multi purpose output port
Enables entry of a primer or oligonucleotide base sequence for
calculation of Theoretical Absorbance, Molecular Weight and
conversion factor (see Base Sequence Entry)
Enables determination of Tm (from Abs260) and display of
calculated Tm for an entered base sequence (see Tm)
Behaves as an “escape” key, moving the user back to “Instrument
Ready”
Reads reference values at appropriate wavelengths
Enter / accept option in set up, and acts as reading key
___________________________________________________________________
Issue 06 - 12/2003
GeneQuant pro, English
7
Reading keys
abs
measures absorbances at
calculates
measure on
DNA
measures absorbances at
calculates
measure on
RNA
measures absorbances at
calculates
measure on
oligo
measures absorbances at
calculates
measure on
230, 260, 280, 320, 595, 600
nm
no results are calculated
individual samples
230, 260, 280, 320 nm
DNA concentration
260/280 and 260/230 ratio
individual samples
230, 260, 280, 320 nm
RNA concentration
260/280 and 260/230 ratio
individual samples
230, 260, 280, 320 nm
oligo / primer concentration
260/280 ratio and 260/230 ratio
individual samples
protein 595 assay
measures absorbances at
calculates
measure on
595, 546 or 562 nm
protein concentration
individual samples relative to a
calibration curve of known
standards
protein 280
meas.
measures absorbances at
260, 280, 320 nm
calculates
measure on
protein concentration
individual samples
measures optical density at
calculates
measure on
600 nm
corrected OD
individual samples
cell culture
___________________________________________________________________
Issue 06 - 12/2003
GeneQuant pro, English
8
TECHNIQUES
DNA, RNA and oligonucleotide characterisation
Nucleic Acid Quantification (NAQ)
•
Nucleic acids can be quantified at 260 nm because it is well established that a
solution of DNA or RNA with an optical density of 1.0 has a concentration of
50 or 40 µg/ml, respectively, in a 10 mm pathlength cell. Oligonucleotides, as
a rule of thumb, have a corresponding factor of 33 µg/ml, although this does
vary with base composition; this can be calculated if the base sequence is
known (see Base Sequence in Set up and below).
Concentration = Abs260 * Factor
•
The instrument uses factors 50, 40 and 33 as defaults for DNA, RNA and
oligonucleotides, respectively, and compensates for dilution and use of cells
which do not have 10 mm pathlength; dilution factor and cell pathlength are
entered via set up.
•
If using the ultramicrovolume or capillary reduced aperture cells, ensure they
are correctly filled by carefully following the instructions supplied with the cell
(see Cells) and that the correct pathlength has been entered.
•
Default units are µg/ml, but units of ng/µl, µg/µl, pmol/µl and pmol phosphate
can be selected via set up (the pmol/µl unit is useful for sequencing and PCR
calculations involving primers). The following conversions are used:
1 µg/ml = 1 ng/µl = 0.001 µg/µl
pmol/µl = µg/ml x 1000
MW of oligo
pmol phosphate = nucleotide concentration, µg/ml
315
•
The molecular weight (MW) of a DNA oligonucleotide is calculated from
MW (g/mole) = [(dA x 312.2) + (dC x 288.2) + (dG x 328.2) + (dT x 303.2.)]
+ [(MW counter-ion) x (length of oligo in bases)]
(for RNA oligonucleotide, (dT x 303.2) is replaced by (dU x 298.2)
The MW calculated using this equation must be adjusted for the contribution
of the atoms at the 5’ and 3’ ends of the oligo.
Phosphorylated oligos, add:
[17 + (2 x MW counter-ion)]
Non-phosphorylated oligos, subtract: [61 + (MW counter-ion)]
The MW (g/mole) of the most common oligo counter-ions are Na (sodium,
23.0), K (potassium, 39.1) and TEA (Triethylammonium, 102.2).
___________________________________________________________________
Issue 06 - 12/2003
GeneQuant pro, English
9
Nucleic Acid Purity Checks
•
The extraction of nucleic acids from cells is accompanied by protein, and
extensive purification is required to separate the protein impurity. The
260/280 ratio gives an indication of purity; it is only this, however, and not a
definitive assessment. Pure DNA and RNA preparations have expected ratios
of ≥ 1.8 and ≥ 2.0, respectively; deviations from this indicate the presence of
impurity in the sample, but care must be taken in interpretation of results.
•
The 260 nm reading is taken near the top of a broad peak in the absorbance
spectrum for nucleic acids, whereas the 280 nm reading is taken on a steep
slope (i.e. small changes in wavelength cause large changes in absorbance).
Consequently, small variations in wavelength at 280 nm will have a greater
effect on the 260/280 ratio than will variations at 260 nm. Thus different
instruments of the same and different types may give slightly different ratios
due to variations in wavelength accuracy, but each instrument will give
consistent results within itself.
•
Concentration will also affect 260/280 readings. If a solution is too dilute, the
readings will be at the instrument’s detection limit, and results may vary
because there is less distinction of the 260 peak and 280 slope from the
background absorbance. This is one reason why absorbances should be > 0.05
for accurate measurements.
•
An elevated absorbance at 230 nm can indicate the presence of impurities as
well; 230 nm is near the absorbance maximum of peptide bonds and also
indicates buffer contamination since Tris, EDTA and other buffer salts absorb
at this wavelength. When measuring RNA samples, the 260/230 ratio should
be > 2.0; a ratio lower than this is generally indicative of contamination with
guanidinium thiocyanate, a reagent commonly used in RNA purification and
which absorbs over the 230 - 260 nm range. The nucleic acid survey scan
facility is particularly useful for RNA samples.
•
The instrument can display 260/280 and 260/230 ratios, and compensates for
dilution and use of cells that do not have 10 mm pathlength; dilution factor and
cell pathlength are selected via set up.
___________________________________________________________________
Issue 06 - 12/2003
GeneQuant pro, English
10
Use of Background Correction
•
Background correction at a wavelength totally separate from the nucleic acid
and protein peaks at 260 and 280 nm, respectively, is sometimes used to
compensate for the effects of background absorbance. The wavelength used is
320 nm and it can allow for the effects of turbidity, high absorbance buffer
solution and the use of reduced aperture cells. The instrument can use
background correction; its use is selected via set up.
•
If it is used, different results will be obtained to when it is not used because
Abs320 is subtracted from Abs260 and Abs280 prior to use in equations:
Concentration = (Abs 260 - Abs 320) * Factor
Abs ratio = (Abs 260 - Abs 320) / (Abs 280 - Abs 320)
Abs ratio = (Abs 260 - Abs 320) / (Abs 230 - Abs 320)
•
If your laboratory has not used background correction before, set this option to
NO.
•
The use of background correction can remove variability due to handling
effects if the capillary cell or ultramicrovolume cell is being used (see Cells).
Spectral scan of nucleic acid (obtained using SWIFT software)
Note:
• absorbance maximum near 260 nm and absorbance minimum near 230 nm
• flat peak near 260 nm and steep slope at 280 nm
• very little absorbance at 320 nm
___________________________________________________________________
Issue 06 - 12/2003
GeneQuant pro, English
11
Protein Determination
Protein Determination at 595, 546 and 562 nm
•
•
•
•
The Bradford method depends on quantitating the binding of a dye, Coomassie
Brilliant Blue, to an unknown protein and comparing this binding to that of
different, known concentrations of a standard protein at 595 nm; this is usually
BSA, bovine serum albumin. The Biuret method depends on reaction between
Cupric ions and peptide bonds in an alkali solution, resulting in the formation
of a complex absorbing at 546 nm. The BCA method also depends on reaction
between Cupric ions and peptide bonds, but in addition combines this reaction
with the detection of Cuprous ions using bicinchoninic acid (BCA), giving an
absorbance maximum at 562 nm. The BCA process is less sensitive to the
presence of detergents used to break down cell walls.
Detailed protocols are supplied with these assay kits, and must be closely
followed to ensure accurate results are obtained. Due to the low lamp energy at
546 - 595 nm, absorbances greater than 2.000 cannot be measured.
The use of plastic disposable cells is recommended. To include the zero
concentration standard include it in the number of standards to be entered and
enter 0.00 for concentration; use this when required to enter standard 1. If
using duplicates, enter the same concentration twice; 2 duplicates of 3 different
concentration equals 6 standards. Set reference on water.
A linear regression analysis of the calibration standard data points is
calculated; the result, together with the correlation coefficient, is printed out.
A correlation coefficient of between 0.95 and 1.00 indicates a good straight
line.
Protein Determination at 280 nm
•
•
•
Protein can be determined in the near UV at 280 nm due to absorption by
tyrosine, tryptophan and phenylalanine amino acids; Abs 280 varies greatly for
different proteins due to their amino acid content, and consequently the
specific absorption value for a particular protein must be determined.
The presence of nucleic acid in the protein solution can have a significant
effect due to strong nucleotide absorbance at 280 nm. To compensate for this
by measuring Abs 260, the equation of Christian and Warburg for the protein
crystalline yeast enolase (Biochemische Zeitung 310, 384 (1941)) can be
applied:
Protein (mg/ml) = 1.55 * Abs 280 - 0.76 * Abs 260
or, Protein conc. = (Factor 1 * Abs 280) - (Factor 2 * Abs 260)
This equation can be applied to other proteins if the corresponding factors are
known. The instrument can determine protein concentration at 280 nm and
___________________________________________________________________
Issue 06 - 12/2003
GeneQuant pro, English
12
•
•
•
uses the above equation as default; the factors can be changed, and the use of
background correction at 320 nm is optional (via set up).
To customise the equation for a particular protein, the absorbances at 260 and
280 nm should be determined at known protein concentrations to generate
simple simultaneous equations; solving these provides the two coefficients. In
cases where Factor 2 is found to be negative, it should be set to zero since it
means there is no contribution to the protein concentration due to absorbance
at 260 nm.
Set Factor 2 = 0.00 for direct λ280 UV protein measurement; Factor 1 is based
on the extinction coefficient of the protein. If BSA (bovine serum albumin) is
an acceptable standard, setting Factor 1 = 1.115 will give linear results from 0
to 0.8 mg/ml protein.
Protein (mg/ml) = 1.115 * Abs 280
Rapid measurements such as this at Abs 280 are particularly useful after
isolation of proteins and peptides from mixtures using spin and HiTrap
columns by centrifuge and gravity, respectively.
Bacterial Cell Culture Measurement
•
Bacterial cell cultures are routinely grown to an OD 600 of approx. 0.4 prior to
induction or harvesting. A linear relationship exists between cell number
(density) and OD 600 up to approx. 0.600 OD.
• It is important to note that for turbid samples such as cell cultures, the light
intensity measured is the proportion of the scattered light reaching the
detector, and not the result of molecular absorption. The amount of scatter is
affected by the optics of the system (distance between the cell holder and
instrument exit slit, geometry of this slit and the monochromator optics).
Different spectrophotometer types therefore give different responses for the
same turbid sample; to compare results, they must be normalised using
calibration curves.
• A calibration curve can be determined by comparing measured OD to expected
OD. Expected OD is determined by counting cell number using an alternative
technique (for example microscope slide method) and converting to OD using
the rule of thumb that 1 OD 600 = 8 x 10⁸ cells/ml for E. Coli.
• GeneQuant pro has much smaller optics than most conventional
spectrophotometers, and more scattered light is transmitted through to the
detector resulting in lower than expected OD 600 values. Results obtained by
comparing measured OD 600 with expected OD 600 (see above) indicate that a
correction factor of 2.0 is required to make the data comparable to larger
instruments; this factor is included as a default value in set up.
• The use of 10mm pathlength disposable cells is recommended for optical
density measurements of cell culture solutions; to prevent the suspension
settling too quickly and giving an OD that changes with time, glycerol should
be added to the sample.
___________________________________________________________________
Issue 06 - 12/2003
GeneQuant pro, English
13
SET UP AND SAMPLE MEASUREMENT
Set up
•
•
•
For instrument set up, press “set up”. Press the appropriate “reading key”
followed by the “set up” key to access relevant options (there is no set up for
absorbance).
Press “select” and “enter” to work through the various options.
Press "stop” at any time to return to Instrument Ready status or to go back a
level.
Day
Month
Year
Sample No.
Key in date (adjust daily)
Select appropriate month
Key in year.
Key in required number (increments automatically, default is 1)
Output Mode
Survey Scan
Language
Select output to Printer (standard Centronics parallel lead
required), Serial (a special serial lead is required for connection
to PC) or None
Automatic output of reading key results to Printer or PC; print
key is disabled. Select On or Off
Select On, Off or Print; relevant to Nucleic Acid modes only
Select English, German, French, Spanish or Italian
Use Date
Key Click
Select On or Off; off means that date will not be printed
Select On or Off
AutoPrint
Sample measurement
•
•
•
•
Press “reading” key to access the mode, then “set ref” key to set reference
• Measurements are taken at all relevant wavelengths, and displayed as
0.000 values. A “Starting Lamp” message is displayed prior to
measurement.
Press “reading” key again, or “enter”, in order to make readings.
• Measurements are taken at all relevant wavelengths, and actual absorbance
values are displayed together with the results of calculations. A “Starting
Lamp” message is displayed prior to measurement.
Sample number is always displayed; reset using set up.
After measurement, press “print” to obtain a print out comprising header,
selected set up options, absorbance readings (as appropriate) and the various
calculated results (as appropriate).
___________________________________________________________________
Issue 06 - 12/2003
GeneQuant pro, English
14
•
If Autoprint is on, results for reading keys only will be output
automatically; use of the print key is disabled.
___________________________________________________________________
Issue 06 - 12/2003
GeneQuant pro, English
15
DNA, RNA and oligo
Refer to Techniques for further information.
Pathlength
Units
Use 320nm
Dilution Factor
Insert sample
oligo only
Default Factor
Calc Factor
Use Default
Insert sample
Select 10, 5, 2, 1 or 0.5mm
Select required concentration units from µg/ml, ng/µl, µg/µ, pmol/µl,
pmol phosphate. pmol/µl is only valid for oligonucleotides, and
requires base sequence entry in order to be calculated
Select yes or no
Key in the dilution factor for the concentration calculation, range 1 1000
Insert reference and press “set ref”
Insert sample and press enter or “DNA”/“RNA” as appropriate.
The absorbances are measured and displayed together with the
260/230 and 260/280 ratios and the concentration
If the sample is too dilute to give reproducible results, the
concentration is displayed as “invalid”
Press “stop” to exit
Default factor of 33 µg/ml. This can be changed, for example to 37
for ssDNA, if required
Display shows the conversion factor (µg/ml) if base sequence has been
entered
Select no if calculated factor is to be used; if yes, default factor is used
Insert reference and press “set ref”
Insert sample and press enter or “oligo”
The absorbances are measured and displayed together with the
260/230 and 260/280 ratios and the concentration
Press “stop” to exit
Survey Scan On
• Survey scan is over the range 220 – 330 nm, and takes about 10 seconds.
•
•
•
Lines on the graph indicate 230, 260, 280 and 320 nm.
After the scan is complete, results are displayed; use “select” to view the
graph.
Press “set up” to change absorbance scaling of graph (use “select” and “enter”
to choose between 0.1, 0.2, 0.5, 1.0, 2.0, 2.5 and Autoscale).
___________________________________________________________________
Issue 06 - 12/2003
GeneQuant pro, English
16
Examples of output:
DNA determination
Date:
22 May 2000
Name: ……………………
Factor
:
Units
:
Pathlength
:
Dilution Factor :
Use 320 nm
:
50.0
µg/ml
10mm
1
No
No. 230nm 260nm 280nm 320nm 260/280 260/230 Conc.
1
0.230 0.471 0.255 ----1.850
2.045 23.5
Oligonucleotide determination
Date:
22 May 2000
Name: ……………………
Dflt Factor
Units
Pathlength
Dilution
Use 320 nm
:
:
:
:
:
33.0
µg/ml
10mm
1
No
No. 230nm 260nm 280nm 320nm 260/280 260/230 Conc.
1
0.168- 0.325 0.183 ----1.780
1.934
10.7
___________________________________________________________________
Issue 06 - 12/2003
GeneQuant pro, English
17
Base Sequence
Refer to Techniques for further information.
Base Type
Phosphorylated?
Counter Ion
Select DNA or RNA
Select Yes or No
Select Na (sodium), K (potassium), TEA (triethylammonium)
or other counter ion
Enter Molecular Weight of the counter ion being used
Press “enter” to initiate base sequence entry facility for
oligonucleotide or primer; press A, C, G, T/U keys as
appropriate; minimum 10, maximum 64 mer.
Press the “delete” to remove the last base entered, and
“cancel” to remove a base sequence (press “select” to change
from yes or no).
Press “select” to display the parameters calculated from the
base sequence calculations:
Display shows theoretical absorbance (in units of AU/µmole)
Display shows molecular weight of entered base sequence and
counter ions, including corrections for phosphorylation; this
value is used in the calculation of concentration in pmol/µl and
the conversion factor
Display shows the conversion factor (µg/ml) of entered base
sequence; calculated from MW divided by Theor Abs
Other
Theor Abs
Calc MW
Calc Factor
Example of output:
base sequence
Date:
22 May 2000
Name:………………..
AGC,AGC,AGC,AGC,AGC
Base type
:
DNA
Phosphorylated? :
Yes
Counter Ion
:
Na
Theor Abs
:
149.1
Calc MW
:
5051
Calc Factor
:
33.9
___________________________________________________________________
Issue 06 - 12/2003
GeneQuant pro, English
18
Tm
Refer to Techniques for further information; a minimum base sequence of 10 mer
needs to have been entered.
Primer Conc.
Buffer Molarity
Calculated Tm
Insert sample
Key in concentration of primer, range 1.0 – 100.0 pmol/µl
Key in molarity of salts in hybridisation solution, range 0.1 10.0
Display shows Tm calculated using the nearest neighbour
method applied to the entered base sequence and the primer
concentration and the salts molarity entered above.
Insert reference and press “set ref”
Insert sample and press enter or “Tm
The melting temperature based upon the oligonucleotide
concentration actually measured in the sample is displayed;
this is done by applying the nearest neighbour method to the
entered base sequence, and uses the salts molarity entered
above.
Press “stop” to exit
Example of output:
Tm
Date:
22 May 2000
Name:………………..
Base Sequence
AGC,AGC,AGC,AGC,AGC
Phosphorylated : Yes
Counter Ion
: Na
Buffer Molarity : 0.100
Primer Conc.
: 1.000
Calculated Tm : 57.0 degC
No.
1
260nm
0.123
Measured Tm
57.8
___________________________________________________________________
Issue 06 - 12/2003
GeneQuant pro, English
19
Protein 595 Assay
Refer to Techniques for further information.
Method
No of standards
Pathlength
Units
New standards
Standard 1
Standard 2
Insert sample
Select Bradford, Biuret or BCA
The selected method becomes the default.
Key in the number of standards, range 3 - 27
Select 10, 5, 2, 1 or 0.5 mm
Select µg/ml, mg/ml, µg
Select Yes or No (appears only if no method has been entered)
If No, last standards entered are used.
If Yes, insert reference and press “set ref”
Key in the concentration of the first standard, range 0.0 – 1000.0
Insert Standard 1 and press “enter”
The absorbance is measured and displayed together with the
concentration of the standard. Press “enter”.
Key in the concentration of the next standard, range 0.0 –
1000.0
Insert Standard 2 and press “enter”
The absorbance is measured and displayed together with the
concentration of the standard. Press “enter”.
Repeat procedure until all standards have been measured
The standard curve details (slope, correlation coefficient and
intercept) are displayed
Insert reference and press “set ref”
Insert sample and press “enter”.
The absorbance is measured and displayed together with the
concentration of the sample relative to the standard curve.
Repeat procedure until all samples have been measured
Press “stop” to exit
___________________________________________________________________
Issue 06 - 12/2003
GeneQuant pro, English
20
Example of output:
protein 595
Date:
22 May 2000
Name: ……………….
Method
:
No. of standards 6
No.
Abs.
1
0.693
2
0.842
3
0.934
4
1.026
5
1.150
6
1.285
Conc.
0.139
0.278
0.417
0.556
0.650
0.834
Slope
Corr Coeff
Intercept
:
:
:
0.746
0.996
0.593
Abs.
0.995
Conc.
0.520
0.162
No.
1
2
Bradford
___________________________________________________________________
Issue 06 - 12/2003
GeneQuant pro, English
21
Protein 280 Measurement
Refer to Techniques for further information.
Coeff. 1
Key in the factor to be used for 280nm; default is 1.550, range
is 0.01 - 10.00
Key in the factor to be used for 260nm; default is 0.760, range
is 0.00 - 10.00
Select yes or no
Insert reference and press “set ref”
Insert sample and press enter or “protein 280
The absorbances are measured and displayed together with the
calculated concentration
Press “stop” to exit
Coeff. 2
Use 320nm
Insert sample
Example of output:
Protein 280nm Measurement
Date:
22 May 2000
Name:……………..
Coeff 1
Coeff 2
Use 320 nm
No.
1
:
:
:
1.115
0.000
No
260nm 280mn 320nm Conc
0.123 0.275
----0.307
Bacterial Cell Culture
Refer to Techniques for further information.
Factor
Insert sample
Key in the correction factor you have derived from calibration
plot to make results directly comparable with other
spectrophotometers used in your lab; default is 2.0, and is typical
Insert reference and press “set ref”
Insert sample and press enter or “cell culture”.
The OD at 600 nm is measured and displayed together with the
corrected result
Press “stop” to exit
___________________________________________________________________
Issue 06 - 12/2003
GeneQuant pro, English
22
MESSAGES
The following messages may appear during use of the instrument:
> 2.000
Invalid Curve
Protein 595 and Cell Culture readings only valid up to 2.000 A
Standards have not been inserted in corrected order or
absorbance values do not increase sequentially
Solution too dilute For reproducible results, a more concentrated sample or a
longer pathlength cell should be used
Too much light
Sample compartment lid not closed properly
Ref 1 error
Check sample compartment area for blockage
Ref 2 error
Check sample compartment area for blockage
Lamp failure
Lamp failed to strike; switch off and try again. Lamp may need
replacing if symptom persists
Contact your supplier if the messages below, or any other obvious fault messages
appear, and cannot be cleared by re-initialising the instrument:
Lamp too hot
Filter error
Grating error
Fan has failed or air grill is blocked
Filter wheel has not aligned properly
Grating has not aligned properly
___________________________________________________________________
Issue 06 - 12/2003
GeneQuant pro, English
23
OUTPUT OF RESULTS
Use with parallel printer
•
•
•
We recommend the use of the Seiko DPU-414 thermal printer, however, any
Centronics parallel printer can be used together with the appropriate cable. If
using a thermal printer, ensure it is set up to print out in condensed printing
mode (80 characters) so that there is no wrap round (refer to printer user
manual; for the Seiko DPU-414, this is in the DIP SW settings section).
Ensure output to printer is on in the Set-up.
Output is alphanumeric only and automatic when the Print key is pressed, and
a printer is connected and switched on. Umlauts and accents are not printed
out with letters if the instrument is set up to be in German, French, Italian or
Spanish.
The Survey Scan can be printed using the Seiko DPU-414 printer only; ensure
“Survey Scan” in set up is set to Print, as On enables the facility on the
instrument display only.
Use with PC
NOTE: A standard serial interface will not work.
1) Download to Spreadsheet
The serial interface adapter lead (80-2109-02) is required; it is also supplied with
the Spreadsheet Interface Software for direct download to Excel. This macro is
supplied on a floppy disc together with instructions for installation and use.
2) Use with Hyperterminal
The serial interface adapter lead (80-2109-02) is required; ensure output to serial is
on in Set-up. The ASCII stream is output at 19,200 Baud via the 25 way D
connector on the rear panel, and can be picked up by a PC with Windows 3.1
installed. Use the Hyperterminal emulator in Accessories to pick this up (settings
are Handshake None, 19,200 Baud, 1 stop bit, 8 data bits, 0 parity, Comm port
depends on which port the lead is connected to). Output is automatic if the
interface lead is connected to the instrument.
___________________________________________________________________
Issue 06 - 12/2003
GeneQuant pro, English
24
CELLS
Selecting the appropriate cell
The instrument measures absorbance in the range 0.005 to 3.000 using a 10 mm
pathlength cell; in general, spectrophotometers are at their most accurate in the
absorbance range 0.100 to 1.000. The cell should be chosen based on sample
concentration, dilution factor and available sample volume. Readings < 0.05
approach the detection level of the instrument, which decreases reproducibility;
ideally, such levels should be avoided. Use the table below as a guide to selecting
the correct cell. GeneQuant pro has the standard optical height of 15 mm; cells of
8.5 mm optical height require the use of an adapter.
Concentration
range after dilution
(ng/µl) *
5 - 125
10 - 250
100 - 2500 ***
*
**
***
•
•
•
Available
sample
volume (µl)
> 2000
> 500
> 70 µl
> 7 µl
> 3 µl
Suggested cell type
Pathlength
(mm)
Part number
standard
semi-micro
microvolume
ultra microvolume**
capillary
spare capillaries (100)
10
10
10
5
0.5
80-2002-58
80-2002-77
80-2103-69
80-2103-68
80-2104-66
80-2104-67
assuming dsDNA with Abs 260 = 1.0 for 50 µg/ml (= ng/µl) in a 10 mm pathlength cell
this is supplied with a micro sample viewer accessory
note that dilution may not be required for a miniprep / PCR amplification where typical concentrations
are between 50 and 200 ng/µl
The 7 µl ultramicrovolume cell has a minimum detection limit of 2 µg/ml
dsDNA assuming an absorbance of 0.020; this equates to 14 ng dsDNA if 7 µl
of solution is used. This very low level is not sufficient for reproducible
results. Use of background correction is recommended.
The capillary cell has a minimum detection limit of 20 µg/ml dsDNA
assuming an absorbance of 0.020; this equates to 60ng dsDNA if 3 µl of
solution is used. This very low level is not sufficient for reproducible results.
Use of background correction is recommended.
The use of standard 1 mm and 5 mm pathlength cells is not recommended due
to the requirement of a packing piece (not required for the ultra microvolume
and capillary cell described above).
___________________________________________________________________
Issue 06 - 12/2003
GeneQuant pro, English
25
Comparison of instrument with other spectrophotometers
•
•
You must compare like with like, using the same sample with the same cell,
and obtain absorbance measurements on both at the same wavelengths.
GeneQuant pro has a bandwidth of 5 nm, and this should be compared with a
spectrophotometer having the same bandwidth, since this parameter affects
absorbance values.
Filling cells
Ensure cells are always clean and dry before use and between samples
Standard 10 mm pathlength cells
• fill so that the level of the liquid measures at least 20 mm from the cell bottom
Microvolume cell (80-2103-69)
• fill so that the liquid meniscus cannot intercept the light beam - we recommend
at least 70 µl is used
Ultramicrovolume cell (80-2103-68)
• fill so that the liquid meniscus cannot intercept the light beam - we recommend
at least 7 -10 µl is introduced into the pipette fitted with an appropriate tip
•
insert tip into one of the conical openings of the cell and ensure the tip is
pushed in firmly - deliver the sample slowly into the cell while tilting it with
the other conical opening upwards to ensure all air is expelled
• place cell in micro sample viewer and hold up to the light; when viewed
through the eye piece, the 3 X magnification lens enables confirmation that
there are no bubbles or other impediments in the light path
• ensure the faces of the cell are wiped clean
Capillary cell (80-2104-66) and capillaries (80-2104-67)
• dipping the capillary into the solution will normally introduce enough liquid
for measurement
• liquid can be prevented from leaking out using the Cristaseal supplied
Taking measurements
•
Ensure cell pathlength is set to 10 mm (or 5mm for the ultramicrovolume cell,
80-2103-68); ensure cell orientation is always the same
For capillary cells:
• Ensure cell pathlength is set to 0.5 mm
• Place capillary cell holder in sample compartment
• Insert capillary
___________________________________________________________________
Issue 06 - 12/2003
GeneQuant pro, English
26
Cleaning cells
•
•
After use, cells should be cleaned with a dilute alkali (e.g. 0.1 M NaOH) and a
dilute acid (e.g. 0.1 M HCl) wash, followed by rinsing several times with
distilled water. More rigorous cleaning after difficult samples should be
performed with a suitable liquid laboratory glassware detergent (e.g. Decon),
following the manufacturer’s instructions.
The capillary cell can be dismantled for cleaning and removing a broken
capillary by unscrewing the two screws on each side using the tool provided.
Reproducibility using reduced aperture ultramicrovolume and
capillary cells
•
•
•
•
•
Check for correct operation range and sample integrity by inspection of all 4
wavelength readings for nucleic acid measurements
Ensure that set reference is renewed periodically (preferably every 10
consecutive readings)
Ensure background correction at 320 nm is on
Ensure sample dilution is such that sample Abs 260 is greater than 0.100
Ensure cell is scrupulously clean
ACCESSORIES
Deuterium Lamp
Printer Stand
Seiko DPU-414 printer
Parallel interface cable (Centronics)
Interface adapter for serial connection
(includes spreadsheet interface software)
Spare GeneQuant pro User Manual (multi language)
GeneQuant calibration check filter set
Spare dust cover
Basic UV/Visible Spectrophotometry Booklet
80-2109-86
80-2109-96
enquire
80-2071-87
80-2109-02
80-2110-89
80-2109-88
80-2109-13
80-2108-63
___________________________________________________________________
Issue 06 - 12/2003
GeneQuant pro, English
27
MAINTENANCE
After Sales Support
We supply support agreements that help you to fulfil the demands of regulatory
guidelines concerning GLP/GMT:
• Calibration, certification using filters traceable to international standards
• Certificated engineers and calibrated test equipment
• Approved to ISO 9001 standard
Choice of agreement apart from break down coverage can include:
• Preventative maintenance
• Certification
Performance Verification Check (Cal Check Utility Key)
•
•
•
•
Verification of instrument performance is important for Good Laboratory
Practise (GLP) purposes. GLP requires that results obtained in an experiment
can be traced back to an instrument, and that the instrument can be proved to
be working correctly.
Using a calibration check filter set, the instrument can be checked for
absorbance accuracy at 230, 260, 280, 320, 595 and 600nm, wavelength
accuracy at 260 and 280nm and stray light at 260nm.
An accredited service engineer with your supplier should have a set of filters
(secondary standards traceable to NIST), and be able to verify the instrument
performance; a certificate for record keeping will be provided. A calibration
check filter set (part number 80-2109-88) is available for periodic testing of
the instrument to ensure that it is working to specification if you prefer to do it
in house; instructions for carrying this out are provided with the filters.
Observe all necessary precautions if dealing with hazardous samples or
solvents.
___________________________________________________________________
Issue 06 - 12/2003
GeneQuant pro, English
28
Cleaning and General Care of the Instrument
External cleaning
• Switch off the instrument and disconnect the power cord.
• Use a soft damp cloth to clean all external surfaces.
• A mild liquid detergent may be used to remove stubborn marks.
Sample compartment area spillage
• Switch off the instrument and disconnect the power cord.
• The sample area is manufactured from a chemical resistant material. Strong
concentrations of sample, however, may affect the surface and spillages should
be dealt with immediately.
• A small drain hole in the sample area allows excess liquid to drain away onto
the bench or table from under the instrument.
• Use a soft dry cloth to mop out the sample area.
• Reconnect the power supply cord and switch on the instrument.
Fuse Replacement
•
•
•
•
•
Switch off the instrument and disconnect the power supply cord. The fuse
holder can only be opened if the power supply plug has been removed, and is
located between the power input socket and the on/off switch on the back panel
of the instrument; do not touch the power supply socket prongs.
Slide the fuse holder open by pulling at the notch.
Place fuses (1.6AT, 5mm x 20mm, FST) into the fuse holder and slide back
into position.
Reconnect the power supply cord and switch on the instrument.
Fuses are not normally consumed in an instrument’s lifetime. If they blow
repeatedly, contact your supplier.
Deuterium Lamp Warranty
The criterion for lamp replacement under warranty is that it must be less than 36
months old.
___________________________________________________________________
Issue 06 - 12/2003
GeneQuant pro, English
29
Deuterium Lamp Replacement
Replacement lamps are available from your supplier using the part number
80-2109-86, deuterium lamp assembly.
The design of the lamp area is such that users are able to change their own lamps.
No lamp alignment is required as the lamps are pre-aligned at manufacture.
The lamp becomes very hot in use. Ensure it is cool before changing it.
Do not touch the optical surface of the lamp with your fingers (use tissue); if
touched, the area should be cleaned with iso-propanol.
To replace a lamp proceed as follows:
1)
2)
3)
4)
5)
6)
7)
8)
Switch off the instrument and disconnect the power supply cord.
Release the instrument cover by unscrewing the seven screws in the base.
Carefully lift top cover upwards, tilt and place on the right side of the
instrument taking care not to damage the ribbon cables and not to touch any
of the circuitry (in particular the heat sink).
Depress catch “A” and lift connector away from circuit board.
Remove two screws “B”.
Lift deuterium lamp and bracket assembly away from mounting plate.
Place new deuterium lamp assembly into position, locating pins “C” into
holes and slot in mounting plate.
Refit two screws “B” and tighten carefully.
Refit connector “A”, pushing downwards until the catch snaps shut.
Refit the instrument top cover, taking care not to trap the ribbon cable.
Refit the seven screws in the base.
Reconnect the power supply cord and switch the instrument on.
___________________________________________________________________
Issue 06 - 12/2003
GeneQuant pro, English
30
SPECIFICATION
Wavelength range
Monochromator
Wavelength calibration
Spectral bandwidth
Wavelength accuracy
Wavelength reproducibility
Light source
Detector
Photometric range
Photometric linearity
Photometric reproducibility
Stray Light
Digital output
Dimensions
Weight
Power requirements
Safety standard
EMC emissions
EMC immunity
Susceptibility standard
Quality System
Fixed at 230, 260, 280, 320, 546, 562, 595, 600 nm
Survey scan from 220 – 330 nm
Czerny-Turner configuration with 1200 lines/mm
holographic grating
Automatic upon switch on
5 nm
± 1 nm
Better than ± 0.5 nm
Long life borosilicate glass pulsed deuterium lamp
Silicon photodiode
0 to ± 3.000A for 230, 260, 280, 320 nm
0 to ± 2.000A for 546, 562, 595, 600 nm
± 1.0% or ± 0.005A to 3.000A, whichever is the
greater
0.5% of absorbance value
<0.1%T at 280nm using Acetone
Centronics parallel as standard
9 pin serial via interface adapter lead
320 x 400 x 160 mm
4 kg
100-240V AC ± 10%, 50/60Hz, 80VA
EN61010-1
EN 50 081-1 Generic emissions part 1
EN 50 082-1 Generic immunity part 1
IEC 801
Designed and manufactured in accordance with an
ISO 9001 approved quality system
Specifications are measured at a constant ambient temperature and are typical of a
production unit. As part of our policy of continuous development, we reserve the
right to alter specifications without notice.
___________________________________________________________________
Issue 06 - 12/2003
GeneQuant pro, English
31