1
Using the Web Browser Interface
Status Reporting Features
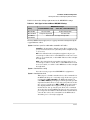
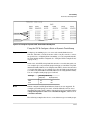
The Status Bar
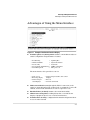
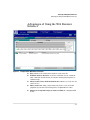
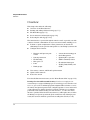
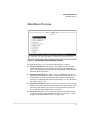
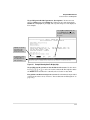
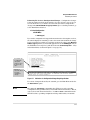
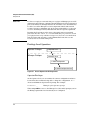
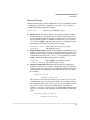
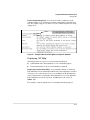
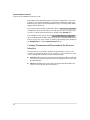
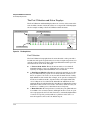
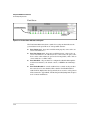
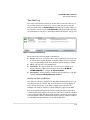
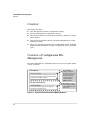
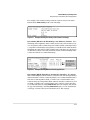
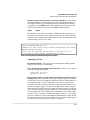
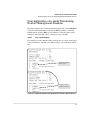
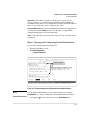
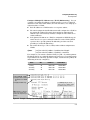
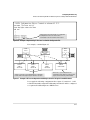
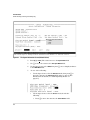
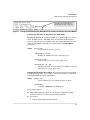
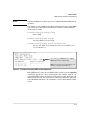
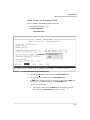
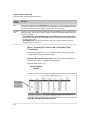
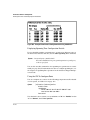
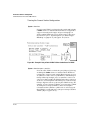
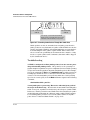
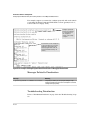
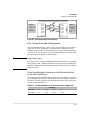
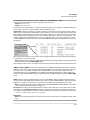
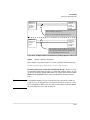
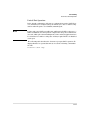
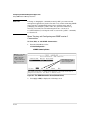
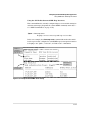
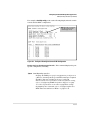
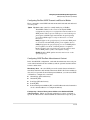
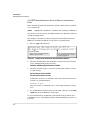
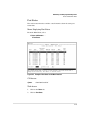
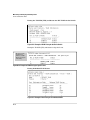
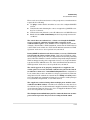
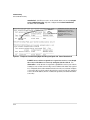
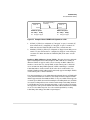
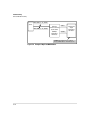
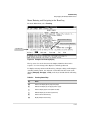
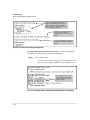
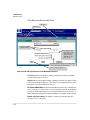
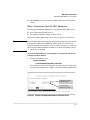
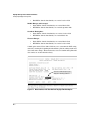
The Status Bar is displayed in the upper left corner of the web browser
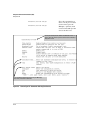
interface screen. Figure 5-15 shows an expanded view of the status bar.
Status Indicator
Most Critical Alert Description
Product Name
Figure 5-15. Example of the Status Bar
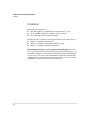
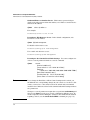
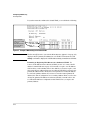
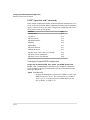
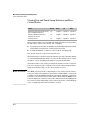
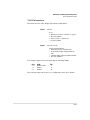
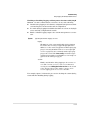
The Status bar consists of four objects:
■
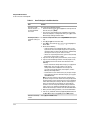
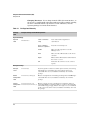
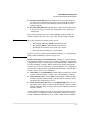
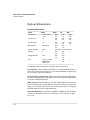
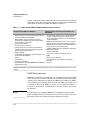
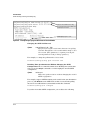
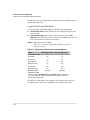
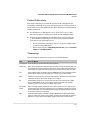
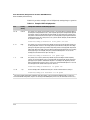
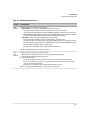
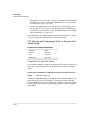
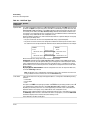
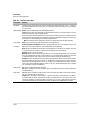
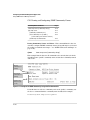
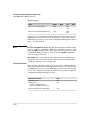
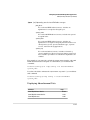
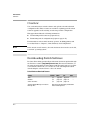
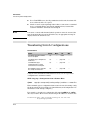
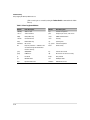
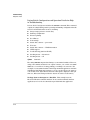
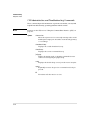
Status Indicator. Indicates, by icon, the severity of the most critical alert
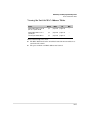
in the current display of the Alert Log. This indicator can be one of three
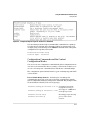
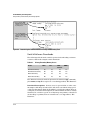
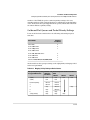
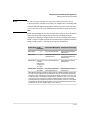
shapes and colors as shown in the following table.
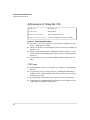
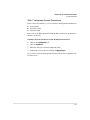
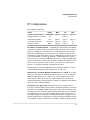
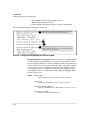
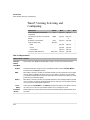
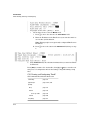
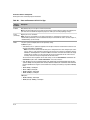
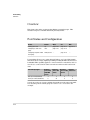
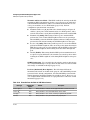
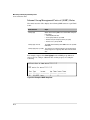
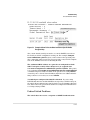
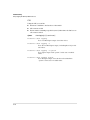
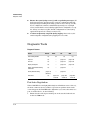
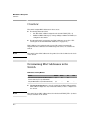
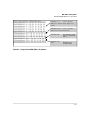
Table 5-1.Status Indicator Key
5-22
Color
Blue
Switch Status
Status Indicator Shape
Normal Activity; "First time installation"
information available in the Alert log.
Green
Normal Activity
Yellow
Warning
Red
Critical
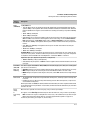
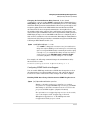
■
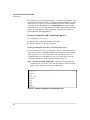
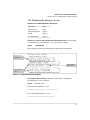
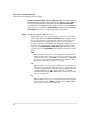
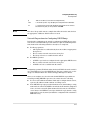
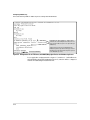
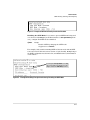
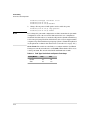
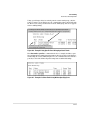
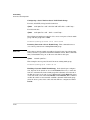
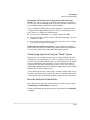
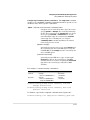
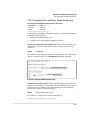
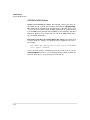
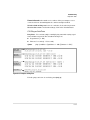
System Name. The name you have configured for the switch by using
Identity screen, system name command, or the switch console System
Information screen.
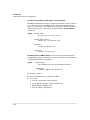
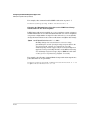
■
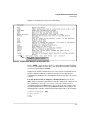
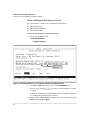
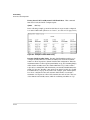
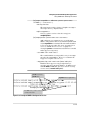
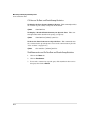
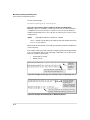
Most Critical Alert Description. A brief description of the earliest,
unacknowledged alert with the current highest severity in the Alert Log,
appearing in the right portion of the Status Bar. In instances where
multiple critical alerts have the same severity level, only the earliest
unacknowledged alert is deployed in the Status bar.